
 Submit a Paper
 Propose a Special lssue
 Open Access
ARTICLE

PD-1 Relevant Genes Predict the Prognosis of Breast Cancer and Their Prediction Effect in Tumor Response to Immunotherapy
1
Guangxi Medical University Cancer Hospital, Nanning, China
2
Department of Thyroid and Breast Surgery, Shenzhen Second People’s Hospital, Shenzhen, China
3
Department of Thyroid and Breast Surgery, Shaoyang Center Hospital, Shaoyang, China
4
Department of Thyroid and Breast Surgery, Liuzhou People’s Hospital, Liuzhou, China
* Corresponding Author: Changyuan Wei. Email:
# Yu Xiao, Jianping Jiang contributed equally to this work
(This article belongs to the Special Issue: Biomarkers for Breast Cancer Diagnosis and Treatment Selection: from Basic Research to Practice)
Oncologie 2022, 24(4), 729-742. https://doi.org/10.32604/oncologie.2022.026118
Received 16 August 2022; Accepted 07 September 2022; Issue published 31 December 2022
 View Full Text
 Download PDF
Abstract
Background: Immunotherapy is becoming a powerful approach in the treatment of breast cancer. However, high response rates in the majority of breast cancer patients have yet to be achieved. Materials and Methods: Based on public data sources, we identified 22 genes that are correlated with PD-1 expression as well as differentially expressed between tumor tissues and normal tissues, and high expression of all the key genes was correlated with a superior survival outcome. Using the least absolute shrinkage and selection operator Cox regression model, a risk score was constructed. Results: A multivariate Cox analysis showed that the constructed risk score was an independent prognostic factor (AUC of risk score: 0.63, HR of risk score: 11.7, C-index: 0.69). Furthermore, an analysis of TILs in the TCGA BRCA cohort identified 28 distinct immune cell types. T lymphocytes and myeloid-derived suppressor cells were enriched in low-risk patients. The risk score was positively correlated with immune checkpoint genes for PD-1, PD-L1, PD-L2, and CTLA4 (P < 0.05). In addition, two independent cohorts validated the prognostic value and the predictive value of the immunotherapy response of the risk score. Conclusions: The risk score demonstrated a stable predictive ability in breast cancer prognosis and a predictive value in tumor response to immunotherapy. The analysis of TILs revealed the correlation between risk score and immune cells, which also helps elucidate the complexity of the relationship between TILs and immunotherapy response.Keywords
Supplementary Material
Supplementary Material FileImmune checkpoint blockade plays a crucial role in cancer therapy, and increasingly is drawing public attention. Emerging clinical trials focusing on immunotherapy in breast cancer have resulted in significant advances. Although most of the trials focused on triple-negative breast cancer (TNBC), such as KEYNOTE-012 and Impassion130, there are several clinical trials that have included immunotherapy in non-TNBC breast cancer, such as KEYNOTE-028 and JAVELIN [1–4].
PD-1/PD-L1 is a key immune checkpoint pathway in cancer. PD-1, also known as CD279 (Cluster of differentiation 279), is an essential immunosuppressive molecule mainly expressed on the surface of activated T cells, which can inhibit the proliferation of T cells. It is also a negative regulator of immune activation and blocks the anti-tumor immune response in the tumor microenvironment (TME) [5]. The PD-1/PD-L1 signaling pathway plays a key role in the immune escape process of tumor occurrence, and therefore provides a good rationale for drug development for tumor immunotherapy. PD-1/PD-L1 inhibitors have become the main focus of tumor immunotherapy research in recent years. PD-1/PD-L1 inhibitors can block the binding between T cell PD-1 and cancer cell PD-L1, relieving immune suppression, restoring the activity of CD8 + T cells, and enhancing the immune response to recognize and kill cancer cells [6]. Nivolumab, Pembrolizumab, Atezolizumab, and other anti-PD-1 or PD-L1 antibodies have been approved by the U.S. Food and Drug Administration for the treatment of tumors including non-small cell lung cancer (NSCLC), melanoma, breast cancer, and stomach cancer [7].
Based on existing literature, immunotherapy for breast cancer, especially PD-1/PD-L1 inhibitors, has a better outcome in TNBC than in non-TNBC. However, prognostic precision is still imprecise, and the response to immunotherapy in breast cancer remains subpar. We aimed to discover the potential molecules that could hold value for the predicting breast cancer prognosis and tumor response to immunotherapy. We identified 22 key genes that were both highly correlated with immune checkpoint PD-1 and that had significant differences in expression between tumor tissues and normal tissues. Based on these 22 key genes, a risk score was constructed. We then analyzed the prognostic value and the correlation between tumor-infiltrating lymphocytes (TILs) and the risk score. Additionally, we further validated that the risk score contributes to immunotherapy response prediction.
2.1 Bioinformatic Data Download
The workflow of this study is shown in Fig. 1. The Cancer Genome Atlas (TCGA) database provided RNA sequencing count values and clinical data from breast cancer patients, including 1097 samples from the breast cancer (BRCA) cohort and 113 normal samples. The breast cancer gene expression dataset GSE42568, along with the matrix file of 104 BRCA samples, was downloaded from the Gene Expression Omnibus [8]. The IMvigor210 dataset (data from a R package “IMvigor210CoreBiologies”), which was from a study investigating the efficacy of pembrolizumab in 348 patients with advanced urothelial cancer, was also included in our study [9].
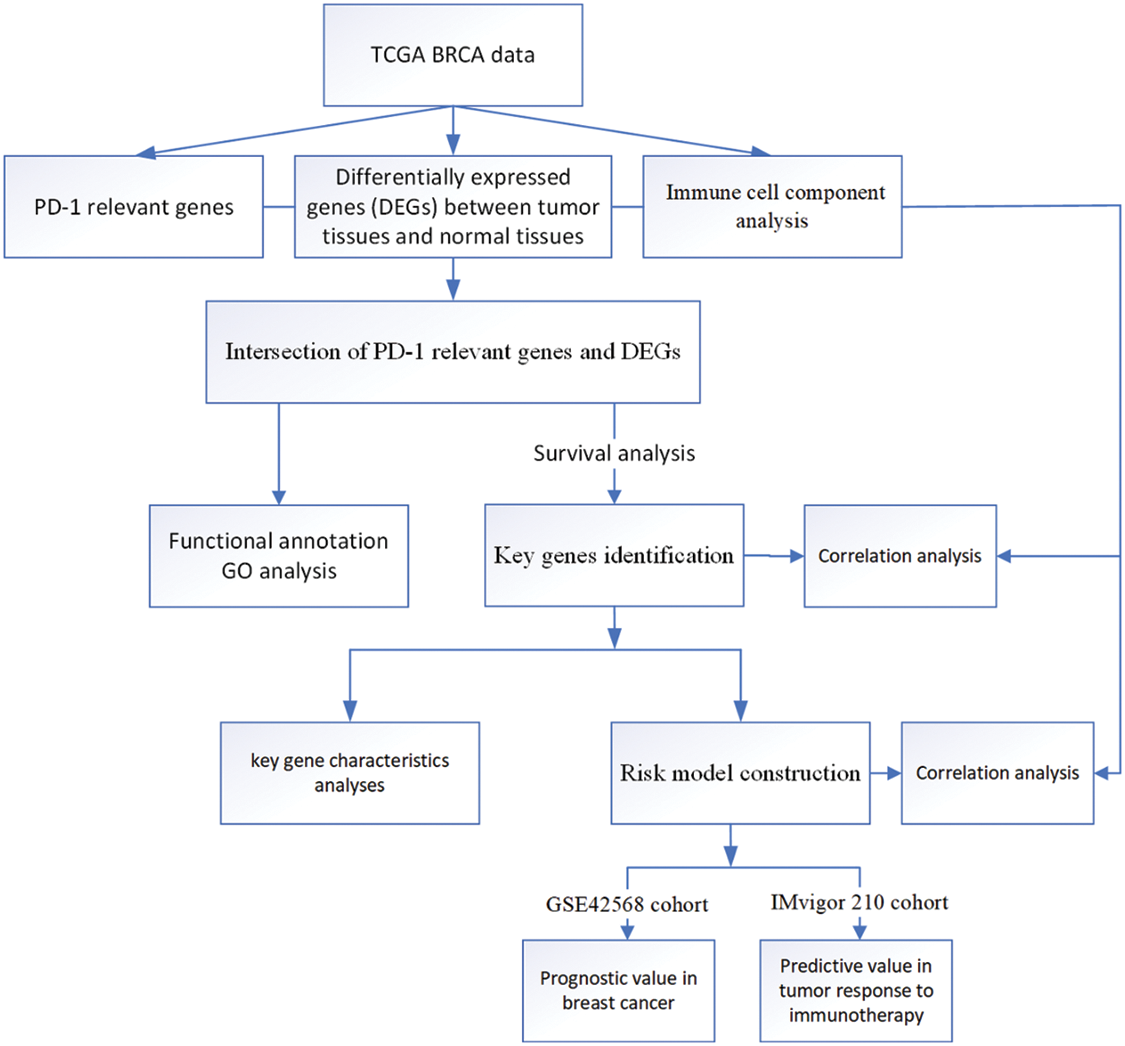
Figure 1: Flow chart of this study
2.2 Identification of PD-1 Relevant and Differentially Expressed Genes (DEGs)
The count values were transformed using log2 (counts + 1), and the correlation between PD-1 and the other protein-coding genes were calculated in the TCGA BRCA dataset with the “stats” R package using the Spearman’s correlation method. The first 500 positively correlated genes and the first 500 negatively correlated genes with a P value < 0.05 were obtained. The “DESeq2” R package was then applied to identify DEGs between tumor tissues and normal tissues satisfying the criteria of P < 0.05 and |logFC| ≥ 2 [10]. Furthermore, an intersection was obtained between PD-1 relevant genes and DEGs.
2.3 Functional Annotation and Selecting Genes with Prognostic Value
To explore the biological processes involved, R package “clusterProfiler” was used to perform gene ontology analysis (GO) for PD-1 relevant genes and DEGs [11]. Data from 418 breast cancer samples with complete clinical information were selected from the TCGA dataset and a survival analysis of the intersecting genes was performed using the Kaplan-Meier method. By setting P < 0.05, genes closely related to PD-1 and with prognostic value were identified.
2.4 Prognostic Model Construction
Twenty-two genes were included for model construction. LASSO Cox regression was used to construct a model for risk scores. Lambda is determined by the minimum mean cross-validated error using the R package “glmnet” [12]. The risk score was then defined as follows.
Risk score =
The “GSVA” R package was used to analyze gene set enrichment in a single-sample analysis to quantify TILs in the CIBERSORT study and to explore the immune cell component in the TME of TCGA BRCA cohort [13,14]. We further predicted tumor purity using the “estimate” R package, and we also predicted the presence of stromal cells and immune cells. In this study, a total of 28 immune cell subtypes were evaluated (details in Results).
2.6 Validation of the Prognostic Value and Predictive Immunotherapy Response Value of the Prognostic Model
To validate the practical value of the risk score model constructed in our study, the GSE42568 cohort and the IMvigor210 cohort with transcriptomic data and complete clinical information with survival follow-up data were included in our study. Here we use the IMvigor 210 cohort to verify the prediction effect of the risk score in tumor response to immunotherapy. Survival differences and the immunotherapy response rate in low-score and high-score groups were analyzed based on the risk score. In the IMvigor210 cohort, the status of the immunotherapy response was assessed as complete response (CR), partial response (PR), stable disease (SD), or progressive disease (PD).
We used the R 4.1.0 software to perform all data processing. The different analyses between groups were conducted using a Kruskal test and Wilcoxon test. The correlation tests were based on a Pearson analysis. The mutation landscape of key genes in this study was explored using the “maftools” R package with the TCGA BRCA cohort. The construction of risk scores for patient outcomes was performed using LASSO regression (setting family = “cox”) and the prognostic value of the risk score constructed in this study was confirmed with a multivariate Cox regression model. All statistical P values were two-sided, with P < 0.05 being considered statistically significant.
3.1 Functional Annotation of PD-1 Relevant Genes and DEGs
In the TCGA BRCA cohort, the top 500 positively correlated genes and the top 500 negatively correlated genes with PD-1 were identified. We then performed a GO analysis using PD-1 relevant genes (Supplementary Tables S1 and S2). A total of 2430 DEGs containing 1525 upregulated and 905 downregulated genes (P < 0.05 and |logFC| ≥ 2) were identified by comparing tumor tissues with normal tissues. In addition, a GO analysis was also performed (Supplementary Tables S3 and S4). The two gene sets had different functional annotation results. PD-1-relevant genes were involved in biological processes, and molecular function was associated with immunity, such as activation and proliferation of immune cells (Fig. 2A). DEGs were mostly involved in biological processes associated with mitosis (Fig. 2B). An intersection of the two gene sets containing 34 upregulated and two downregulated genes were identified, and their different expression patterns in cancer and normal tissues were explored (Figs. 2C–2D).
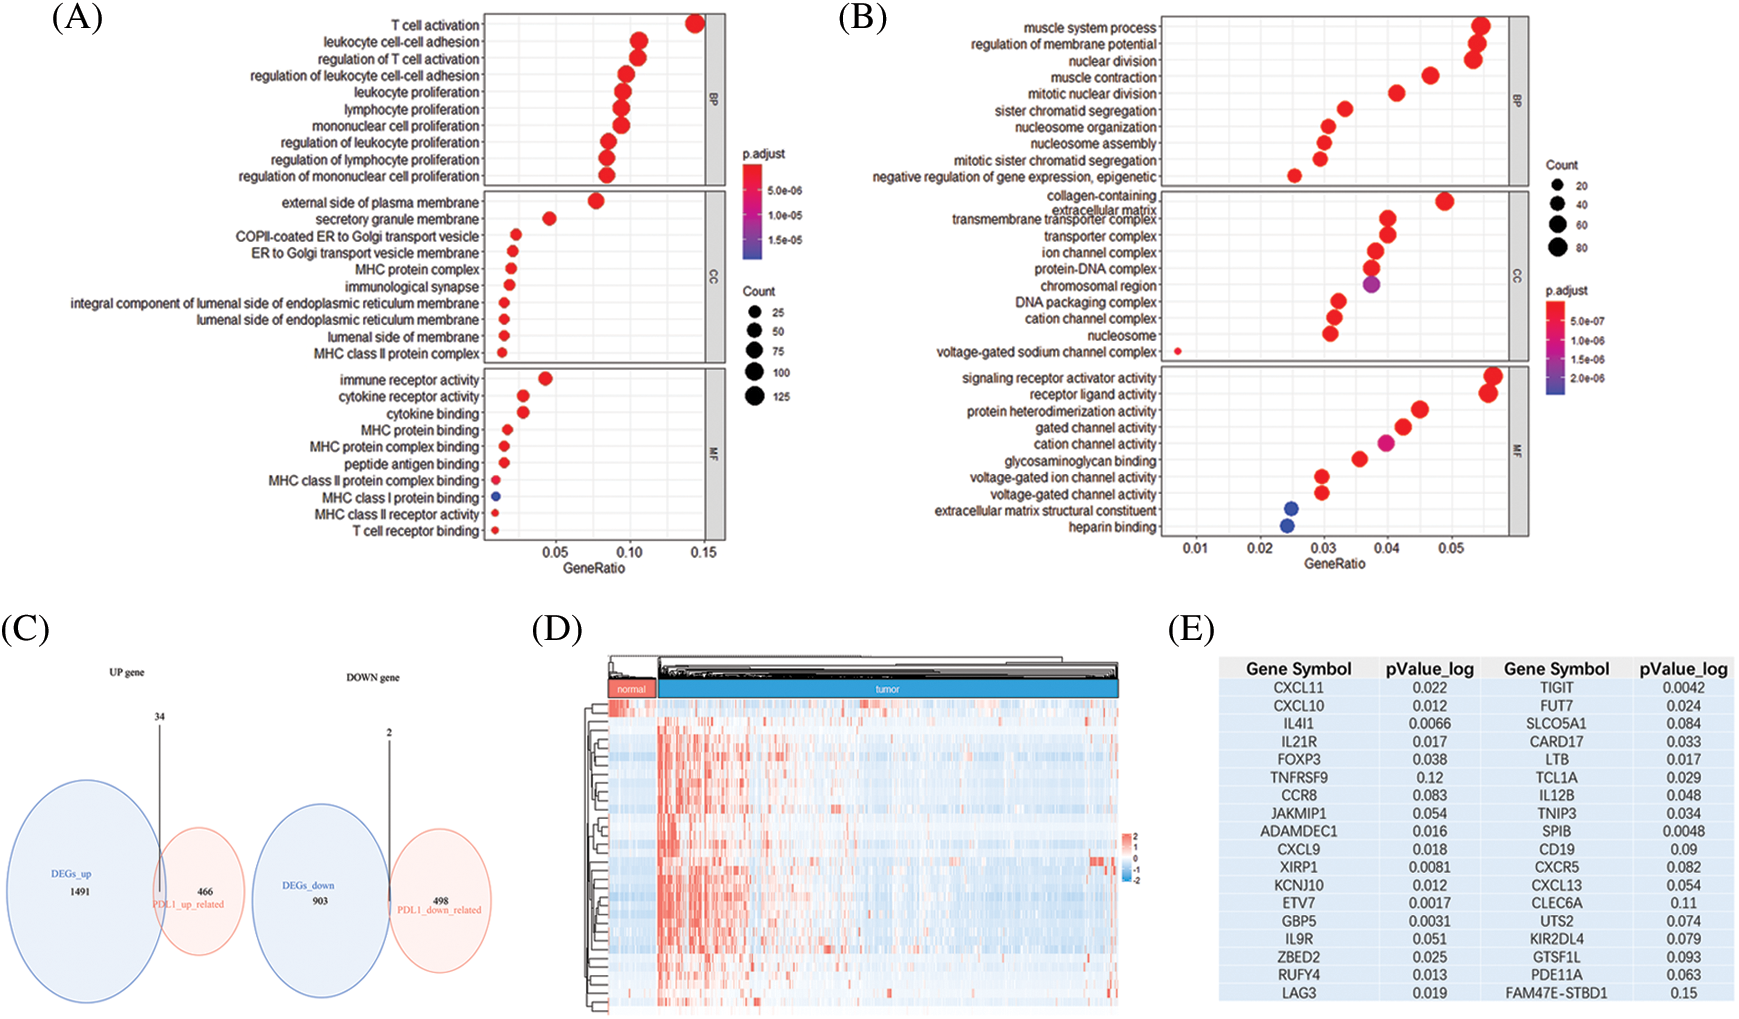
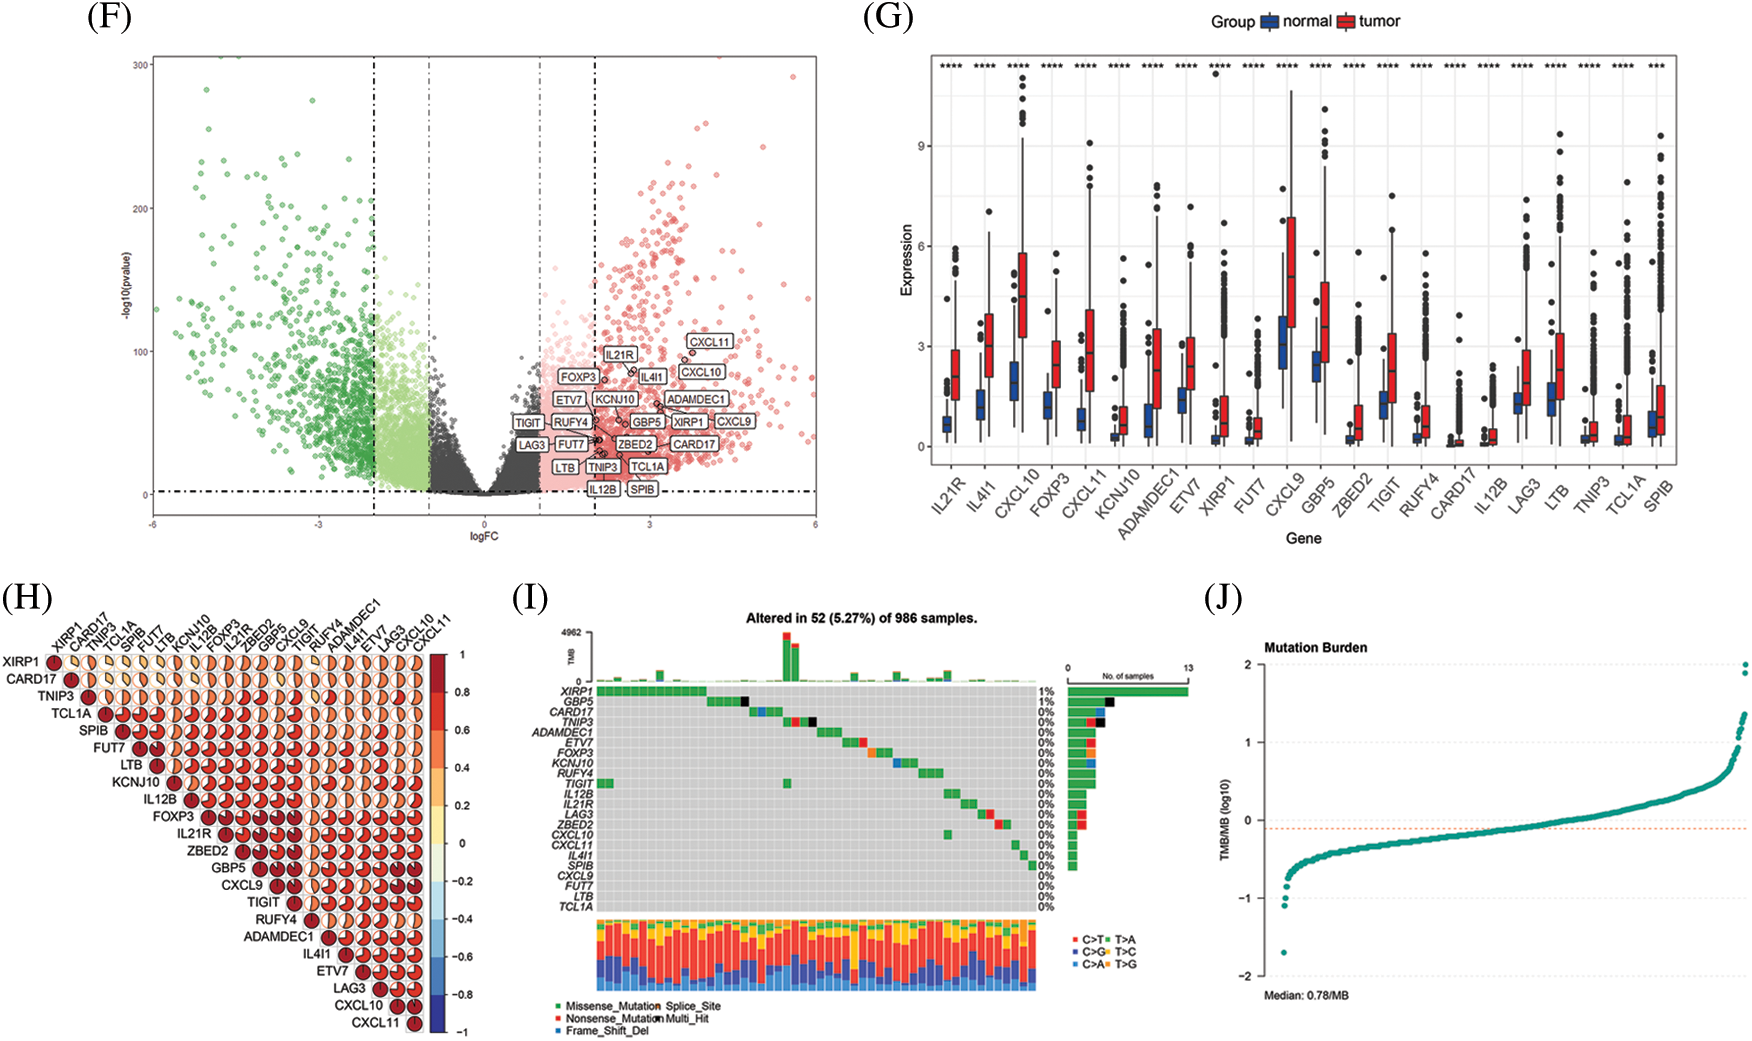
Figure 2: Functional annotation and key gene identification and analyses in TCGA BRCA cohort. (A) GO analysis of genes correlated with PD-1. (B) GO analysis of DEGs between tumor tissues and normal tissues. (C) Intersection of PD-1 related genes and DEGs, resulting in 34 up-regulate genes and 2 down-regulate genes. (D) Heatmap shows the expression pattern of the 36 genes in tumor tissues and normal tissues. (E) Survival analyses of 36 genes, genes with P value < 0.05 were identified. (F) The distribution of 22 key genes presented by volcano plot. (G) The expression of 22 key genes comparing tumor tissues and normal tissues (*P < 0.05; **P < 0.01; ***P < 0.001). (H) Correlation between each of the 22 genes. (I) TMB of the TCGA BRCA cohort and mutations in the 22 key genes. (J) The median of mutation burden is 0.78/MB
3.2 Identification of Key Genes
Using survival analyses, genes with prognostic value were then identified. From the TCGA BRCA cohort, data from a total of 418 patients with completed clinical information were used for survival analyses. Key genes were identified as 22 in total (ADAMDEC1, CARD17, CD19, CXCL9, CXCL10, CXCL11, ETV7, FOXP3, FUT7, GBP5, IL4I1, IL12B, IL21R, KCNJ10, LAG3, LTB, RUFY4, SPIB, TCL1A, TIGIT, TNIP3, and XIRP1) from the intersection of the two gene sets mentioned above, and all of the key genes belonged to the upregulated genes (P < 0.05, Fig. 2E). High expression of all the 22 key genes correlated with a better survival outcome compared to those with low expression (Supplementary Figs. S1–S5). All the key genes were upregulated and highly expressed in tumor tissues (P < 0.05, Figs. 2F–2G). Using Spearman’s correlation analysis, we found a significantly positive correlation between the key genes (Fig. 2H). The mutational landscape of the key genes in BRCA was explored in the TCGA BRCA cohort. A mutation rate with at least one key gene mutated was 5.27%, and was observed among 986 samples. Among the key genes, XIRP1 showed the highest mutation frequency, while CXCL9, FUT7, LTB and TCL1A did not show any mutations in this study. In addition, missense mutations were the main type of mutation, and the median tumor mutation burden in the whole cohort was 0.78 mut/Mb (Figs. 2I–2J).
3.3 Prognostic Model Construction and Correlation with TILs
As the 22 key genes were related with PD-1 and showed significant prognostic value in the context of survival, the LASSO Cox regression model was used to construct a risk score based on the key genes. A lambda value of 0.020 was determined and two key genes, ETV7 and KCNJ10, were crucial to the calculation of risk score (Figs. 3A–3B). The calculation of risk score was as follows:
Figure 3: Model construction and evaluation. (A) LASSO coefficient profiles of the 22 key genes. (B) The tuning parameter log (Lambda/λ) of the 22 key genes was selected to cross-verify the error curve. The vertical lines show the optimal value based on the minimal criterion and 1-se criterion. (C) The risk score divides the cohort into low-risk and high-risk groups. (D) Distribution of patients and death cases are almost all distributed in the high-risk group. (E) Heatmap of clustering analysis shows the expression pattern of the 22 key genes was different in low-risk and high-risk groups. (F) The expression status of the 22 key genes in low-risk and high-risk group, and all the key genes show a high expression in low-risk group (*P < 0.05; **P < 0.01; ***P < 0.001). (G) Kaplan-Meier survival curves of the OS of patients shows a survival advantage in the low-risk group. (H) Multivariate Cox analyses confirm the independent prognostic value of risk score. (I) The nomogram predicts the probability of 36-month and 60-month mortality. (J) The calibration plot of the nomogram predicts the probability of the 3-year and 5-year OS
Risk score = −0.0767248 × exp (ETV7) − 1.0420572 × exp (KCNJ10).
Risk score cutoff was 0.58 calculated using the “survminer” R package and divided the TCGA BRCA cohort into a low-risk group and a high-risk group (patient distribution is in Supplementary Fig. S6). The AUC was drawn and compared between the risk score and age, T stage, N stage, M stage, AJCC tumor stage, and tumor mutation burden (TMB). This comparison showed that the risk score occupied the largest AUC, though no significant differences were identified compared with other factors (AUC of risk score = 0.625, Supplementary Fig. S7 and Table S5). We drew the distribution of the different survival statuses according to the risk score, which demonstrated that almost all the patients in a state of death were distributed in the high-risk group (Figs. 3C–3D). The expression pattern of the 22 key genes in the low-risk and high-risk groups were also distinguished and the expression of all the key genes were higher in the low-risk group than in the high-risk group (P < 0.05, Figs. 2E–2F). More critically, the low-risk group exhibited a favorable outcome in the survival analysis (P < 0.05, Fig. 3G). AJCC tumor stage, age, T stage, N stage, M stage, and risk score were included in a multivariate Cox analysis that showed risk score was an independent predictor of survival (P < 0.05, C-index: 0.69, Fig. 3H). Therefore, we constructed a nomogram that integrated these factors in the multivariate Cox analysis to quantify the predictive value for patient prognosis (Fig. 3I). The calibration curve showed that the predictive result for 3-year and 5-year survival of the nomogram is very close to the ideal predicted value, which confirms that the nomogram has good predictive power (Fig. 3J).
Since the 22 key genes were highly related to PD-1 expression, the correlation between the key genes and immune cells was also explored in this study. The density of TILs was speculated using the “GSVA” R package. We found that activated CD4 + cells, effector memory CD8 + T cells, activated CD8 + T cells, natural killer cells, immature B cells, MDSCs, activated dendritic cells, regulatory T cells, activated B cells, type 1 T helper cells, T follicular helper cells, monocytes, gamma delta T cells, macrophages, type 2 T helper cells, effector memory CD4 + T cells, central memory CD4 + T cells, natural killer cells, type 17 T helper cells, plasmacytoid dendritic cells, CD56-bright natural killer cells, memory B cells, immature dendritic cells and neutrophils showed a higher infiltration in the low-risk groups compared to the high-risk groups. On the other hand, the infiltration of central memory CD8 + T cells, eosinophils, mast cells and CD56-dim natural killer cells were not substantially different between the low-risk and high-risk (Fig. 4A). Subsequently, the risk score was found to be negatively correlated with the infiltration of the immune cells mentioned above (Fig. 4B). Conversely, the 22 key genes were mostly correlated with activated B cells, effector memory CD8 + T cells, type 1 T helper cells, activated CD8 + T cells, immature B cells, activated CD4 + T cells, activated dendritic cells and MDSCs, as shown in the correlation heatmap (Fig. 4C). We then correlated gene expression to the immune checkpoint genes for CTLA4, PD-1, PD-L1 and PD-L2, and the 22 key genes showed a positive correlation with these, sharing the highest correlation with CTLA4 and PD-1 (Fig. 4D). Of interest, the specific risk score range corresponded to particular immune checkpoint genes (Fig. 4E). The presence of stromal/immune cells revealed that the immune score in the low-risk group was higher (Fig. 4F). All of the above results suggest that the low-risk group has a stronger tumor immune response than the high-risk group, which may indicate an enhanced immunotherapy response in the low-risk group.
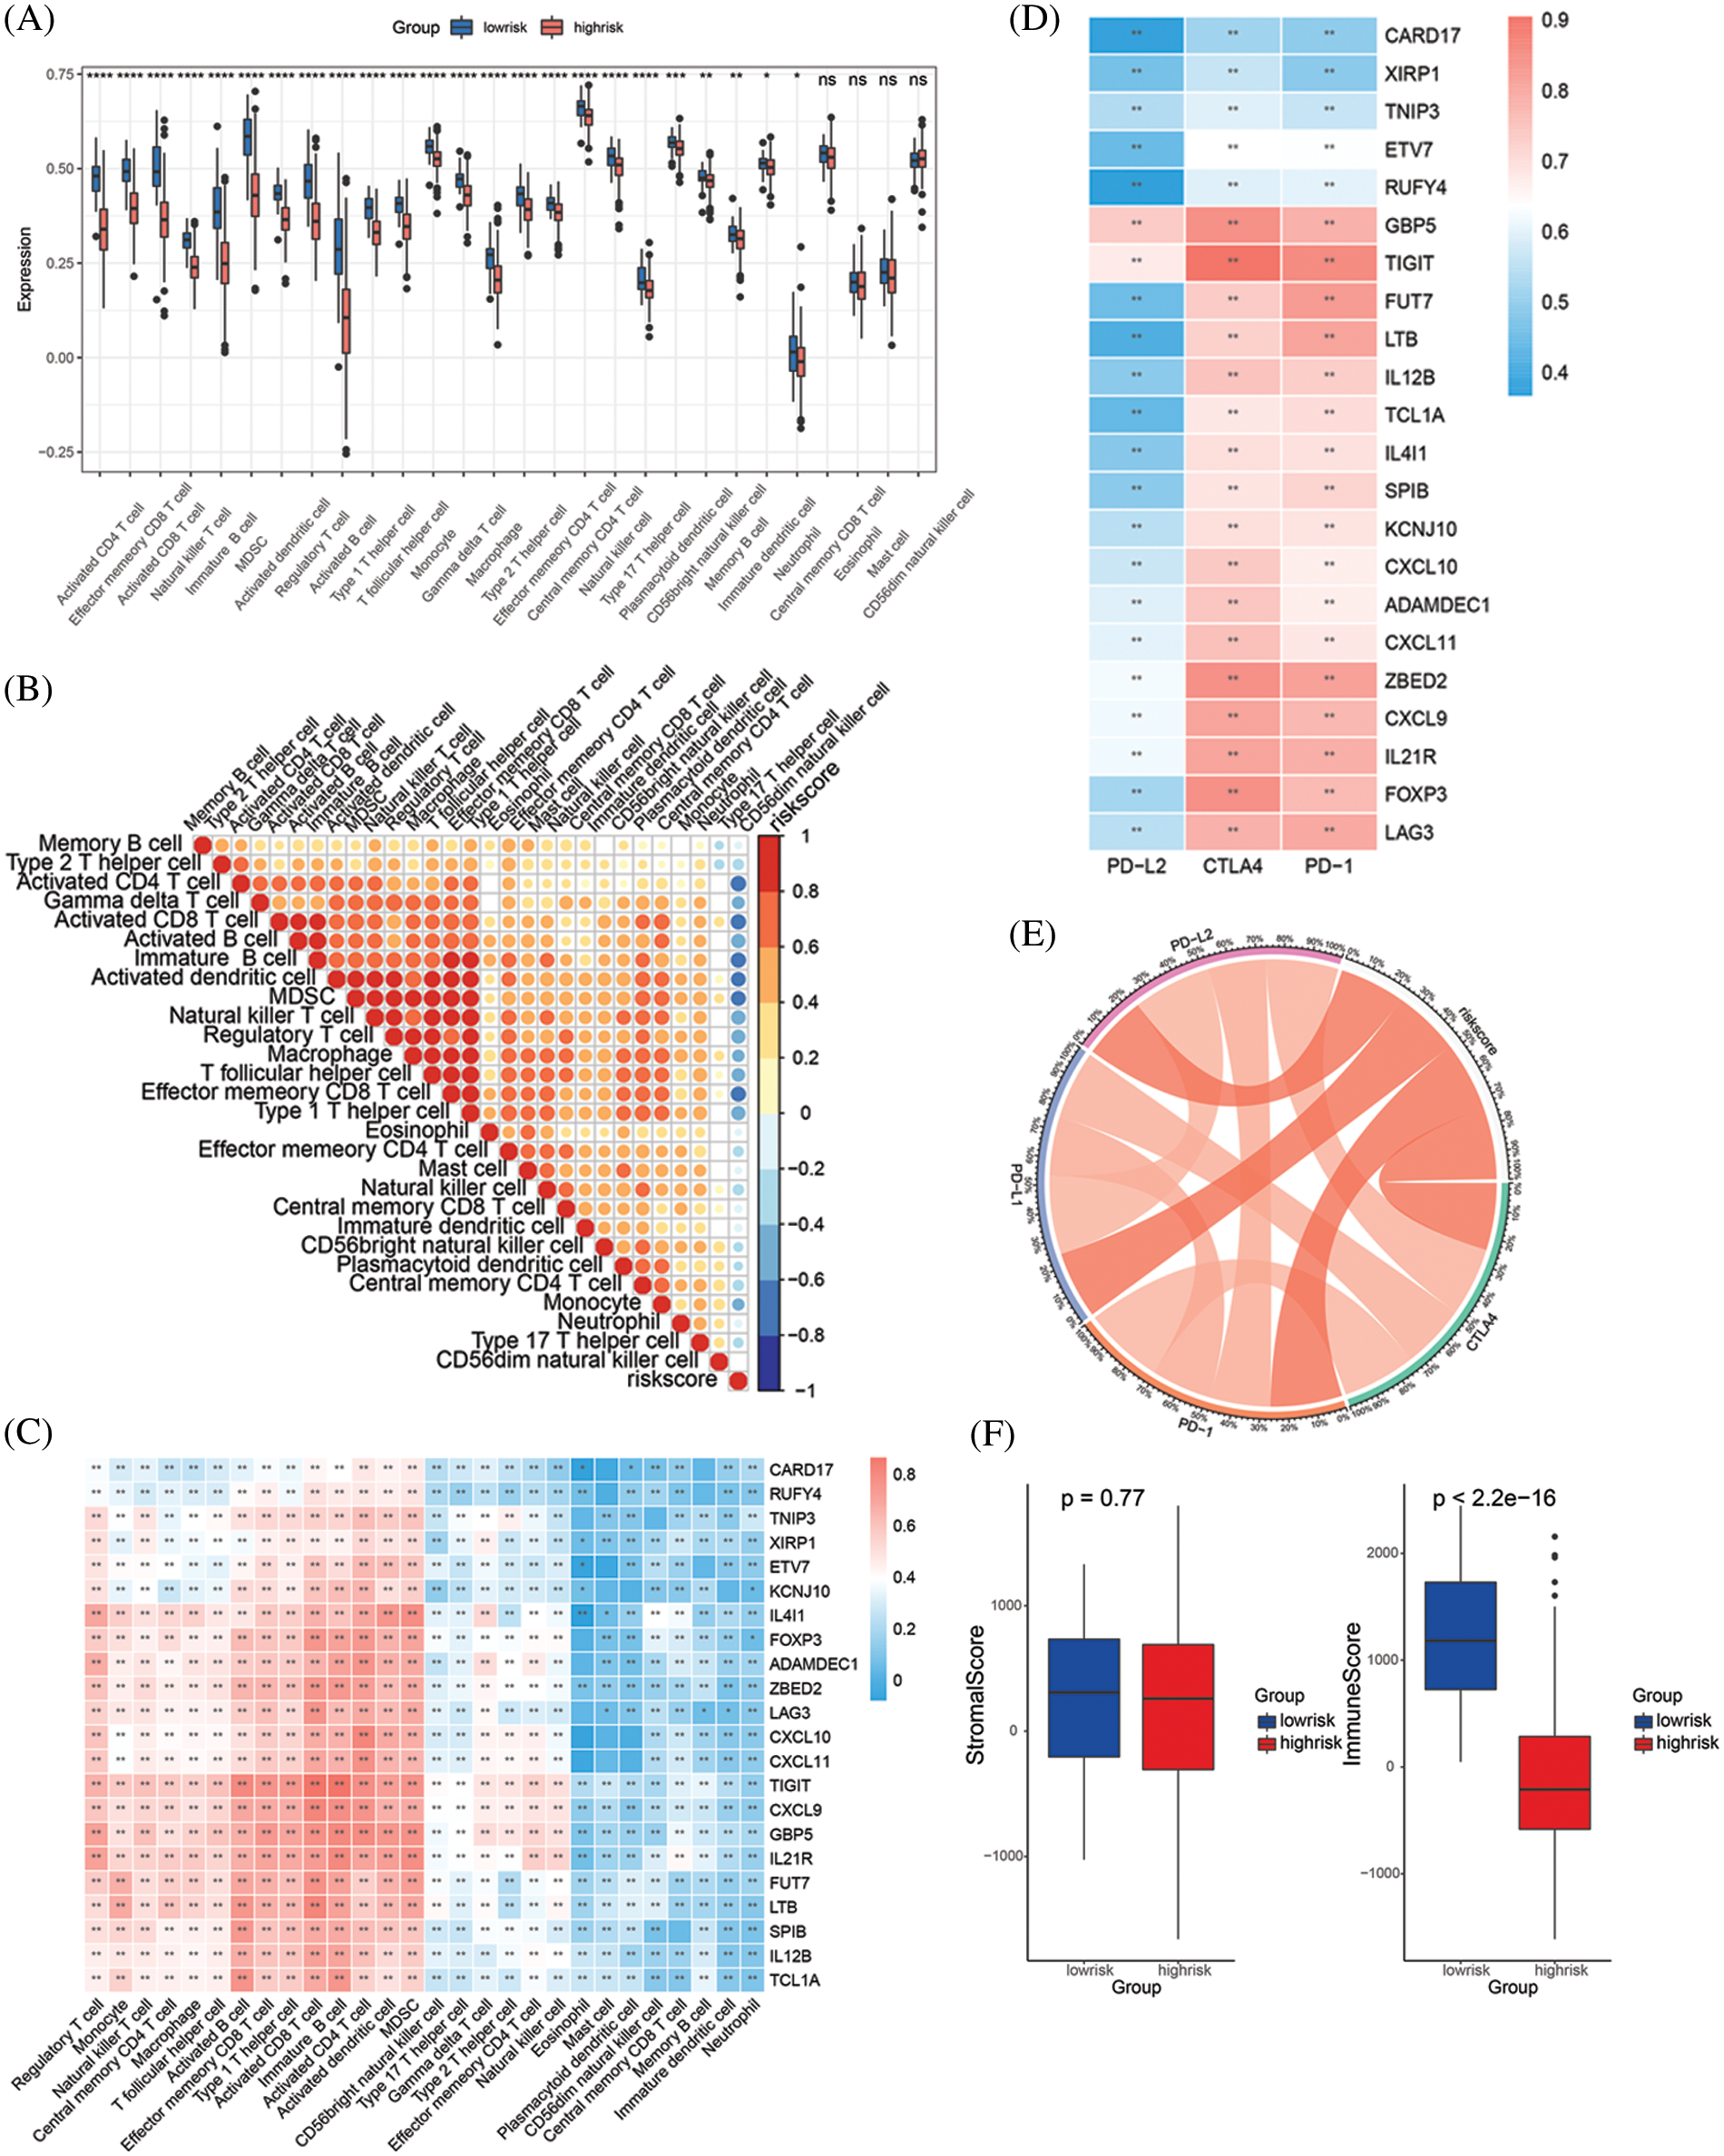
Figure 4: Correlation of key genes, risk score and TILs. (A) The infiltration of 28 immune cells in low-risk and high-risk groups. (B) The correlation between 28 immune cells and risk score. (C) The correlation between 28 immune cells and 22 key genes. (D) The correlation between 4 immune checkpoint molecules and 22 key genes. (E) Chord diagram shows the correlation between 4 immune checkpoint molecules and risk score. (F) The stromal score and immune score in low-risk and high-risk groups (All the p value in this figure: *P < 0.05; **P < 0.01; ***P < 0.001)
3.4 Validation of the Prognostic and Immunotherapy Predictive Value in Independent Cohorts
To validate the predictive value of the risk score and the key genes, transcriptomic data and complete clinical information from the GSE42568 cohort and a large Phase II trial (IMvigor210) were included in this study. By integrating the two datasets into our prognostic model, the risk score was obtained and survival analyses were performed for the two datasets. In the GSE42568 cohort, the low-risk group had a survival advantage with a risk score cutoff value of −0.67 (P < 0.05, Figs. 5A–5B). The IMvigor210 cohort displayed similar results, where the low-risk group gained a survival advantage with a risk score cutoff value of −0.06 (P < 0.05, Figs. 5C–5D). Furthermore, the tumor response to immunotherapy was investigated in the IMvigor210 cohort to verify the prediction effect of the risk score. Results revealed that the risk score was significantly different when comparing CR with SD or PD, and when comparing PR with SD or PD (P < 0.05, Fig. 5E). Regarding CR and PR as positive immunotherapy responses, and SD and PD as negative immunotherapy responses, the immunotherapy response rate in the low-risk group was higher than in the high-risk group (Response rate: 40.2% vs. 31.5%, Fig. 5F). Consequently, the validation result confirmed the prognostic value in breast cancer and the predictive value in tumor response to immunotherapy of the risk score.
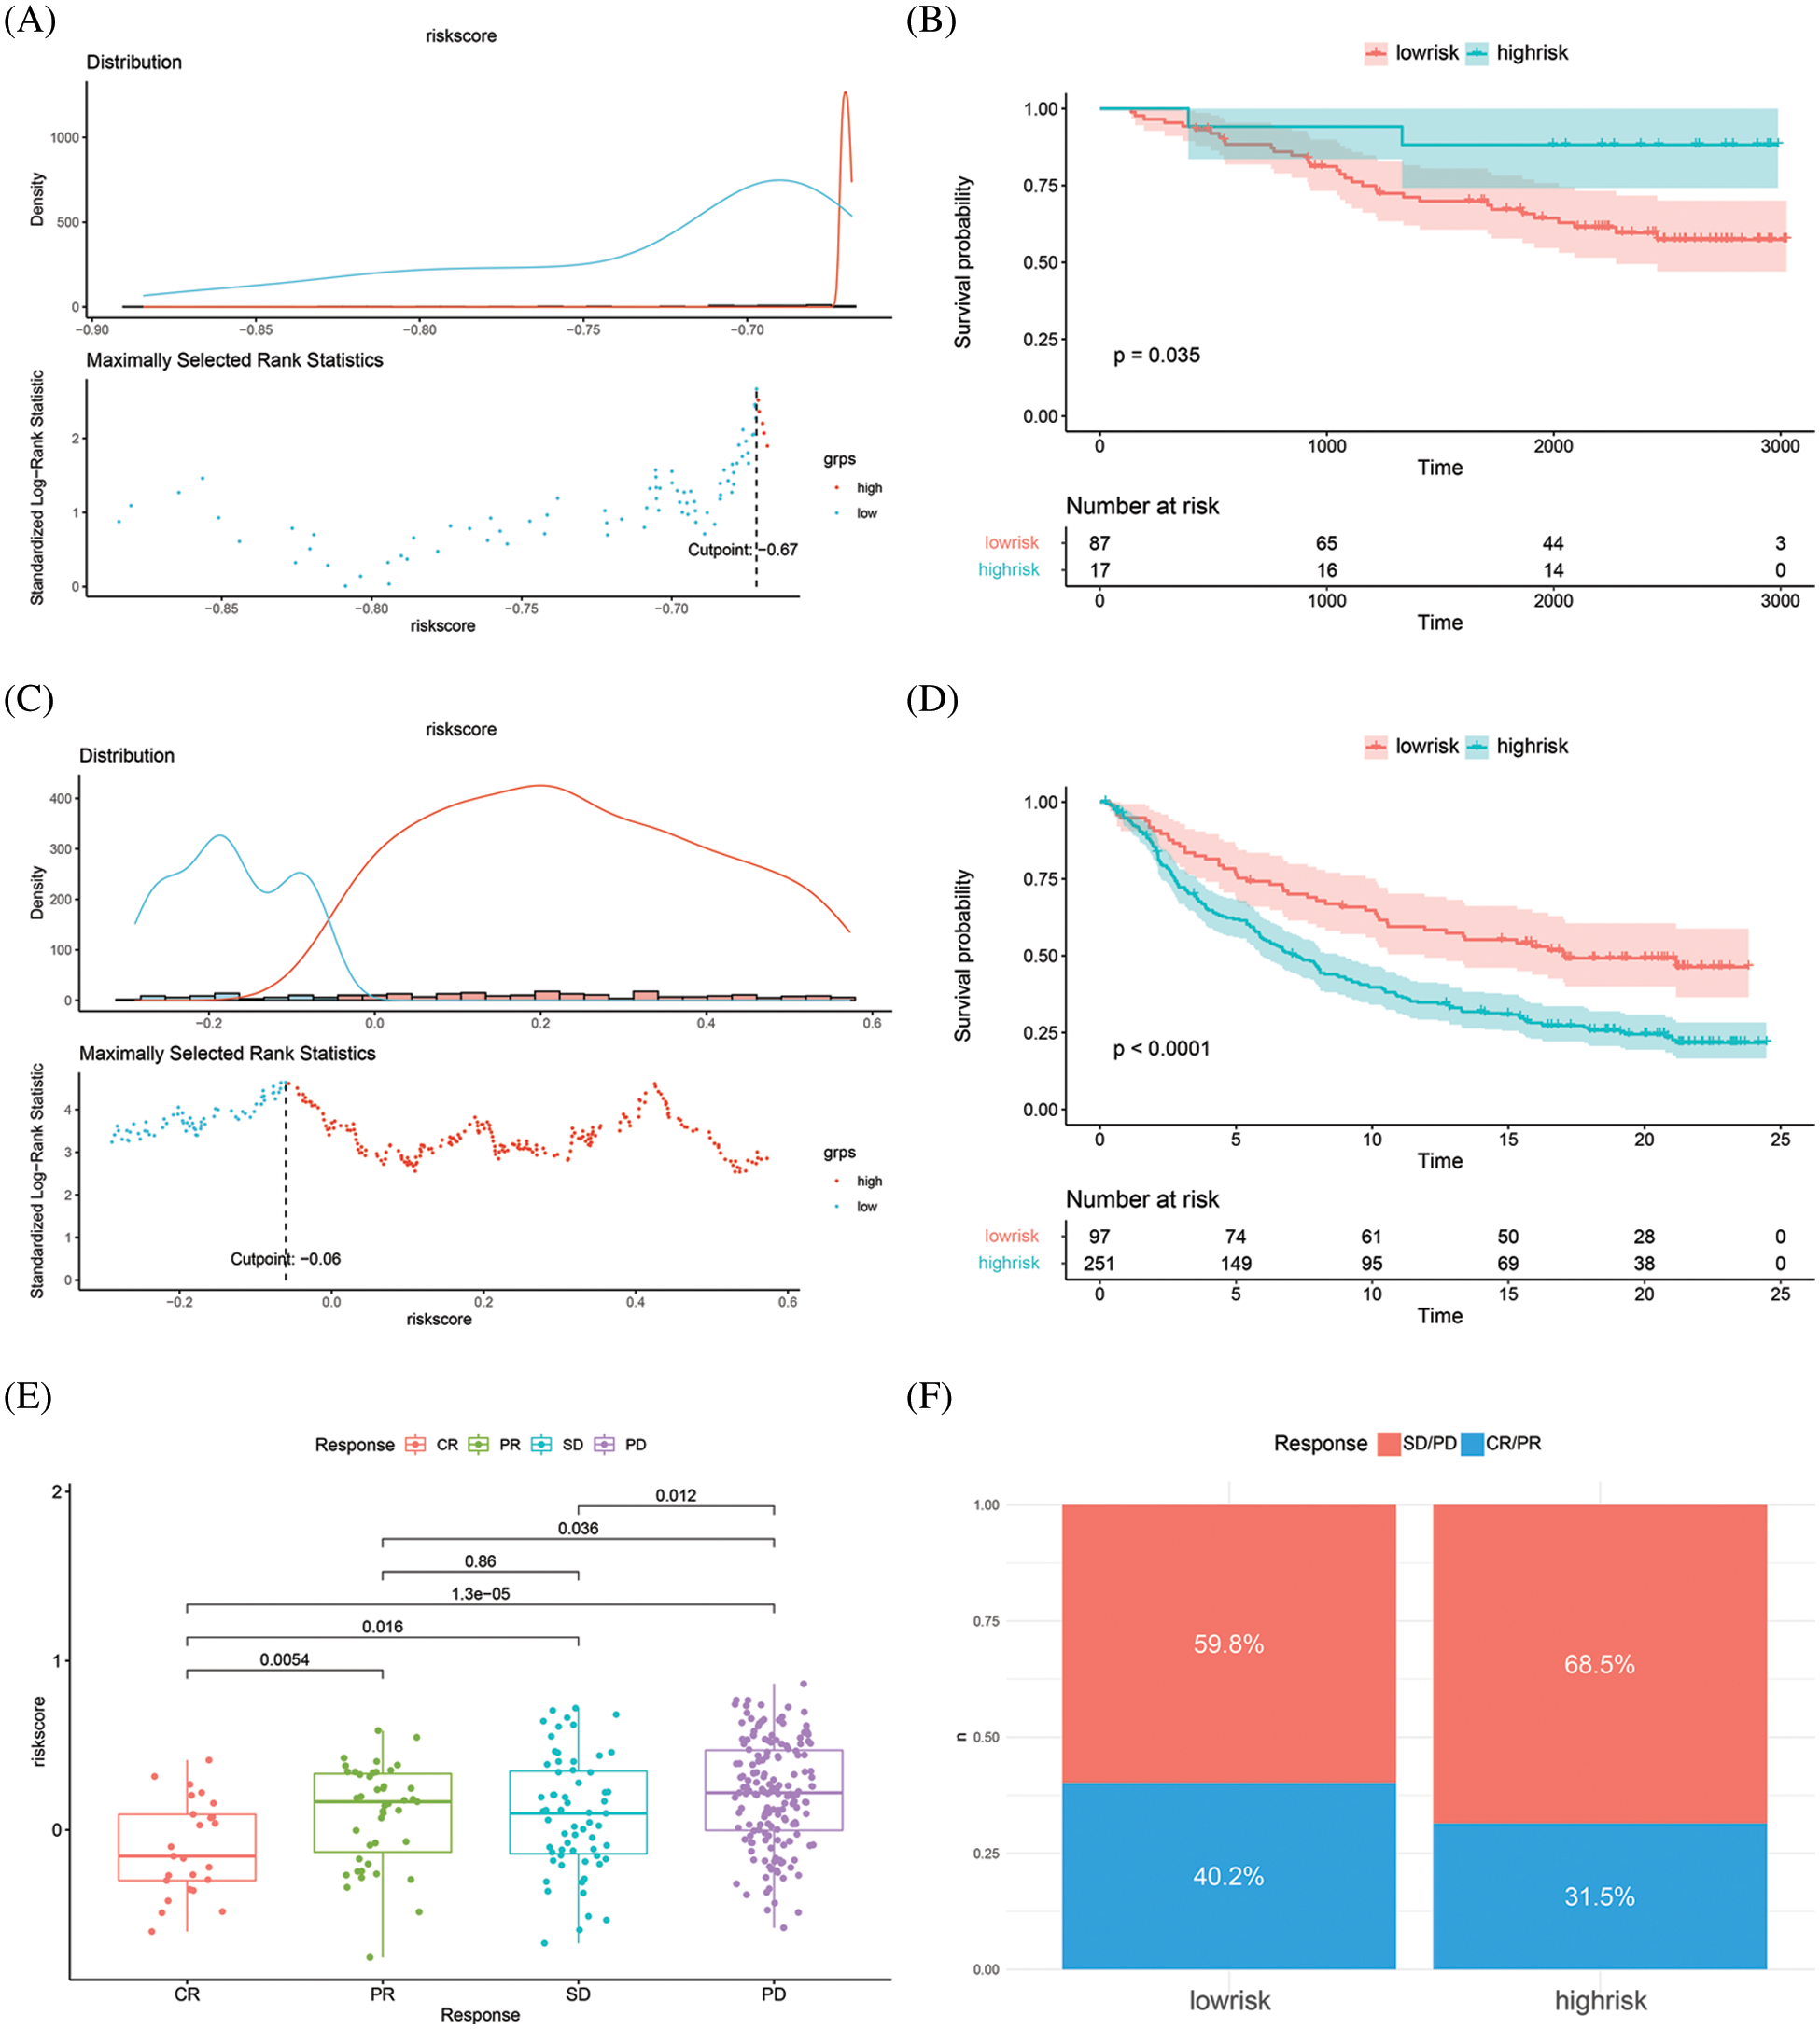
Figure 5: Risk score validation in two independent cohorts. (A–B) Distribution plot and survival analysis in validation GSE42568 cohort. (C–D) Distribution plot and survival analysis in validation IMvigor210 cohort. (E) Risk score in different response status. (F) Response rate in low-risk and high-risk groups
PD-1/PD-L1 inhibitors are a landmark milestone in the immunotherapy of breast cancer. However, a limited number of patients benefit from the therapy with PD-1/PD-L1 inhibitors. The objective response rates reported in published studies ranged from 6% to 53% in different cancers [15]. Studies focusing on predicting the response rate of immunotherapies have reported that the TME, extent of TILs, and TMB were predictive factors for the PD-1/PD-L1 inhibitor response [16]. PD-L1 expression has been widely reported as a predictor of PD-1/PD-L1 inhibitor response in many studies, but there are also studies that do not support the predictive value of PD-L1 expression [16–18]. In view of this, it is critical to obtain a more accurate prediction of immunotherapy response in the pursuit of precision therapy.
In this bioinformatic study, we identified 22 key genes that are highly associated with PD-1 and are differentially expressed between tumor tissues and normal tissues. Survival analyses also confirmed that high expression of the key genes was correlated with an overall survival advantage. A risk score was constructed and patients were classified into a low-risk and high-risk group. We found that the low-risk group had a superior survival outcome. More importantly, the risk score had a good predictive value in tumor response to immunotherapy, which was validated in an independent cohort. In our subsequent analyses, 28 immune cell types were identified (Immune cell abundance in Supplementary Table S6). Most of these cell types demonstrated a significantly high infiltration in the low-risk group, and the immune score was also higher in the low-risk group compared with the high-risk group. As a result, the risk score was negatively correlated with the 28 immune cell types. Among these immune cell types, activated B cells, effector memory CD8 + T cells, type 1 T helper cells, activated CD8 + T cells, immature B cells, activated CD4 + T cells, activated dendritic cells, and MDSCs not only had a high infiltration in the low-risk group, but also showed the highest correlation with the 22 key genes. We consider these eight immune cell types as critical components in this study. Moreover, we found that a specific range of the risk score corresponded to particular immune checkpoint genes, which may imply that the risk score can predict tumor response to different immune checkpoint inhibitors.
The expression of immune cells and immune-related genes is related to tumor prognosis [19]. T cells are known to be an important player in adaptive immunity and the main cellular component of anti-PD-1/PD-L1 therapy. Studies in melanoma and NSCLC have shown that the higher the number of CD8 + T cells infiltrating the margins and interior of tumor tissue, the higher the response rate to anti-PD-1 therapy [20,21]. In addition, tumor-infiltrating B cells can improve therapeutic efficacy by secreting antibodies and activating T cells, and tumor-infiltrating B cells are significantly enriched in the tissues of patients responding to immunotherapy [5,22,23]. There are also studies demonstrating that the number of MDSCs in the tumor is correlated with a poor prognosis of patients receiving PD-1/PD-L1 inhibitor treatment [24,25]. However, our study shows a high infiltration of MDSC in low-risk group, which contradicts existing research evidences, and further research is needed to clarify the controversy. On the whole, these data are generally consistent with the results of this study showing that high infiltration of T cells and B cells contribute to an improved response to immunotherapy. Studies focusing on the response rate of immunotherapies have shown that PD-L1 expression, density of TILs, TMB, mutations in tumor driver genes, antigen-presenting cells, molecules in the TME, and mismatch-repair deficiency were associate with treatment response to PD-1/PD-L1 inhibitor therapy [26–31]. However, because of difficulty with detection of the biomarkers mentioned above, the reliability of results still needs to be validated. In addition, some studies shown that the above biomarkers are not helpful in predicting the response of PD-1 inhibitors, and most of the biomarkers have not been widely recognized in breast cancer. Thus, the above biomarkers cannot be used to guide the immunotherapy of breast cancer for now [32,33].
Studies on gene expression profiles utilizing RNA expression datasets focusing on improving or predicting immunotherapy are also being carried out in various cancer types. Clinical trials demonstrate that IFNγ-related gene expression signatures help predict response to PD-1 checkpoint blockade in melanoma [34]. Chemokine genes CXCL10 and CXCL11 have been reported to be associated with anti-PD-1 efficacy in preclinical models of breast cancer [35]. FOXM1 and TOP2A have been reported to be valuable in predicting prognosis and response to PD-1 inhibitor therapy in clear cell renal cell carcinoma [36]. The overlap of the 22 key genes in this study with genes in existing studies demonstrates the scientific and practical value of our study.
However, there are still several limitations of the reported study. The number of samples for the final statistical analysis is greatly limited because of the large number of missing values for the clinical data in the TCGA database, which can therefore bias the analysis results. Additionally, although we generated a favorable predictive value for the bioinformatic analysis, we were not able to validate this in a prospective study for now. Limited by the scarcity of immunotherapy cohort data, our study included the urothelial carcinoma IMvigor210 cohort. This cohort is widely applied in studies of gastric cancer, hepatocellular carcinoma and even breast cancer [37–41]. Indeed, Urothelial carcinoma and breast cancer are cancers of different tissues, our result can only prove the predictive value of the risk score in tumor response to immunotherapy. However, the usefulness of this risk score in predicting immunotherapy response of real cases in breast cancer needs further evaluation.
Despite the limitations mentioned above, our study showed a connection between gene expression, risk score and TILs, and explored markers for predicting immunotherapy response. Our study therefore has a clinical translational value for breast cancer immunotherapy. With the application of new and advanced technologies in cancer research, it is expected to further reveal the mechanism of action of immunotherapy [42].
In conclusion, this work identified 22 key genes both highly correlated with PD-1 and significantly differentially expressed between tumor tissues and normal tissues. The risk score proved to be an independent factor for predicting breast cancer prognosis, and ETV7 and KCNJ10 were the most decisive genes. Furthermore, the risk score showed predictive value in tumor response to immunotherapy. Through the correlation analyses between risk score and TILs, the relationship between TILs and immunotherapy response was further confirmed, which has value for the practice and application of immunotherapy and subsequent research.
Acknowledgement: We would like to thank the associate editor and the reviewers for their useful feedback that improved this paper. We thank Gouzi learn Bioinformatics (WeChat Official Accounts), for generously sharing their experience and codes.
Authorship: YX, JJ, and CW designed the research. YX and JJ analyzed the data and drafted the manuscript. YC and YH participated in collecting datasets involved in the study. CW supervised the implementation of the study. All authors read and approved the submitted manuscript.
Ethics Approval and Informed Consent Statement: Data cohorts involved in this study belong to public databases. The patients involved in the database have obtained ethical approval. Users can download relevant data for free for research and publish relevant articles. Our study is based on open-source data, so there are no ethical issues and other conflicts of interest.
Availability of Data and Materials: The datasets analyzed for this study can be found as follows:
TCGA-BRCA cohort [https://gdc.xenahubs.net/download/]
GSE42568 cohort [https://www.ncbi.nlm.nih.gov/geo/query/acc.cgi?acc=GSE42568]
IMvigor210 cohort [http://research-pub.gene.com/IMvigor210CoreBiologies]
If data and code are required, it is possible to get it from corresponding author upon request.
Funding Statement: This work was supported by funding from the Guangxi Natural Science Foundation Project; Grant No: 2020GXNSFAA297152.
Conflicts of Interest: The authors declare that the research was conducted in the absence of any commercial or financial relationships that could be construed as a potential conflict of interest.
References
1. Nanda, R., Chow, L. Q. M., Dees, E. C., Berger, R., Gupta, S. et al. (2016). Pembrolizumab in patients with advanced triple-negative breast cancer: Phase Ib KEYNOTE-012 study. Journal of Clinical Oncology, 34(21), 2460–2467. DOI 10.1200/JCO.2015.64.8931. [Google Scholar] [CrossRef]
2. Emens, L. A., Adams, S., Barrios, C. H., Diéras, V., Iwata, H. et al. (2021). First-line atezolizumab plus nab-paclitaxel for unresectable, locally advanced, or metastatic triple-negative breast cancer: IMpassion130 final overall survival analysis. Annals of Oncology, 32(8), 983–993. DOI 10.1016/j.annonc.2021.05.355. [Google Scholar] [CrossRef]
3. Rugo, H. S., Delord, J. P., Im, S. A., Ott, P. A., Piha-Paul, S. A. et al. (2018). Safety and antitumor activity of pembrolizumab in patients with estrogen receptor-positive/Human epidermal growth factor receptor 2-negative advanced breast cancer. Clinical Cancer Research, 24(12), 2804–2811. DOI 10.1158/1078-0432.CCR-17-3452. [Google Scholar] [CrossRef]
4. Dirix, L. Y., Takacs, I., Jerusalem, G., Nikolinakos, P., Arkenau, H. T. et al. (2018). Avelumab, an anti-PD-L1 antibody, in patients with locally advanced or metastatic breast cancer: A phase 1b JAVELIN solid tumor study. Breast Cancer Research and Treatment, 167(3), 671–686. DOI 10.1007/s10549-017-4537-5. [Google Scholar] [CrossRef]
5. Hollern, D. P., Xu, N., Thennavan, A., Glodowski, C., Garcia-Recio, S. et al. (2019). B cells and T follicular helper cells mediate response to checkpoint inhibitors in high mutation burden mouse models of breast cancer. Cell, 179(5), 1191–1206. DOI 10.1016/j.cell.2019.10.028. [Google Scholar] [CrossRef]
6. Topalian, S. L., Hodi, F. S., Brahmer, J. R., Gettinger, S. N., Smith, D. C. et al. (2012). Safety, activity, and immune correlates of anti-PD-1 antibody in cancer. The New England Journal of Medicine, 366(26), 2443–2454. DOI 10.1056/NEJMoa1200690. [Google Scholar] [CrossRef]
7. Makhoul, I., Atiq, M., Alwbari, A., Kieber-Emmons, T. (2018). Breast cancer immunotherapy: An update. Breast Cancer: Basic and Clinical Research, 12, 1178223418774802. [Google Scholar]
8. Clarke, C., Madden, S. F., Doolan, P., Aherne, S. T., Joyce, H. et al. (2013). Correlating transcriptional networks to breast cancer survival: A large-scale coexpression analysis. Carcinogenesis, 34(10), 2300–2308. DOI 10.1093/carcin/bgt208. [Google Scholar] [CrossRef]
9. Mariathasan, S., Turley, S. J., Nickles, D., Castiglioni, A., Yuen, K. et al. (2018). TGFβ attenuates tumour response to PD-L1 blockade by contributing to exclusion of T cells. Nature, 554(7693), 544–548. DOI 10.1038/nature25501. [Google Scholar] [CrossRef]
10. Love, M. I., Huber, W., Anders, S. (2014). Moderated estimation of fold change and dispersion for RNA-seq data with DESeq2. Genome Biology, 15(12), 1–21. DOI 10.1186/s13059-014-0550-8. [Google Scholar] [CrossRef]
11. Yu, G., Wang, L. G., Han, Y., He, Q. Y. (2012). Clusterprofiler: An R package for comparing biological themes among gene clusters. Omics: A Journal of Integrative Biology, 16(5), 284–287. DOI 10.1089/omi.2011.0118. [Google Scholar] [CrossRef]
12. Simon, N., Friedman, J., Hastie, T., Tibshirani, R. (2011). Regularization paths for cox’s proportional hazards model via coordinate descent. Journal of Statistical Software, 39(5), 1-13. DOI 10.18637/jss.v039.i05. [Google Scholar] [CrossRef]
13. Tomfohr, J., Lu, J., Kepler, T. B. (2005). Pathway level analysis of gene expression using singular value decomposition. BMC Bioinformatics, 6, 225. DOI 10.1186/1471-2105-6-225. [Google Scholar] [CrossRef]
14. Newman, A. M., Steen, C. B., Liu, C. L., Gentles, A. J., Chaudhuri, A. A. et al. (2019). Determining cell type abundance and expression from bulk tissues with digital cytometry. Nature Biotechnology, 37(7), 773–782. DOI 10.1038/s41587-019-0114-2. [Google Scholar] [CrossRef]
15. Sunshine, J., Taube, J. M. (2015). PD-1/PD-l1 inhibitors. Current Opinion in Pharmacology, 23, 32–38. DOI 10.1016/j.coph.2015.05.011. [Google Scholar] [CrossRef]
16. Yi, M., Jiao, D., Xu, H., Liu, Q., Zhao, W. et al. (2018). Biomarkers for predicting efficacy of PD-1/PD-L1 inhibitors. Molecular Cancer, 17(1), 1–14. DOI 10.1186/s12943-018-0864-3. [Google Scholar] [CrossRef]
17. Luchini, C., Bibeau, F., Ligtenberg, M. J. L., Singh, N., Nottegar, A. et al. (2019). ESMO recommendations on microsatellite instability testing for immunotherapy in cancer, and its relationship with PD-1/PD-L1 expression and tumour mutational burden: A systematic review-based approach. Annals of Oncology, 30(8), 1232–1243. DOI 10.1093/annonc/mdz116. [Google Scholar] [CrossRef]
18. Wang, X., Guo, G., Guan, H., Yu, Y., Lu, J. et al. (2019). Challenges and potential of PD-1/PD-L1 checkpoint blockade immunotherapy for glioblastoma. Journal of Experimental & Clinical Cancer Research, 38(1), 87. DOI 10.1186/s13046-019-1085-3. [Google Scholar] [CrossRef]
19. Xie, J., Chen, L., Sun, Q., Li, H., Wei, W. et al. (2022). An immune subtype-related prognostic signature of hepatocellular carcinoma based on single-cell sequencing analysis. Aging, 14(7), 3276–3292. DOI 10.18632/aging.204012. [Google Scholar] [CrossRef]
20. Tumeh, P. C., Harview, C. L., Yearley, J. H., Shintaku, I. P., Taylor, E. J. M. et al. (2014). PD-1 blockade induces responses by inhibiting adaptive immune resistance. Nature, 515(7528), 568–571. DOI 10.1038/nature13954. [Google Scholar] [CrossRef]
21. Uryvaev, A., Passhak, M., Hershkovits, D., Sabo, E., Bar-Sela, G. (2018). The role of tumor-infiltrating lymphocytes (TILs) as a predictive biomarker of response to anti-PD1 therapy in patients with metastatic non-small cell lung cancer or metastatic melanoma. Medical Oncology, 35(3), 1–9. DOI 10.1007/s12032-018-1080-0. [Google Scholar] [CrossRef]
22. Helmink, B. A., Reddy, S. M., Gao, J., Zhang, S., Basar, R. et al. (2020). B cells and tertiary lymphoid structures promote immunotherapy response. Nature, 577(7791), 549–555. DOI 10.1038/s41586-019-1922-8. [Google Scholar] [CrossRef]
23. Cabrita, R., Lauss, M., Sanna, A., Donia, M., Skaarup Larsen, M. et al. (2020). Tertiary lymphoid structures improve immunotherapy and survival in melanoma. Nature, 577(7791), 561–565. DOI 10.1038/s41586-019-1914-8. [Google Scholar] [CrossRef]
24. Weber, J., Gibney, G., Kudchadkar, R., Yu, B., Cheng, P. et al. (2016). Phase I/II study of metastatic melanoma patients treated with nivolumab who had progressed after ipilimumab. Cancer Immunology Research, 4(4), 345–353. DOI 10.1158/2326-6066.CIR-15-0193. [Google Scholar] [CrossRef]
25. Holtzhausen, A., Harris, W., Ubil, E., Hunter, D. M., Zhao, J. et al. (2019). TAM family receptor kinase inhibition reverses MDSC-mediated suppression and augments anti-PD-1 therapy in melanoma. Cancer Immunology Research, 7(10), 1672–1686. DOI 10.1158/2326-6066.CIR-19-0008. [Google Scholar] [CrossRef]
26. Zhang, Y., Chen, L. (2016). Classification of advanced human cancers based on tumor immunity in the MicroEnvironment (TIME) for cancer immunotherapy. JAMA Oncology, 2(11), 1403–1404. DOI 10.1001/jamaoncol.2016.2450. [Google Scholar] [CrossRef]
27. Johnson, D. B., Estrada, M. V., Salgado, R., Sanchez, V., Doxie, D. B. et al. (2016). Melanoma-specific MHC-II expression represents a tumour-autonomous phenotype and predicts response to anti-PD-1/PD-L1 therapy. Nature Communications, 7, 10582. DOI 10.1038/ncomms10582. [Google Scholar] [CrossRef]
28. Le, D. T., Uram, J. N., Wang, H., Bartlett, B. R., Kemberling, H. et al. (2015). PD-1 blockade in tumors with mismatch-repair deficiency. The New England Journal of Medicine, 372(26), 2509–2520. DOI 10.1056/NEJMoa1500596. [Google Scholar] [CrossRef]
29. Yarchoan, M., Hopkins, A., Jaffee, E. M. (2017). Tumor mutational burden and response rate to PD-1 inhibition. The New England Journal of Medicine, 377(25), 2500–2501. DOI 10.1056/NEJMc1713444. [Google Scholar] [CrossRef]
30. Skoulidis, F., Byers, L. A., Diao, L., Papadimitrakopoulou, V. A., Tong, P. et al. (2015). Co-occurring genomic alterations define major subsets of KRAS-mutant lung adenocarcinoma with distinct biology, immune profiles, and therapeutic vulnerabilities. Cancer Discovery, 5(8), 860–877. DOI 10.1158/2159-8290.CD-14-1236. [Google Scholar] [CrossRef]
31. Hellmann, M. D., Ciuleanu, T. E., Pluzanski, A., Lee, J. S., Otterson, G. A. et al. (2018). Nivolumab plus ipilimumab in lung cancer with a high tumor mutational burden. The New England Journal of Medicine, 378(22), 2093–2104. DOI 10.1056/NEJMoa1801946. [Google Scholar] [CrossRef]
32. Dill, E. A., Gru, A. A., Atkins, K. A., Friedman, L. A., Moore, M. E. et al. (2017). PD-L1 expression and intratumoral heterogeneity across breast cancer subtypes and stages: An assessment of 245 primary and 40 metastatic tumors. The American Journal of Surgical Pathology, 41(3), 334–342. DOI 10.1097/PAS.0000000000000780. [Google Scholar] [CrossRef]
33. Torlakovic, E., Lim, H. J., Adam, J., Barnes, P., Bigras, G. et al. (2020). “Interchangeability” of PD-L1 immunohistochemistry assays: A meta-analysis of diagnostic accuracy. Modern Pathology, 33(1), 4–17. DOI 10.1038/s41379-019-0327-4. [Google Scholar] [CrossRef]
34. Ayers, M., Lunceford, J., Nebozhyn, M., Murphy, E., Loboda, A. et al. (2017). IFN-Γ-related mRNA profile predicts clinical response to PD-1 blockade. The Journal of Clinical Investigation, 127(8), 2930–2940. DOI 10.1172/JCI91190. [Google Scholar] [CrossRef]
35. Wang, H., Li, S., Wang, Q., Jin, Z., Shao, W. et al. (2021). Tumor immunological phenotype signature-based high-throughput screening for the discovery of combination immunotherapy compounds. Science Advances, 7(4), eabd7851. DOI 10.1126/sciadv.abd7851. [Google Scholar] [CrossRef]
36. Yin, X., Wang, Z., Wang, J., Xu, Y., Kong, W. et al. (2021). Development of a novel gene signature to predict prognosis and response to PD-1 blockade in clear cell renal cell carcinoma. Oncoimmunology, 10(1), 1933332. DOI 10.1080/2162402X.2021.1933332. [Google Scholar] [CrossRef]
37. Zeng, D., Li, M., Zhou, R., Zhang, J., Sun, H. et al. (2019). Tumor microenvironment characterization in gastric cancer identifies prognostic and immunotherapeutically relevant gene signatures. Cancer Immunology Research, 7(5), 737–750. DOI 10.1158/2326-6066.CIR-18-0436. [Google Scholar] [CrossRef]
38. Gu, X., Guan, J., Xu, J., Zheng, Q., Chen, C. et al. (2021). Model based on five tumour immune microenvironment-related genes for predicting hepatocellular carcinoma immunotherapy outcomes. Journal of Translational Medicine, 19(1), 26. DOI 10.1186/s12967-020-02691-4. [Google Scholar] [CrossRef]
39. Yu, Y., Zhang, W., Li, A., Chen, Y., Ou, Q. et al. (2020). Association of long noncoding RNA biomarkers with clinical immune subtype and prediction of immunotherapy response in patients with cancer. JAMA Network Open, 3(4), e202149. DOI 10.1001/jamanetworkopen.2020.2149. [Google Scholar] [CrossRef]
40. Guo, J. N., Chen, D., Deng, S. H., Huang, J. R., Song, J. X. et al. (2022). Identification and quantification of immune infiltration landscape on therapy and prognosis in left-and right-sided colon cancer. Cancer Immunology, Immunotherapy, 71(6), 1313–1330. DOI 10.1007/s00262-021-03076-2. [Google Scholar] [CrossRef]
41. Zhang, H. C., Deng, S. H., Pi, Y. N., Guo, J. N., Xi, H. et al. (2022). Identification and validation in a novel quantification system of ferroptosis patterns for the prediction of prognosis and immunotherapy response in left-and right-sided colon cancer. Frontiers in Immunology, 13, 855849. DOI 10.3389/fimmu.2022.855849. [Google Scholar] [CrossRef]
42. Ma, M., Liu, Y., Huang, W. (2021). Applications of CRISPR-cas system in tumor biology. Oncologie, 23(4), 463–492. DOI 10.32604/oncologie.2022.019415. [Google Scholar] [CrossRef]
Appendix
Supplementary Figures S1–S5: Survival analysis of 36intersection genes
Supplementary Figure S6: Distribution of patients in TCGA BRCA cohort
Supplementary Figure S7: Comparison of AUC between different factors in TCGA BRCA cohort
Supplementary Table S1: Gene correlation with PD-1
Supplementary Table S2: GO analyses of PD-1 correlated genes
Supplementary Table S3: DEGs between tumor tissues and normal tissues
Supplementary Table S4: GO analyses of DEGs
Supplementary Table S5: Comparison of different predictive factors
Supplementary Table S6: Immune cell abundance of TCGA BRCA cohort
Cite This Article
 Copyright © 2022 The Author(s). Published by Tech Science Press.
This work is licensed under a Creative Commons Attribution 4.0 International License , which permits unrestricted use, distribution, and reproduction in any medium, provided the original work is properly cited.
 Downloads
 Citation Tools