
 Submit a Paper
 Propose a Special lssue
 Open Access
ARTICLE

Angiogenic Gene PTK2 is a Potential Biomarker of Gestational Diabetes Mellitus and is Significantly Associated with Breast Cancer Immune Infiltration
1
Department of Obstetrics and Gynecology, Jinniu District Maternal and Child Health Hospital, Chengdu, 610000, China
2
Department of Pediatrics, Jinniu District Maternal and Child Health Hospital, Chengdu, 610000, China
* Corresponding Author: Jufang Guo. Email:
# These authors contributed equally to this work and should be considered co-first authors
Oncologie 2022, 24(4), 769-787. https://doi.org/10.32604/oncologie.2022.026248
Received 26 August 2022; Accepted 24 October 2022; Issue published 31 December 2022
 View Full Text
 Download PDF
Abstract
Background: Gestational diabetes mellitus (GDM) affects the health of numerous women around the world. A recent study has shown that GDM is associated with an increased incidence of cancer. In this study, we aimed to explore the possible shared mechanisms and potential common therapeutic targets between GDM and cancer. Methods: The limma package was used to identify differentially expressed genes (DEGs) in GDM. The Cytoscape plugin cytoHubba was used to screen hub genes. The CIBERSORT algorithm was used to explore the correlation between hub genes and immunity. Cox regression analysis was used to assess the relationship between protein tyrosine kinase 2 (PTK2) expression and prognosis in pan-cancer. Single-sample gene set enrichment analysis (ssGSEA) and CIBERSORT were used to assess the correlation between PTK2 and immunity in cancer. Mutation and methylation analyses of PTK2 were assessed using Spearman’s correlation test. Results: A total of 871 DEGs were identified, among which the hub genes were significantly highly expressed in GDM and had a strong association with immunity. Pan-cancer analysis revealed that PTK2 was significantly overexpressed in multiple types of cancer. Survival analysis showed that PTK2 was significantly associated with poor prognosis in multiple cancers. Mutational analysis revealed that copy number variation of PTK2 mediated abnormal expression of mRNA, and expression of PTK2 was significantly correlated with tumor mutational burden of various cancers. Immune correlation analysis showed pre-correlation of PTK2 with breast cancer, and patients with low expression of PTK2 could benefit more from immunotherapy. GSEA enrichment analysis was enriched in adaptive immune response, which verified the strong association of PTK2 with immunity in breast cancer. Conclusions: PTK2 was involved in the immune response of GDM and breast cancer and may be a novel clinical prognostic marker and potential common therapeutic target for GDM and breast cancer.Keywords
Gestational diabetes mellitus (GDM) is one of the most common metabolic diseases of pregnancy and is characterized by various degrees of carbohydrate intolerance that develops or is first identified during pregnancy [1,2]. Over the past few decades, the prevalence of GDM has risen from 9.3% to 25.5% globally as living standards have improved [3]. Similar to type 2 diabetes, the top risk factors for GDM are obesity and age [4–6]. GDM is a serious threat to maternal and infant health, but its exact pathological mechanism is still not fully understood [7]. The U.S. Cancer Statistics 2022 shows that by 2022, 1,918,030 new cancer cases and 609,360 cancer deaths would be expected in the United States, with breast cancer rates continuing to increase [8]. Cancer continues to affect the health of millions of people around the world. A recent meta-analysis study pooling 17 observational studies showed that GDM was associated with an increased risk of cancer in women [9]. Further, multiple studies have shown that gestational diabetes may be strongly associated with an increased risk of breast cancer [10,11]. Therefore, it is necessary to further study the association between GDM and cancer, its associated mechanisms, and potential co-therapeutic targets.
In our study, we aimed to identify key genes in GDM using bioinformatics tools and to explore their potential roles and mechanisms in various cancer types. We hope to provide new insights into the association between GDM and cancer, especially breast cancer, and hope to find common therapeutic targets to reduce cancer incidence in GDM patients.
Messenger RNA (mRNA) expression profile of GDM (GSE87295 and GSE103552) was downloaded from the GEO database [12], where GSE87295 included 5 GDM samples and 5 control samples, and GSE103552 included 20 GDM samples and 17 control samples. RNAseq data, clinical information, copy number variation (CNV) data, simple nucleotide variation (SNV) data, and methylation data of 33 tumors were downloaded from the Cancer Genome Atlas (TCGA) database (https://portal.gdc.cancer.gov/) [13]. Expression data of normal tissues were downloaded from Genotype-Tissue Expression Project (GTEx) [14]. Drug susceptibility analysis data were downloaded from the Genomics of Cancer Drug Sensitivity database (https://www.cancerrxgene.org/) [15]. Breast cancer immune activity score data were downloaded from the Tracking Tumor Immunophenotype (TIP) database (http://biocc.hrbmu.edu.cn/TIP/) [16]. The immunophenoscore (IPS) score data used in the immunotherapy prediction analysis was downloaded from the Cancer Immunome Atlas (TCIA) database (https://tcia.at/home) [17]. The flowchart of this study is shown in Supplementary Fig. 1.
2.2 Identification and Functional Enrichment Analysis of Differentially Expressed Genes (DEGs)
Data analysis was performed in R (https://www.r-project.org). The limma package (version 3.40.6) was used for differential gene expression analysis. The dataset was screened using the criteria of fold change greater than 1.2 and p < 0.05 to obtain DEGs between different comparison groups and the control group [18]. The clusterProfiler package was used to perform Gene Ontology (GO) and Kyoto Encyclopedia of Genes and Genomes (KEGG) pathway enrichment analysis on GDM DEGs. GO enrichment analyses in biological processes (BP), cellular components (CC) and molecular functions (MF) were performed separately [19]. p < 0.05 was considered statistically significant, and the results were visualized with the DOSE package.
2.3 Construction of Protein-Protein Interaction Network and Screening and Validation of Hub Gene
Using the online server string database [20], a protein interaction network of DEGs was constructed, and protein-protein interaction (PPI) networks with a combined score greater than 0.9 were output, which were displayed using Cytoscape. Cytoscape plugin cytohubba was used to screen the top 10 genes ranked by degree as hub genes [21]. Based on the CIBERSORT algorithm, the correlation between hub genes and immunity was calculated. In addition, the GSE103552 dataset was used to validate the expression differences of these hub genes.
2.4 Differential Expression and Survival Analysis of Hub Gene Protein Tyrosine Kinase 2 (PTK2) in Pan-Cancer
Samples from TCGA and GTEx were annotated and merged in R. The expression levels of PTK2 in different cancers were then extracted and visualized. Expression levels of PTK2 in 30 normal tissues from the GTEx database were also compared. GENT2, a database that compares gene expression in normal and tumor tissues, was used to compare the pan-tissue PTK2 expression in normal and tumor tissues on the GPL96 platform (HG-U133A) [22]. GEPIA2, a tool for gene expression and survival analysis of TCGA and GTEx data [23], was used to perform analyses of overall survival (OS) and relapse-free survival (RFS) in 33 cancers based on PTK2 expression levels. The Group cutoff was set to median and the significance level was set to 0.05.
2.5 Mutation, Methylation and Immune Correlates of PTK2 in Pan-Cancer
CNV data of 11,495 samples were downloaded from the TCGA database, and the data was processed using GISTIC 2.0 [24], and the gene copy number levels were expressed with the GISTIC score. Mutation types of homozygous and heterozygous amplifications and deletions were included. In addition, the maftools package was used to calculate the correlation of PTK2 expression with tumor mutational burden (TMB) and mutant-allele tumor heterogeneity (MATH) in 33 cancers, and p < 0.05 was considered statistically significant. In addition, the methylation dataset of cancers (Illumina HumanMethylation 450 k level 3) was downloaded from TCGA. A total of 14 cancers (THCA, KIRP, BLCA, LIHC, HNSC, BRCA, LUAD, PRAD, ESCA, KICH, LUSC, KIRC, STAD, COAD) with more than 10 pairs of tumors and adjacent non-tumor samples were included. Differential methylation, correlation of PTK2 methylation with mRNA expression levels and correlation between PTK2 methylation and OS in different cancers were analyzed. p-values were assessed using t test and further adjusted using the false discovery rate (FDR).
The TISIDB database, a database allowing users to explore the correlation between genes and tumor immune systems [25] was used to explore the correlation between PTK2 gene abundance in tumor-infiltrating lymphocytes (TILs) and PTK2 expression and methylation. Furthermore, given the strong correlation between PTK2 methylation and tumors, correlation between PTK2 methylation and chemokines, receptors, and three types of immunomodulators (immunosuppressants, immunostimulants and major histocompatibility complex (MHC)) was also analyzed. Based on single-sample gene set enrichment analysis (ssGSEA) of the gsva package (v1.40.1) in R [26], the correlation of tumor infiltration with PTK2 for 28 human immune cell phenotypes in the pan-cancer tumor microenvironment was assessed.
The ESTIMATE algorithm [27] was used to evaluate the immune score and stromal score of the PTK2 high and low expression groups in breast cancer patients. The correlation of PTK2 with 22 immune infiltrating cells was then calculated using the CIBERSORT algorithm [28]. In addition, the ssGSEA algorithm was used to evaluate the correlation between PTK2 and immune cell infiltration in breast cancer [29]. Breast cancer immune activity score data was downloaded from the TIP database, and the correlation between the high and low expression groups of PTK2 and breast cancer immune activity scores was calculated. Expression values of 8 genes associated with immune checkpoints, SIGLEC15, TIGIT, CD274, HAVCR2, PDCD1, CTLA4, LAG3 and PDCD1LG2 [30], were extracted and analyzed based on high and low expression grouping of PTK2. In addition, immunophenotype scores (IPS) of high and low PTK2 expression groups in breast cancer patients were assessed. The clinical manifestations of 251 drugs in patients were analyzed using the pRRophetic package [31].
The biological significance of PTK2 in breast cancer was explored by dividing the TCGA-BRCA data into PTK2 high expression and PTK2 low expression groups, and the limma package was used to screen DEGs. Screening criteria were FDR < 0.01 and |logFC| > 1.5. The clusterProfiler package was used to analyze the functional enrichment of DEGs. In addition, the C5_bp dataset was downloaded from the GSEA website and GSEA analysis was performed on the DEGs.
Quality assessment and PCA (Principal Component Analysis) analysis were performed on GSE87295, and the results showed that the quality of the expression data in the GSE87295 dataset was in line with the subsequent analysis. The PCA analysis results showed that GSE87295 had a greater degree of discrimination between the GDM group and the control group (Figs. 1A and 1B). The differential analysis identified a total of 507 up-regulated and 364 down-regulated genes (Fig. 1C). The expression profile of the top 30 up- and down-regulated genes was extracted and visualized using a heatmap (Fig. 1D).
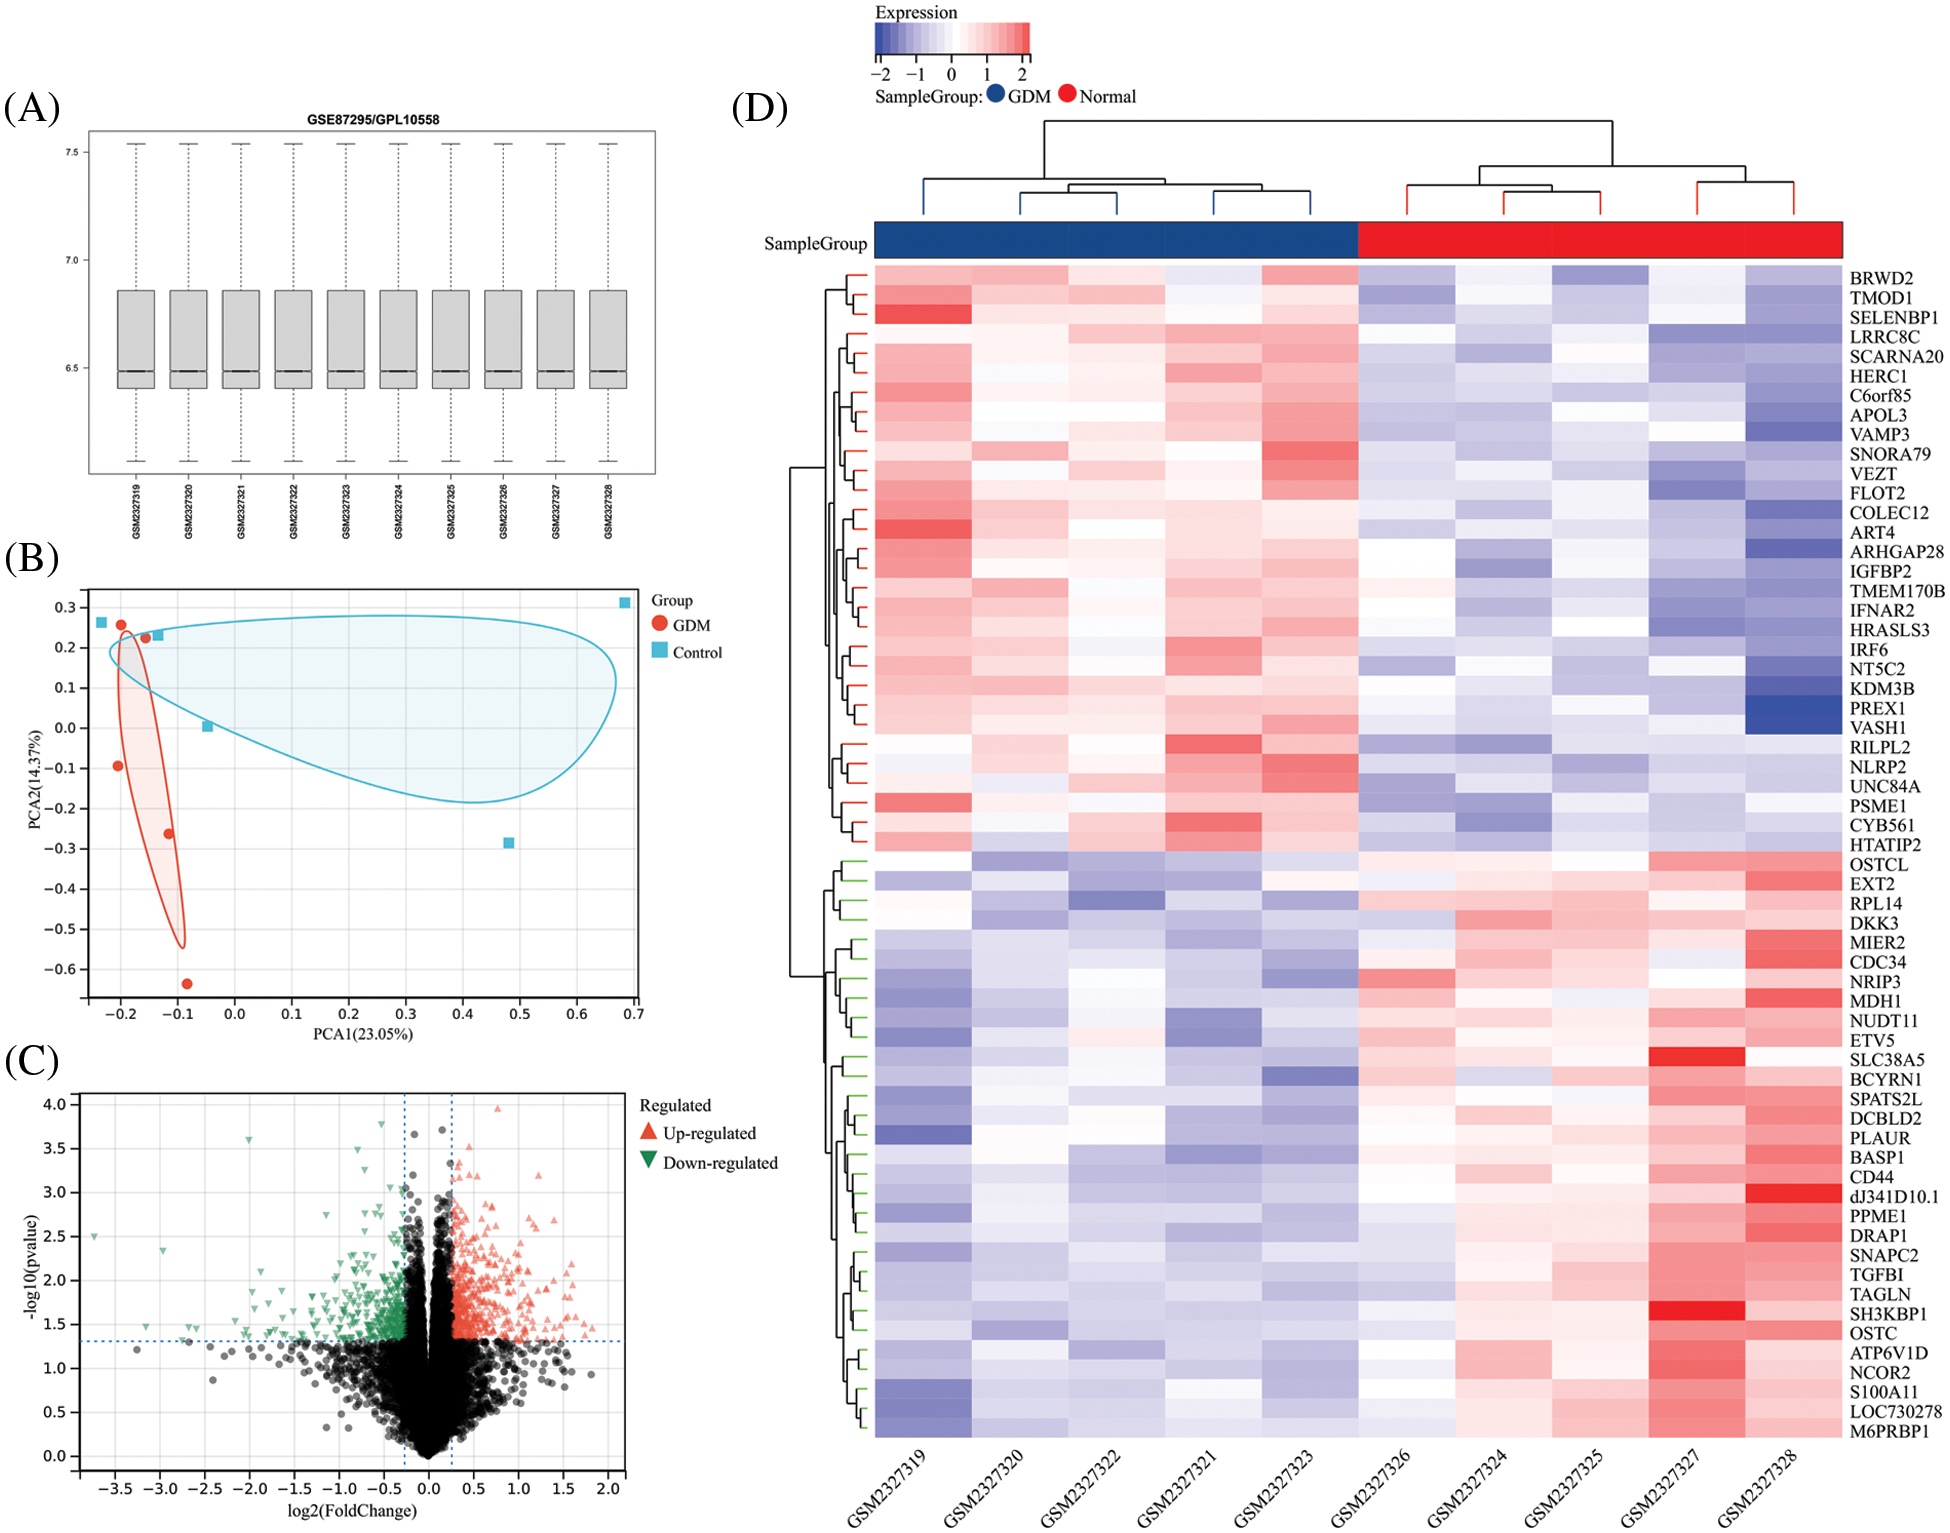
Figure 1: (A) Overall gene expression levels per sample for GSE87295; (B) PCA analysis results of GSE87295; (C) The volcano plot of DEGs; (D) Expression heatmap of the top 30 up-and down-regulated DEGs
To better understand the biological implications of the 871 DEGs, GO and KEGG functional enrichment analyses (Figs. 2A and 2B) were performed. For BP, differential genes were significantly enriched in cell migration, including ameboidal-type cell migration and epithelial cell migration. For CC, DEGs were significantly enriched in cell-substrate junction and focal adhesion. For MF, DEGs were significantly enriched in protein serine/threonine kinase inhibitor activity and actin binding, and Shao et al. confirmed the strong association of phosphorylation of serine/threonine residues in insulin receptors with GDM [32]. In addition, KEGG analysis found that the DEGs were mainly enriched in axon guidance and focal adhesion.
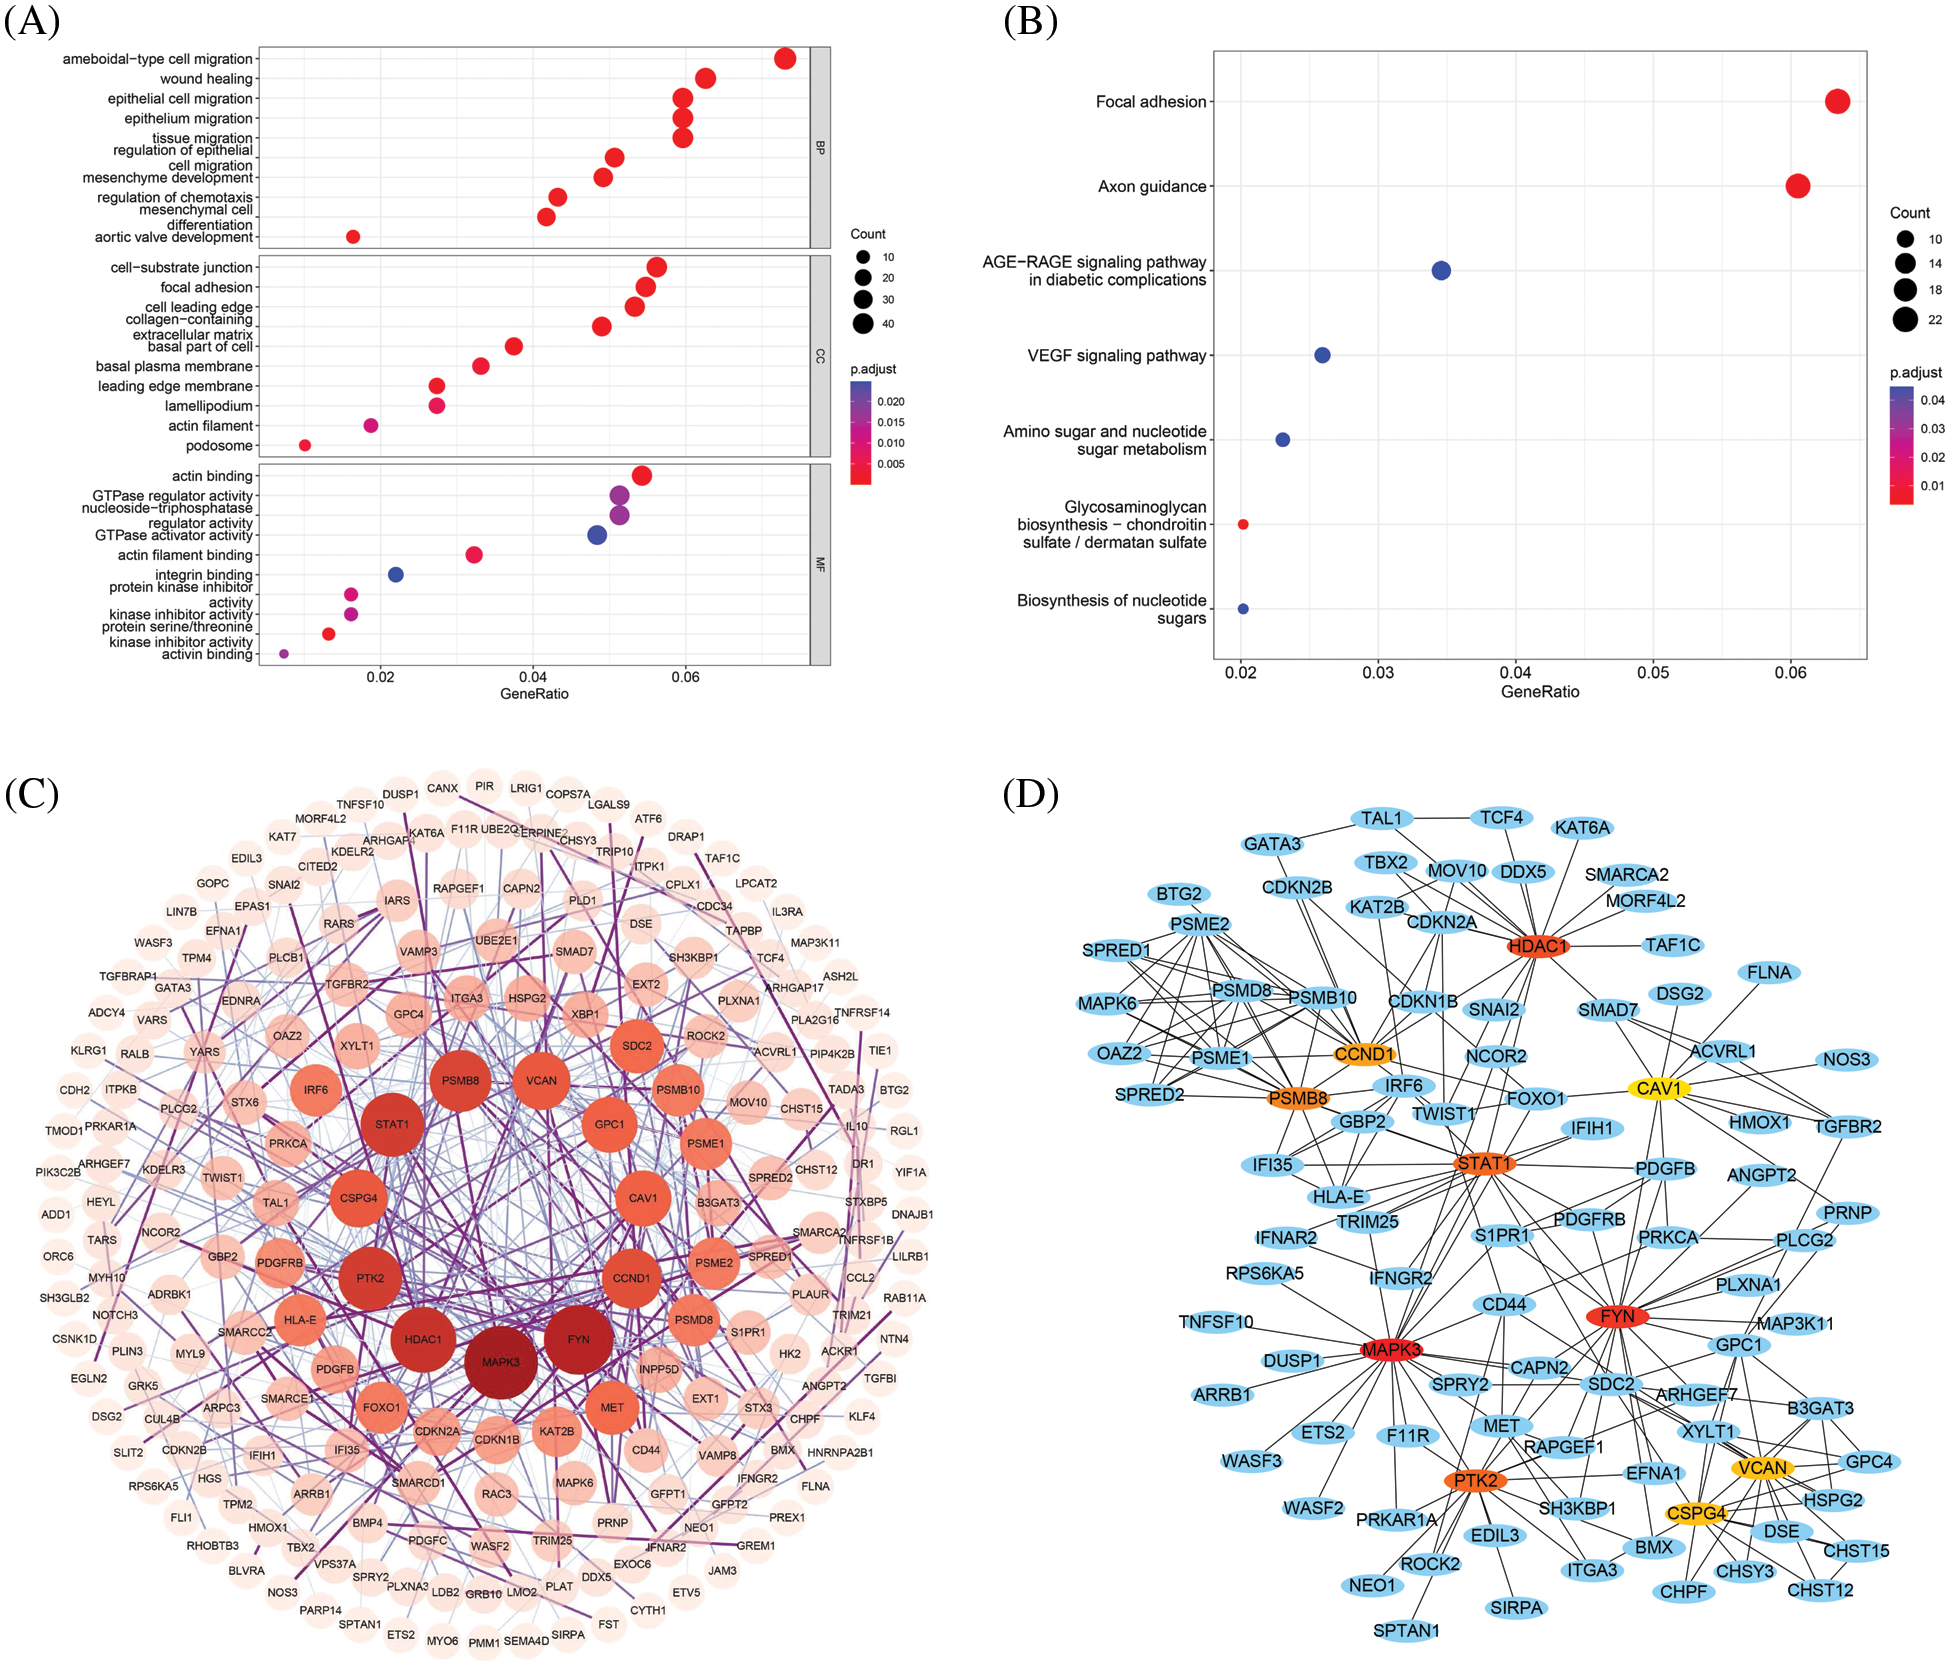
Figure 2: (A) GO enrichment analysis of DEGs (including biological process, cellular component and molecular function); (B) Enriched KEGG biological pathways; (C) PPI network diagram of DEGs, darker colors and larger circles represent larger degree values; (D) PPI network diagram of hub genes, where red represents up-regulated genes and green represents down-regulated genes
3.2 Construction of PPI Network, Screening of Hub Genes and Validation
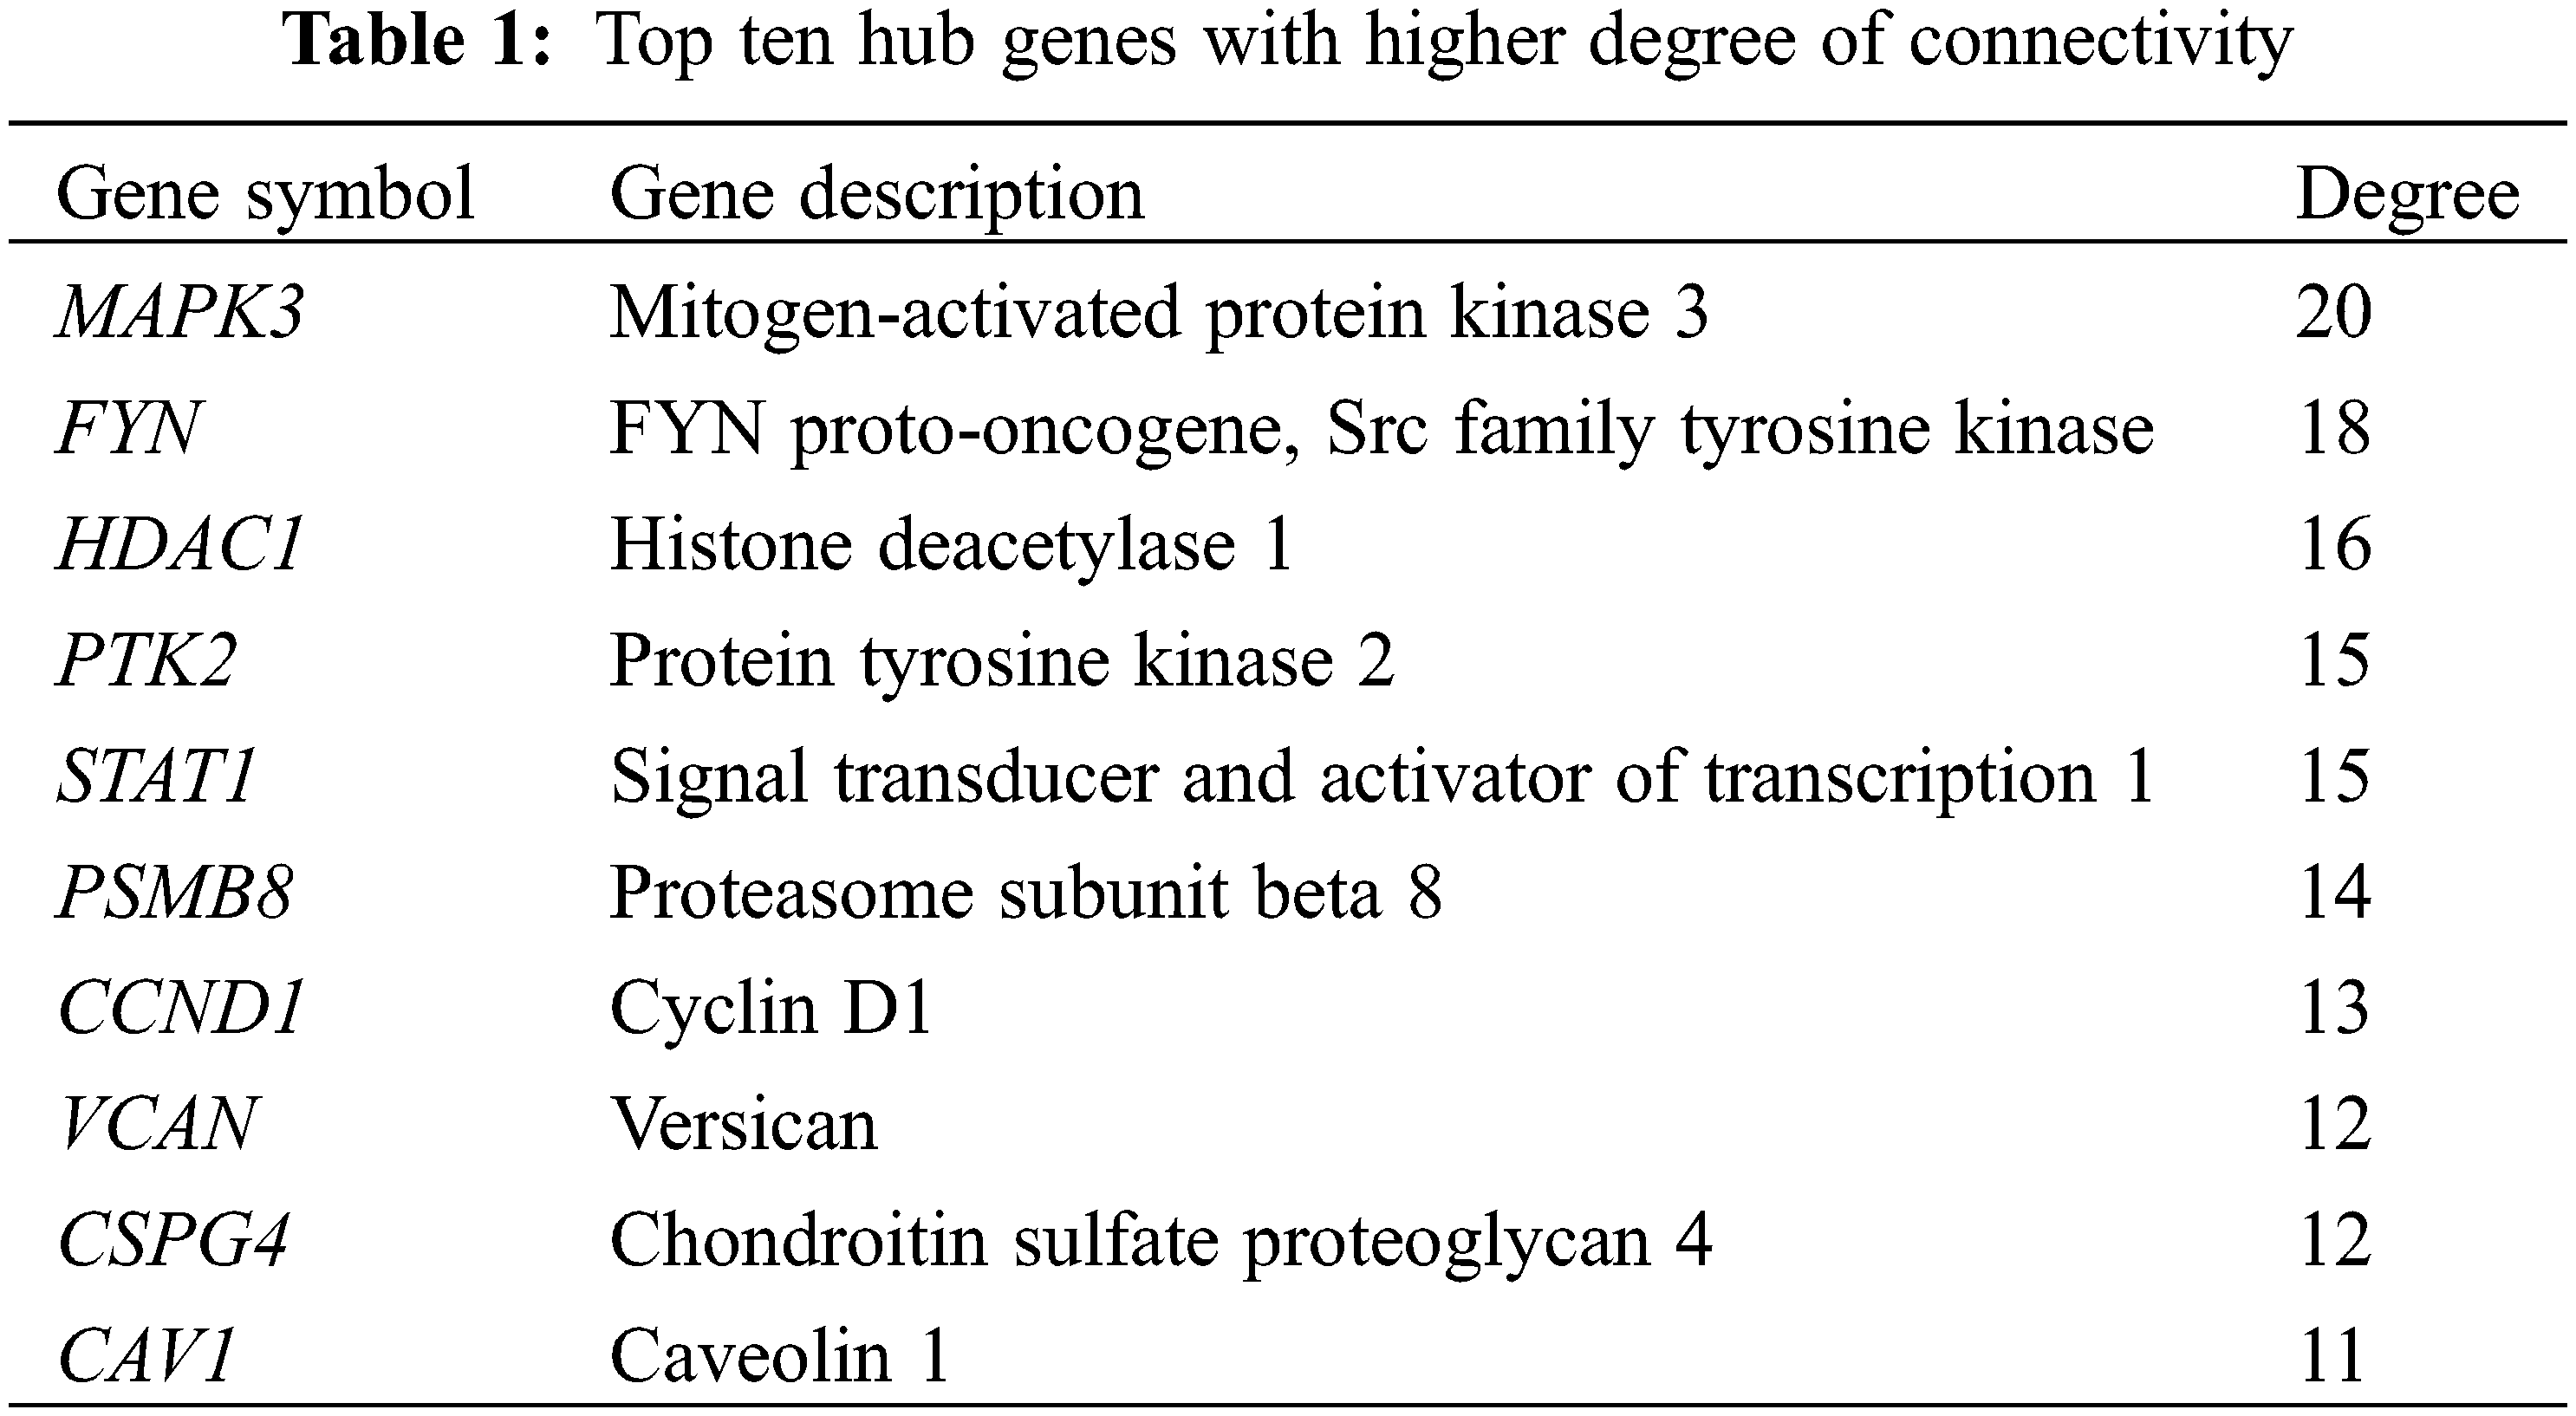
Using the string database, a network of potential interactions of the DEGs of GDM at the protein level was constructed. The PPI network of DEG consisted of 784 nodes and 442 edges, and the average node degree was 1.13. Cytoscape was used to display the PPI (Fig. 2C), and Cytoscape plugin CytoHubba was used to screen the hub genes, and the top 10 genes in degree were obtained as hub genes and displayed in the PPI network (Fig. 2D, Table 1).
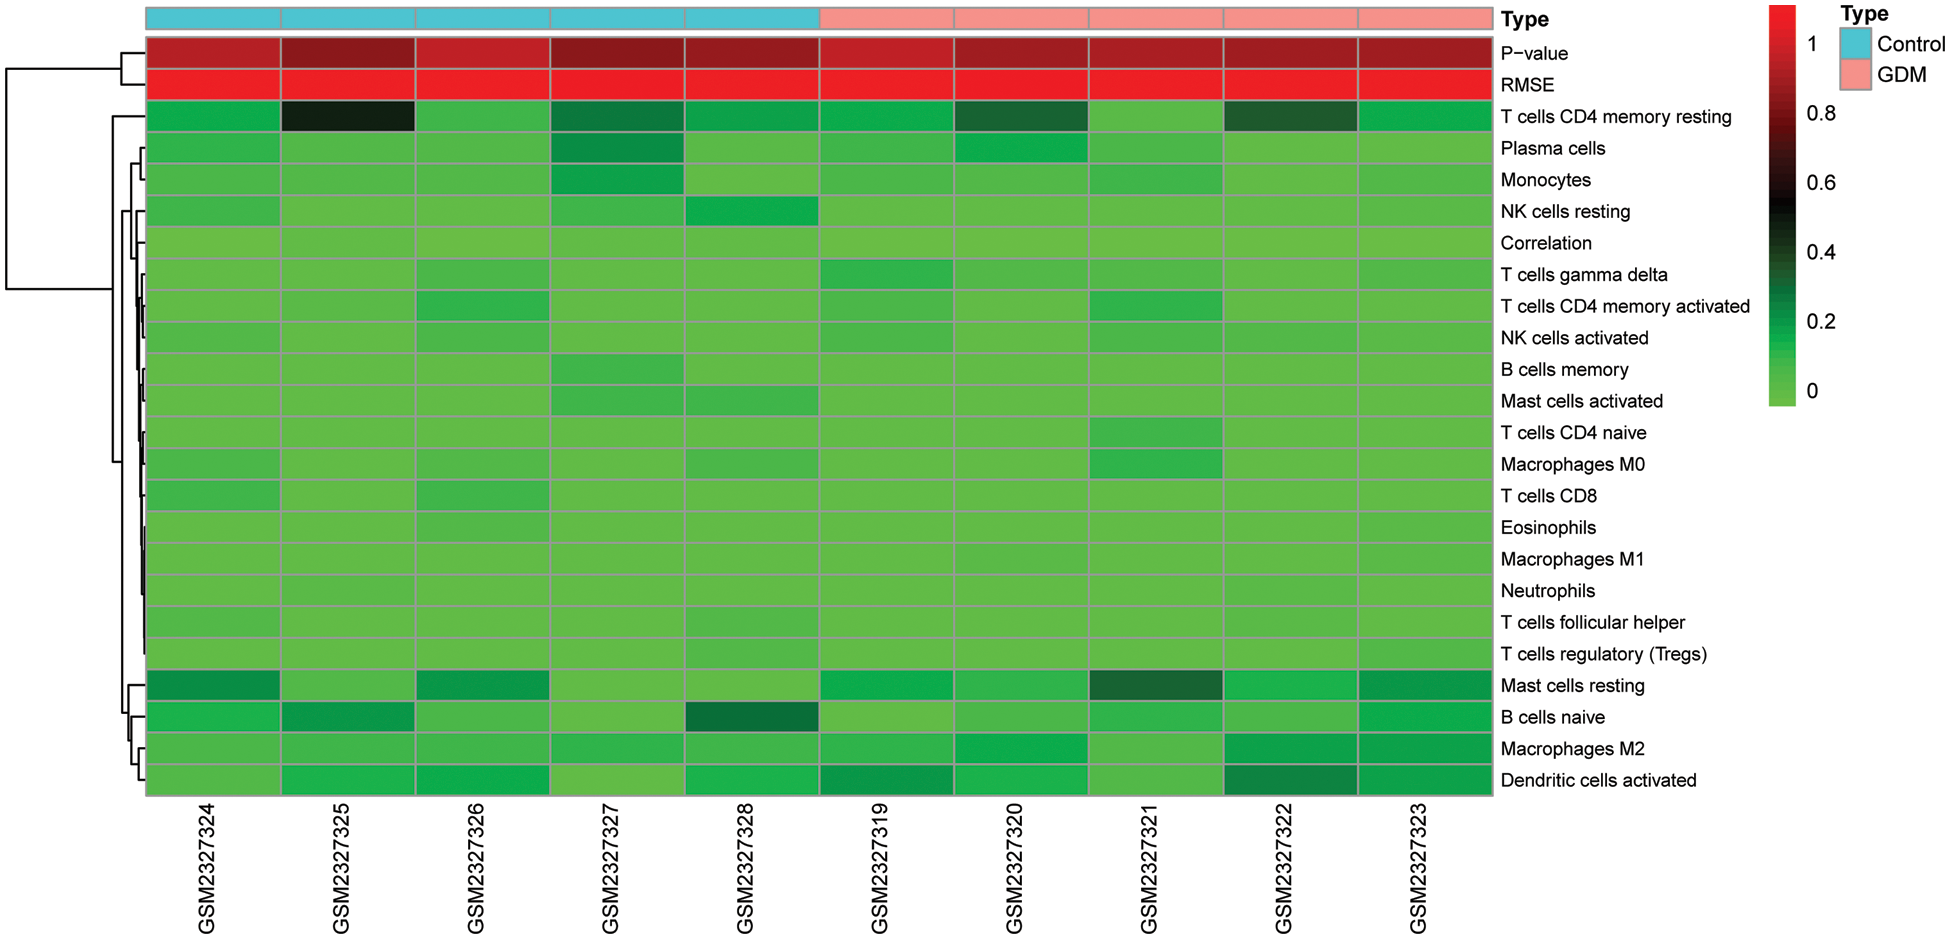
The level of immune cell infiltration in each sample in GSE87295 (Fig. 3D) was assessed based on the CIBERSORT algorithm. There were differences in the levels of immune cell infiltration between samples, but there was no significant difference in the level of immune cell infiltration between the GDM group and the control group (Supplementary Fig. 2). The correlation between hub genes and immune cell infiltration was then analyzed, and the results showed that the hub genes identified had strong correlations with NK cells resting and mast cells activated (Fig. 3C). In addition, the hub gene had a strong correlation with immune checkpoint genes CD44, CD276 and TNFRSF14. These results suggest that immune-related effects may play a major role in the occurrence and development of GDM (Fig. 3A). A comprehensive analysis found that there was a strong correlation between PTK2 and GDM immunity (Fig. 3B).
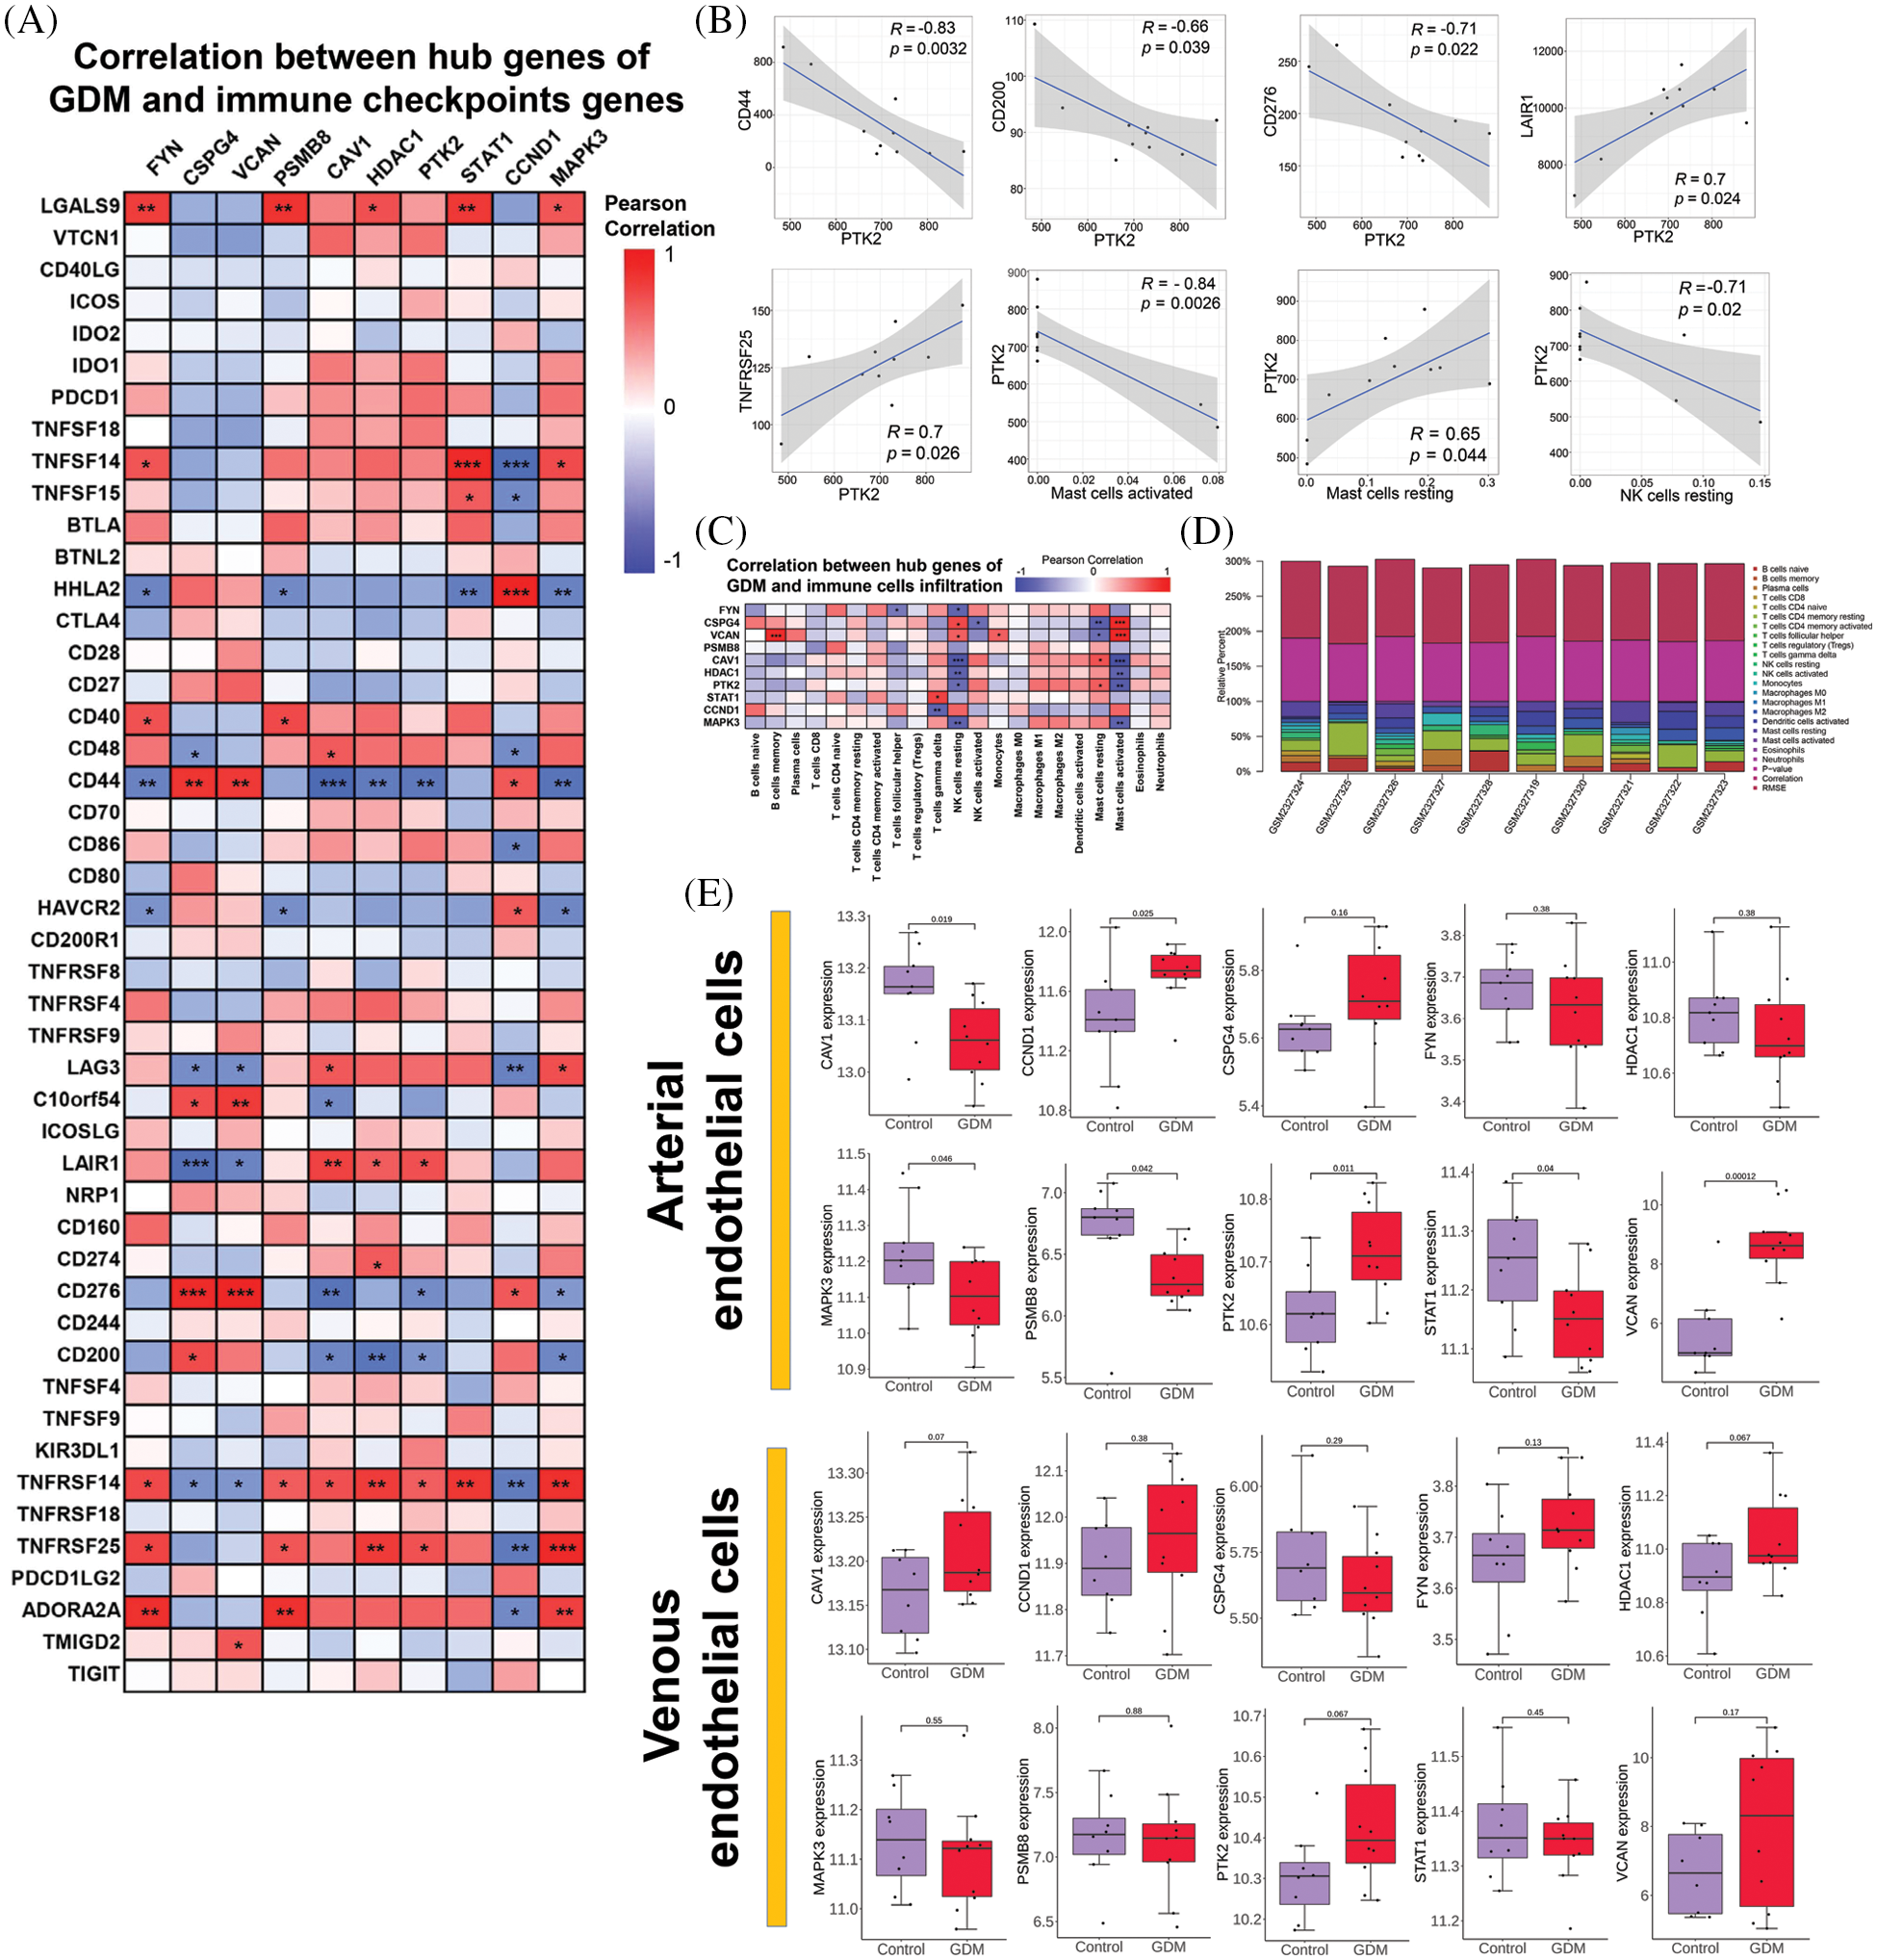
Figure 3: (A) Correlation between hub genes of GDM and immune checkpoints genes; (B) Correlation of PTK2 with immune checkpoints genes and immune cell infiltration; (C) Correlation between hub genes of GDM and immune cells infiltration; (D) Immune cell infiltration levels per sample in GSE87295; (E) Verify the expression level of hub genes in GDM and control groups
In addition, GSE103552 was used to verify the differential expression of hub genes in GDM and control groups. The results showed that the PTK2 gene in arterial endothelial cells was significantly highly expressed in the GDM group, although there was no significant difference in the venous endothelial cells, a trend of high expression could still be observed in the GDM group (Fig. 3E).
3.3 PTK2 Differential Expression in Cancers and Correlation with Survival
The expression of PTK2 in normal tissues from GTEx data was analyzed, and the results showed that the PTK2 gene had the highest expression in blood vessels and the lowest expression in the blood. Then the differential expression of PTK2 in pan-cancer was analyzed. Compared with normal tissues, PTK2 showed high expressions in BRCA, CHOL, DLBC and other cancers, but low expressions in ACC, UCEC and UCS (Fig. 4A). This was confirmed by analysis of the GENT2 database, that PTK2 was significantly differentially expressed in multiple cancers compared with normal tissues (Fig. 4B), suggesting its importance in multiple cancers.
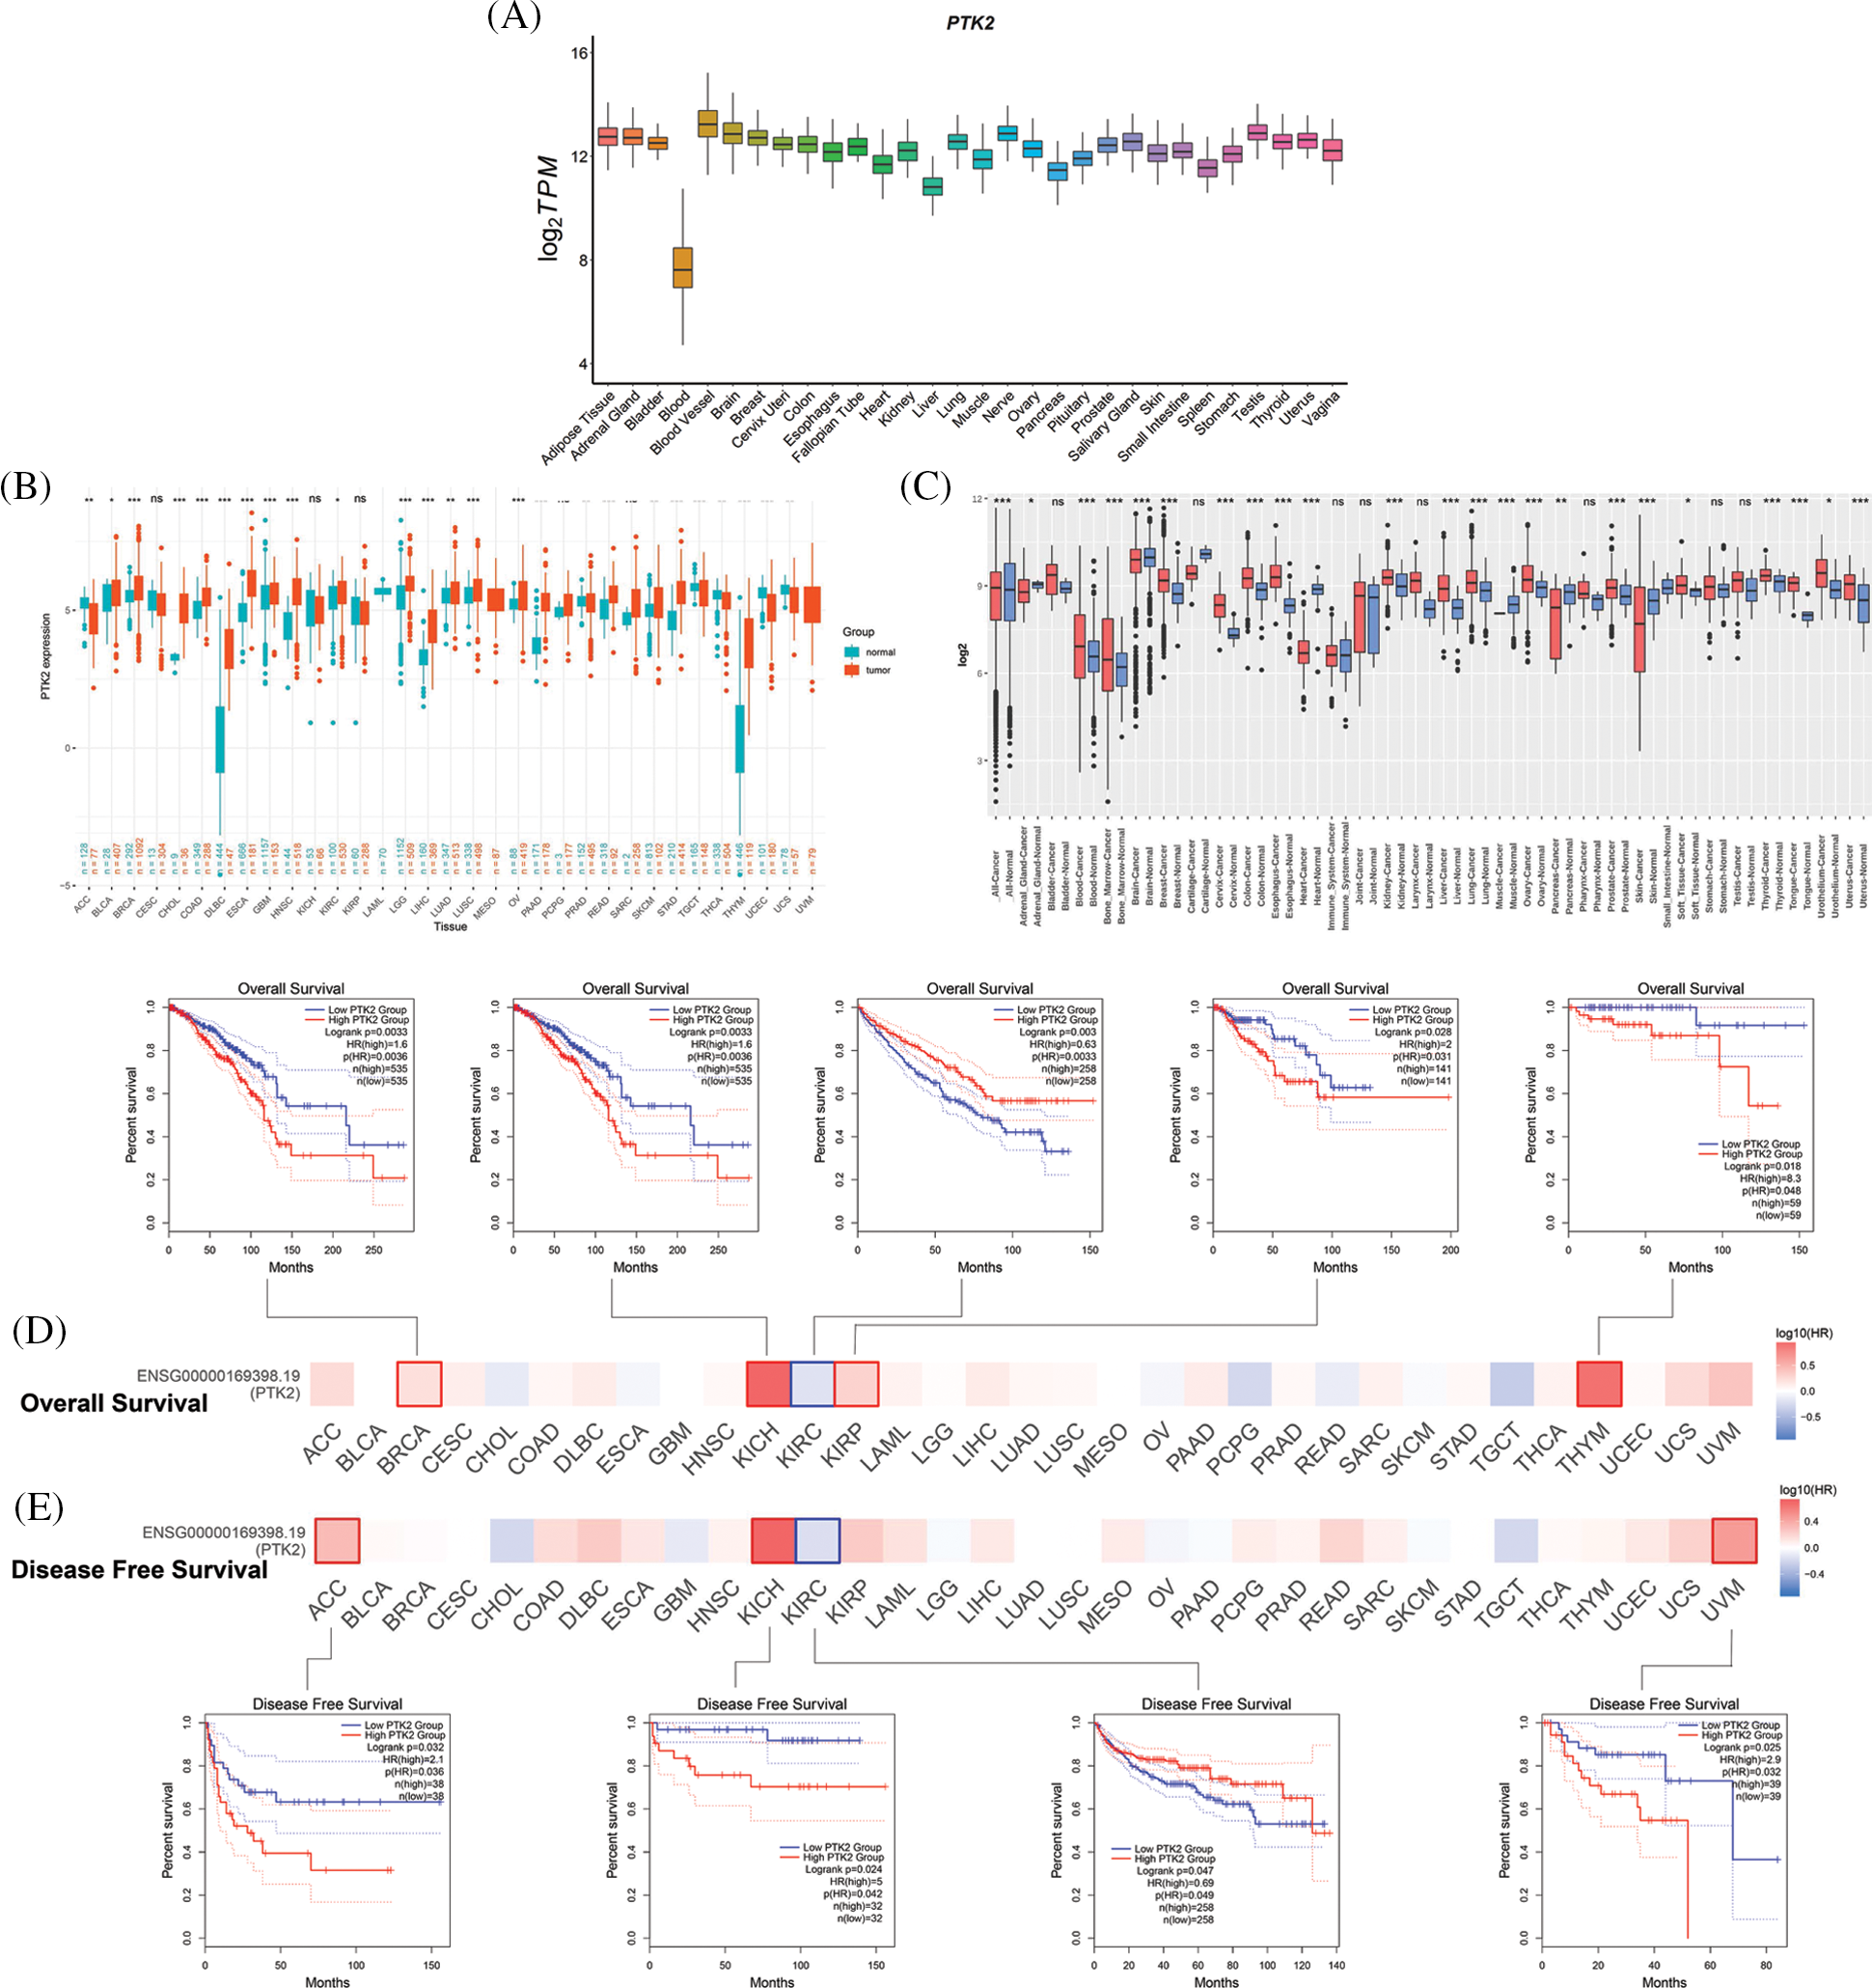
Figure 4: (A) Expression levels of PTK2 in normal tissues (GTEx); (B) Expression levels of PTK2 in cancer and normal tissues (TCGA + GTEx); (C) Expression levels of PTK2 in cancer and normal tissues (GENT2); (D) OS survival analysis of PTK2; (E) DFS survival analysis of PTK2
Survival analysis showed that lower overall survival (OS) in BRCA, KICH, KIRP, and THYM was significantly associated with higher PTK2 expression, whereas lower OS in KIRC was significantly associated with lower PTK2 expression (Fig. 4C). In addition, lower disease-free survival (DFS) in ACC, KICH and UVM was significantly associated with high PTK2 expression, while lower DFS in KIRC was significantly associated with low PTK2 expression (Fig. 4D). Taken together, PTK2 expression was significantly associated with poor prognosis in various cancers, including BRCA, KICH, and KIRC.
3.4 Mutation, Methylation, and Immune Correlates of PTK2 in Cancers
CNV of PTK2 in pan-cancer was analyzed. The main types of CNV analysis were homozygous amplification and deletion and heterozygous amplification and deletion. The pie chart shows the CNV of PTK2 in pan-cancer (Fig. 5A). PTK2 had a large amount of amplification in UVM, OV, HNSC and TGCT, and mainly heterozygous amplification. In addition to amplification, there were numerous deletions in SARC and UCS. The CNV of PTK2 was significantly positively correlated with mRNA expression in various cancers including OV and BRCA (Fig. 5D). These results suggest that CNVs of PTK2 may mediate their aberrant expression, which may play an important role in cancer progression. In addition, a significant positive correlation between PTK2 expression and TMB in COAD, BLCA, STAD and LUSC and a significant negative correlation with LAML, THYM and PAAD were observed. MATH analysis found that PTK2 expression was significantly correlated with BRCA, LGG, LUAD, THYM, LAML, SARC and COAD (Fig. 5B). These results suggest a strong association of PTK2 with immunotherapies such as PD-1/PD-L1 inhibitors. Compared with normal tissues, PTK2 had higher methylation levels in LUSC, PAAD, PRAD, COAD, BLCA, UCEC, BRCA, KIRP and KIRP and lower methylation levels in ESCA (Fig. 5C)). In addition, PTK2 methylation in cancers such as UVM, READ and BRCA showed a higher positive correlation with mRNA expression, but a lower negative correlation with LAML and OV (Fig. 6A). Survival analysis showed that low OS in LGG, LAML and KIRC was significantly associated with hypomethylation of PTK2, while low OS in SARC, LIHC and THCA was significantly associated with hypermethylation of PTK2 (Fig. 6B).
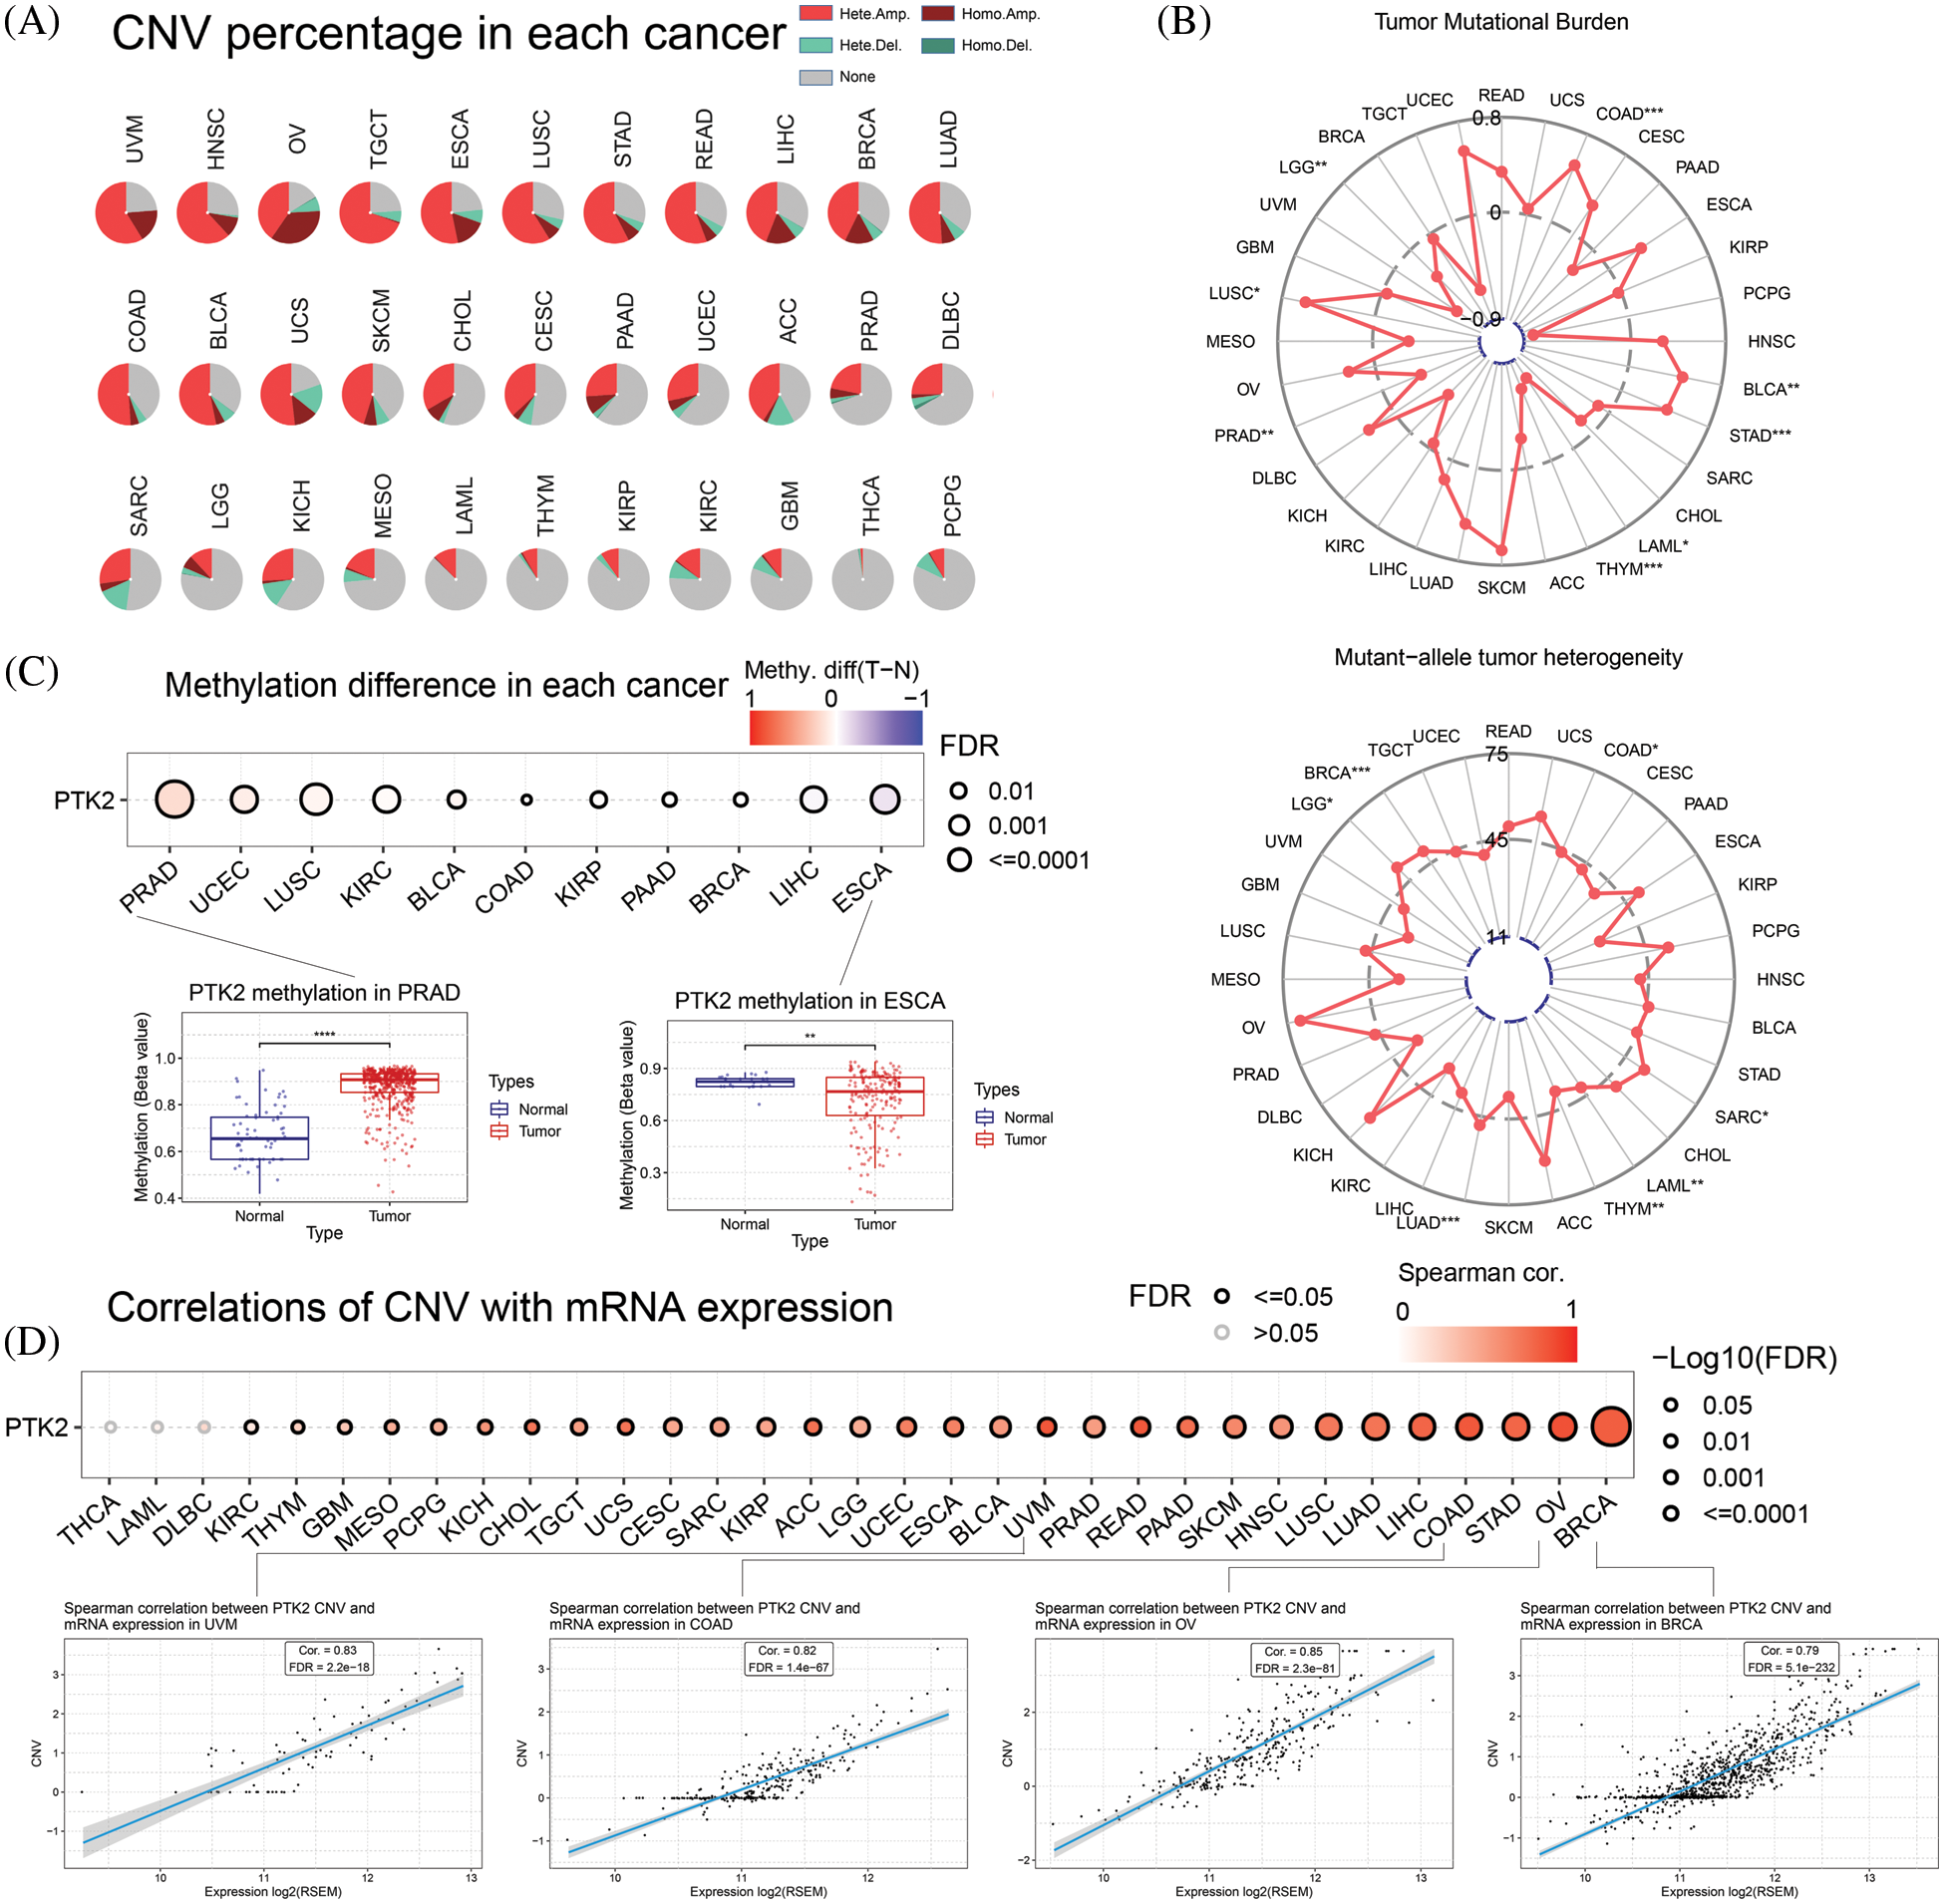
Figure 5: (A) CNV mutation of PTK2 in pan-cancer; (B) Correlation of PTK2 with TMB and MATH in pan-cancer; (C) PTK2 methylation difference in pan-cancer; (D) Correlations of CNV with mRNA expression
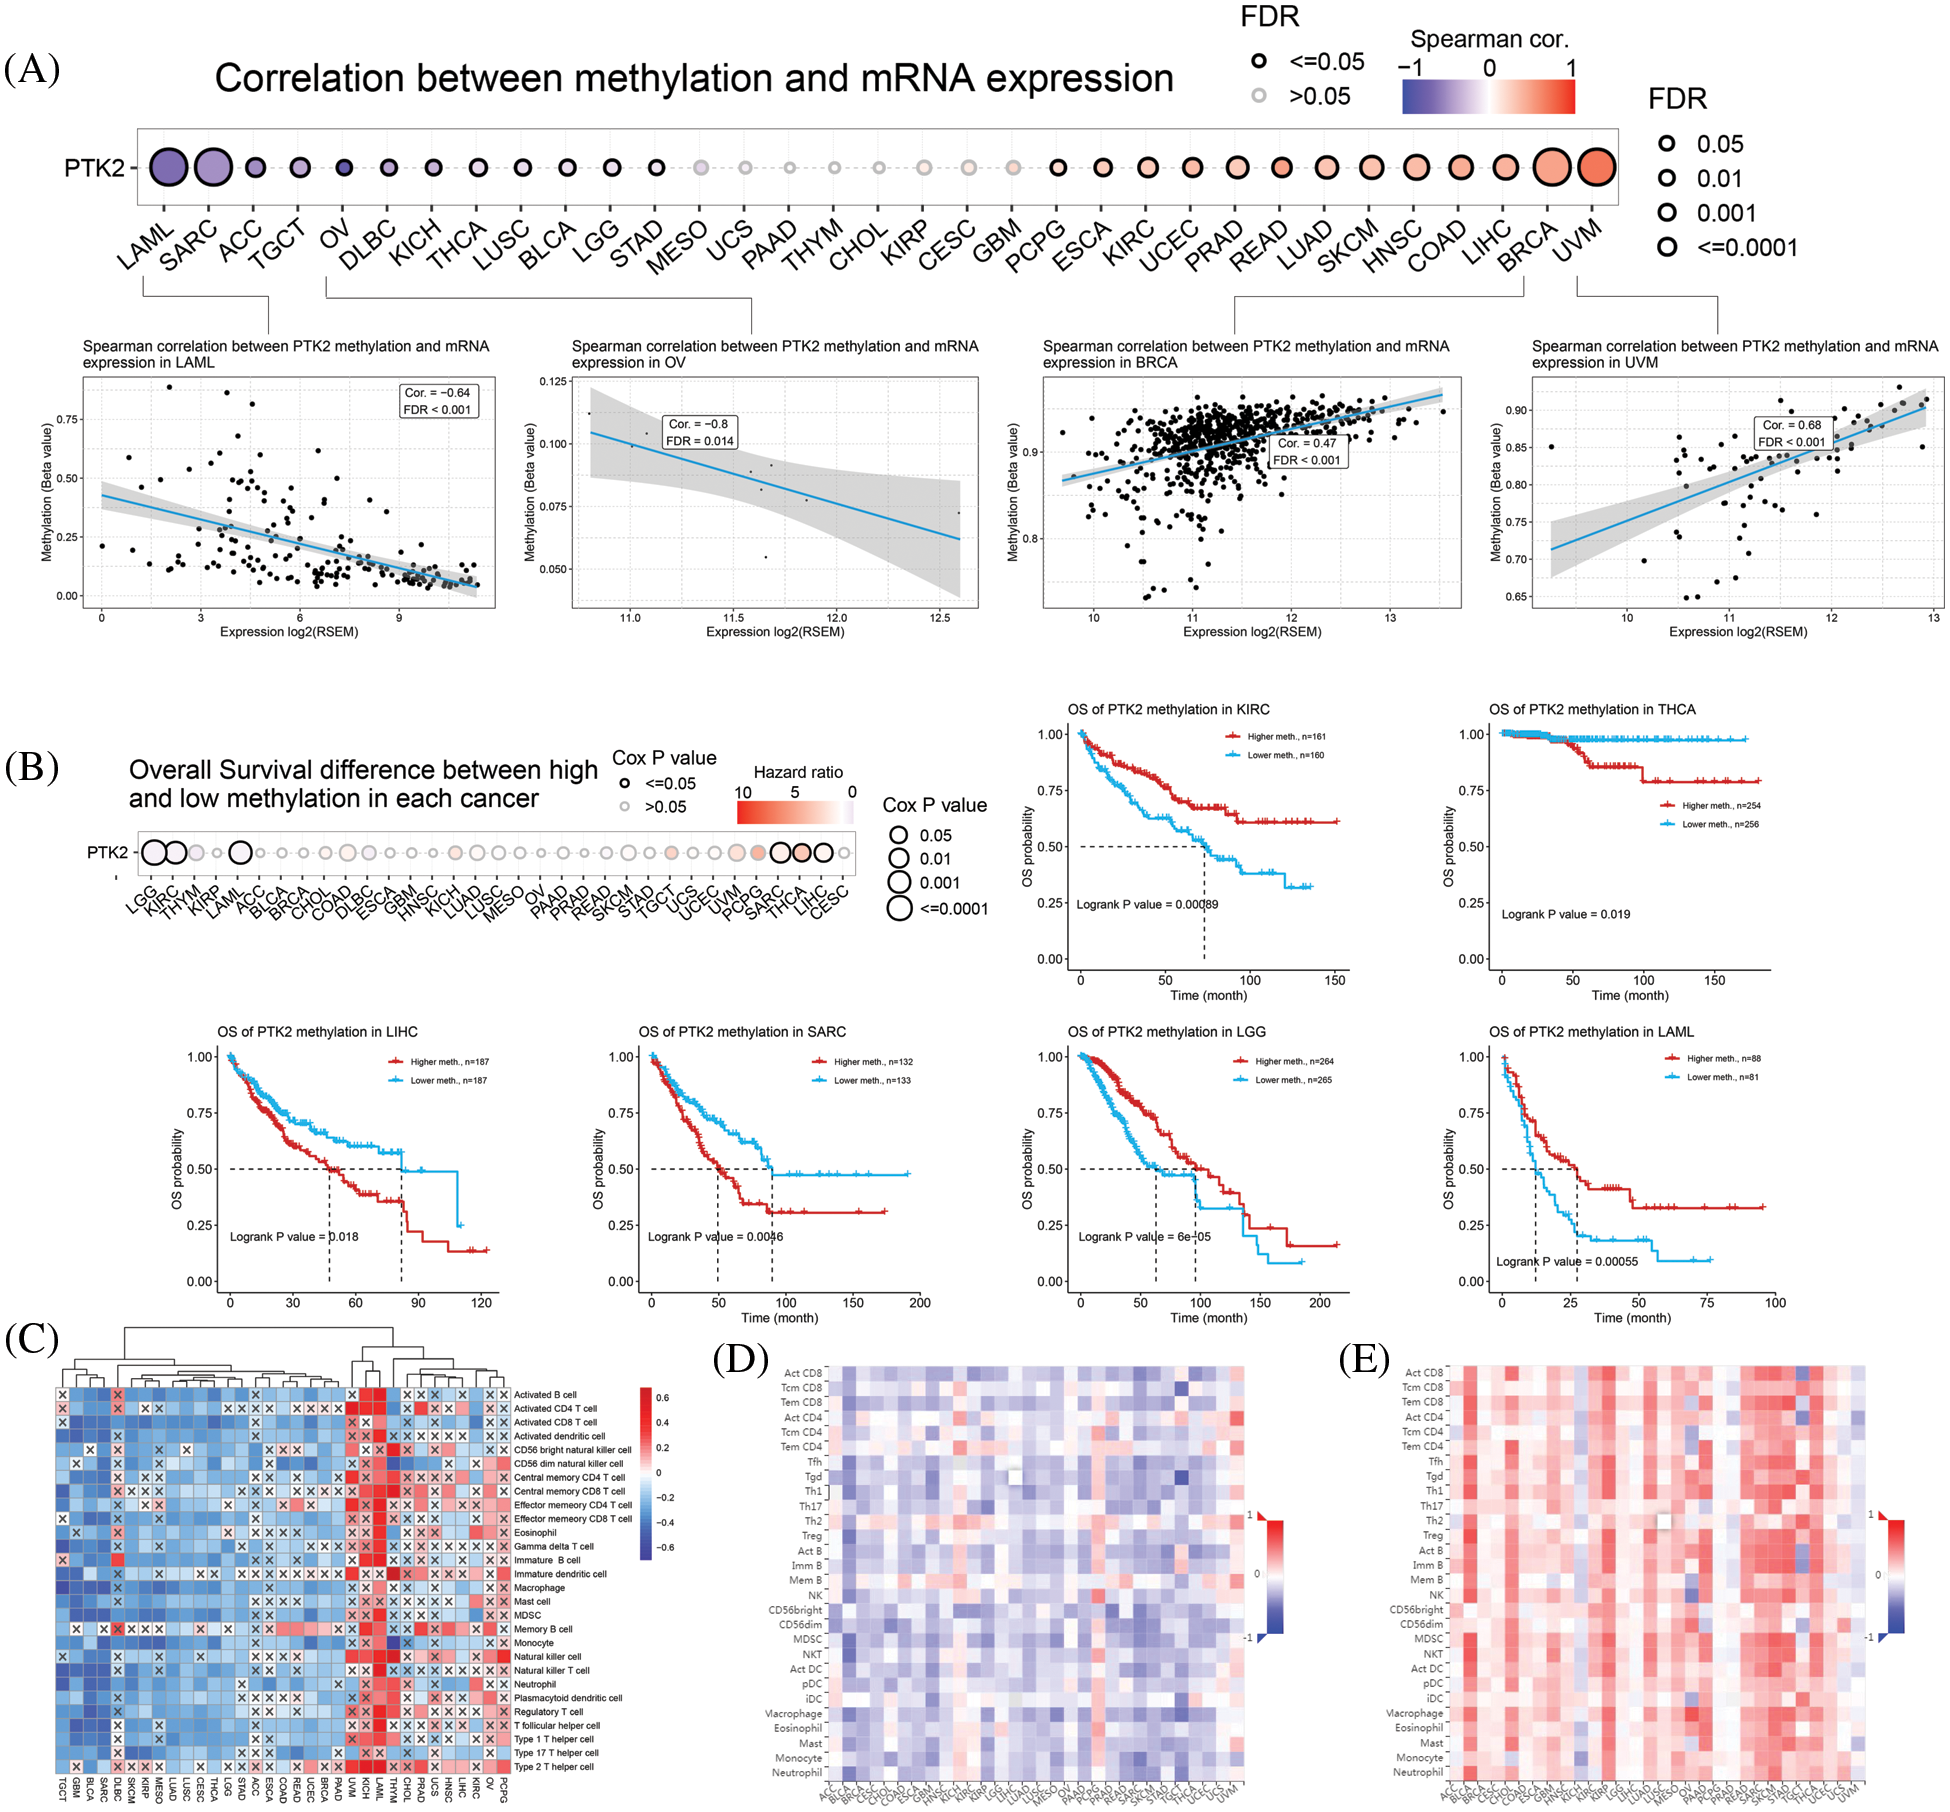
Figure 6: (A) Correlation between methylation and mRNA expression; (B) Overall survival difference between high and low methylation in pan-cancer; (C) ssGSEA analysis of the correlation between PTK2 and pan-cancer immune cell infiltration, where “×” represents p value > 0.05; (D) Correlation between PTK2 expression and tumor-infiltrating lymphocytes (TILs) in pan-cancer; (E) Correlation of PTK2 methylation with tumor-infiltrating lymphocytes (TILs) in pan-cancer
The correlation between PTK2 expression and methylation and tumor-infiltrating lymphocytes was assessed using TISIDB. The results showed that in most cancers, TIL exhibited a strong negative correlation with PTK2 expression and a strong positive correlation with PTK2 methylation (Figs. 6D and 6E). In addition, PTK2 methylation exhibited strong positive correlations with chemokines, receptors and three types of immunomodulators (immunosuppressants, immunostimulants and major histocompatibility complex (MHC)), suggesting a strong correlation between PTK2 methylation and immunity in various cancers (Supplementary Fig. 3). In addition, ssGSEA analysis revealed a significant negative correlation between PTK2 expression and immune cell infiltration in multiple cancers and a significant positive correlation in LAML (Fig. 6C).
Studies have shown a strong association between GDM and breast cancer. Breast cancer subtype analysis showed that PTK2 was most highly expressed in Luminal B subtypes and had the lowest expression levels in HER2-enriched (Fig. 7A). CIBERSORT algorithm was used to evaluate the correlation between PTK2 high and low expression groups and breast cancer immune infiltration. The results showed that PTK2 was significantly positively correlated with T cells CD4 memory resting and macrophages M1 immune cell infiltration, while significantly negatively correlated with B cells memory, NK cells activated, T cells CD8, and T cells regulatory (Tregs) immune cell infiltration (Fig. 7C). ssGSEA results showed that PTK2 was significantly negatively correlated with various immune cell infiltration (Fig. 7D). The TIP database was used to assess the ratio of anti-cancer immune status to tumor-infiltrating immune cells. Among them, the anti-cancer immune status was mainly divided into the following seven steps: release of cancer cell antigens (Step 1), cancer antigen presentation (Step 2), priming and activation (Step 3), trafficking of immune cells to tumors (Step 4), infiltration of immune cells into tumors (Step 5), recognition of cancer cells by T cells (Step 6), and killing of cancer cells (step 7) [16]. PTK2 was significantly associated with anti-cancer immune status (Fig. 7E). These results suggest a high correlation of PTK2 with immune cell infiltration in breast cancer.
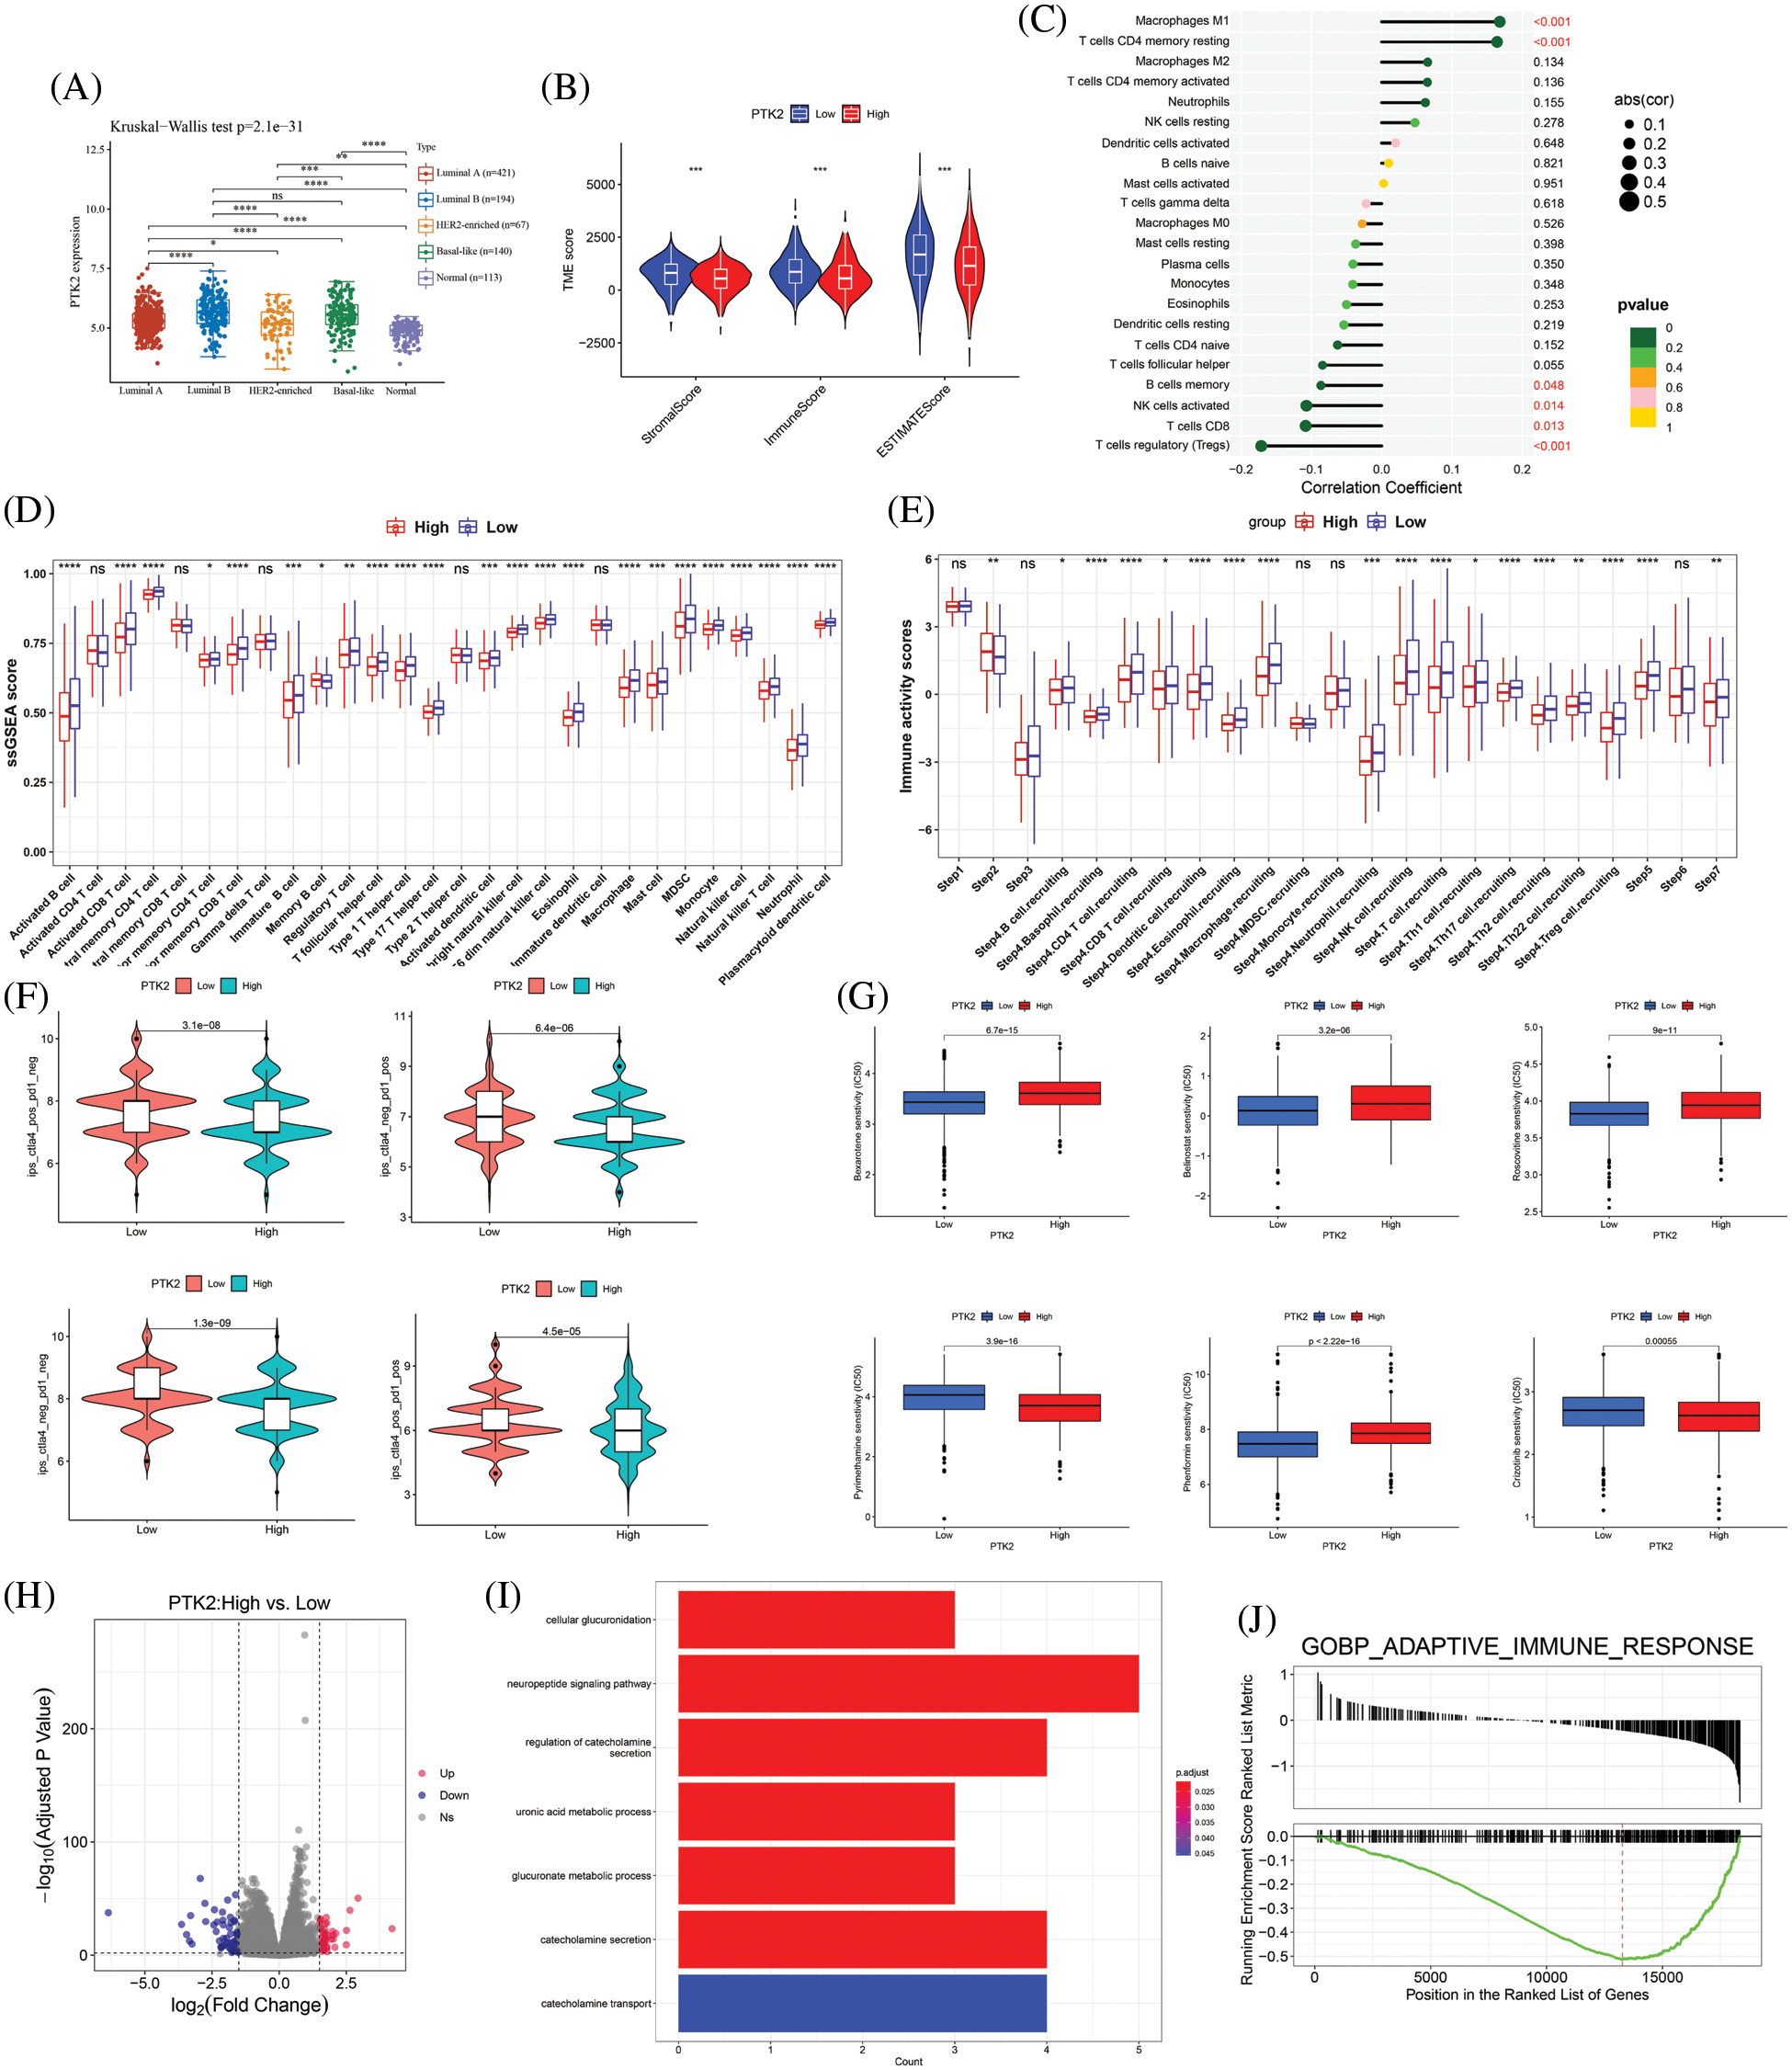
Figure 7: (A) Expression levels of PTK2 in different subtypes of breast cancer; (B) Correlation between PTK2 and immune and stromal scores in breast cancer; (C) Correlation of PTK2 and immune cell infiltration in breast cancer (CIBERSORT); (D) Correlation of PTK2 and immune cell infiltration in breast cancer (ssGSEA); (E) Correlation of PTK2 with tumor immunophenotype in breast cancer; (F) IPS score of high and low expression PTK2 group in breast cancer; (G) The relationship between PTK2 and drug sensitivity in breast cancer; (H) A volcano map of DEGs in breast cancer; (I) Functional enrichment analysis of DEGs in breast cancer; (J) GSEA enrichment analysis
By analyzing immune checkpoint molecules, it was found that the expression levels of immune checkpoint genes, including LAG3, PDCD1 and SIGLEC15, were higher in the PTK2-low expression group than the PTK2-high expression group (Supplementary Fig. 4). In addition, PTK2 expression was significantly negatively correlated with stromal and immune scores (Fig. 7B). These results suggest that the PTK2 low expression group may benefit from checkpoint immunotherapy. To assess the immune response in breast cancer patients, IPS score for PTK2 immunotherapy was calculated. The results showed that the PTK2 low expression group had a higher IPS score and was more sensitive to PD1 and CTLA4 immunotherapy (Fig. 7F). In addition, IC50 values for 251 drugs were analyzed. The results suggest patients with low PTK2 expression may respond positively to treatment with belinostat, bexarotene, phenformin and roscovitine. However, patients with high PTK2 expression may be more sensitive to crizotinib and pyrimethamine treatment (Fig. 7G). These results suggest that abnormal expression of PTK2 may mediate resistance to chemotherapy and targeted drug therapy.
To further understand the biological significance of PTK2 in breast cancer, differential gene analysis on the high and low expression groups of PTK2 in TCGA-BRCA was performed, and a total of 43 up-regulated and 52 down-regulated genes were obtained (Fig. 7H). Functional enrichment analysis revealed that the genes were mainly enriched in cellular glucuronidation, suggesting a strong association with blood glucose balance (Fig. 7I). GSEA analysis found that they were mainly in Adaptive_Immune_Response, suggesting a strong association with the immune system (Fig. 7J).
GDM affects the health of large numbers of women and newborn babies around the world. Modern research suggests that relative insulin deficiency and insulin resistance are important pathogenesis of GDM [6,7]. Therefore, specific endocrine and metabolic changes during pregnancy are also important factors in the development of GDM. GDM is often accompanied by other comorbidities, including gestational hypertension. In addition, numerous studies have shown that GDM is associated with an increased incidence of cancer [9–11]. Although a large number of observational studies have been devoted to addressing the impact of GDM on patients [33–35], there are few studies on the mechanism between GDM and cancer.
In this study, we performed differential gene expression analysis on GSE87295 (including 5 GDM samples and 5 control samples) and identified a total of 871 DEGs. Functional enrichment analysis showed that these genes were significantly enriched in cell migration, focal adhesion, protein serine/threonine kinase inhibitor activity and actin binding. Several studies have highlighted the importance of cell migration in GDM, In addition, studies have also confirmed the important role of cell migration in the development of GDM [36,37]. Studies by Zhu et al. have demonstrated the importance of cell-matrix junctions and focal adhesions in GDM [38,39]. The study of Wang et al. found that downregulation of PVT1 (long noncoding RNA) significantly inhibited the migration ability of trophoblast cells, thereby promoting the occurrence of GDM [40]. It can be seen that cell migration, especially the cell migration of placental trophoblasts, is particularly important in the occurrence and development of GDM. Furthermore, cell migration is equally important in cancer. Therefore, cell migration may be a common mechanism of GDM and cancer, leading to increased cancer incidence in GDM patients. We generated the protein interaction network of DEGs and screened out the top ten hub genes (Table 1). The immune correlation analysis of the hub gene found that the hub gene was strongly correlated with NK cells resting, mast cells activated, and immune checkpoint genes CD44, CD276 and TNFRSF14. These results suggest that the hub gene of GDM has a strong correlation with immunity, suggesting an association between immunity and GDM. Furthermore, a significant up-regulation trend of PTK2 was observed in GDM in the GSE103552 (containing 20 GDM samples and 17 control samples) dataset.
The angiogenic gene PTK2 encodes a cytoplasmic protein tyrosine kinase which is found concentrated in the focal adhesions that form between cells growing in the presence of extracellular matrix constituents. PTK2 plays an important role in regulating cell migration, adhesion, expansion and cell cycle progression. Given the differential expression of PTK2 in GDM and control, we analyzed the differential expression of PTK2 in pan-cancer, and the results showed that PTK2 was significantly differentially expressed in multiple cancers. Survival analysis showed that differential expression of PTK2 was significantly associated with poor prognosis in BRCA, KICH, THYM and other cancers. Mutational analysis revealed that PTK2 had amplification mutations in multiple cancers, and its abnormal expression was mediated by the CNV of PTK2, which may promote cancer progression. Methylation analysis found that differential methylation occurred in multiple cancer types, and differential methylation affected the prognosis of patients of multiple cancer types. ssGSEA analysis found a strong negative correlation between PTK2 and immune cell infiltration in multiple cancers. In addition, TISIDB analysis found that PTK2 expression was strongly negatively correlated with TIL and strongly positively correlated with methylation. In addition, PTK2 methylation exhibited strong positive correlations with chemokines, receptors and immunomodulators, and these results revealed a strong correlation between PTK2 methylation and immunity.
We further analyzed the role that PTK2 might play in breast cancer immunity. We calculated immune cell infiltration using CIBERSORT and ssGSEA algorithms, and the results showed that PTK2 had a strong negative correlation with immune cell infiltration such as T cells CD4 memory resting and NK cells activated in breast cancer. In addition, PTK2 expression was also significantly negatively correlated with stromal score and immune score, suggesting that PTK2 may affect tumor development through tumor microenvironment [41]. These results suggest that the PTK2 low expression group may benefit from immunotherapy. Immunotherapy analysis showed that the low-expression PTK2 group had higher IPS scores and was also more sensitive to PD1 and CTLA4 immunotherapy [42]. In addition, in order to further understand the biological significance of PTK2 in breast cancer, we performed differential expression analysis of PTK2 high and low expression groups, and performed GO enrichment analysis and GSEA analysis on the DEGs. The results showed that the functional enriched genes were mainly in cellular glucuronidation, suggesting a strong association with blood glucose balance. GSEA analysis found that these genes were mainly in Adaptive Immune Response, suggesting a strong correlation with the immune system.
There is growing evidence showing a close association between GDM and cancer [43,44]. Exploring the potential links between GDM and cancer and related biological mechanisms will provide new therapeutic ideas for GDM patients with cancer. Although our analysis used a variety of databases and algorithms, it still has some limitations. We did not study the association of PTK2 in GDM and cancer by biological experiments. Nonetheless, our study provides new insights into the association and development of GDM and cancer. It also provides new ideas for the subsequent exploration of common therapeutic targets for GDM and cancer.
In summary, our study identified PTK2 as a core gene in GDM that relates to immunity. Pan-cancer analysis showed that PTK2 was significantly highly expressed in various cancers compared with corresponding normal tissues and correlated with prognosis and immune cell infiltration, and has potential to serve as a novel biomarker for cancer patients. Thus, our study provided new ideas for understanding GDM and breast cancer. Furthermore, considering the relationship between GDM and breast cancer, PTK2 may serve as a common therapeutic target.
Abbreviations: GDM: Gestational Diabetes Mellitus; ACC: Adrenocortical carcinoma; BLCA: Bladder Urothelial carcinoma; BRCA: Breast invasive carcinoma; CESC: Cervical cancer; CHOL: Cholangiocarcinoma; COAD: Colon adenocarcinoma; DLBC: Diffuse Large B-cell Lymphoma; ESCA: Esophageal carcinoma; GBM: Glioblastoma multiforme; HNSC: Head and Neck squamous cell carcinoma; KICH: Kidney Chromophobe; KIRC: Kidney renal clear cell carcinoma; KIRP: Kidney renal papillary cell carcinoma; LAML: Acute Myeloid Leukemia; LGG: Brain Lower Grade Glioma; LIHC: Liver hepatocellular carcinoma; LUAD: Lung adenocarcinoma; LUSC: Lung squamous cell carcinoma; MESO: Mesothelioma; OV: Ovarian cancer; PAAD: Pancreatic adenocarcinoma; PCPG: Pheochromocytoma and Paraganglioma; PRAD: Prostate adenocarcinoma; READ: Rectum adenocarcinoma; SARC: Sarcoma; STAD: Stomach adenocarcinoma; SKCM: Skin Cutaneous Melanoma;TGCT: Testicular Germ Cell Tumors; THCA: Thyroid carcinoma; THYM: Thymoma; UCEC: Uterine Corpus Endometrial carcinoma; UCS: Uterine Carcinosarcoma; UVM: Uveal Melanoma.
Ethics Approval and Informed Consent Statement: Not applicable.
Acknowledgement: We would like to thank TopEdit (www.topeditsci.com) for its linguistic assistance during the preparation of this manuscript.
Authors’ Contributions: X.L Du, H. Shi, and J.F. Guo conceived the initial research project. H.Y. Liu, A.Q. Xie and L.H. Zhou performed the statistical analysis and explained the data together with J.F. Guo. J.F. Guo wrote the first draft of the manuscript. All authors have read and agreed to the published version of the manuscript.
Data Availability Statement: All data generated or analysed during the current study are included in this published article and its supplementary information files.
Funding Statement: The authors received no specific funding for this study.
Conflicts of Interest: The authors declare that they have no conflicts of interest to report regarding the present study
References
1. Johns, E. C., Denison, F. C., Norman, J. E., Reynolds, R. M. (2018). Gestational diabetes mellitus: Mechanisms, treatment, and complications. Trends in Endocrinology and Metabolism, 29(11), 743–754. DOI 10.1016/j.tem.2018.09.004. [Google Scholar] [CrossRef]
2. Murray, S. R., Reynolds, R. M. (2020). Short- and long-term outcomes of gestational diabetes and its treatment on fetal development. Prenatal Diagnosis, 40(9), 1085–1091. DOI 10.1002/pd.5768. [Google Scholar] [CrossRef]
3. Gao, C., Sun, X., Lu, L., Liu, F., Yuan, J. (2019). Prevalence of gestational diabetes mellitus in mainland China: A systematic review and meta-analysis. Journal of Diabetes Investigation, 10(1), 154–162. DOI 10.1111/jdi.12854. [Google Scholar] [CrossRef]
4. Buchanan, T. A., Xiang, A. H., Page, K. A. (2012). Gestational diabetes mellitus: Risks and management during and after pregnancy. Nature Reviews Endocrinology, 8(11), 639–49. DOI 10.1038/nrendo.2012.96. [Google Scholar] [CrossRef]
5. Chen, P., Wang, S., Ji, J., Ge, A., Chen, C. et al. (2015). Risk factors and management of gestational diabetes. Cell Biochemistry and Biophysics, 71(2), 689–694. DOI 10.1007/s12013-014-0248-2. [Google Scholar] [CrossRef]
6. Baz, B., Riveline, J. P., Gautier, J. F. (2016). Endocrinology of pregnancy: Gestational diabetes mellitus: Definition, aetiological and clinical aspects. European Journal of Endocrinology, 174(2), R43–51. DOI 10.1530/EJE-15-0378. [Google Scholar] [CrossRef]
7. Plows, J. F., Stanley, J. L., Baker, P. N., Reynolds, C. M., Vickers, M. H. (2018). The pathophysiology of gestational diabetes mellitus. International Journal of Molecular Sciences, 19(11), 3342. DOI 10.3390/ijms19113342. [Google Scholar] [CrossRef]
8. Siegel, R. L., Miller, K. D., Fuchs, H. E., Jemal, A. (2022). Cancer statistics, 2022. CA: A Cancer Journal for Clinicians, 72(1), 7–33. DOI 10.3322/caac.21708. [Google Scholar] [CrossRef]
9. Wang, Y., Yan, P., Fu, T., Yuan, J., Yang, G. et al. (2020). The association between gestational diabetes mellitus and cancer in women: A systematic review and meta-analysis of observational studies. Diabetes & Metabolism, 46(6), 461–471. DOI 10.1016/j.diabet.2020.02.003. [Google Scholar] [CrossRef]
10. Park, Y. M., O’Brien, K. M., Zhao, S., Weinberg, C. R., Baird, D. D. et al. (2017). Gestational diabetes mellitus may be associated with increased risk of breast cancer. British Journal of Cancer, 116(7), 960–963. DOI 10.1038/bjc.2017.34. [Google Scholar] [CrossRef]
11. Esposito, K., Chiodini, P., Colao, A., Lenzi, A., Giugliano, D. (2012). Metabolic syndrome and risk of cancer: A systematic review and meta-analysis. Diabetes Care, 35(11), 2402–2411. DOI 10.2337/dc12-0336. [Google Scholar] [CrossRef]
12. Barrett, T., Wilhite, S. E., Ledoux, P., Evangelista, C., Kim, I. F. et al. (2013). NCBI GEO: Archive for functional genomics data sets--update. Nucleic Acids Research, 41(D1), D991–995. DOI 10.1093/nar/gks1193. [Google Scholar] [CrossRef]
13. Linehan, W. M., Ricketts, C. J. (2019). The cancer genome atlas of renal cell carcinoma: Findings and clinical implications. Nature Reviews Urology, 16(9), 539–552. DOI 10.1038/s41585-019-0211-5. [Google Scholar] [CrossRef]
14. GTEx Consortium (2013). The genotype-tissue expression (GTEx) project. Nature Genetics, 45(6), 580–585. DOI 10.1038/ng.2653. [Google Scholar] [CrossRef]
15. Yang, W., Soares, J., Greninger, P., Edelman, E. J., Lightfoot, H. et al. (2013). Genomics of drug sensitivity in cancer (GDSCA resource for therapeutic biomarker discovery in cancer cells. Nucleic Acids Research, 41(D1), D955–961. DOI 10.1093/nar/gks1111. [Google Scholar] [CrossRef]
16. Xu, L., Deng, C., Pang, B., Zhang, X., Liu, W. et al. (2018). TIP: A web server for resolving tumor immunophenotype profiling. Cancer Research, 78(23), 6575–6580. DOI 10.1158/0008-5472.CAN-18-0689. [Google Scholar] [CrossRef]
17. Prior, F. W., Clark, K., Commean, P., Freymann, J., Jaffe, C. et al. (2013). TCIA: An information resource to enable open science. Annual International Conference of the IEEE Engineering in Medicine and Biology Society, 2013, 1282–1285. DOI 10.1109/EMBC.2013.6609742. [Google Scholar] [CrossRef]
18. Ritchie, M. E., Phipson, B., Wu, D., Hu, Y., Law, C. W. et al. (2015). Limma powers differential expression analyses for RNA-sequencing and microarray studies. Nucleic Acids Research, 43(7), e47. DOI 10.1093/nar/gkv007. [Google Scholar] [CrossRef]
19. Yu, G., Wang, L. G., Han, Y., He, Q. Y. (2012). ClusterProfiler: An R package for comparing biological themes among gene clusters. OMICS: A Journal of Integrative Biology, 16(5), 284–287. DOI 10.1089/omi.2011.0118. [Google Scholar] [CrossRef]
20. Szklarczyk, D., Gable, A. L., Nastou, K. C., Lyon, D., Kirsch, R. et al. (2021). The STRING database in 2021: Customizable protein-protein networks, and functional characterization of user-uploaded gene/measurement sets. Nucleic Acids Research, 49(D1), D605–D612. DOI 10.1093/nar/gkaa1074. [Google Scholar] [CrossRef]
21. Chin, C. H., Chen, S. H., Wu, H. H., Ho, C. W., Ko, M. T. et al. (2014). cytoHubba: Identifying hub objects and sub-networks from complex interactome. BMC Systems Biology, 8(Suppl 4), S11. DOI 10.1186/1752-0509-8-S4-S11. [Google Scholar] [CrossRef]
22. Park, S. J., Yoon, B. H., Kim, S. K., Kim, S. Y. (2019). GENT2: An updated gene expression database for normal and tumor tissues. BMC Medical Genomics, 12(Suppl 5), 101. DOI 10.1186/s12920-019-0514-7. [Google Scholar] [CrossRef]
23. Tang, Z., Kang, B., Li, C., Chen, T., Zhang, Z. (2019). GEPIA2: An enhanced web server for large-scale expression profiling and interactive analysis. Nucleic Acids Research, 47(W1), W556–W560. DOI 10.1093/nar/gkz430. [Google Scholar] [CrossRef]
24. Mermel, C. H., Schumacher, S. E., Hill, B., Meyerson, M. L., Beroukhim, R. et al. (2011). GISTIC2.0 facilitates sensitive and confident localization of the targets of focal somatic copy-number alteration in human cancers. Genome Biology, 12(4), R41. DOI 10.1186/gb-2011-12-4-r41. [Google Scholar] [CrossRef]
25. Ru, B., Wong, C. N., Tong, Y., Zhong, J. Y., Zhong, S. S. W. et al. (2019). TISIDB: An integrated repository portal for tumor-immune system interactions. Bioinformatics, 35(20), 4200–4202. DOI 10.1093/bioinformatics/btz210. [Google Scholar] [CrossRef]
26. Hänzelmann, S., Castelo, R., Guinney, J. (2013). GSVA: Gene set variation analysis for microarray and RNA-seq data. BMC Bioinformatics, 14, 7. DOI 10.1186/1471-2105-14-7. [Google Scholar] [CrossRef]
27. Ma, Q., Chen, Y., Xiao, F., Hao, Y., Song, Z. et al. (2021). A signature of estimate-stromal-immune score-based genes associated with the prognosis of lung adenocarcinoma. Translational Lung Cancer Research, 10(3), 1484–1500. DOI 10.21037/tlcr-21-223. [Google Scholar] [CrossRef]
28. Chen, B., Khodadoust, M. S., Liu, C. L., Newman, A. M., Alizadeh, A. A. (2018). Profiling tumor infiltrating immune cells with CIBERSORT. Methods in Molecular Biology, 1711, 243–259. DOI 10.1007/978-1-4939-7493-1. [Google Scholar] [CrossRef]
29. Xiao, B., Liu, L., Li, A., Xiang, C., Wang, P. et al. (2020). Identification and verification of immune-related gene prognostic signature based on ssGSEA for osteosarcoma. Frontiers in Oncology, 10, 607622. DOI 10.3389/fonc.2020.607622. [Google Scholar] [CrossRef]
30. Postow, M. A., Sidlow, R., Hellmann, M. D. (2018). Immune-related adverse events associated with immune checkpoint blockade. New England Journal of Medicine, 378(2), 158–168. DOI 10.1056/NEJMra1703481. [Google Scholar] [CrossRef]
31. Geeleher, P., Cox, N., Huang, R. S. (2014). pRRophetic: An R package for prediction of clinical chemotherapeutic response from tumor gene expression levels. PLoS One, 9(9), e107468. [Google Scholar]
32. Shao, J., Catalano, P. M., Yamashita, H., Ruyter, I., Smith, S. et al. (2000). Decreased insulin receptor tyrosine kinase activity and plasma cell membrane glycoprotein-1 overexpression in skeletal muscle from obese women with gestational diabetes mellitus (GDMEvidence for increased serine/threonine phosphorylation in pregnancy and GDM. Diabetes, 49(4), 603–610. [Google Scholar]
33. Song, Q., Wang, L., Liu, H., Liang, Z., Chen, Y. et al. (2021). Maternal GDM status, genetically determined blood glucose, and offspring obesity risk: An observational study. Obesity, 29(1), 204–212. [Google Scholar]
34. O’Malley, E. G., Reynolds, C. M. E., O’Kelly, R., McMahon, L., Sheehan, S. R. et al. (2020). The diagnosis of gestational diabetes mellitus (GDM) using a 75 g oral glucose tolerance test: A prospective observational study. Diabetes Research and Clinical Practice, 163, 108144. [Google Scholar]
35. Samsuddin, S., Arumugam, P. A., Md Amin, M. S., Yahya, A., Musa, N. et al. (2020). Maternal lipids are associated with newborn adiposity, independent of GDM status, obesity and insulin resistance: A prospective observational cohort study. BJOG: An International Journal of Obstetrics & Gynaecology, 127(4), 490–499. [Google Scholar]
36. Zhan, Y., Li, C., Chen, J., Yu, S., Gao, Q. et al. (2015). Association between macrophage migration inhibitory factor rs1007888 and GDM. Genetics and Molecular Research, 14(1), 797–804. [Google Scholar]
37. Zhang, L., Li, K., Tian, S., Wang, X. Q., Li, J. H. et al. (2021). Down-regulation of microRNA-30d-5p is associated with gestational diabetes mellitus by targeting RAB8A. Journal of Diabetes and its Complications, 35(8), 107959. [Google Scholar]
38. Zhu, W., Shen, Y., Liu, J., Fei, X., Zhang, Z. et al. (2020). Epigenetic alternations of microRNAs and DNA methylation contribute to gestational diabetes mellitus. Journal of Cellular and Molecular Medicine, 24(23), 13899–13912. [Google Scholar]
39. Qian, Y., Sun, H., Xiao, H., Ma, M., Xiao, X. et al. (2017). Microarray analysis of differentially expressed genes and their functions in omental visceral adipose tissues of pregnant women with vs. without gestational diabetes mellitus. Biomedical Reports, 6(5), 503–512. [Google Scholar]
40. Wang, Q., Lu, X., Li, C., Zhang, W., Lv, Y. et al. (2019). Down-regulated long non-coding RNA PVT1 contributes to gestational diabetes mellitus and preeclampsia via regulation of human trophoblast cells. Biomedicine & Pharmacotherapy, 120, 109501. [Google Scholar]
41. Vitale, I., Manic, G., Coussens, L. M., Kroemer, G., Galluzzi, L. (2019). Macrophages and metabolism in the tumor microenvironment. Cell Metabolism, 30(1), 36–50. DOI 10.1016/j.cmet.2019.06.001. [Google Scholar] [CrossRef]
42. Zimmermann, P., Curtis, N. (2019). Factors that influence the immune response to vaccination. Clinical Microbiology Reviews, 32(2), e00084–18. DOI 10.1128/CMR.00084-18. [Google Scholar] [CrossRef]
43. Romero, R., Erez, O., Hüttemann, M., Maymon, E., Panaitescu, B. et al. (2017). Metformin, the aspirin of the 21st century: Its role in gestational diabetes mellitus, prevention of preeclampsia and cancer, and the promotion of longevity. American Journal of Obstetrics and Gynecology, 217(3), 282–302. DOI 10.1016/j.ajog.2017.06.003. [Google Scholar] [CrossRef]
44. Benioudakis, E., Karlafti, E., Bekiaridou, A., Didangelos, T., Papavramidis, T. S. (2021). Gestational diabetes, colorectal cancer, bariatric surgery, and weight loss among diabetes mellitus patients: A mini review of the interplay of multispecies probiotics. Nutrients, 14(1), 192. DOI 10.3390/nu14010192. [Google Scholar] [CrossRef]
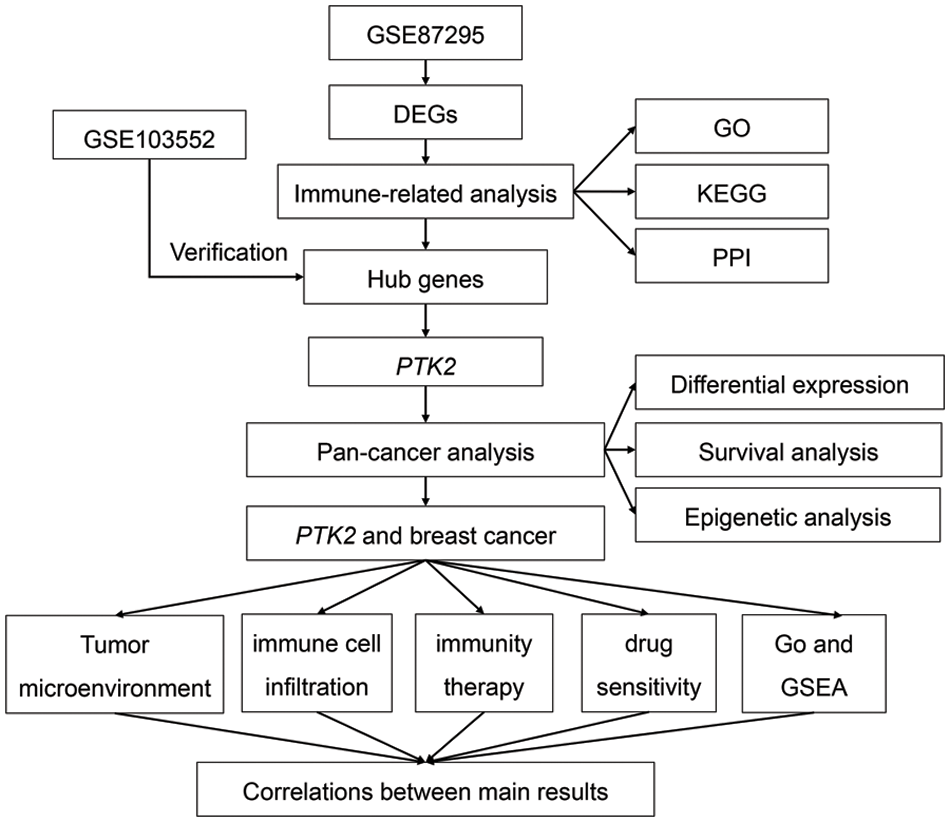
Supplementary Figure 1: The flowchart of this study
Supplementary Figure 2: Comparison of immune cell infiltration in GDM and control groups
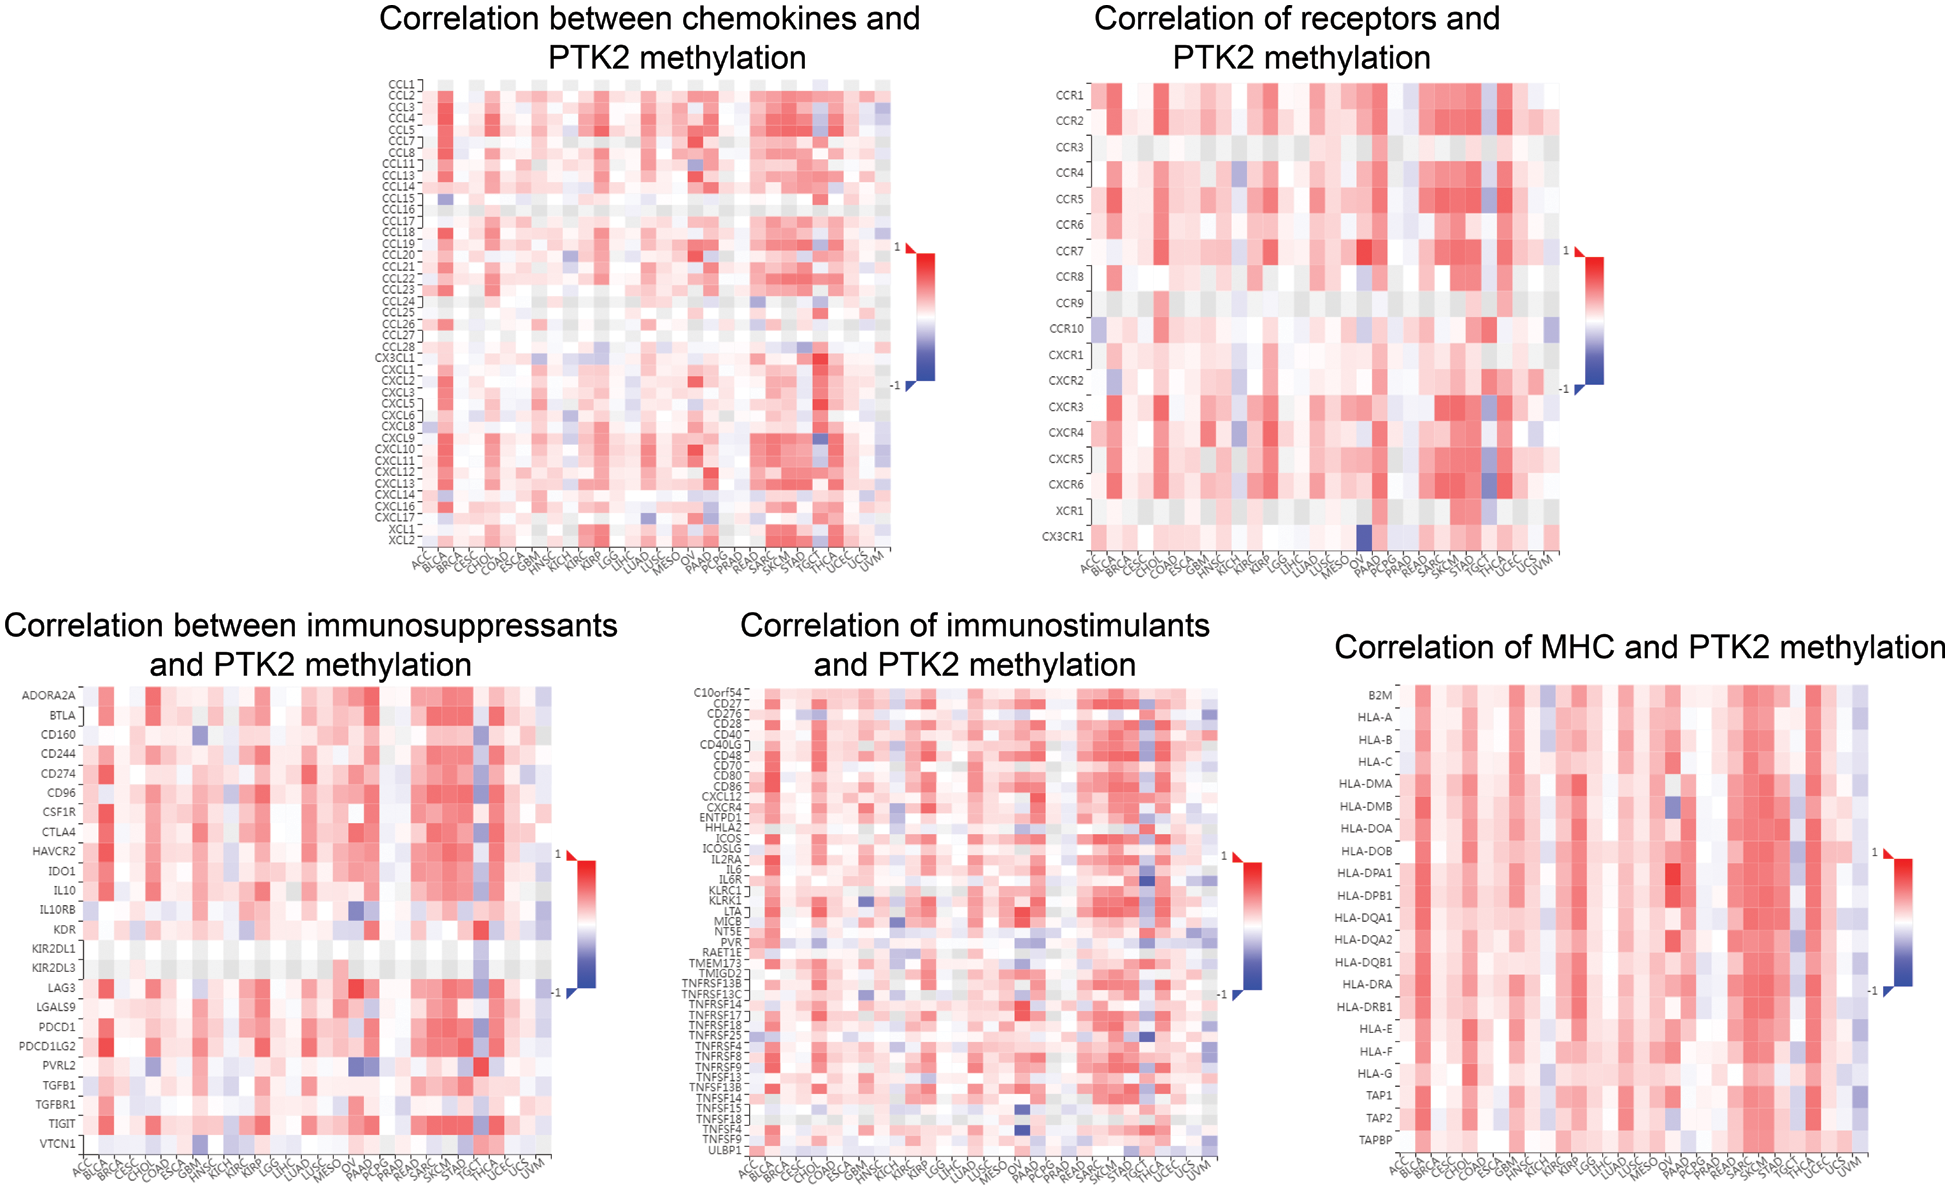
Supplementary Figure 3: Correlation between PTK2 methylation and chemokines, receptors, and three immunomodulators
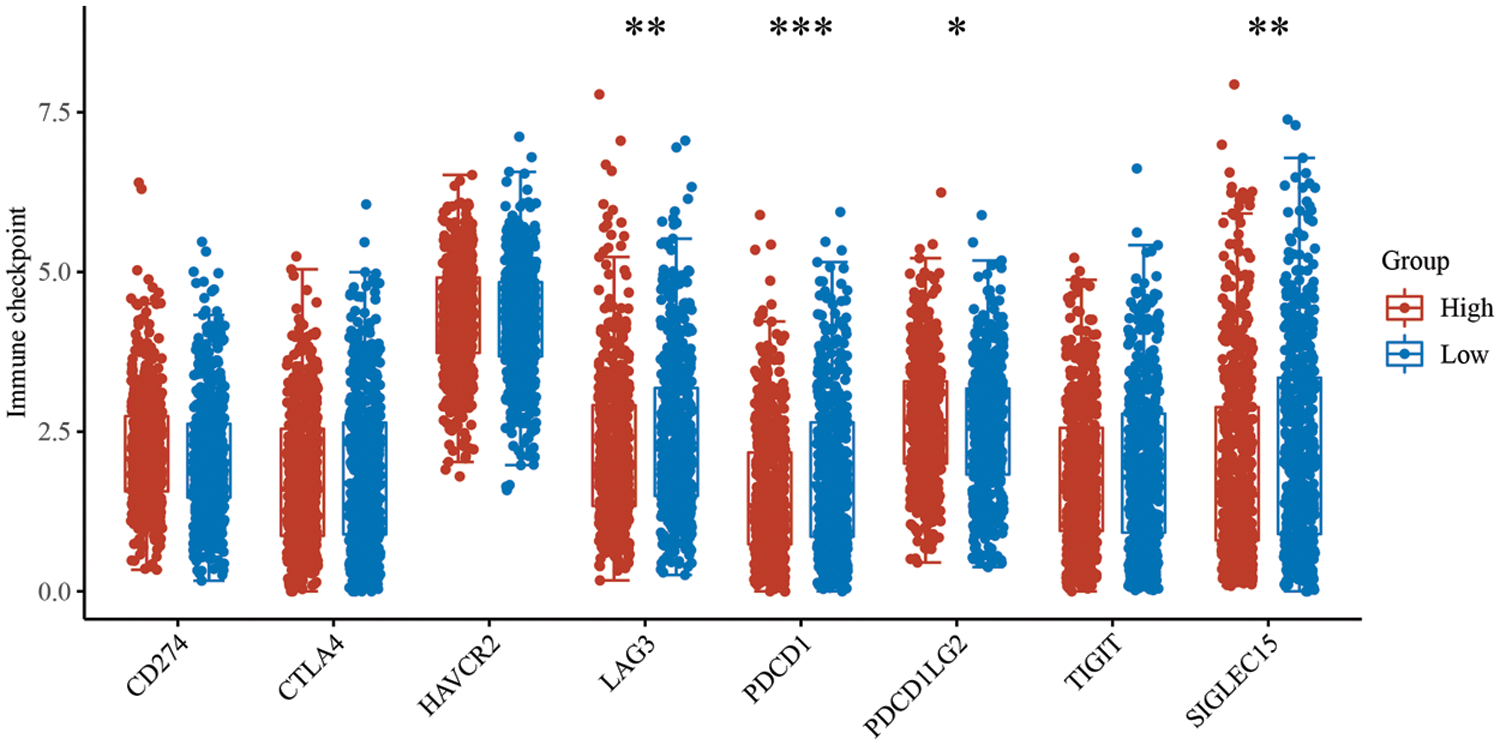
Supplementary Figure 4: Expression differences of immune checkpoint molecules in PTK2 high and low groups
Cite This Article
 Copyright © 2022 The Author(s). Published by Tech Science Press.
This work is licensed under a Creative Commons Attribution 4.0 International License , which permits unrestricted use, distribution, and reproduction in any medium, provided the original work is properly cited.
 Downloads
 Citation Tools