
 Login
Login Register
 Submit a Paper
 Propose a Special lssue
 Open Access
ARTICLE
Investigation into the Intelligent Recognition of Common Congenital Heart Disease Based on Echocardiography
1 Department of Ultrasound Diagnosis, Children’s Hospital, Zhejiang University School of Medicine, National Clinical Research Center for Child Health, Hangzhou, China
2 Zhejiang Key Laboratory of Neonatal Diseases, Hangzhou, China
3 Department of Cardiac Surgery, Children’s Hospital, Zhejiang University School of Medicine, National Clinical Research Center for Child Health, Hangzhou, China
4 Binjiang Institute of Zhejiang University, Hangzhou, China
* Corresponding Authors: Weize Xu. Email: ; Jin Yu. Email:
Structural and Congenital Heart Disease 2026, 21(4), 8 https://doi.org/10.32604/schd.2026.079240
Received 17 January 2026; Accepted 23 June 2026; Issue published 30 September 2026
 View Full Text
 Download PDF
Abstract
Background: Congenital heart disease (CHD) is characterized by a high incidence and low detection rate. The shortage of pediatric echocardiologists limits the routine ultrasound screening for CHD in many institutions. Deep learning has emerged as a promising tool to enhance the CHD diagnosis. This study aims to develop and evaluate a two-branch, two-stage intelligent algorithm (OBICnet) based on echocardiographic images to predict and classify common CHD in pediatric patients. Methods: A total of 8543 static color Doppler images from 3134 children were analyzed, with each child contributing 1 to 7 standard sectional views. The dataset was divided into training, validation, and test sets in an 8:1:1 ratio. The external validation dataset included 350 color Doppler images of 50 children. The OBICnet architecture comprises two distinct branches and functions through a two-stage processing pipeline. Branch 1: The target detection network (YOLOv5) identified and extracted lesion regions, followed by disease classification using the image classification network (ResNet50). Branch 2: The ResNet50 network directly classified diseases by extracting features from whole image. Joint learning mixed scheduled sampling was applied during training to optimize the OBICnet model, with final disease classification achieved by integrating results from both branches. The OBICnet model’s performance was evaluated by comparing it with other algorithms and through external validation. Results: The OBICnet model categorized normal cases and three common CHD conditions: atrial septal defect + patent foramina ovale (ASD + PFO), ventricular septal defect (VSD), and patent ductus arteriosus (PDA). The accuracy of the single-image disease classification algorithm was 98.32%, with the AUC value of 0.99. For the multi-view disease classification, the accuracy reached 98.97%. External validation demonstrated that the accuracy of the single-image disease classification algorithm based on the OBICnet model was 92.30%, while the multi-view disease classification accuracy was 90.50%. Conclusions: The OBICnet model exhibited remarkable recognition capabilities for ultrasound images, accurately classifying common CHD in children. This model holds clinical potential for advancing teaching, standardizing CHD ultrasound screening and promoting large-scale echocardiographic screening of CHD in the future.Keywords
Supplementary Material
Supplementary Material FileCongenital heart disease (CHD) is the most prevalent birth defect globally, contributing substantially to disease burden and mortality, with a global prevalence of nearly 1.5 cases per 100 live births [1,2]. CHD is the most common birth defect in China; yet early detection and timely intervention can lead to a favorable prognosis for the majority of cases [3]. The early detection rate of the “dual-index method (pulse oximetry and cardiac auscultation)” for critical CHD reaches 100%, however its effectiveness in identifying non-critical CHD remains limited [4]. High-altitude regions have a higher incidence of CHD compared to sea-level regions [5]; however, the efficacy of dual-indicator screening remains limited [6]. Echocardiography is the gold standard for the detection of CHD and demonstrates high sensitivity in identifying both critical and non-critical CHD. The three most common non-critical CHD types are atrial septal defect (ASD), ventricular septal defect (VSD), and patent ductus arteriosus (PDA) [7,8]. Early detection and timely surgical intervention in children with these defects can lead to a favorable prognosis, potentially resulting in lifelong asymptomatic status [2]. However, the limited availability and uneven distribution of pediatric sonographers in China, particularly in primary cares and resource-limited regions, pose significant challenges to the large-scale implementation ultrasound screening for CHD. As a result, many non-critical CHD cases remain undiagnosed [7].
The application of artificial intelligence (AI) in medical imaging is rapidly expanding [9,10]. Several echocardiography software applications have already been developed that employ AI to assist in the assessment of cardiac volumes and ventricular function [11,12,13]. However, studies focusing on the intelligent diagnosis of CHD remain limited, with most research targeting AI-based analysis of fetal CHD using echocardiographic images [14,15]. Progress in developing AI models for the recognition of CHD in children has been relatively slow, with primarily focus on the automatic detection of critical CHD [16,17].
Most AI models for echocardiography-based CHD recognition are built on convolutional neural networks (CNNs), which excel at capturing localized features in ultrasound images and integrating these features at higher levels to generate comprehensive characterizations [18]. By learning features from a large number of samples, this method effectively avoids the need for complex feature extraction processes. While current DL techniques show superior performance in intelligent recognition based on echocardiographic images, it’s important to note that they require large, high-quality, labeled datasets to facilitate effective learning [19]. Currently, there is no publicly available large-scale database of high quality. Additionally, traditional image classification models typically extract crucial features from entire echocardiographic images, but often overlook critical regions of interest that are essential for accurate diagnosis. This approach renders the models vulnerable to irrelevant information and noise, thereby compromising its classification performance [20,21,22]. Furthermore, the pipeline-type ensemble model, which combines multiple models to effectively integrate their individual advantages, often encounters error propagation and insufficient information sharing among modules [23]. These limitations underscore the need for improved strategies to enhance model performance and reliability in CHD diagnosis.
To address these challenges, this study collected a dataset of 8543 echocardiographic images from 3134 children. Building upon a multi-task learning framework, a two-branch, two-stage disease classification model (Disease Classification Network Based on Object Detection and Image Classification, OBICnet), integrating object detection and image classification, is proposed for echocardiogram-based disease classification. To address the issues of error propagation and lack of information exchange between modules, a joint learning framework is adopted to train the model, and a scheduled sampling method is introduced to further mitigate error propagation [24]. The present study aims to evaluate the effectiveness of the OBICnet model in detecting and classifying common CHD in children.
2.1 Standardized Collection of Cardiac Ultrasound Image Data
The two-dimensional color Doppler echocardiography dataset used in this study was derived from 8543 static color Doppler images of 3134 children examined in the ultrasound department of our hospital. The dataset included common CHD (ASD, VSD, PDA), patent foramen ovale (PFO), as well as the healthy children; the data distribution is presented in Table 1. The cohort consisted of 1669 boys and 1465 girls, with a median age of 2.08 years and an interquartile range of 3.67 years (range: 0–16). For each child, 1 to 7 standard echocardiographic sectional images were acquired, providing sufficient information for the diagnosis of the disease. As shown in Fig. 1, the seven standard two-dimensional (2D) echocardiographic views are as follows: Parasternal Long-Axis view (PSLA), Parasternal Short-Axis View (PSSA), Parasternal 4-chamber view (P4C), Parasternal 5-chamber view (P5C), Subxiphoid 4-Chamber view (S4C), Subxiphoid 2-Chamber views (S2C), Suprasternal Long-Axis Views (SSLA) [25]. Each positive and negative standard view in the echocardiogram dataset was manually selected and collected by experienced pediatric echocardiologists during clinical examinations. The diagnosis for each patient was confirmed by at least two senior specialists with expertise in pediatric echocardiography.
Table 1: Distribution of datasets.
| Type of Dataset | Total | ASD | PFO | VSD | PDA | Normal |
|---|---|---|---|---|---|---|
| Patient sample | 3134 | 627 | 195 | 554 | 145 | 1613 |
| Image | 8543 | 1273 | 283 | 1100 | 145 | 5742 |
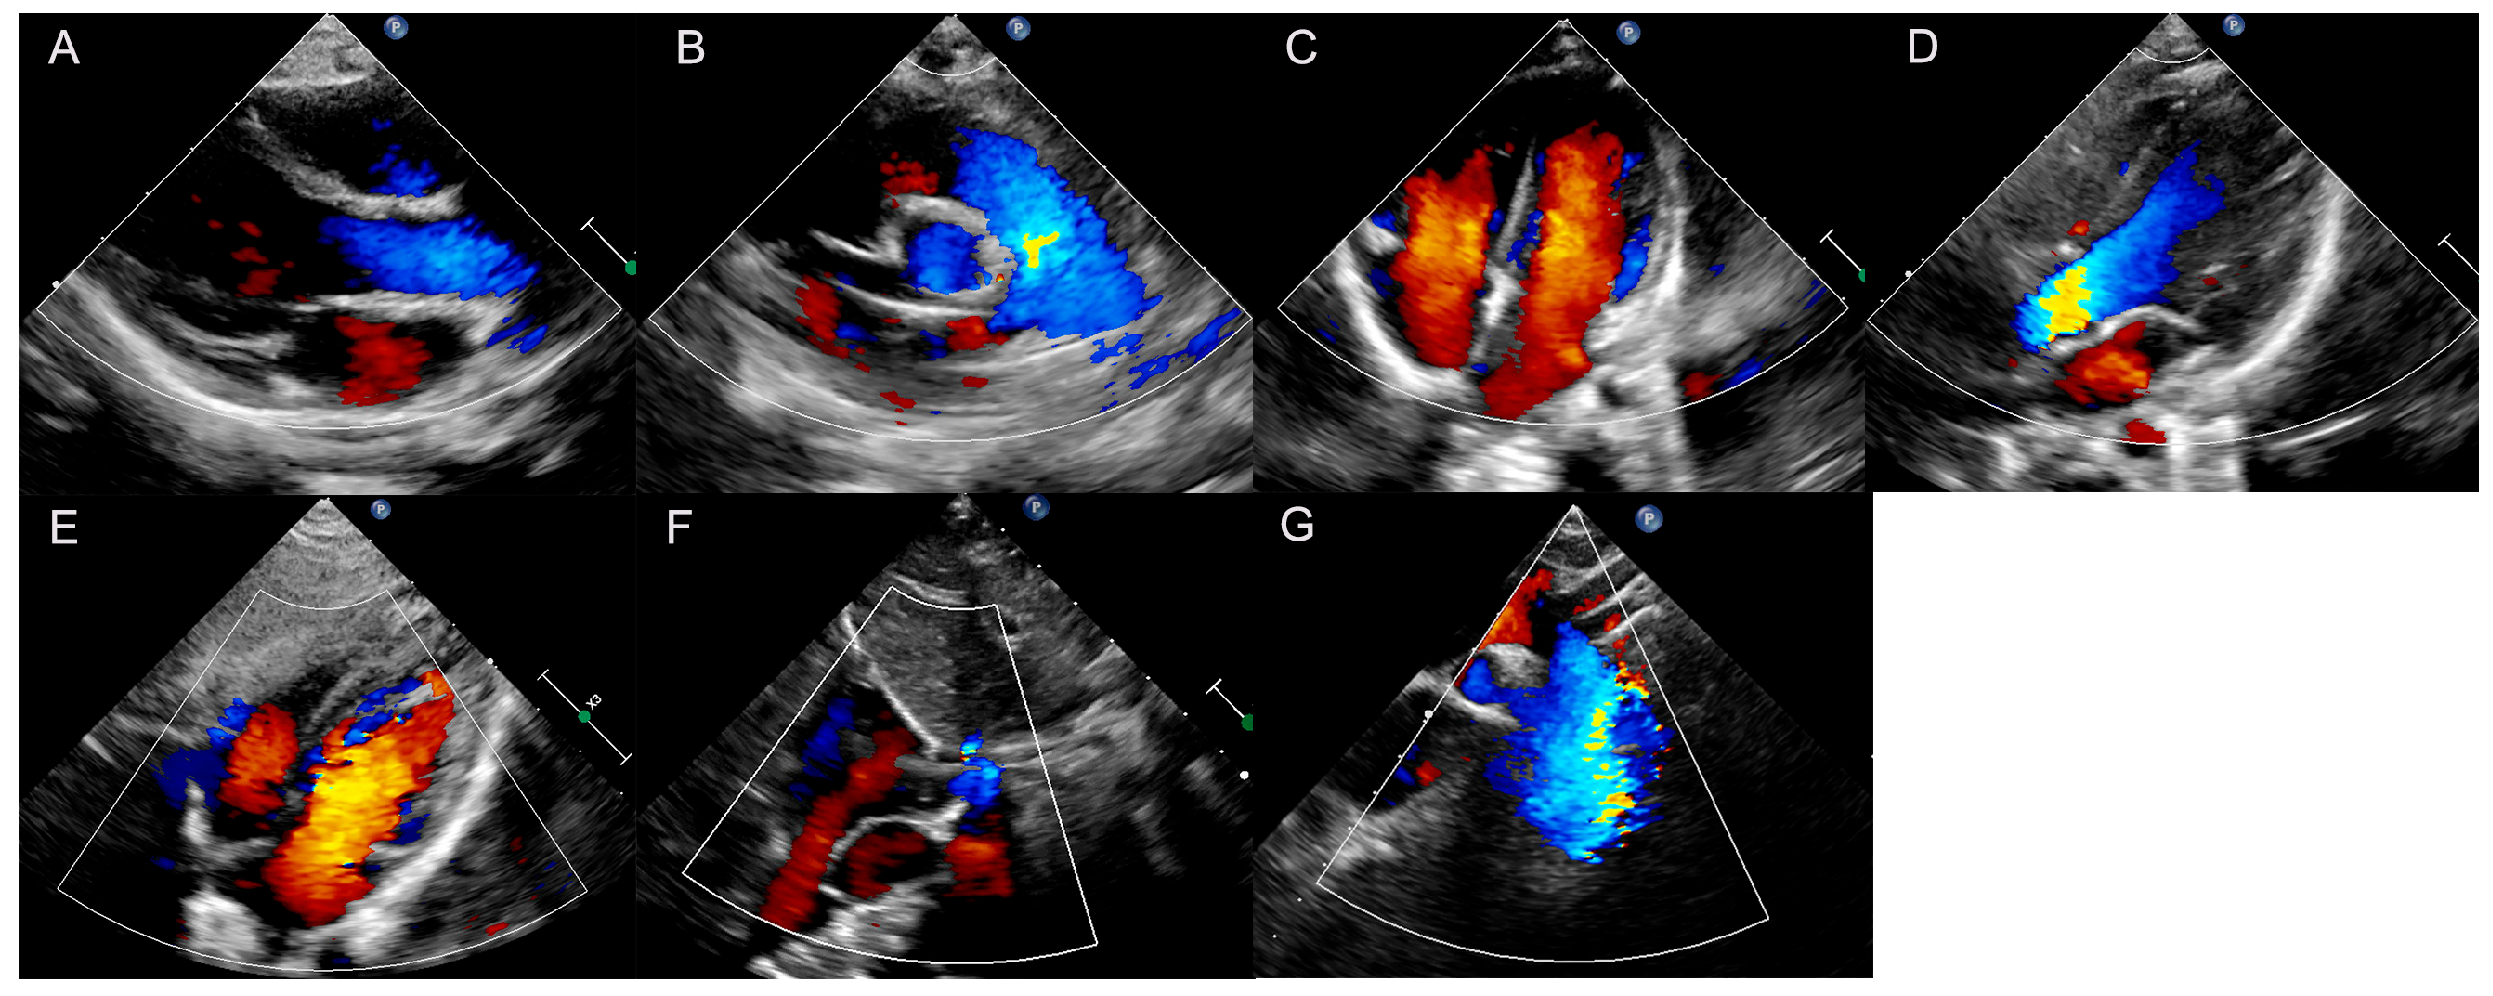
Figure 1: Sample images of seven sections from the echocardiographic dataset. (A) Parasternal Long-Axis view (PSLA); (B) Parasternal Short-Axis View (PSSA); (C) Parasternal 4-chamber view (P4C); (D) Parasternal 5-chamber view (P5C); (E) Subxiphoid 4-Chamber view (S4C); (F) Subxiphoid 2-Chamber views (S2C); (G) Suprasternal Long-Axis Views (SSLA).
We used the Philips iE 33, EPIQ5 and EPIQ 7C (Philips Ultrasound, Inc.) as imaging instruments. The transducer frequencies ranged from 3 to 8 MHz and from 1 to 5 MHz.
All collected echocardiographic images were labeled by professional echocardiologists, including the positioning of seven standard views, the negative or positive assessment of each view, and the diagnosis and labeling of diseases. As shown in Fig. S1, regions of interest within the echocardiographic images were annotated using the “LabelImg” software. These regions included key lesion areas for ASD, VSD, and PDA, as well as potential lesion key sites.
The dataset was partitioned by individual subjects, each with multiple images, rather than being segmented by images. The dataset was partitioned into the training, validation, and test sets in an 8:1:1 ratio. The training dataset is employed to train the model, while the validation set is used to evaluate the model’s status and convergence during training, thereby facilitating model parameter adjustment. The test set is used to evaluate the model’s final generalization capability. Since both ASD and PFO involve abnormal atrial septal shunts, they were grouped together in the experiment. The detailed data distribution for the disease classification model is presented in Tables S1 and S2.
In this study, each ultrasound image was assigned a single disease category or labeled as “normal”, thereby forming a standard four-class single-label classification task (i.e., multi-class classification). Although some children were clinically diagnosed with multiple cardiac abnormalities, these distinct pathological manifestations were captured in images acquired from different anatomical views. Consequently, at the image level, the model performed mutually exclusive classification; at the patient level, integrating predictions across multiple images allowed for the identification of whether a child had one or more conditions. This study was approved from the ethics board of the Children’s Hospital, Zhejiang University School of Medicine (No. 2021-IRB-286). In the approval process, the committee granted a formal exemption of informed consent for this study.
All images were uniformly processed and normalized for this study. The primary region data of interest was extracted from the original image, and the images were resized to 224 × 224 pixels.
Concurrently, echocardiogram images are often surrounded by irrelevant information. To enhance model performance, superfluous data are artificially removed during both training and inference via a shear operation, as shown in Fig. S2. This ensures that the model learns features in the intended direction throughout the training process.
2.3 Disease Classification Model
In the echocardiographic diagnosis of CHD, each condition exhibits distinct lesion locations as key diagnostic features. Traditional image classification models typically rely on whole-image analysis for classification purposes but frequently overlook critical regions of interest that are essential for accurate diagnosis. This limitation increases vulnerability to irrelevant information and noise, thereby undermining classification accuracy. To address these limitations, this study proposes a two-branch, two-stage disease classification network based on object detection and image classification, termed OBICnet. The object detection model (YOLOV5) is employed to extract key lesion regions, followed by the image classification model (ResNet50) for disease classification—referred to as Branch 1—addressing the limitation of the model’s inability to focus on specific pathological regions. However, if the object detection model erroneously identifies a non-lesion region as the key region, misdiagnoses may arise during subsequent feature fusion and disease classification stages. To mitigate data imbalance and prevent information loss, a second branch is incorporated into the classification model. This branch treats the entire echocardiogram as a key region input and employs a feature extraction network (ResNet50) for image classification, referred to as Branch 2. It contributes to the overall feature extraction and disease classification of the entire echocardiogram, thereby mitigating misjudgment caused by the erroneous selection of non-lesion regions as key regions in Branch 1. This further enhances the model’s performance. As shown in Fig. 2A, the image classification model comprises two branch modules. Branch 1 integrates object detection (YOLOv5) and image classification (ResNet50), forming a two-stage classification model. Branch 2 employs ResNet50 as a single-stage classification model to classify diseases based on the global image features. The input echocardiogram is independently processed for classification through these two branch modules. Subsequently, the output results from Branch 1 and Branch 2 are integrated to obtain the final disease classification result. Herein, binary cross-entropy loss is adopted as the loss function for both object detection and disease classification. The loss for object detection is denoted as
The model adopts two types of fusion strategies:
Feature-level Fusion: For the intermediate feature fusion between branches, we employ element-wise matrix addition to integrate information efficiently without increasing model complexity.
Decision-level (Branch) Fusion: For the final classification, we utilize a weighted average strategy. Crucially, the weights assigned to each branch are not fixed hyperparameters; they are learnable parameters that are optimized jointly with the network weights during the training process. This allows the model to adaptively determine the importance of each branch’s output.
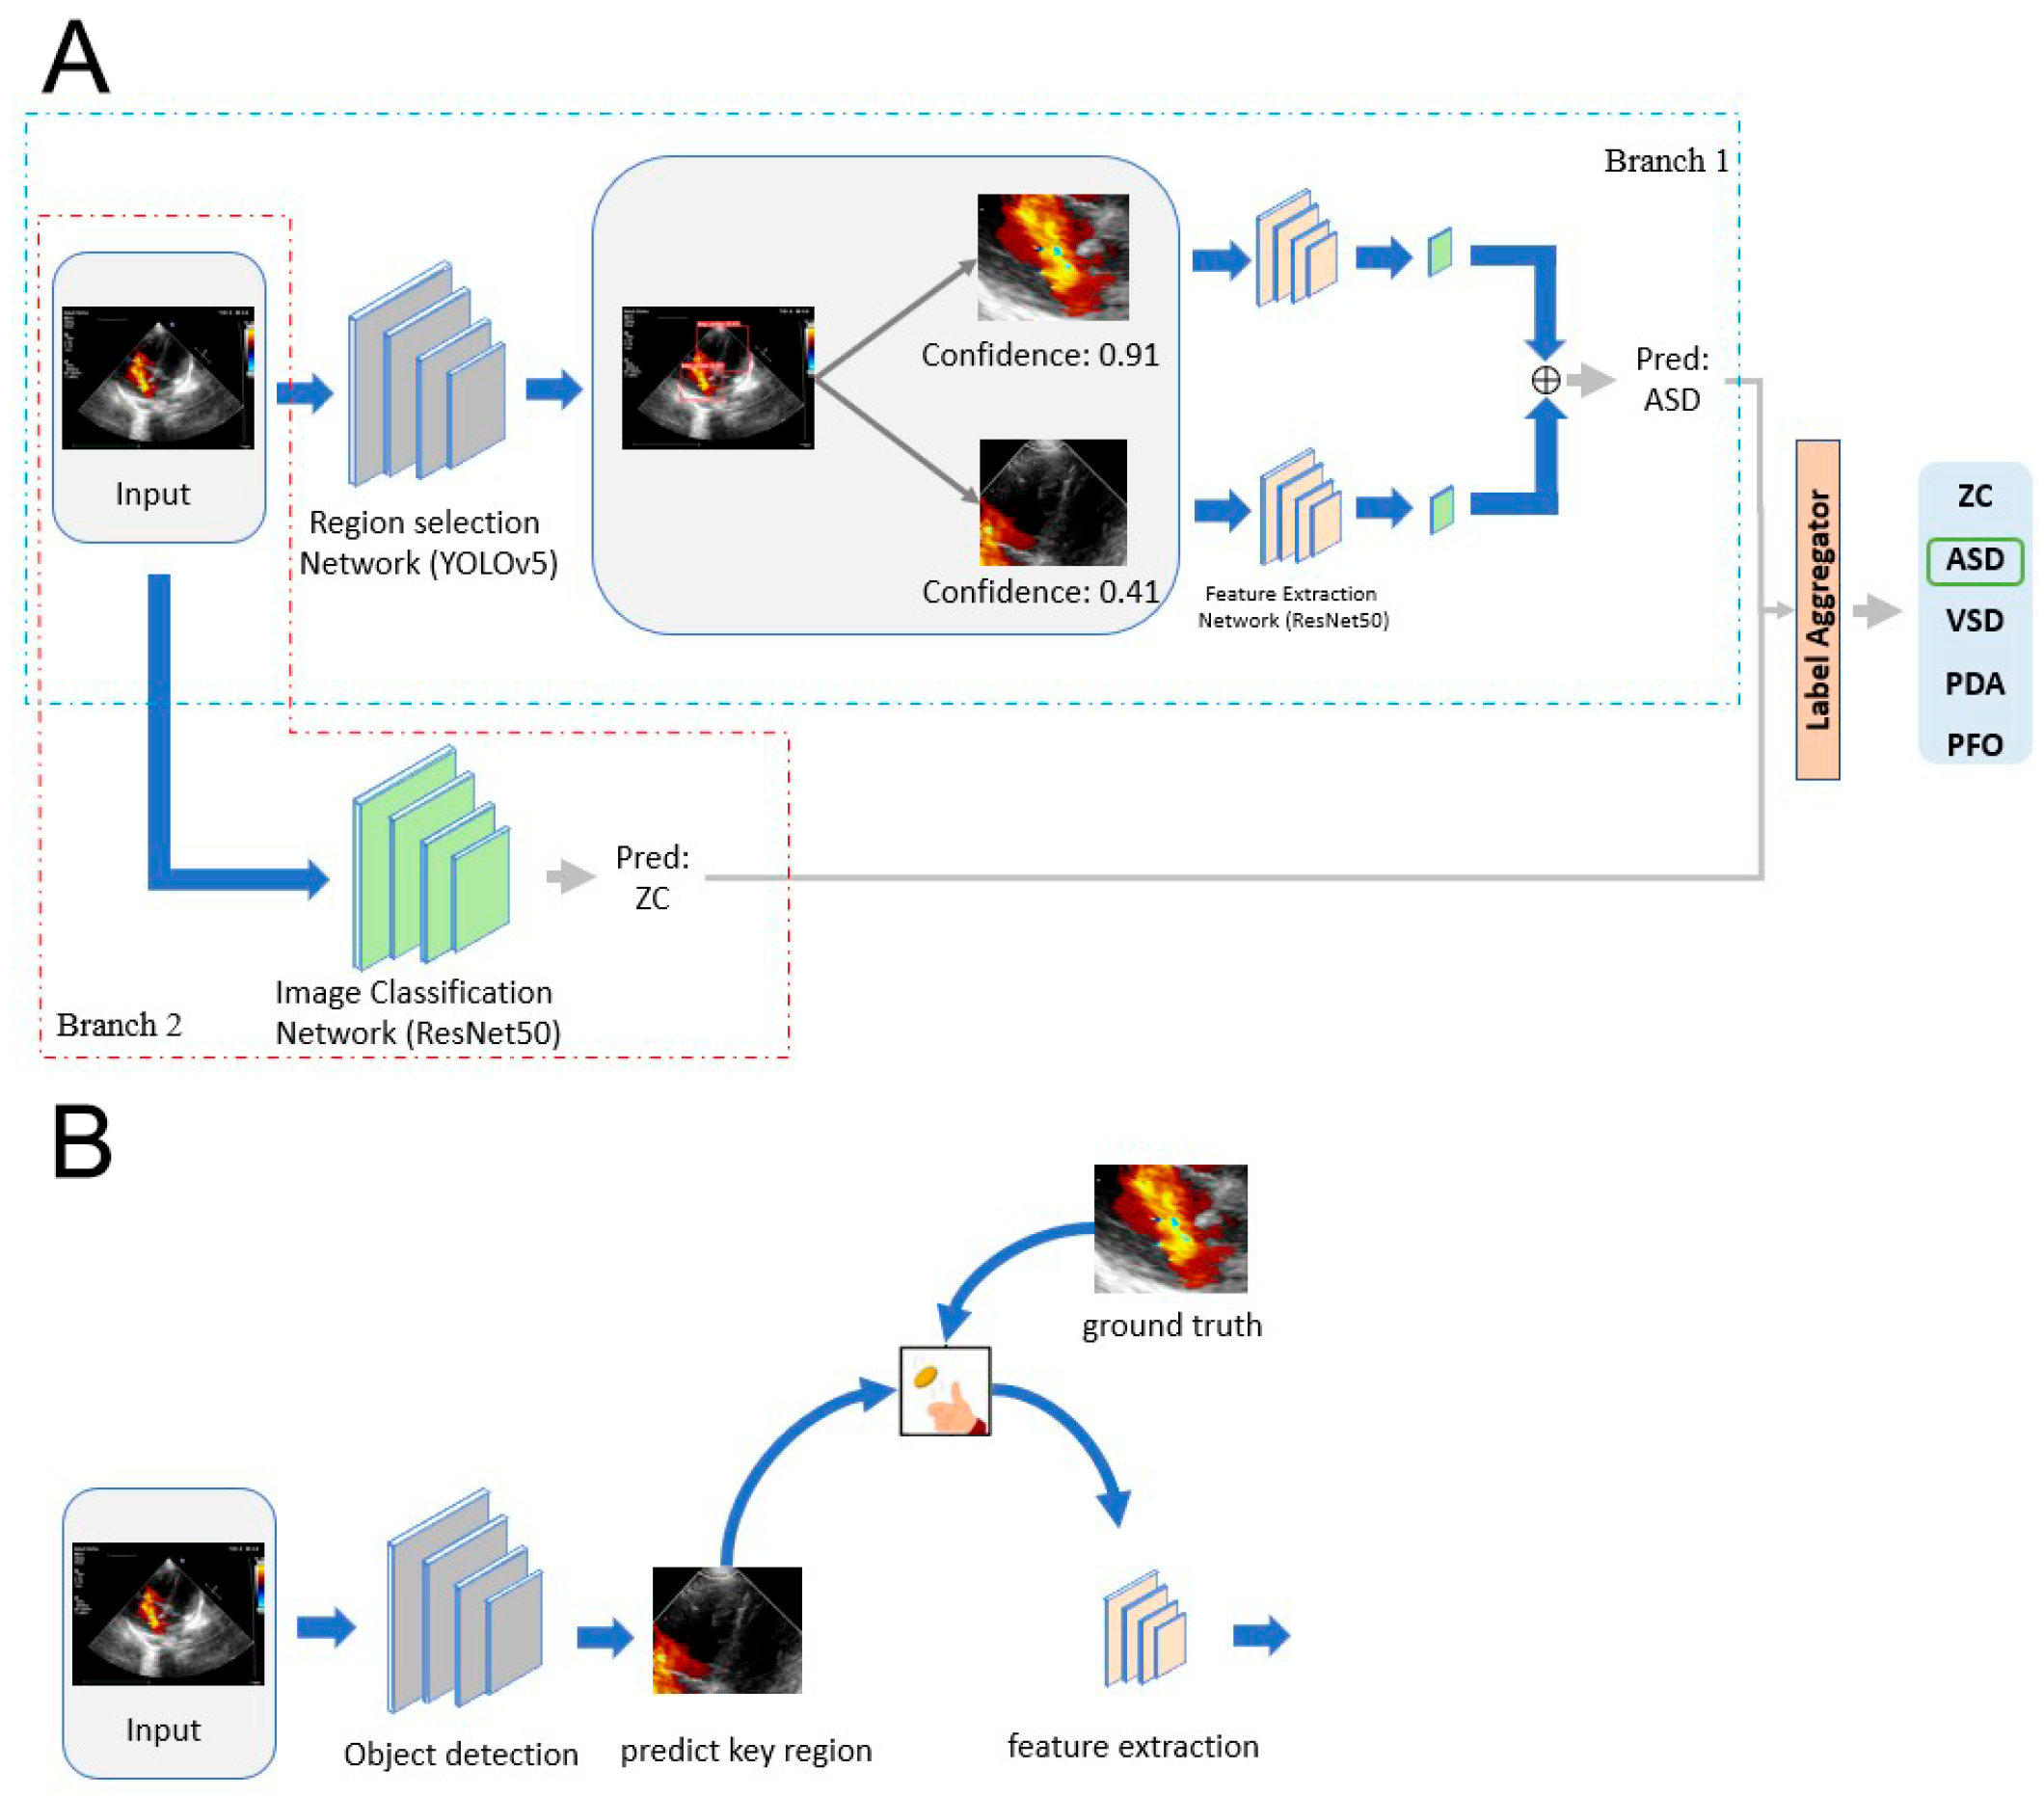
Figure 2: The network framework of the OBICnet model and the example of scheduled sampling. (A) Network framework. The proposed OBICnet model comprises two distinct branches. Branch 1 integrates a two-stage approach, employing the YOLOv5x object detection model followed by a ResNet50 image classification network for lesion-specific analysis. Branch 2 utilizes a single-stage ResNet50 network for holistic image classification. The final disease classification is determined by fusing the outputs from both branches. (B) Example of scheduled sampling. The true key regions are initially provided to the disease classification module, and the proportion of predicted key regions is gradually increased until all the inputs to the disease classi-fication module consist of key regions predicted by the object detection module. ZC, normal; ASD, Atrial Septal Defect; PFO, Patent Foramen Ovale; VSD, Ventricular Septal Defect; PDA, Patent Ductus Arteriosus.
In Branch 1, the object detection module’s output feeds directly into the disease classification module, which means any mistakes made in detecting objects will naturally carry over to the classification step. To help reduce this problem during training, we use a technique called scheduled sampling, see Fig. 2B. Here’s how it works: at the beginning of training, we give the classification module the true key regions. Then, we start gradually replacing them with the regions predicted by the object detection module until eventually the classifier only uses predicted regions. Put simply, we introduce a probability that decides whether the input to the classification module is a true key region or one predicted by the earlier module. This way, even if the object detector makes errors, the classifier still gets some correct inputs and can keep learning in the right direction. This helps the whole model train more effectively and perform better overall. The sampling probabilities used in this study under scheduled sampling are as follows:
We selected the sine-based decay function over a linear schedule to achieve a smoother transition between using ground truth and using model predictions.
Linear Decay: A linear schedule reduces the probability of using ground truth at a constant rate. This can sometimes be too aggressive in the early stages of training when the model is not yet stable, or too slow in the later stages when the model needs to learn to correct its own errors.
Sine-Based Decay: The sine function (specifically the concave portion of the curve) maintains a higher probability of ground-truth guidance for a slightly longer duration during the initial unstable training phase, followed by a more rapid transition in the middle phase, and a smooth convergence at the end. This non-linear characteristic helps stabilize the training early on while effectively bridging the training-inference gap.
To further mitigate the problem of error propagation and strengthen the intermodular correlation, a joint learning approach is employed to train all modules simultaneously. The aggregate loss is defined as follows, where λ1 and λ2 are hyperparameters,
To determine the optimal values for the joint-learning loss weights λ1 (for object detection loss) and λ2 (for classification loss), we employed Optuna, an automated hyperparameter optimization framework. We conducted a Grid Search within a defined search space to maximize the overall accuracy on the validation set. The optimization process indicated that the model achieved the best performance balance when λ1 = 1.0 and λ2 = 1.5.
To evaluate the performance improvement of the proposed OBICnet model, ResNet50, GBCnet, and AIEchoDx are adopted as a baseline models for comparative experiments [21,26]. ResNet50 serves as a conventional model for image classification, while GBCnet and AIEchoDx have demonstrated superior performance in ultrasound disease classification in recent years. GBCnet is currently one of the most prominent ultrasound-based gallbladder cancer detection models. It first localizes the gallbladder to extract the region of interest (ROI) rather than directly detecting the cancer, and then employs a multi-scale, second-order pooling architecture for cancer detection. The “detect first, classify later” architecturallogic of GBCnet closely mirrors our proposed model method, making it an ideal benchmark for evaluating structural improvements. AIEchoDx is a deep learning-based framework for diagnosing heart diseases that can automatically analyze dynamic echocardiogram videos to identify four common types of cardiac conditions and differentiate them from normal cardiac patterns, achieve diagnostic accuracy comparable to that of experienced physicians. Additionally, it can be utilized in combination with echocardiographic videos acquired from portable ultrasound devices, demonstrating substantial potential as an auxiliary diagnostic tool in primary and emergency care settings.
The performance evaluation metrics for the intelligent CHD recognition and classification model based on echocardiography images include accuracy (Acc), precision (P), recall (R), false negative rate (FNR), false positive rate (FPR), ROC curve, and AUC. Except for the ROC curve and AUC, all other metrics are calculated based on the confusion matrix.
2.5 Experimental Parameter Settings
To avoid the influence of critical hyperparameters on the training process and enable fair comparisons, this study has standardized the model parameters. To ensure clarity and reproducibility, a detailed description of the specific configurations of the compared models is provided as follows:
YOLOv5: The object detection module in Branch 1 employs the YOLOv5x architecture, which is initialized with pre-trained weights. Input images were resized to 640 × 640 pixels for this detection task.
ResNet50: All implementations of the ResNet50 network, including Branch 1’s classification stage and Branch 2, were initialized with weights pre-trained on the ImageNet dataset and then underwent fine-tuning on our in-house dataset.
GBCnet: The GBCnet model was implemented according to the standard configuration described in [26]. It first detects regions of interest (ROI), followed by multi-scale second-order pooling for classification.
AIEchoDx: The AIEchoDx model was implemented based on the standard configuration from Reference, which focuses on analyzing dynamic echocardiographic videos [21]. For our static image comparison, the core image classification architecture of the original framework was utilized.
Optimization: All models were trained using the Stochastic Gradient Descent (SGD) optimizer by default. The specific parameters were set as follows: initial learning rate (lr0) = 0.01, momentum = 0.937, and weight decay = 0.0005. The learning rate scheduling strategy was linear decay by default, reducing from the initial value (lr0) to the final value determined by the lrf parameter (final learning rate = lr0 × lrf). A warmup phase was included for both learning rate and momentum over the first few epochs (warmup_epochs), starting from initial warmup values (warmup-bias-lr for bias learning rate and warmup-momentum for momentum). The loss function components included CIoU loss for bounding box regression, and Binary Cross-Entropy (or Focal Loss if fl_gamma > 0) for classification and objectness prediction.
The specific parameters are as follows: Learning Rate refers to the rate by which the model updates its weights during training.
Epochs indicate the maximum number of training iterations, with early termination if performance ceases to improve.
Batch Size denotes the number of images fed into the model in one training iteration.
Dropout represents the probability that the neurons within the network are randomly discarded during training to mitigate overfitting.
These parameters are elaborated upon in Table S3.
2.6 Preliminary External Data Validation
In addition, 350 color Doppler still images from 14 healthy children and 36 children with common CHD (ASD, VSD, PDA) were collected from other hospitals to establish an external validation dataset. All these children underwent examination using the Philips EPIQ5 and EPIQ7C ultrasound instrument (Philips Ultrasound, Inc.). The transducer frequencies ranged from 3 to 8 MHz and from 1 to 5 MHz, respectively. Seven views were extracted from two-dimensional color Doppler echocardiography for each child in according with Fig. 1. All positive or negative standard views were manually selected and collected by pediatric echocardiologists during clinical examinations. Subsequently, the classification recognition performance of OBICnet model was evaluated on the external validation dataset.
3.1 Experimental Results of Image-Based Four-Class Classification
The experimental results of the image-based four-class classification (normal, ASD + PFO, VSD, and PDA), summarized in Table 2, indicate that the OBICnet model significantly outperforms the ResNet50, GBCnet, and AIEchoDx models in terms of accuracy, precision, and recall. Additionally, the OBICnet model shows significantly lower rates of misdiagnosis and omission. It demonstrates superior performance in recognizing of ASD + PFO and PDA compared to the ResNet50, GBCnet, and AIEchoDx models. Regarding VSD, although the ResNet50 model achieves higher precision and a lower false positive rate, it yields a substantially higher false negative rate than the OBICnet model. Importantly, the OBICnet model consistently demonstrates a significant advantage in minimizing false negatives across all categories compared to the ResNet50, GBCnet, and AIEchoDx models, highlighting its robustness and reliability in CHD classification tasks.
The overall performance of the model was evaluated using macro-average and micro-average ROC curves, where a larger area under the curve (AUC) indicates better performance. As shown in Fig. 3, the OBICnet model achieved an AUC value of 0.99 for the image-based four-class classification algorithm. Detailed AUC values for each model and disease category are provided in Table S4. These results confirm that the proposed OBICnet model outperforms the ResNet50, GBCnet, and AIEchoDx models in predicting each disease category as well as the overall classification performance, demonstrating its superior diagnostic capabilities and robustness compared to the alternative methods.
Table 2: Experimental results of the four-class classification based on images.
| Models | Disease | Accuracy | Precision | Recall Rate | False Positive Rate | False Negative Rate |
|---|---|---|---|---|---|---|
| ResNet50 | ALL | 91.25% | 65.92% | 61.44% | 7.91% | 38.56% |
| ASD + PFO | 88.00% | 92.42% | 73.05% | 3.09% | 26.95% | |
| VSD | 95.72% | 94.92% | 75.68% | 0.72% | 24.32% | |
| PDA | 97.15% | 0.00% | 0.00% | 0.00% | 100.00% | |
| GBCnet | ALL | 95.01% | 93.41% | 80.06% | 4.45% | 19.94% |
| ASD + PFO | 93.48% | 95.92% | 84.43% | 1.85% | 15.57% | |
| VSD | 97.15% | 91.67% | 89.19% | 1.44% | 10.81% | |
| PDA | 98.57% | 100.00% | 50.00% | 0.00% | 50.00% | |
| AIEchoDx | ALL | 79.57% | 53.10% | 51.04% | 7.54% | 48.95% |
| ASD + PFO | 92.32% | 36.37% | 40.34% | 4.61% | 59.65% | |
| VSD | 90.84% | 74.66% | 61.09% | 3.75% | 38.90% | |
| PDA | 96.98% | 29.03% | 21.95% | 1.25% | 78.04% | |
| OBICnet | ALL | 98.32% | 96.72% | 97.35% | 1.55% | 2.65% |
| ASD + PFO | 98.37% | 98.18% | 97.01% | 0.93% | 2.99% | |
| VSD | 98.17% | 93.24% | 94.52% | 0.96% | 5.48% | |
| PDA | 100.00% | 100.00% | 100.00% | 0.00% | 0.00% |
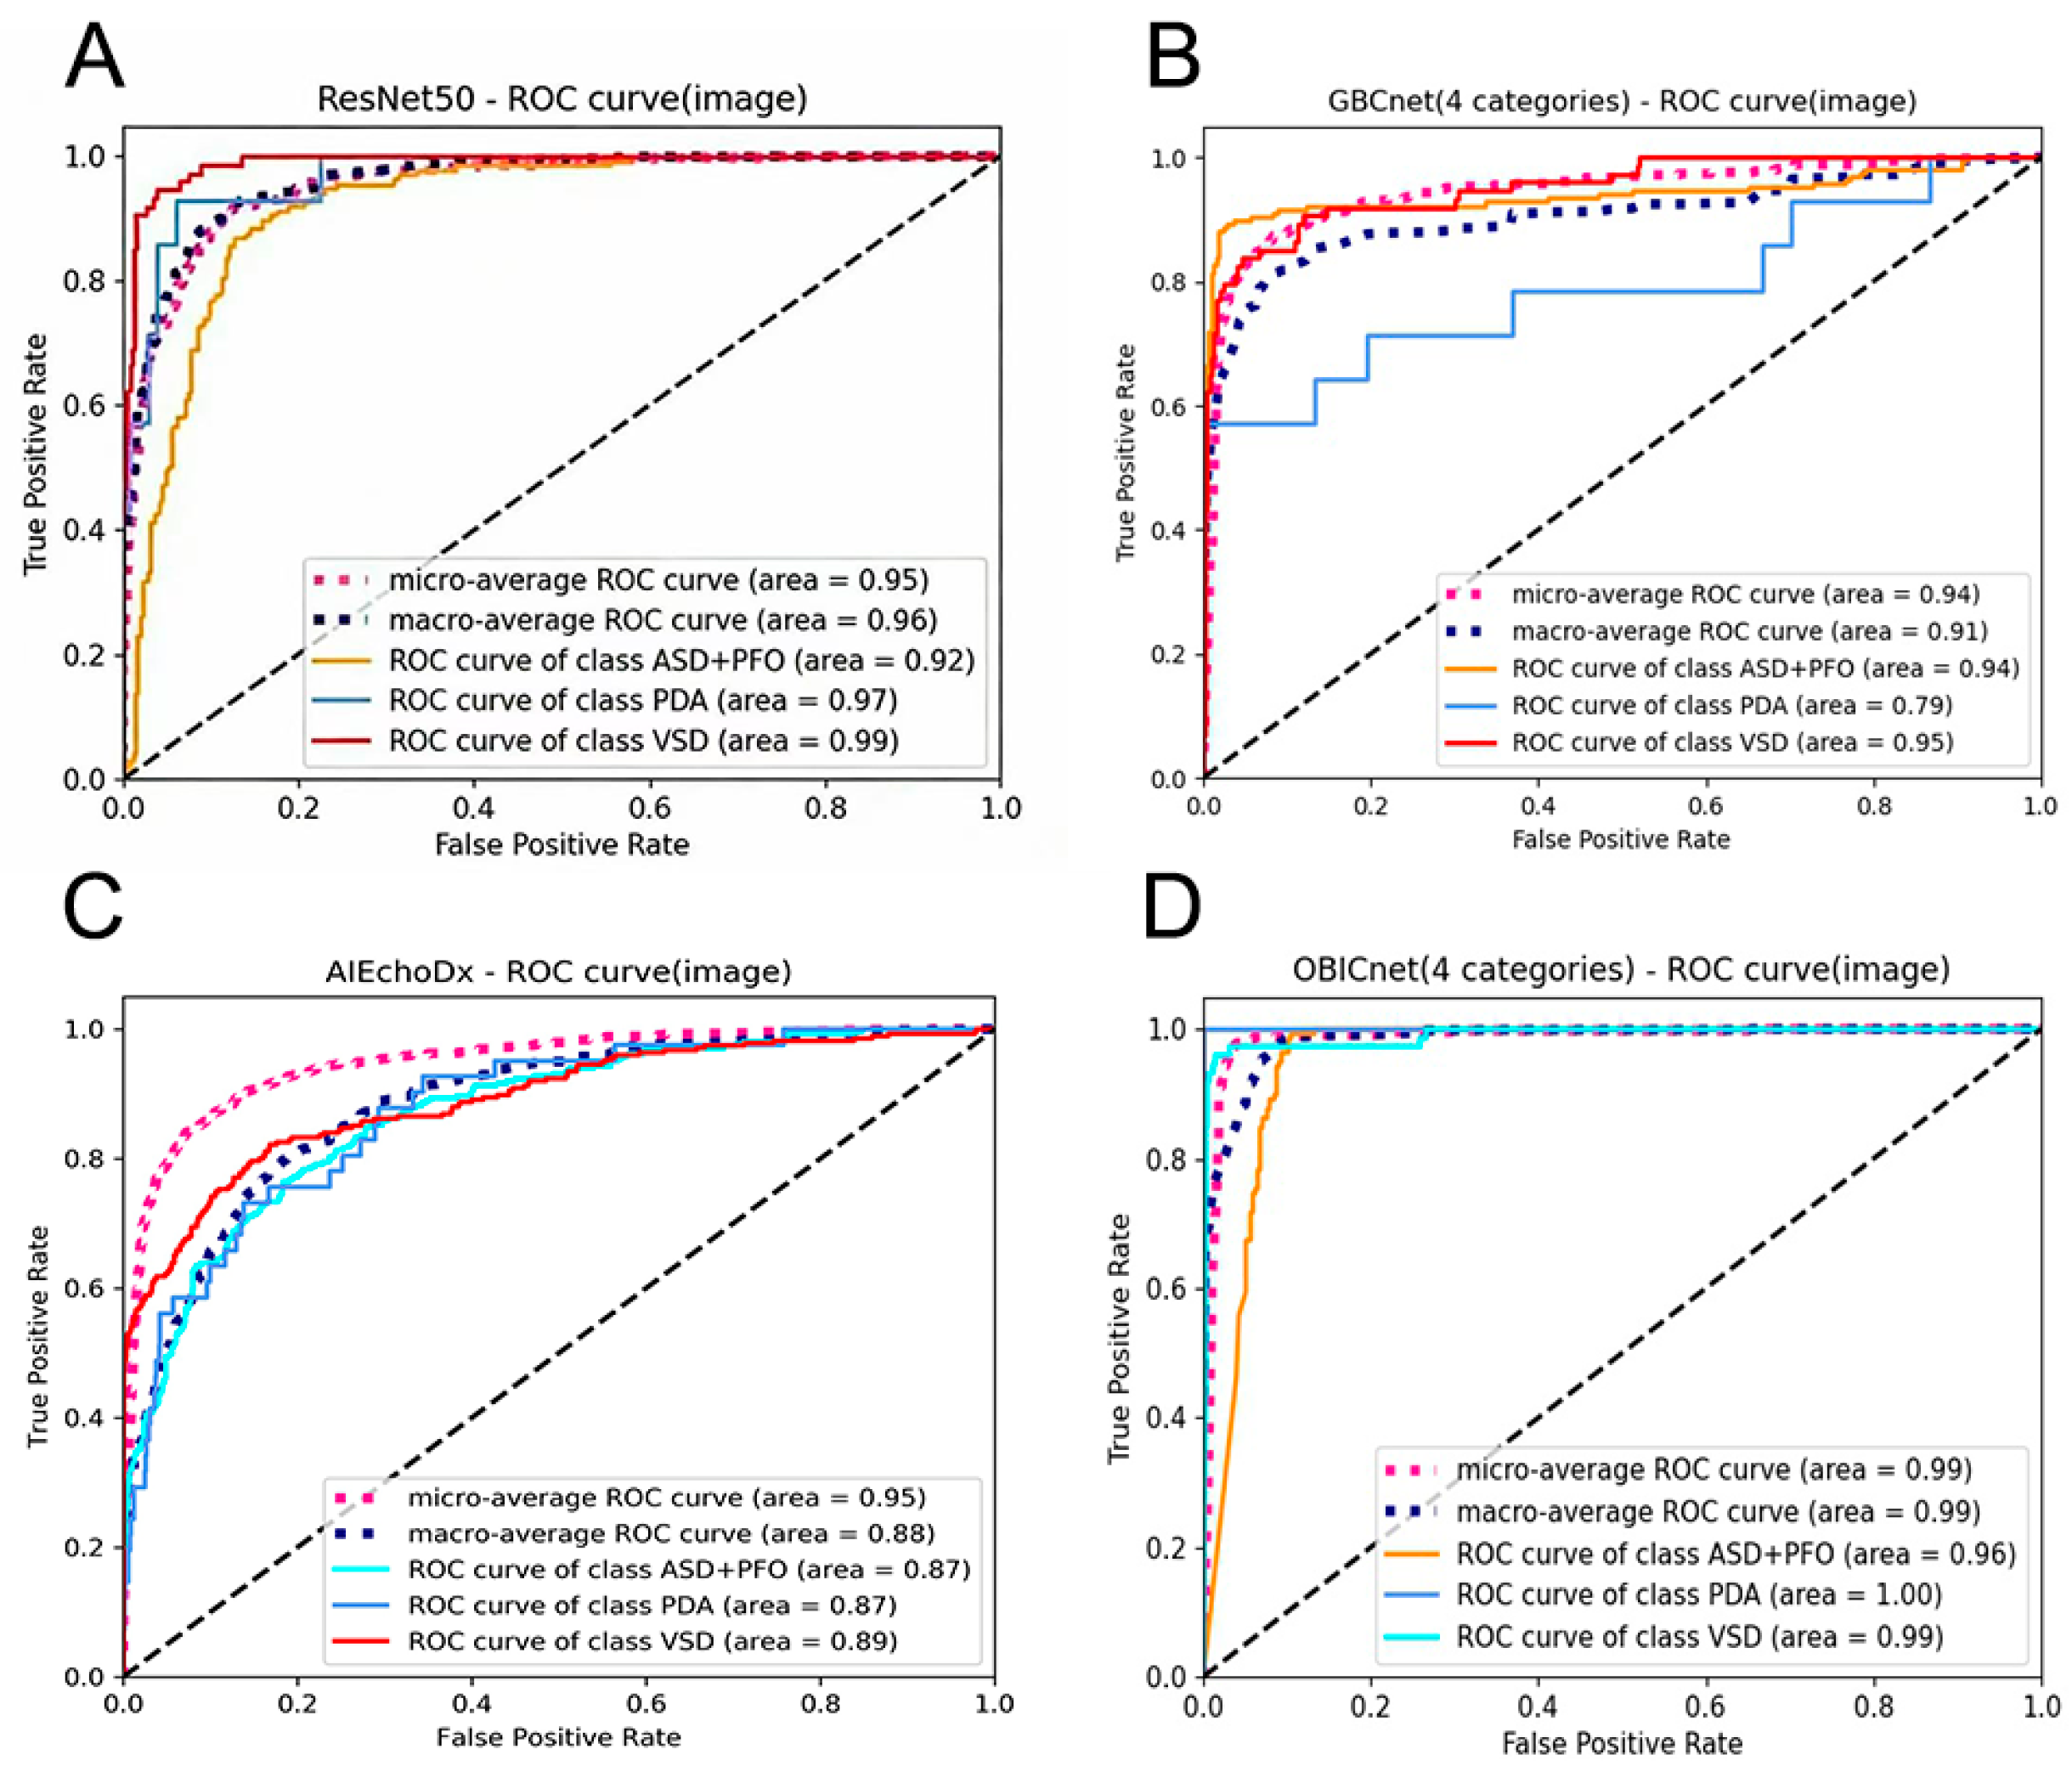
Figure 3: Illustrates the ROC graph. (A) ResNet50 ROC graph; (B) GBCnet ROC graph; (C) AIEchoDx ROC graph; (D) OBICnet ROC graph. ASD, Atrial Septal Defect; PFO, Patent Foramen Ovale; VSD, Ventricular Septal Defect; PDA, Patent Ductus Arteriosus.
3.2.1 Visualization Results of the Features of the Ablation Experiment
Ablation and comparison experiments were conducted on the ResNet50, GBCnet, AIEchoDx, and OBICnet (Branch 1 and Branch 2) models, and the experimental visualization results are presented in Fig. 4. This figure illustrates the intermediate outcomes of the model’s data processing, facilitating an understanding of its internal mechanism. The deeper red color, the greater the model’s attention to that region. It is apparent from the visualization results that the feature extraction in AIEchoDx is insufficiently comprehensive to effectively focus on the key lesion regions. Similarly, ResNet50 fails to adequately attend to the anatomical regions most susceptible to disease. In the OBICnet architecture, the Branch 2 module learns global image features during training, similar to ResNet50; however, influenced by Branch 1, it is able to allocate greater attention to the lesion regions associated with the disease. As a result, the Branch 2 module effectively captures detailed features within the key lesion areas. The GBCnet model also focuses on the detailed features of the key lesion regions; however, it fails to achieve satisfactory discriminative performance for CHDs, likely due to the loss of other detailed features outside the lesion key region.
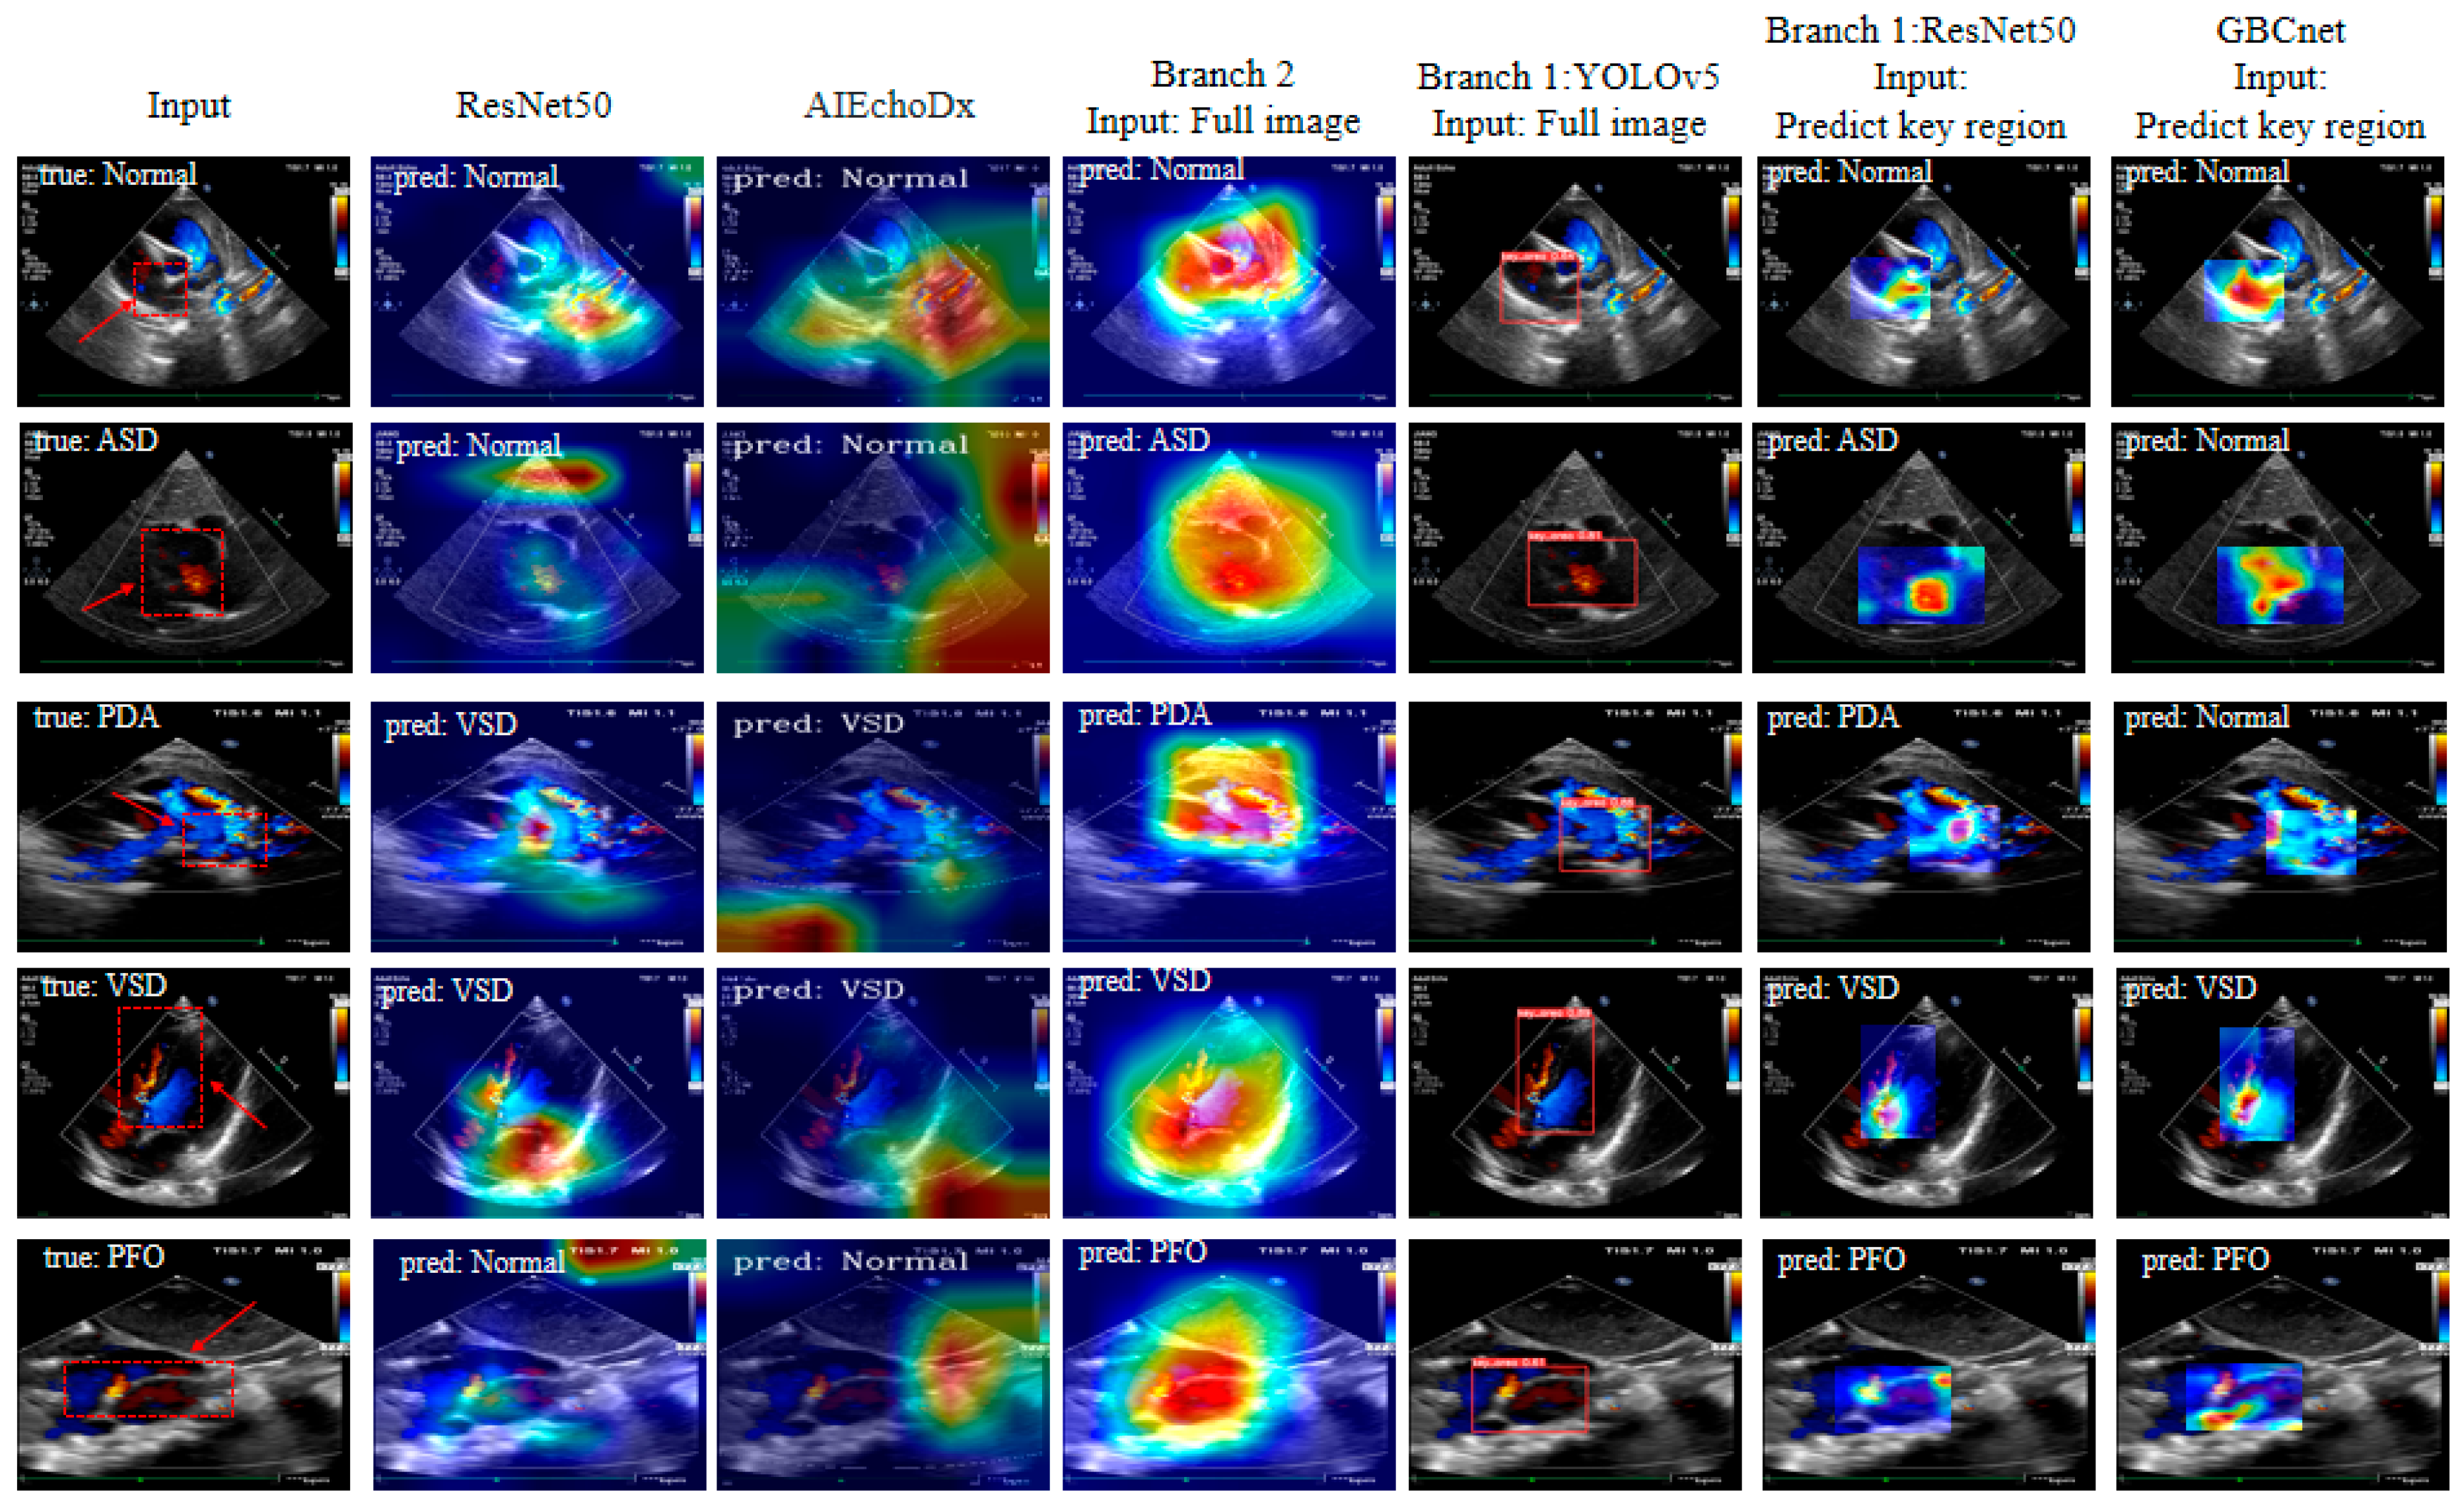
Figure 4: Results of feature visualisation for ablation experiments. The deeper red color of a region in the picture, the greater the model’s attention weight assigned to that location. ASD, Atrial Septal Defect; PFO, Patent Foramen Ovale; VSD, Ventricular Septal Defect; PDA, Patent Ductus Arteriosus.
The Intersection over Union (IoU) quantifies the alignment between the model’s predicted regions and the expert-annotated ground truth regions. As shown in Fig. 5, our model can accurately localize the relevant lesions (or regions of interest in normal cases) with satisfactory IoU scores (e.g., reaching 0.83 for the VSD case and 0.71 for the PFO case in the presented samples). The dashed green lines in the detection output column further facilitate a direct comparison, confirming that the model focus is consistent with clinical knowledge.
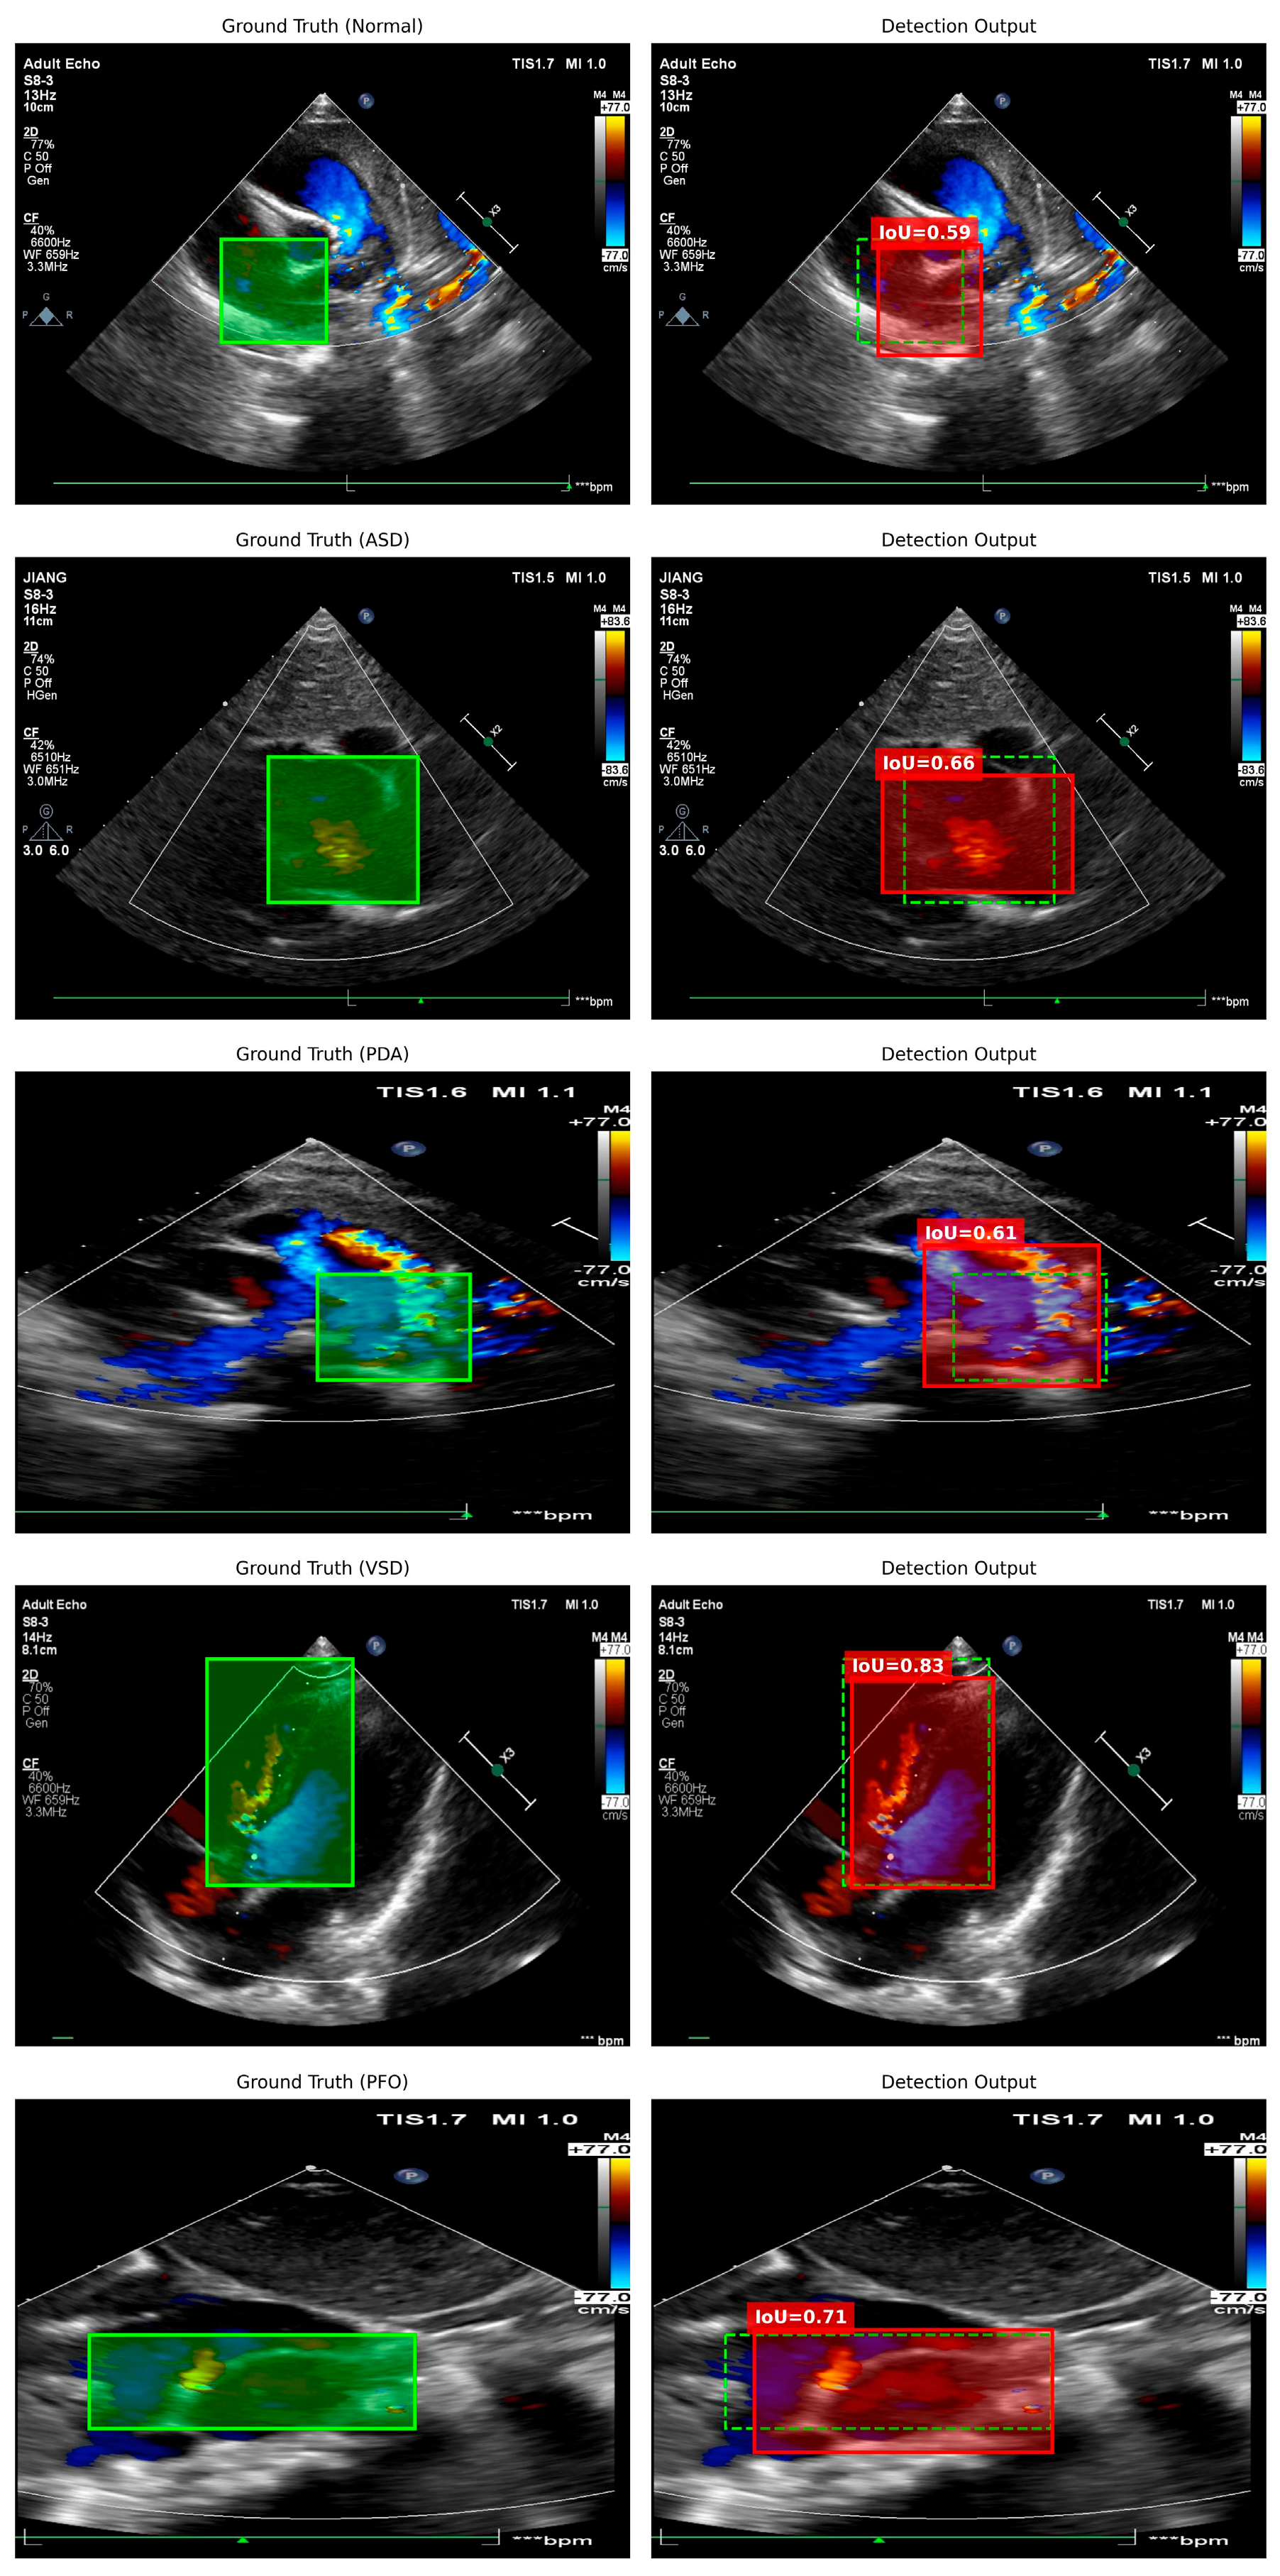
Figure 5: The Intersection Over Union (IoU) between the model-attended regions and the expert-annotated ground truth regions. The left column displays the ground truth regions (green boxes) annotated by clinical experts, while the right column shows the detection output (red boxes) predicted by our model, overlaid with the calculated IoU scores. ASD, Atrial Septal Defect; PFO, Patent Foramen Ovale; VSD, Ventricular Septal Defect; PDA, Patent Ductus Ar-teriosus.
3.2.2 Data Imbalance Problem—Analysis of Results for PDA Experiments
The classification experiment results presented in Table 2 show that although the ResNet50 and GBCnet models achieve a zero false positive rate in identifying PDA, they exhibit a significantly high false negative rate. This is attributed to the significant imbalance in the dataset, where PDA samples are substantially fewer than ASD + PFO and VSD. Under such conditions, a zero false positive rate for PDA identification is clinically meaningless. However, the OBICnet model demonstrates markedly improved performance in PDA identification. To interpret this result, the PDA recognition performance of its two branches (Branch 1 and Branch 2) was independently evaluated. In the experiment, PDA was designated as the positive category, while all remaining categories were collectively classified as the negative category. The experimental results comparing the performance of Branch 1 and Branch 2 are presented in Table 3. The graphical visualization of the experimental results for the target detection part of Branch 1 is presented in Fig. 6. By integrating the empirical findings from Table 3 and Fig. 6, it can be observed that the Branch 1 module exhibits an extremely high false negative rate for PDA, however, the inclusion of Branch 2 mitigates this issue to some extent and facilitates the correction of prediction outcomes during the final stage of disease discrimination.
Table 3: Experimental results comparing the performance of Branch 1 and Branch 2 modules in PDA identification.
| Models | Disease | Accuracy | Precision | Recall Rate | False Positive Rate | False Negative Rate |
|---|---|---|---|---|---|---|
| Branch 1 | PDA | 46.47% | 100.00% | 42.86% | 0.00% | 57.14% |
| Branch 2 | PDA | 100.00% | 100.00% | 100.00% | 0.00% | 0.00% |
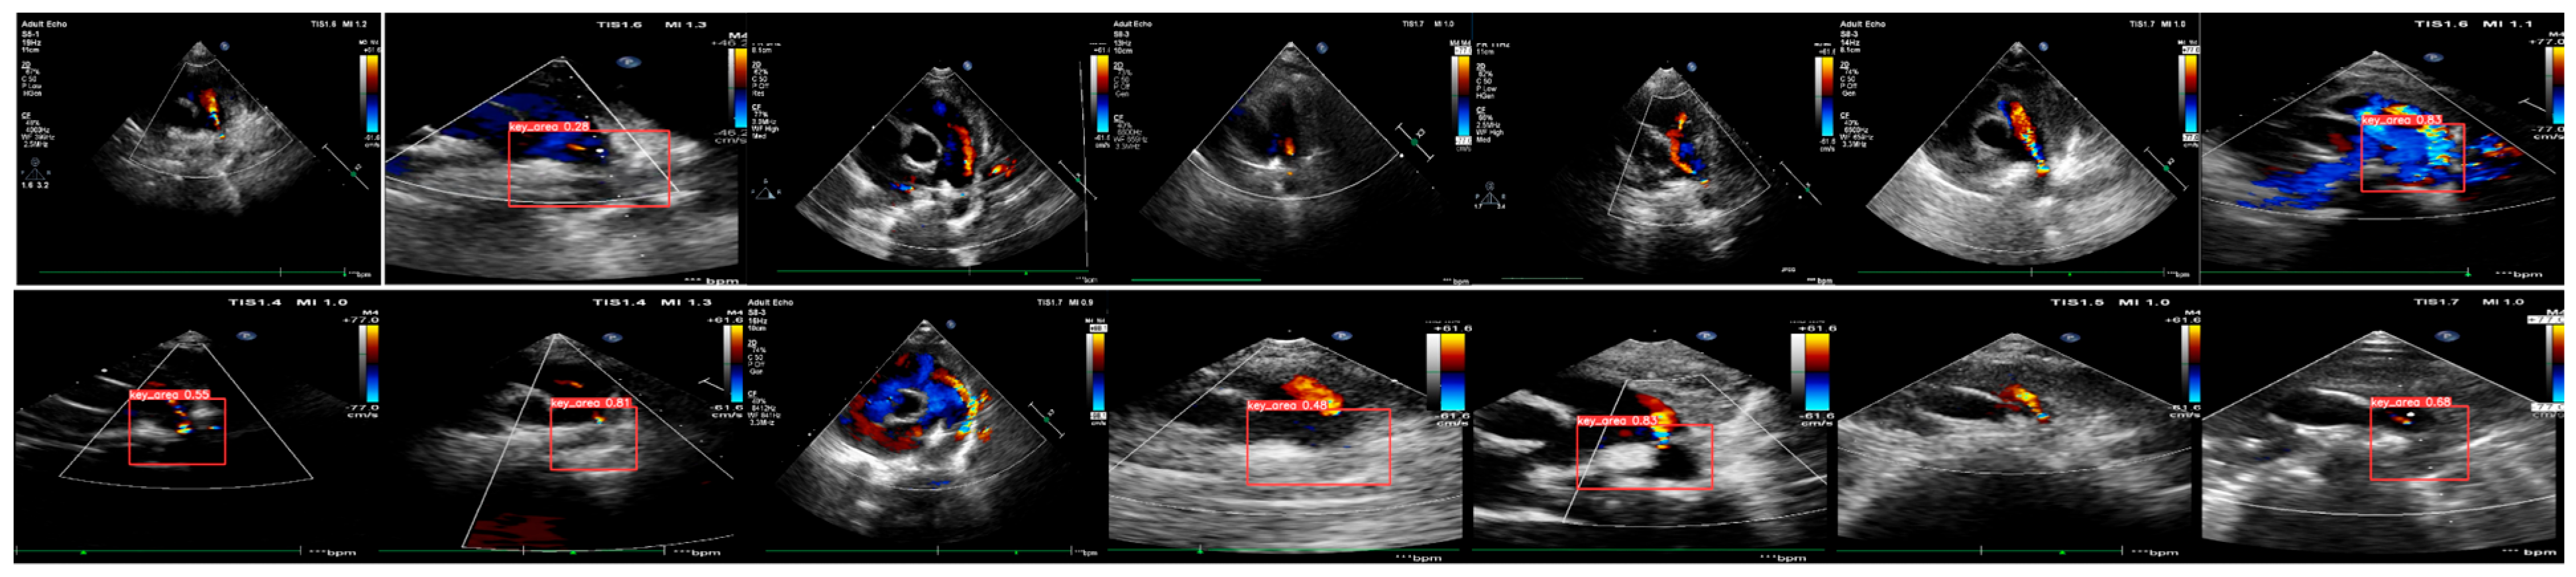
Figure 6: The visualized experimental results for object detection of Branch 1 during the identification of PDA.
3.3 Experimental Results of Four-Class Classification in Children Based on Multi-View Analysis
The disease classification for each child was determined through the analysis of multi-view images, with a diagnosis assigned if any single view indicated the presence of a specific disease. In cases where a child is diagnosed with multiple conditions (e.g., concurrent ASD and VSD), each positive disease label is treated as an independent instance to enable a comprehensive evaluation of the model’s ability to distinguish distinct pathological types. Given that pediatric disease diagnosis relies on a comprehensive integration of multi-view analysis results, the performance of different models in image-based disease classification directly affects the accuracy of the patient-level disease classification.
The experimental results of multi-view four-class classification demonstrate that the OBICnet model outperforms the ResNet50, GBCnet, and AIEchoDx models in both disease-specific metrics—including accuracy, precision, and recall—and overall performance. Furthermore, the OBICnet model demonstrates significantly lower rates of misdiagnosis and missed diagnosis compared to the ResNet50, GBCnet, and AIEchoDx models. The experimental results of four-class classification in children across the four models (ResNet50, GBCnet, AIEchoDx and OBICnet) indicate that the proposed OBICnet model outperforms the ResNet50, GBCnet, and AIEchoDx classification algorithms in disease classification, as shown in Table 4.
Table 4: Experimental results of the four-class classification based on multi-view imaging in children.
| Models | Disease | Accuracy | Precision | Recall Rate | False Positive Rate | False Negative Rate |
|---|---|---|---|---|---|---|
| ResNet50 | ALL | 91.28% | 63.41% | 66.82% | 6.33% | 33.18% |
| ASD + PFO | 90.77% | 92.68% | 86.36% | 5.61% | 13.64% | |
| VSD | 95.90% | 94.29% | 84.62% | 1.28% | 15.38% | |
| PDA | 92.82% | 0.00% | 0.00% | 0.00% | 100.00% | |
| GBCnet | ALL | 94.22% | 90.53% | 81.68% | 4.01% | 18.32% |
| ASD + PFO | 93.47% | 97.56% | 87.91% | 1.85% | 12.09% | |
| VSD | 95.98% | 88.10% | 92.50% | 3.14% | 7.50% | |
| PDA | 96.48% | 100.00% | 50.00% | 0.00% | 50.00% | |
| AIEchoDx | ALL | 87.56% | 64.26% | 60.05% | 4.18% | 39.94% |
| ASD + PFO | 93.92% | 47.15% | 42.29% | 2.90% | 57.70% | |
| VSD | 97.23% | 90.90% | 93.74% | 2.01% | 6.24% | |
| PDA | 96.40% | 42.85% | 24.99% | 1.14% | 74.99% | |
| OBICnet | ALL | 98.97% | 97.38% | 98.60% | 0.86% | 1.41% |
| ASD + PFO | 99.48% | 100.00% | 98.86% | 0.00% | 1.14% | |
| VSD | 98.45% | 94.87% | 97.37% | 1.28% | 2.63% | |
| PDA | 100.00% | 100.00% | 100.00% | 0.00% | 0.00% |
3.4 Preliminary External Data Validation Results
Based on an external independent validation dataset with a limited sample size, the OBICnet model demonstrates good classification performance. The accuracy of the single-image disease classification algorithm based on the OBICnet model was 92.30%, while the multi-view disease classification accuracy was 90.50%. These findings from the preliminary external validation are presented in Table 5 and Table 6.
Table 5: Experimental results of the OBICnet model classification based on images in external data.
| Models | Disease | Accuracy | Precision | Recall Rate | False Positive Rate | False Negative Rate |
|---|---|---|---|---|---|---|
| OBICnet | ALL | 92.29% | 85.31% | 85.34% | 4.40% | 14.66% |
| ASD | 94.57% | 82.14% | 83.64% | 3.39% | 16.36% | |
| VSD | 98.57% | 88.89% | 96.97% | 1.26% | 3.03% | |
| PDA | 98.57% | 75.00% | 66.67% | 0.59% | 33.33% |
Table 6: Experimental results of the OBICnet model classification based on multi-view imaging in external data.
| Models | Disease | Accuracy | Precision | Recall Rate | False Positive Rate | False Negative Rate |
|---|---|---|---|---|---|---|
| OBICnet | ALL | 90.50% | 79.98% | 84.52% | 8.65% | 15.47% |
| ASD | 90.00% | 78.26% | 100.00% | 15.62% | 0.00% | |
| VSD | 94.00% | 83.33% | 100.00% | 8.57% | 0.00% | |
| PDA | 90.00% | 75.00% | 66.67% | 4.88% | 33.33% |
Convolution Neural Network has demonstrated significant potential in the field of image-based medical imaging [18]. By integrating image processing techniques with ultrasound imaging, the diagnostic efficiency can be enhanced while reducing errors stemming from subjective interpretation. The efficiency and robustness of AI technology make it well-suited to become a preferred tool for ultrasound screening of heart disease [18,19]. Significant progress has been made in the application of AI to echocardiography [11,12,13,27,28]. However, research on AI-driven intelligent interpretation and diagnosis of CHD remains limited [29]. This study developed a practical AI model to identify and classify common CHDs effectively, leveraging multi-view echocardiographic image data.
4.1 Four-Class Classification Based on Multi-View Analysis
Based on multi-view color Doppler echocardiographic imaging data, the OBICnet model proposed in this study demonstrates effectiveness in classifying common CHD into four classes: normal, ASD + PFO, VSD, and PDA. This model consists of two branches. Branch 1 employs the YOLOv5 object detection model to extract the key lesion regions from images, followed by the ResNet50 image classification model for disease classification. Branch 2 applies the ResNet50 model to entire image to perform disease classification. Feature fusion is performed to integrate the output results from both branches, thereby generating the final disease classification result. The model not only accounts for the specific key lesion regions to reduce interference from redundant information but also mitigates potential inaccurates caused by imperfect object detection. The integration of joint learning and scheduled sampling during training effectively mitigates error propagation between the object detection and disease classification modules in multi-stage classification, thereby improving overall classification performance. The OBICnet model demonstrates superior classification performance compared to the ResNet50, GBCnet, and AIEchoDx models, due to its two-stage and two-branch architecture. It achieves higher accuracy in four-class classification than the approach proposed by Wang et al., which also used multi-view echocardiography data for children with VSD and ASD [30]. Wang et al. reported that the two-dimensional keyframe model achieved an accuracy of 92.3% in three-class classification (negative, VSD, ASD), while the video-based model achieved 93.9% accuracy in binary classification and 92.1% in three-class classification.
4.2 Visualization Experiment of the Model’s Features
The visualization map of the model’s intermediate outputs indicates that the two branches of the OBICnet model can more effectively focus on the key lesion regions. The classification module in Branch 1 of the OBICnet model is specifically designed to learn features from the key lesion regions during training; thus, during inference, it places greater emphasis on detailed features within these regions. The classification module in Branch 2 of the OBICnet model learns features from the entire image during training; however, influenced by Branch 1, it also pays greater attention to the key lesion regions, thereby achieving improved classification accuracy. The OBICnet model employs a two-stage architecture to enhance its focus on key lesion regions, while the two-branch structure ensures the preservation of global features alongside targeted attention to the lesion-specific features. This design mitigates the risk of misdiagnosis and missed diagnosis caused by either losing critical lesion regions when relying solely on holistic features or by erroneously focusing on non-relevant areas. By integrating the complementary capabilities of Branch 1 and Branch 2, the model achieves accurate detection of key lesion regions and precise disease classification, further demonstrating the advancement of the proposed OBICnet model.
4.3 Data Imbalance Problem—Analysis of Results for PDA Experiments
The amount of PDA data used in this study is substantially limited, leading to severe dataset imbalance. Consequently, the object detection module of the GBCnet model ncountered difficulties in accurately capturing PDA lesion characteristics during training, thereby impairing PDA recognition performance. Similarly, the AIEchoDx model fails to sufficiently attend to the critical PDA regions, resulting in a high rate of missed PDA diagnoses. Although the ResNet50 module mitigates false recognition caused by the lack of object detection mechanism by extracting features from the entire image, its performance remains suboptimal due to model learning being biased toward majority classes under severe data imbalance. As a result, the GBCnet, AIEchoDx, and ResNet50 models all exhibit poor performance in identifying PDA. In contrast, the OBICnet model incorporates an object detection module in Branch 1, which enables the ResNet50 module in Branch 2 to more effectively focus on critical lesion regions. This design partially mitigates the impact of data imbalance and significantly improves PDA recognition and classification accuracy. Furthermore, the OBICnet model not only enhances performance in detecting ASD + PFO and VSD but also achieves relatively superior results in identifying PDA, despite the extremely limited data availability. These findings indicate that the proposed two-branch, two-stage OBICnet model effectively enhance model performance and mitigates the influence of data imbalance to certain extent by integrating multi-task joint learning—encompassing object detection, key region feature extraction, and whole-image feature analysis—and employing a scheduled sampling strategy to optimize output generation.
Notably, although Branch 2 achieved 100% accuracy in the PDA binary classification test (29 positives vs. 29 negatives), this was primarily attributed to rigorous patient-level partitioning and the salient visual characteristics of the lesion. Due to the limited test sample size, this perfect performance may not fully generalize to larger or multi-center clinical settings with greater heterogeneity. External validation on larger cohorts is warranted in future work.
4.4 Clinical Significance of Multi-View Analysis
In clinical practice, multiple echocardiographic views are routinely employed for the diagnosis of CHD. Relying on a single view is insufficient to support reliable diagnostic conclusions and substantially increases the risk of missed diagnoses [31]. For instance, conditions such as PDA, sinus venosus ASD, and outflow tract VSD cannot be accurately identified using only a four-chamber view. Previous studies have mainly focused on intelligent recognition using the four-chamber view, which has led to missed diagnoses of certain cardiac conditions. Wang et al. further demonstrated that intelligent recognition based on multi-view echocardiography achieves higher accuracy compared to single view approaches [30]. In this study, we employed seven standard echocardiographic views: PSLA, PSSA, P4C, P5C, S4C, S2C, and SSLA. A combination of one to seven views was utilized for each case, with positive cases confirmed to demonstrate at least one abnormal finding among the acquired views. The application of this methodology resulted in highly favorable outcomes for the four-class classification in our study. In pediatric patients, the multi-view dataset-based four-class classification achieved a high accuracy of 98.97%, with a notably low false-negative rate of 1.41%.
4.5 Clinical Application Prospects
The OBICnet model proposed in this study demonstrates robust performance in classifying CHDs using color static echocardiography. It effectively identifies and classifies the most common CHD types—ASD + PFO, VSD, PDA—with high accuracy. Validation on an independent external dataset confirms the model’s strong classification capability. The multi-view four-class classification experiment shows that OBICnet achieves an accuracy exceeding 90%, highlighting its potential for clinical application. This AI-based algorithm is expected to facilitate intelligent CHD screening using color Doppler echocardiography. Additional anticipated benefits include alleviating the shortage of paediatric echocardiographers in primary care and resource-limited settings; improving early detection rates and diagnostic efficiency; promoting standardization and consistency in the echocardiographic evaluation of CHD; and supporting clinical teaching and related activities related in CHD echocardiography.
4.6 Limitations and Future Directions
This study focuses on the four-class classification of static color Doppler ultrasound images. However, in clinical practice, the CHD’s diagnosis typically relies on dynamic video sequences. Additionally, significant cardiac anatomical abnormalities or pulmonary hypertension may lead to marked changes in cardiac chamber size or alterations in shunt direction, factors that are not fully captured by the current model. Moreover, image quality in real-world examinations may be compromised by patient movement, crying, or acoustic interference, all of which can adversely affect model performance. Furthermore, this study only screened for atrial septal abnormal shunts and could not accurately differentiate between ASD and PFO.
The number of PDA samples in the dataset is substantially lower than that of ASD + PFO and VSD samples. This imbalance likely contributes to model overfitting in the PDA category, leading to high overall AUC value and suboptimal performance during external validation, as evidenced by a low recall rate. The OBICnet model does not employ specialized loss re-weighting techniques (such as Focal Loss) or oversampling methods to further improve recall rate. Furthermore, due to the limited size of the external validation cohort, conventional parametric statistical tests (e.g., t-tests or ANOVA) or the estimation of robust confidence intervals may lack sufficient statistical power and could yield potentially misleading interpretations.
Future research will focus on developing of intelligent classification algorithms for CHD ultrasound video data. Efforts will also be directed toward expanding the range of disease categories covered, and evaluating model robustness under varying image quality conditions. Furthermore, we will expand the dataset and conduct large-scale, prospective, multicenter validation to comprehensively assess model performance across varied clinical settings. Statistically, we will employ non-parametric statistical methods to enhance the rigor of performance evaluation and explicitly report confidence intervals for all key performance indicators, thereby providing interpretable quantitative assessments of the model’s predictive accuracy and clinical applicability. Integrating Focal Loss with advanced augmentation techniques will be a key direction to mitigate class imbalance. We will progressively conduct research to validate the practicality and effectiveness of the OBICnet model in real-world clinical settings, thereby establishing it as an auxiliary tool for CHD clinical ultrasound screening.
The OBICnet model incorporates multi-task joint learning, integrating object detection, key region feature recognition, whole-image feature recognition, and a scheduled sampling strategy to achieve optimal performance. Despite a suboptimal recall rate for PDA, the model still demonstrates high diagnostic accuracy for VSD, ASD, and PDA, demonstrating strong potential for clinical application. This potential lies in its ability to advance medical education, standardize ultrasound screening protocols for CHD, and support large-scale echocardiographic screening initiatives, thereby improving early CHD detection rates and patient outcomes. This capability is particularly significant for primary cares and resource-limited settings, where access to specialized medical expertise is frequently limited.
Acknowledgement:
Funding Statement: This research was supported by Zhejiang Provincial Public Welfare Technology Application Research Project of China under Grant No. LGF22H180002.
Author Contributions: The authors confirm contribution to the paper as follows: Conceptualization, data curation, writing—original draft preparation, writing—review and editing, Yanan Pan; methodology, data curation, writing—original draft preparation, writing—review and editing, Zhiwei Zhang; data curation, title page methodology, validation, Mengmeng Su; supervision, project administration, Xiaohua Pan; resources, supervision, project administration, Jingjing Ye; resources, writing—review and editing, funding acquisition, supervision, project administration, Jin Yu; funding acquisition, supervision, project administration, Weize Xu. All authors reviewed and approved the final version of the manuscript.
Availability of Data and Materials: The data that support the findings of this study are available from the Corresponding Authors, Weize Xu, Jin Yu, upon reasonable request.
Ethics Approval: This study was approved from the ethics board of the Children’s Hospital, Zhejiang University School of Medicine (No. 2021-IRB-286). In the approval process, the committee granted a formal exemption of informed consent for this study.
Conflicts of Interest: The authors declare no conflicts of interest.
Supplementary Materials: The supplementary material is available online at https://www.techscience.com/doi/10.32604/schd.2026.079240/s1.
References
1. GBD 2021 Diseases and Injuries Collaborators . Global incidence, prevalence, years lived with disability (YLDs), disability-adjusted life-years (DALYs), and healthy life expectancy (HALE) for 371 diseases and injuries in 204 countries and territories and 811 subnational locations, 1990–2021: a systematic analysis for the Global Burden of Disease Study 2021. Lancet. 2024; 403( 10440): 2133– 61. doi:10.1016/S0140-6736(24)00757-8. [Google Scholar] [CrossRef]
2. Zhang X , Feng Y , Ren J , Jin X , Li J , Hou Y , et al. Global, regional, and national burden of congenital heart disease, 1990–2021: a systematic analysis for the global burden of disease study 2021. Eur J Pediatr. 2025; 184( 4): 253. doi:10.1007/s00431-025-06085-w. [Google Scholar] [CrossRef]
3. Ma K , He Q , Dou Z , Hou X , Li X , Zhao J , et al. Current treatment outcomes of congenital heart disease and future perspectives. Lancet Child Adolesc Health. 2023; 7( 7): 490– 501. doi:10.1016/S2352-4642(23)00076-7. [Google Scholar] [CrossRef]
4. Qiu YX , Jiang W , Zhang JY , Li D , Yu K , Fu CC , et al. Using echocardiography in newborn screening for congenital heart disease may reduce missed diagnoses. World J Pediatr. 2022; 18( 9): 629– 31. doi:10.1007/s12519-022-00560-2. [Google Scholar] [CrossRef]
5. Chun H , Yue Y , Wang Y , Dawa Z , Zhen P , La Q , et al. High prevalence of congenital heart disease at high altitudes in Tibet. Eur J Prev Cardiolog. 2019; 26( 7): 756– 9. doi:10.1177/2047487318812502. [Google Scholar] [CrossRef]
6. Li JJ , Liu Y , Xie SY , Zhao GD , Dai T , Chen H , et al. Newborn screening for congenital heart disease using echocardiography and follow-up at high altitude in China. Int J Cardiol. 2019; 274: 106– 12. doi:10.1016/j.ijcard.2018.08.102. [Google Scholar] [CrossRef]
7. Zhao L , Chen L , Yang T , Wang T , Zhang S , Chen L , et al. Birth prevalence of congenital heart disease in China, 1980–2019: a systematic review and meta-analysis of 617 studies. Eur J Epidemiol. 2020; 35( 7): 631– 42. doi:10.1007/s10654-020-00653-0. [Google Scholar] [CrossRef]
8. Zhao QM , Liu F , Wu L , Ma XJ , Niu C , Huang GY . Prevalence of congenital heart disease at live birth in China. J Pediatr. 2019; 204: 53– 8. doi:10.1016/j.jpeds.2018.08.040. [Google Scholar] [CrossRef]
9. Itchhaporia D . Artificial intelligence in cardiology. Trends Cardiovasc Med. 2022; 32( 1): 34– 41. doi:10.1016/j.tcm.2020.11.007. [Google Scholar] [CrossRef]
10. Assis Alves J , Melo MM , Teixeira LM , Bravo-Valenzuela NJ , Araujo E Jr . Applications of artificial intelligence on fetal echocardiography. CHD. 2025; 20( 3): 369– 81. doi:10.32604/chd.2025.066358. [Google Scholar] [CrossRef]
11. Zhang Z , Zhu Y , Liu M , Zhang Z , Zhao Y , Yang X , et al. Artificial intelligence-enhanced echocardiography for systolic function assessment. J Clin Med. 2022; 11( 10): 2893. doi:10.3390/jcm11102893. [Google Scholar] [CrossRef]
12. Chao CJ , Kato N , Scott CG , Lopez-Jimenez F , Lin G , Kane GC , et al. Unsupervised machine learning for assessment of left ventricular diastolic function and risk stratification. J Am Soc Echocardiogr. 2022; 35( 12): 1214– 25.e8. doi:10.1016/j.echo.2022.06.013. [Google Scholar] [CrossRef]
13. Romero-Pacheco A , Perez-Gonzalez J , Hevia-Montiel N . Estimating echocardiographic myocardial strain of left ventricle with deep learning. Annu Int Conf IEEE Eng Med Biol Soc. 2022; 2022: 3891– 4. doi:10.1109/EMBC48229.2022.9872008. [Google Scholar] [CrossRef]
14. Reddy CD , Van den Eynde J , Kutty S . Artificial intelligence in perinatal diagnosis and management of congenital heart disease. Semin Perinatol. 2022; 46( 4): 151588. doi:10.1016/j.semperi.2022.151588. [Google Scholar] [CrossRef]
15. Arnaout R , Curran L , Zhao Y , Levine JC , Chinn E , Moon-Grady AJ . An ensemble of neural networks provides expert-level prenatal detection of complex congenital heart disease. Nat Med. 2021; 27( 5): 882– 91. doi:10.1038/s41591-021-01342-5. [Google Scholar] [CrossRef]
16. Meza JM , Slieker M , Blackstone EH , Mertens L , DeCampli WM , Kirklin JK , et al. A novel, data-driven conceptualization for critical left heart obstruction. Comput Methods Programs Biomed. 2018; 165: 107– 16. doi:10.1016/j.cmpb.2018.08.014. [Google Scholar] [CrossRef]
17. Diller GP , Babu-Narayan S , Li W , Radojevic J , Kempny A , Uebing A , et al. Utility of machine learning algorithms in assessing patients with a systemic right ventricle. Eur Heart J Cardiovasc Imaging. 2019; 20( 8): 925– 31. doi:10.1093/ehjci/jey211. [Google Scholar] [CrossRef]
18. Yoon YE , Kim S , Chang HJ . Artificial intelligence and echocardiography. J Cardiovasc Imaging. 2021; 29( 3): 193. doi:10.4250/jcvi.2021.0039. [Google Scholar] [CrossRef]
19. Kusunose K . Steps to use artificial intelligence in echocardiography. J Echocardiogr. 2021; 19( 1): 21– 7. doi:10.1007/s12574-020-00496-4. [Google Scholar] [CrossRef]
20. Diller GP , Lammers AE , Babu-Narayan S , Li W , Radke RM , Baumgartner H , et al. Denoising and artefact removal for transthoracic echocardiographic imaging in congenital heart disease: utility of diagnosis specific deep learning algorithms. Int J Cardiovasc Imaging. 2019; 35( 12): 2189– 96. doi:10.1007/s10554-019-01671-0. [Google Scholar] [CrossRef]
21. Liu B , Chang H , Yang D , Yang F , Wang Q , Deng Y , et al. A deep learning framework assisted echocardiography with diagnosis, lesion localization, phenogrouping heterogeneous disease, and anomaly detection. Sci Rep. 2023; 13( 1): 3. doi:10.1038/s41598-022-27211-w. [Google Scholar] [CrossRef]
22. Cheng M , Wang J , Liu X , Wang Y , Wu Q , Wang F , et al. Development and validation of a deep-learning network for detecting congenital heart disease from multi-view multi-modal transthoracic echocardiograms. Research. 2024; 7: 319. doi:10.34133/research.0319. [Google Scholar] [CrossRef]
23. Monkam P , Wang X , Liu S , Qian W , Yao Y , Shi X , et al. Deep learning-driven innovations in echocardiography: taxonomy, clinical impact, challenges, and opportunities. Ann Biomed Eng. 2026; 54( 3): 641– 78. doi:10.1007/s10439-025-03944-3. [Google Scholar] [CrossRef]
24. Bengio S , Vinyals O , Jaitly N , Shazeer N . Scheduled sampling for sequence prediction with recurrent neural networks. In: Proceedings of the 29th International Conference on Neural Information Processing Systems. Cambridge, MA, USA: MIT Press; 2015. p. 1171– 9. [Google Scholar]
25. Jiang X , Yu J , Ye J , Jia W , Xu W , Shu Q . A deep learning-based method for pediatric congenital heart disease detection with seven standard views in echocardiography. World J Pediatr Surg. 2023; 6( 3): e000580. doi:10.1136/wjps-2023-000580. [Google Scholar] [CrossRef]
26. Basu S , Gupta M , Rana P , Gupta P , Arora C . Surpassing the human accuracy: detecting gallbladder cancer from USG images with curriculum learning. In: Proceedings of the 2022 IEEE/CVF Conference on Computer Vision and Pattern Recognition (CVPR); 2022 Jun 18–24; New Orleans, LA, USA. p. 20854– 64. doi:10.1109/CVPR52688.2022.02022. [Google Scholar] [CrossRef]
27. Narang A , Mor-Avi V , Prado A , Volpato V , Prater D , Tamborini G , et al. Machine learning based automated dynamic quantification of left heart chamber volumes. Eur Heart J Cardiovasc Imaging. 2019; 20( 5): 541– 9. doi:10.1093/ehjci/jey137. [Google Scholar] [CrossRef]
28. Volpato V , Mor-Avi V , Narang A , Prater D , Gonçalves A , Tamborini G , et al. Automated, machine learning-based, 3D echocardiographic quantification of left ventricular mass. Echocardiography. 2019; 36( 2): 312– 9. doi:10.1111/echo.14234. [Google Scholar] [CrossRef]
29. de Siqueira VS , Borges MM , Furtado RG , Dourado CN , da Costa RM . Artificial intelligence applied to support medical decisions for the automatic analysis of echocardiogram images: a systematic review. Artif Intell Med. 2021; 120: 102165. doi:10.1016/j.artmed.2021.102165. [Google Scholar] [CrossRef]
30. Wang J , Liu X , Wang F , Zheng L , Gao F , Zhang H , et al. Automated interpretation of congenital heart disease from multi-view echocardiograms. Med Image Anal. 2021; 69: 101942. doi:10.1016/j.media.2020.101942. [Google Scholar] [CrossRef]
31. Rajpoot K , Grau V , Noble JA , Becher H , Szmigielski C . The evaluation of single-view and multi-view fusi on 3D echocardiography using image-driven segmentation and tracking. Med Image Anal. 2011; 15( 4): 514– 28. doi:10.1016/j.media.2011.02.007. [Google Scholar] [CrossRef]
Cite This Article
 Copyright © 2026 The Author(s). Published by Tech Science Press.
This work is licensed under a Creative Commons Attribution 4.0 International License , which permits unrestricted use, distribution, and reproduction in any medium, provided the original work is properly cited.
 Downloads
 Citation Tools
