
 Submit a Paper
 Propose a Special lssue
 Open Access
ARTICLE

Determination of Reflected Temperature in Active Thermography Measurements for Corrosion Quantification of Reinforced Concrete Elements
Faculty of Civil and Environmental Engineering, Bandung Institute of Technology, Bandung, 40132, Indonesia
* Corresponding Author: Suyadi Kartorono. Email:
Structural Durability & Health Monitoring 2023, 17(3), 195-208. https://doi.org/10.32604/sdhm.2022.023259
Received 16 April 2022; Accepted 23 June 2022; Issue published 25 June 2023
 View Full Text
 Download PDF
Abstract
This paper sums up the determining analysis of the measuring location of Trefl using a thermocouple during the thermography tests. Laboratory temperature distribution testing methods, analysis of value and location of Trefl measurement are explained in this paper. The heat source is two halogen lamps of 500 watts each fitted at a distance of 30–50 cm. Noises appearing during testing of thermography are corrected with measured Trefl value. The results of thermogram correction of corroded concrete surfaces using Trefl values are displayed in this paper too. The concrete surface temperature results of quantitative image processing method are compared to the experimental test results. The results showed good accuracy, which was seen from most errors <3% and the maximum error is <5%. The end of paper, explained of application Trefl value to the corroded reinforced concrete thermogram.Keywords
Nomenclature
| IRT | Infrared thermography |
| NDT | Non destructive test |
| Trefl | Reflected temperature (oC) |
| Ti | Initial temperature (oC) |
| Qc | Heat transfer by conduction process |
| Qv | Heat transfer by convection process |
| Qi | Heat process from internal indoor |
| Qm | Heat process from equipment indoor |
| Qs | Heat transfer from solar |
| hc | Heat transfer coefficient (Watt m−2.K−1) |
| v | Wind speed (ms−1) |
| Wtot | Total energy (Watt m−2) |
| Tobj | Surface temperature (oC) |
| Tatm | Athmosperic temperature (oC) |
| Tamb | Ambient temperature (oC) |
| dobj | Distance object to heat source (m) |
| dlamp | Distance between the lamp axles (m) |
| theat | Heating time (s) |
| dcam | Distance IR camera to object (m) |
| Ttc | Thermocouple temperature data (oC) |
Rebar corrosion can be detected by determining the temperature distributions on the concrete surface using an infrared camera [1]. Influences of rebar corrosion is to reduce its cross-sectional area and thermal coefficient of reinforced concrete around the rebar [2–4]. IRT has proven to be an important technique in NDT because it can quickly inspect a large area in real time [5]. Some studies thermography NDT methods for corrosion of reinforced concrete use qualitative techniques for processing thermogram [6–9]. Active thermography has been established as a method for quality monitoring [10].
Thermography is an imaging technique that uses the infrared radiation to create a thermal image. Due to changes induced in the thermal conductivity of materials, the superficial temperature pattern of a defected component can reveal delamination, voids, insertions, moisture, or changes in material continuity when heated [11]. Active thermography has emerged as an attractive and reliable technique for non-destructive testing [12,13]. Active infrared thermography method requires an external source of energy to induce a temperature difference between defective and nondefective areas in the specimen under examination [14,15]. The temperature due to volumetric heating increases approximately linearly during the heating stage, faster than surface heating [16]. Additionally, when using artificial thermal excitation sources, the problem with non-uniform heating occurs [17].
The image produced by infrared camera is interpreting of heat energy received by infrared camera thermal sensors still contains noise. Internal heat gain is because of the appliances, people, and lighting. Meanwhile, exterior heat gain is due to heat conduction, heat radiation, and heat gain because of ventilation. Outside air temperature affects the heat transfer process in the room, through conduction mechanism in the wall [18]. When active thermography testing is carried out indoor, the effect of heat source radiation to variations room temperature will be dominant, meanwhile, room temperature fluctuations will continue to occur. As a result, there is difficulty in finding the measurement location of reflected temperature (Trefl) value as a correction factor [4]. The reflected temperature is an important factor for performing accurate IR temperature measurements [19]. The emissivity of the object and the reflected temperature has but the very high influence on the temperature measurement [20]. The environmental temperature is often a reasonable estimate of reflected temperature [21], as long as no sources of a large amount of light or heat are near the object [22]. There is no mathematical model that would accurately describe the value of Trefl in every case. For this reason, to minimize the influence of Trefl on the value of Tobj, the value of Trefl should always be measured [23].
This study aims to determine the installation position of the thermocouple around the heat source, when active thermography testing uses a halogen lamp as a heat excitation source. The thermocouple measurement result is the reflected temperature (Trefl) value at the time of the thermography test. Based on the accuracy of the experimental tests, it is concluded that this research shows satisfactory results. At the end of the paper, some thermograms of corroded concrete surfaces before and after correction are also shown.
2 Reflected Temperature (Trefl) by Thermography Method
The amount of radiation received by an infrared camera sensor is also be affected by the transmission factor (τ), temperature (Tatm, in K), and the object’s emissivity (εobj). The total radiation per unit area (Wtot, in Wm−2) received by the infrared camera sensor is a combination of object radiation and environment (atmosphere). The total radiation received by the camera like Eq. (1) [24,25].
where σ is the Stefan-Boltzmann constant (ca 5,67 × 10⁻⁸ W m−2 K−4). The transmittance of the atmosphere is estimated using the relative humidity and the distance from the object to the camera [21]. The atmospheric transmission is close to 1.0 when the survey distance is small (e.g., the typical distance from approximately 3–5 m). So the temperature of the object (Tobj) only requires the measurement of emissivity and reflected temperature. In most cases, Trefl is the same as the atmospheric temperature (Tatm) for an object with high emissivity [24]. According to the handbook from FLIR Camera, Trefl is the same as Tamb [26], so Trefl can be written as Eq. (2) [4].
where Trefl is reflected temperature (K), Tobj is object surface temperature (K), Wtot is total radiation per unit area (Wm−2) and σ is the Stefan-Boltzmann constant (ca 5,67 × 10⁻⁸ Wm−2K−4).
Room temperature is related to the amount of heat running in and out of the room (heat gain). The heat gains vary over the 24 h of the day, as the solar intensity, occupancy, lights and appliances keep on varying with time [27]. Factors that affect the amount of room temperature during the irradiation process include external and internal factors. External factors that will change the temperature in the laboratory include water temperature, the wall, and temperature transmission. Internal factors that affect the room temperature come from computer equipment, tools, lighting, and humans. Those factors change simultaneously, so to accommodate them, one must measure the room temperature as initial (Ti) at the start of the measurement process.
Internal heat gain is caused by appliances, people, and lighting. Meanwhile, exterior heat gain is due to heat conduction, heat radiation, and heat gain because of ventilation. Outside air temperature affects the heat transfer process in the room, through conduction mechanism in the wall [18]. When using the infrared thermography camera inside the buildings, the characteristics of the place have to be considered [28].
This research uses a 1000-watt halogen lamp as a heat source. The optimum irradiation is generated at a 10 cm distance with a varied height between 200 Wm−2 to 1200 Wm−2 [29]. Heat transfer occurs through radiation, conduction, and convection mechanisms. The amount of heat transfer caused by convection depends on the heat transfer coefficient. Based on the research of James Oliver Smith [30], testing points expose to the heat source or “exposed area” acording to the following equation:
where hc is heat transfer coefficient (Wm−2 K−1) and ν is wind speed (ms−2). As indoor, so v = 0, then hc = 6.22 (Wm−2 K−1).
3.1 Tests Setup and Temperature Measurements
Room temperature measurements were carried out using a thermocouple data logger that was placed using the grid method every 10 cm. The two 500-watt halogen lamps are placed parallel to each other, as shown in Figs. 1 and 2. The laboratory room site plan as described in Fig. 2.
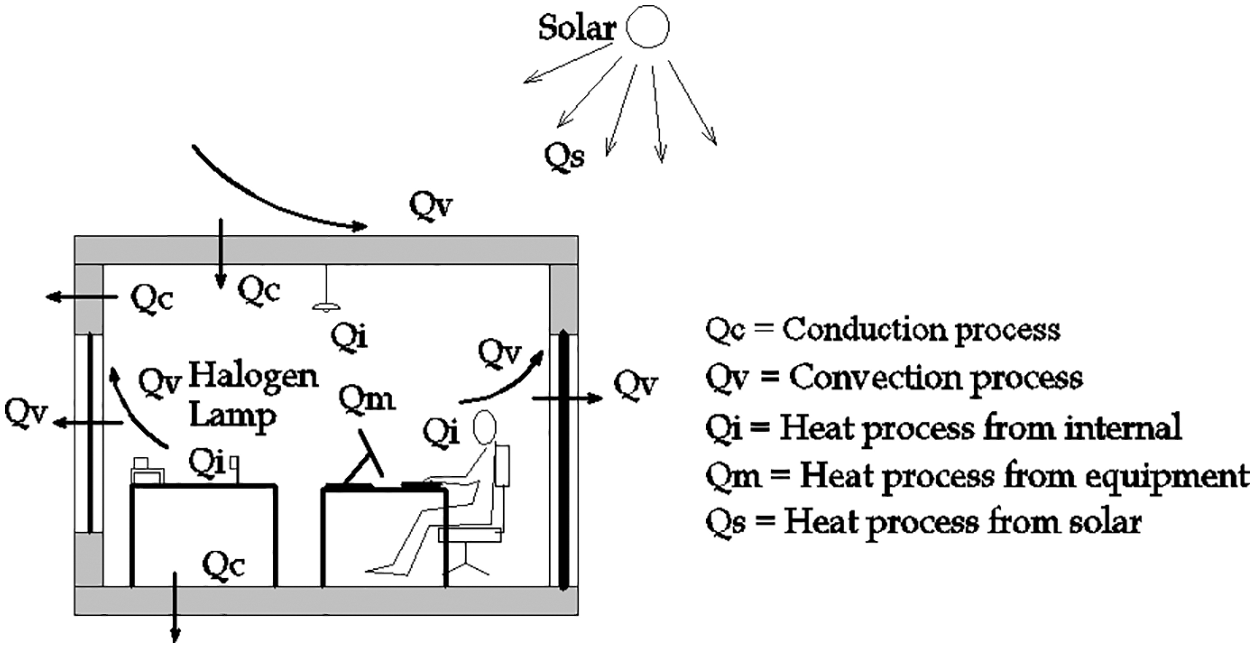
Figure 1: Heat exchange heating process at thermography active in the room
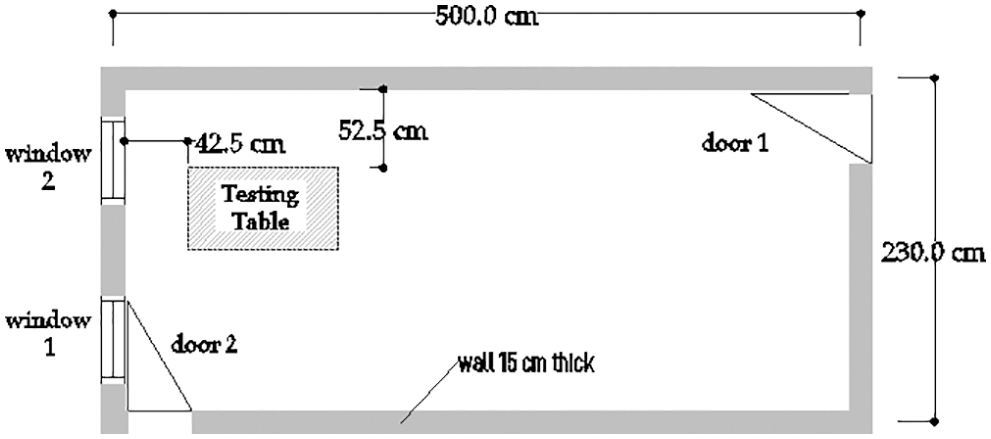
Figure 2: Laboratory room site plan
3.2 Specimens Parameter Sample
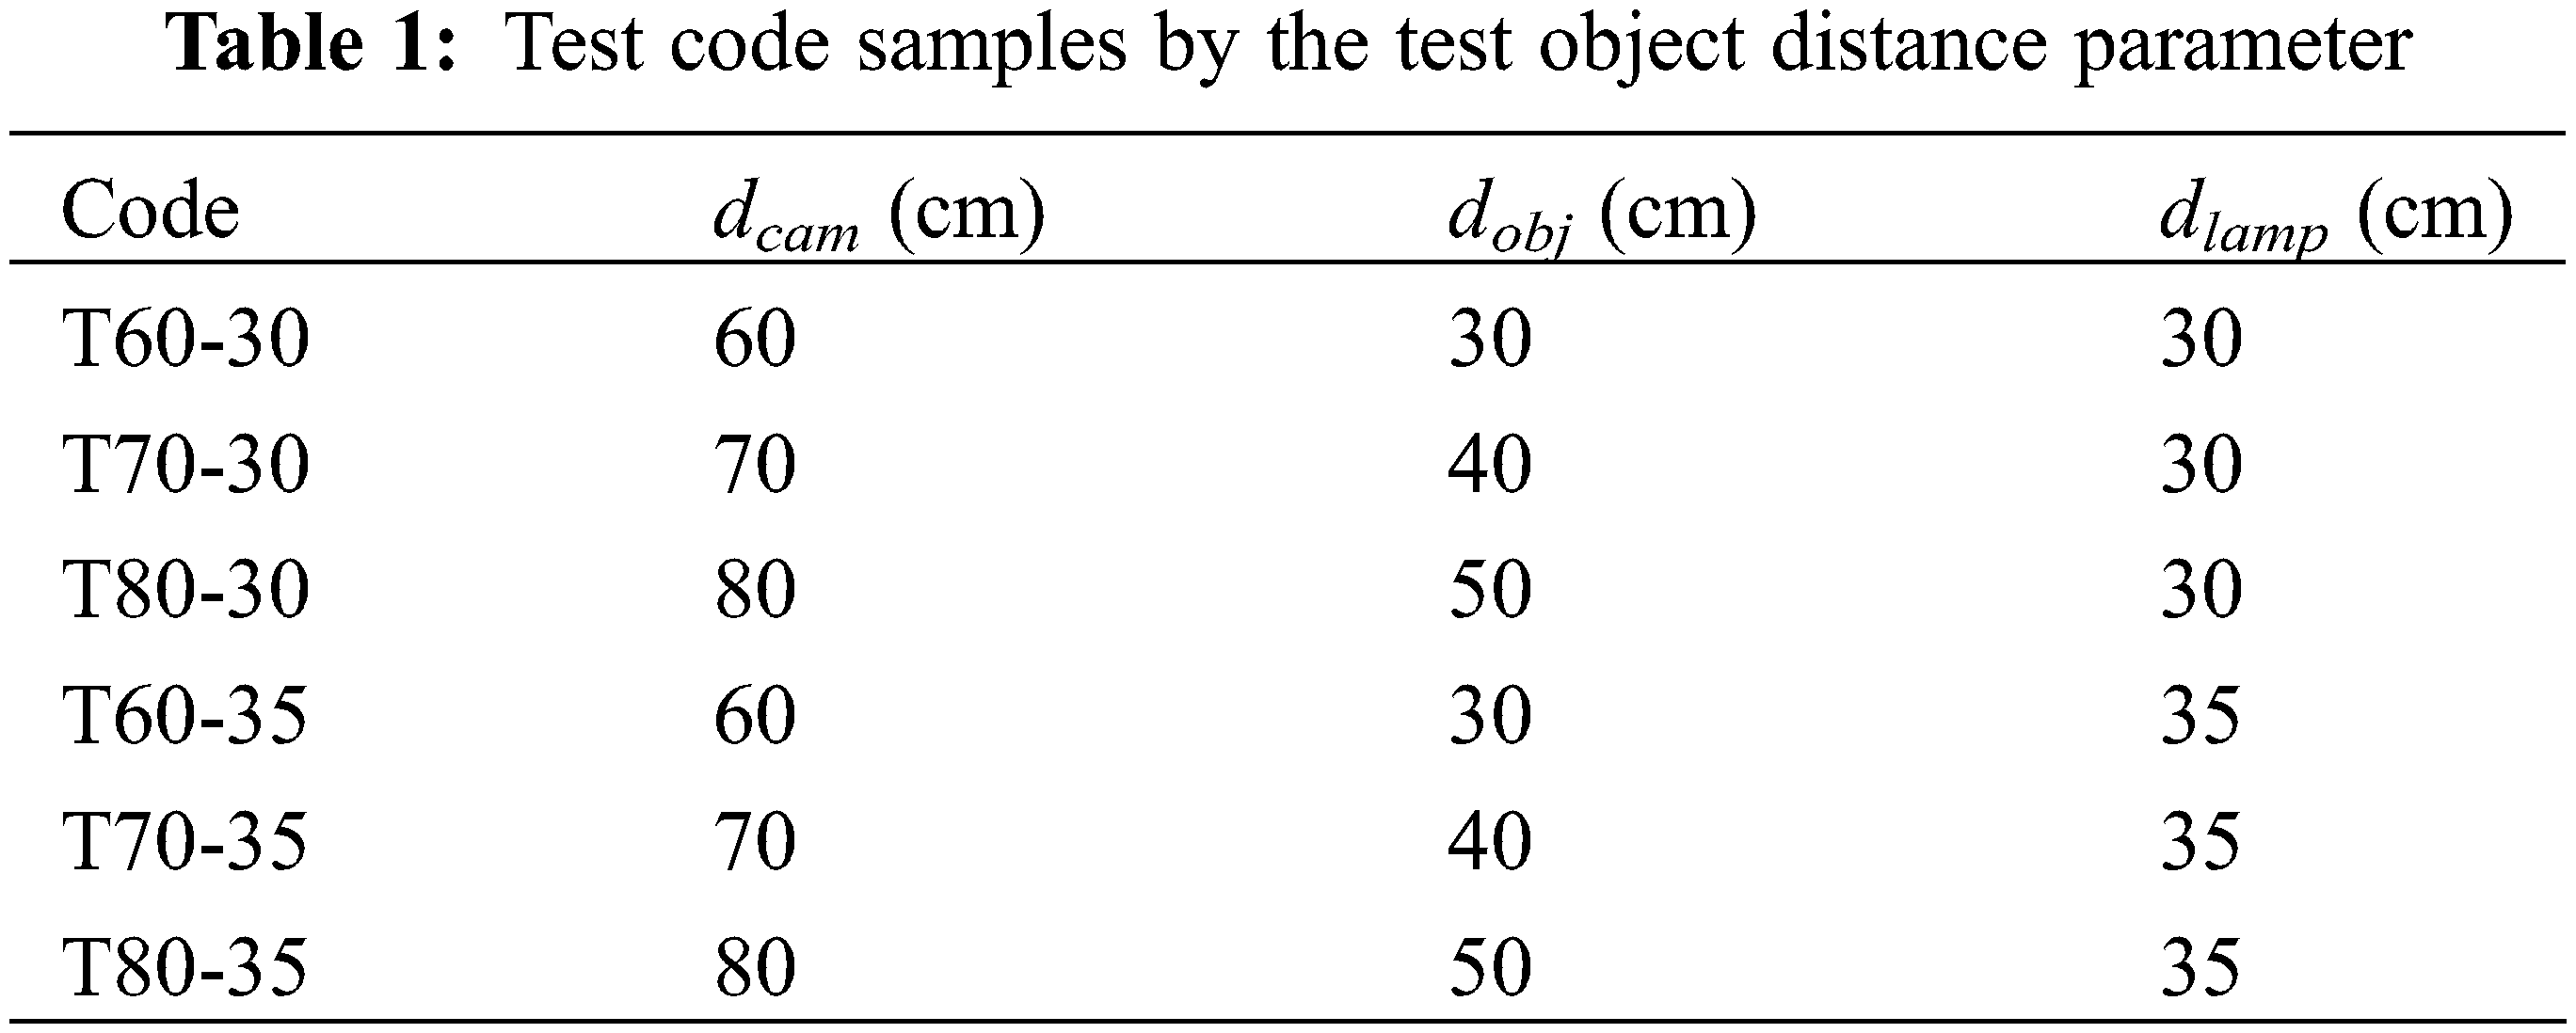
The Tatm value in this study used a value is 30.6°C as the initial temperature during testing (Ti). The others variable is distance camera (dcam) = (30 + dobj) cm; the lamp axles (dlamp) are 30 and 35 cm. To represent the test on normal strength concrete, a test object with a strength 20 MPa and dimensions of 10 cm × 10 cm × 15 cm was made and placed at a distance (dobj) is 30, 40, and 50 cm in front of the heat source, as shown in Figs. 3 and 5. The code of samples used in this research is displayed in Table 1. The thermal camera uses a FLIR E8-XT with 240 × 360 pixels. Thermal acquisition uses the sequence recording method at a speed of 8 fps. Temperature measurement of the concrete surface during the heating phase used 2 (two) thermocouples installed on the concrete surface and then used as a reference.
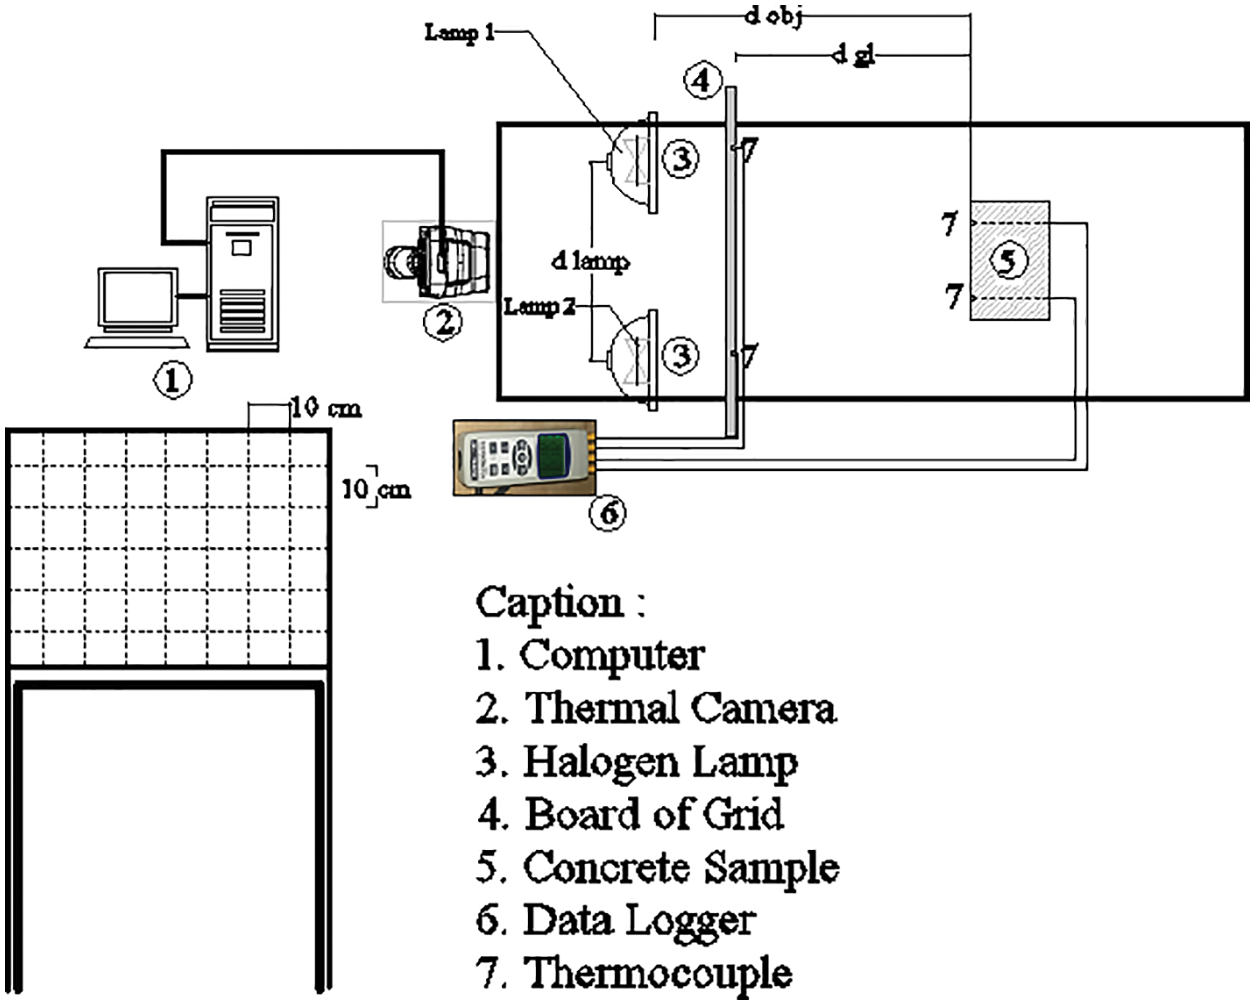
Figure 3: Testing the distribution of room temperature using the grid method
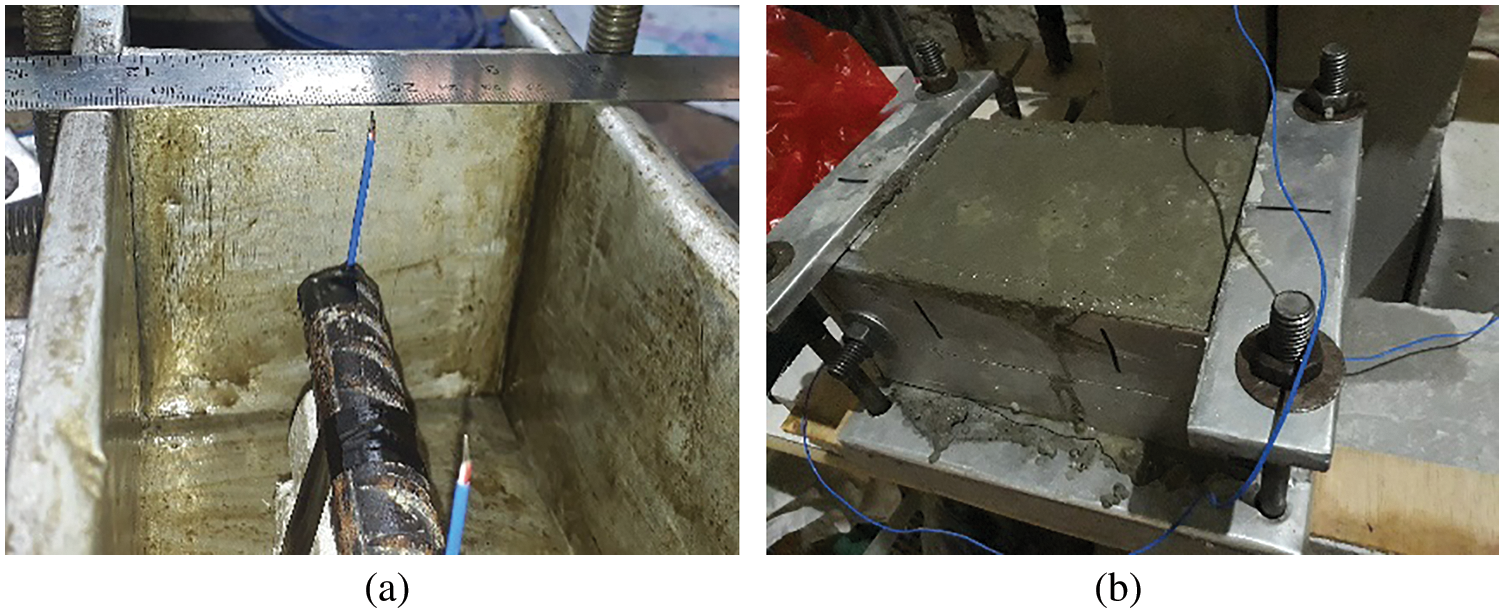
Figure 4: Thermocouple installation in the test concrete a) before b) after molding
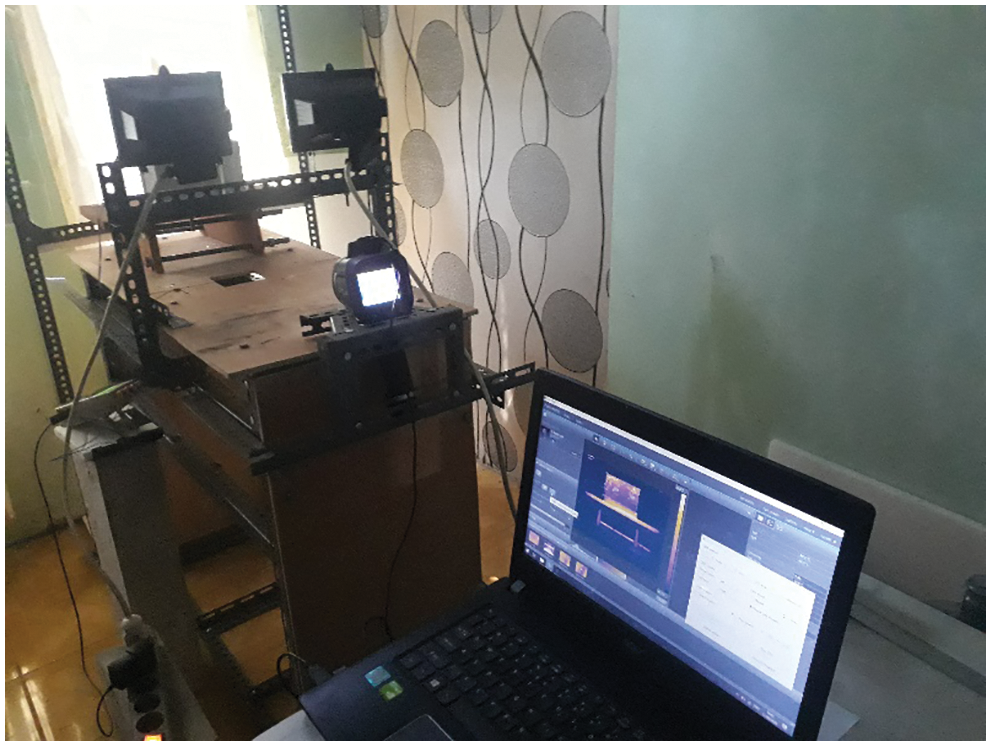
Figure 5: Testing concrete surface temperature used thermography and thermocouple method
Tests carried out at theat = 800 s–1800 s with time intervals of 50 s were all carried out three times. The Trefl values location analysis had been validated by experimental testing. These analysis are based on the contour of the temperature distribution at a distance of 10 cm from the face of the halogen lamp.
4.1 Change of the Surfaces Temperature
The temperature of the concrete surface changes significantly until t = 800 s, and then the change in the concrete surface temperature is linear until the heating phase is complete. This is caused by the maximum temperature bulb material of halogen lamp is maintained at 550°C when it is on. This condition makes the room temperature and the concrete surface are stable when the temperature of the halogen lamp reaches its peak. Based on this phenomena, so curve fitting analysis carried out by linear regression from theat = 800—1800 s (end of exposure).
Based on the curve-fitting results, the dominant deviation residual distribution was at the start of the exposure until 800 s and then smaller, as shown in Fig. 6. Besides, based on measurement data, the results show an increase in the concrete surface temperature proportionally with the irradiation time. It means that the peak surface temperature of the concrete occurs at the end of the irradiation time. Based on the results, a linear curve fitting achieved residual value (R2) = 98% as shown in Fig. 7.
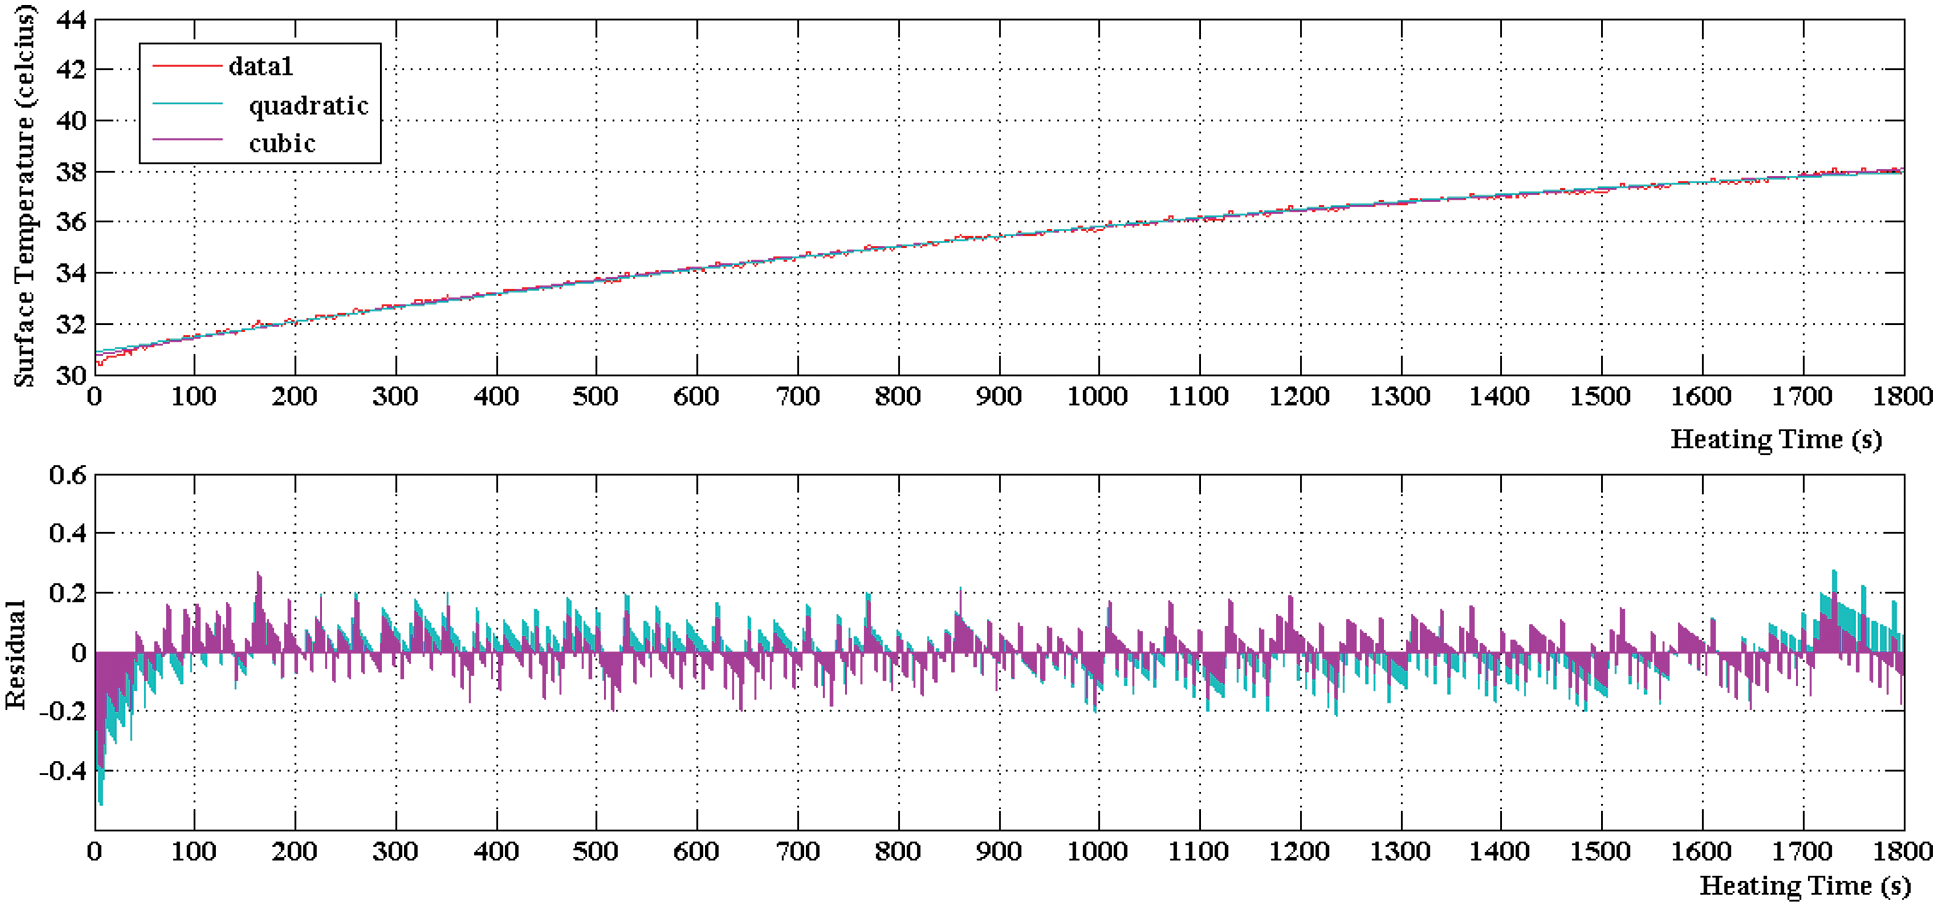
Figure 6: Temperature concrete surface and error distribution of curve fitting results during heating phase
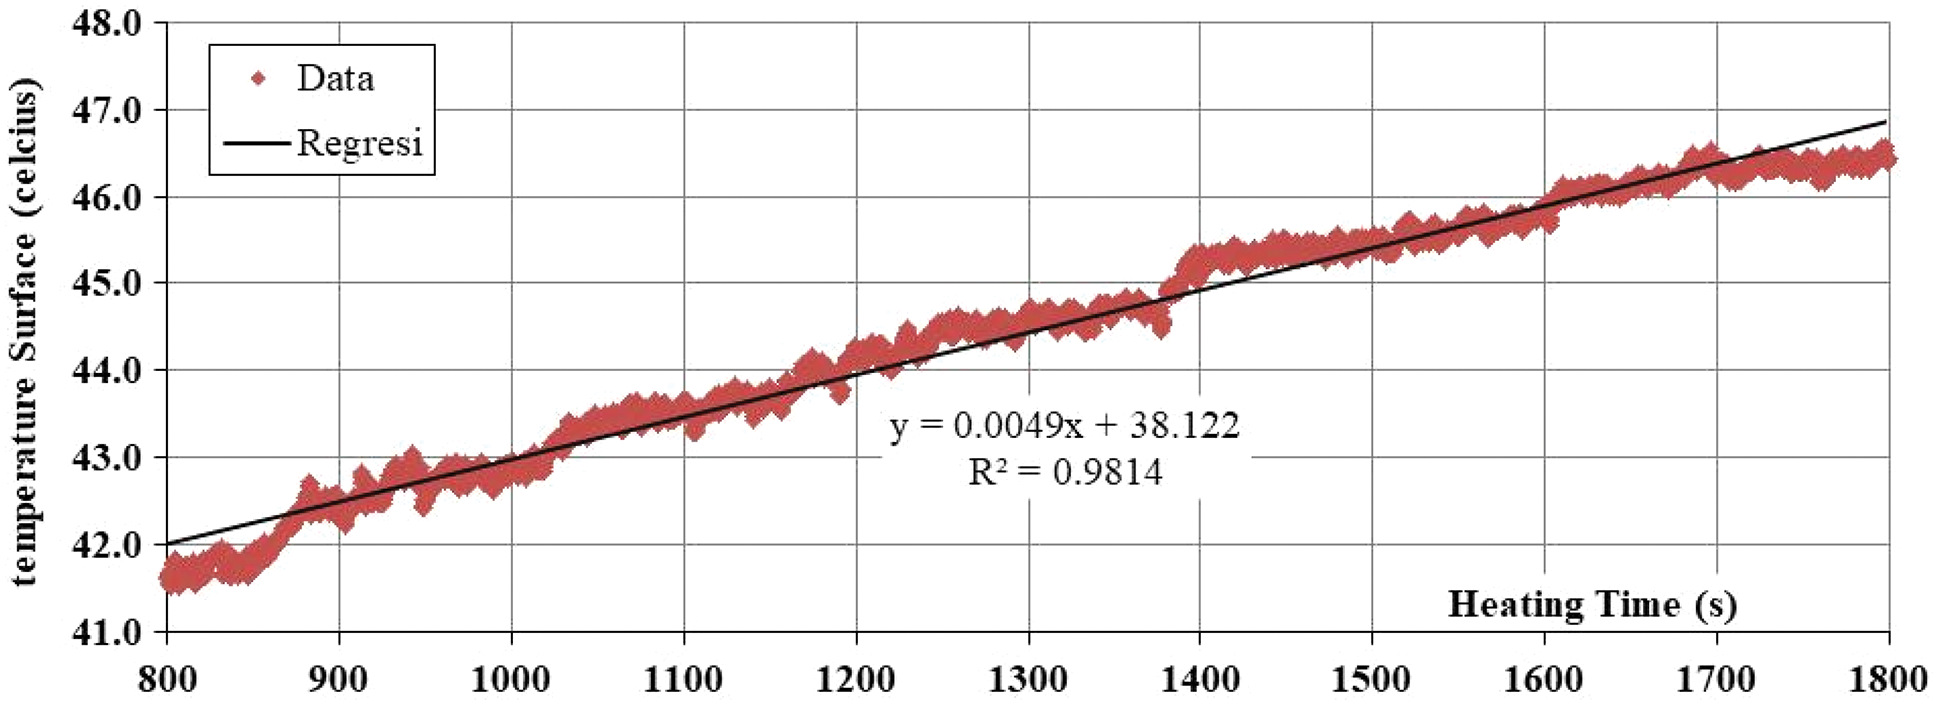
Figure 7: Concrete temperature at heating time 800–1800 s
The magnitude of the concrete surface temperature is affected by the distance between the concrete test temperature and the heat source. It means the effect of halogen lamp radiation on room temperature changes is dominant at a distance of 0.3 to 0.5 m, and therefore the convection effect on thermal transfer can be neglected.
The reflected temperature (Trefl) value was calculated based on the results of the curve-fitting analysis of the concrete surface temperature with the exposure time (theat) = 800–1800 s. The curve-fitting of Trefl value process is done by Matlab software. The value of Trefl is proportional to theat. The atmosphere that appears between the test object and the IR camera causes noise to always occur at the measured surface temperature, as shown in Fig. 8 [4]. These affect the values of τ and Trefl in Eq. (1), thus resulting in changes in the value of Tobj.
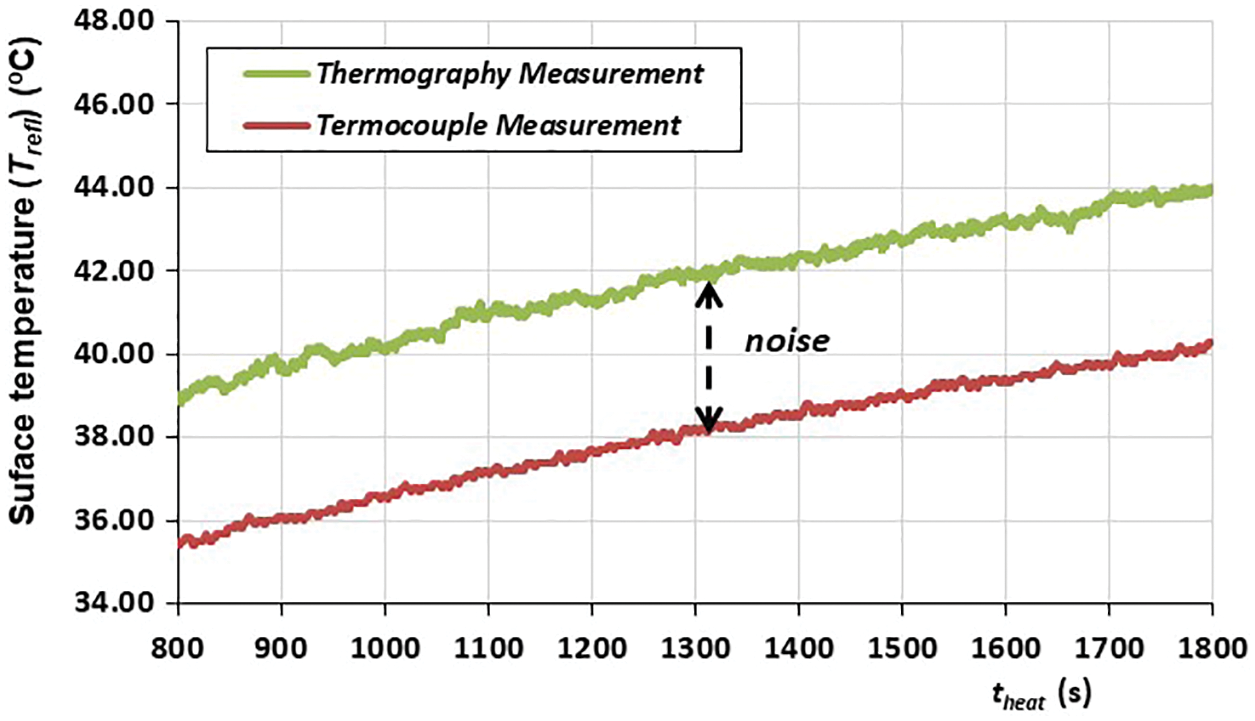
Figure 8: Noise between thermography with thermocouple measurement on surface temperature (Tsrf)
In this research, Tth is the concrete surface temperature as measured by the thermographic method, while the results of thermocouple measurements are denoted by Ttc. According to Stefan Boltzmann’s law, the heat energy of an object is proportional to the fourth power of the absolute temperature. So the total radiation (Wtot) received by the IR sensor is εobj σ T4tot. The actual object surface temperature (Tobj) is obtained by thermocouple measurement (Ttc), then Tobj = Ttc. Therefore, Trefl in Eq. (2) becomes as follows.
where Ttc and Tth are the surface temperature of the concrete results of the thermocouple test and the thermographic method, respectively. The results of the analysis of the Trefl value are shown in Figs. 9 and 10 [4]. The results of the analysis show that it increases at T60-30 and is smaller than at T70-30 or T80-30. This phenomenon occurs because the distance between the object to the heat source (dobj) affects the magnitude of free space between the heat source and the object. In addition, the radiation process from halogen lamps will continue, so the concrete surface will continue to absorb heat energy.
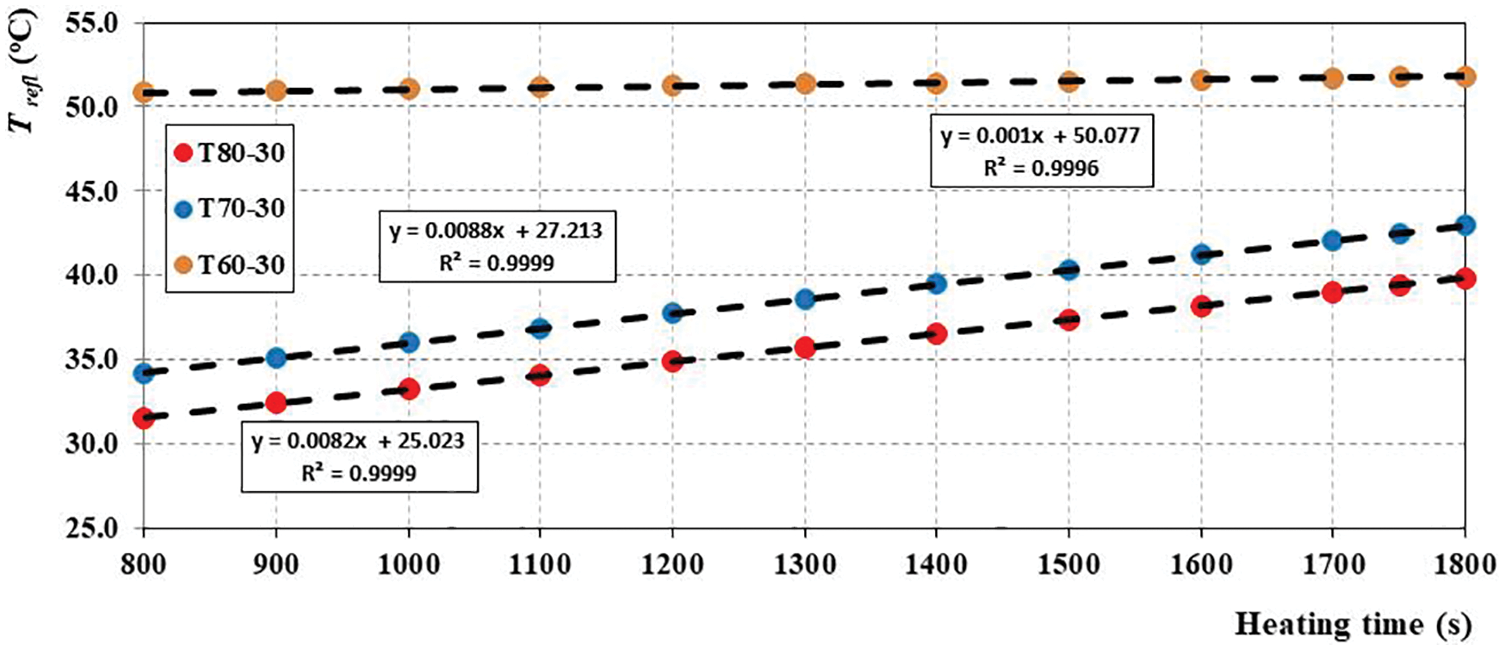
Figure 9: Trefl during the heating phase at several dcam and dlamp = 30 cm
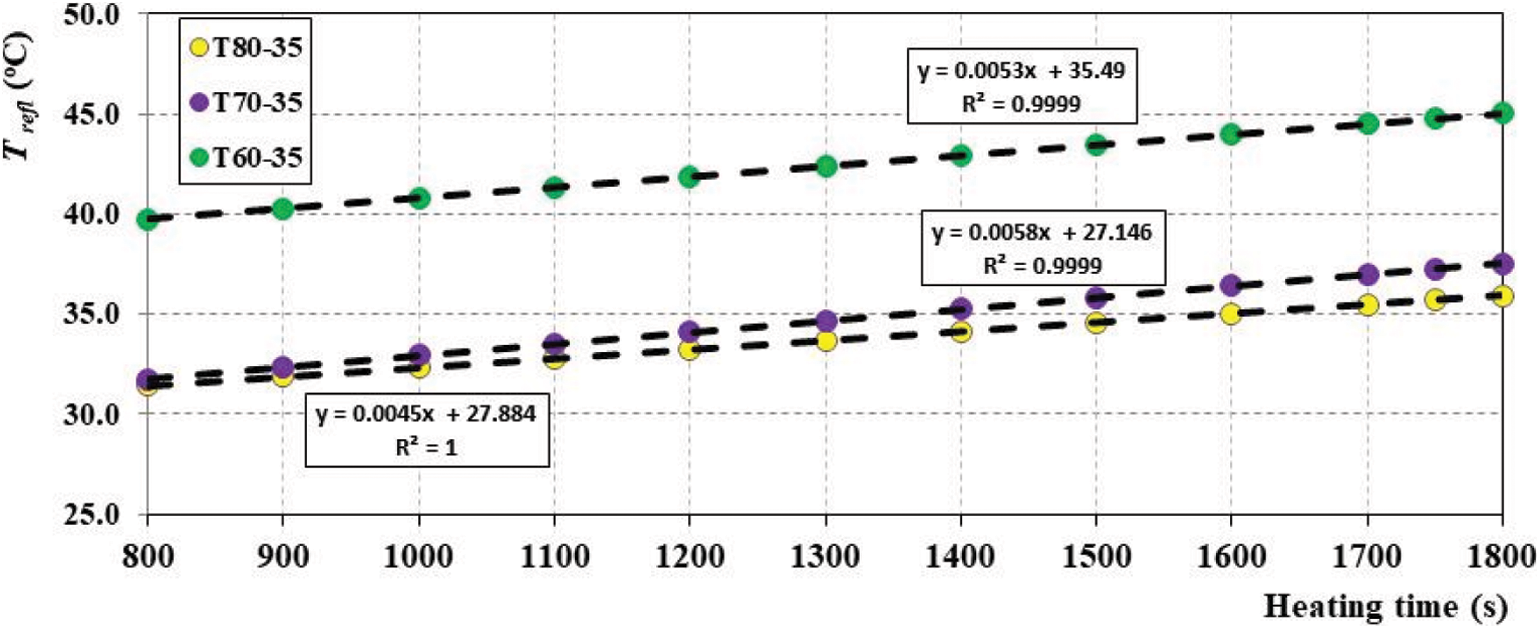
Figure 10: Trefl during the heating phase at several dcam and dlamp = 35 cm
4.3 Trefl Location Based on Heating Time
Trefl location analysis emphasizes the vertical distance above lamps 1 and 2 to the temperature contour lines at Trefl value, which was 10 cm in front of the lamp (heat source) for object distances (dcam) of 60, 70, and 80 cm. The average location, according to the analysis of the Trefl test point, of every heating time is shown in Figs. 11 and 12. The results of the Trefl location analysis are used to determine where the thermocouple lies and where its value would be used for noise correction in thermogram quantitative analysis [4].
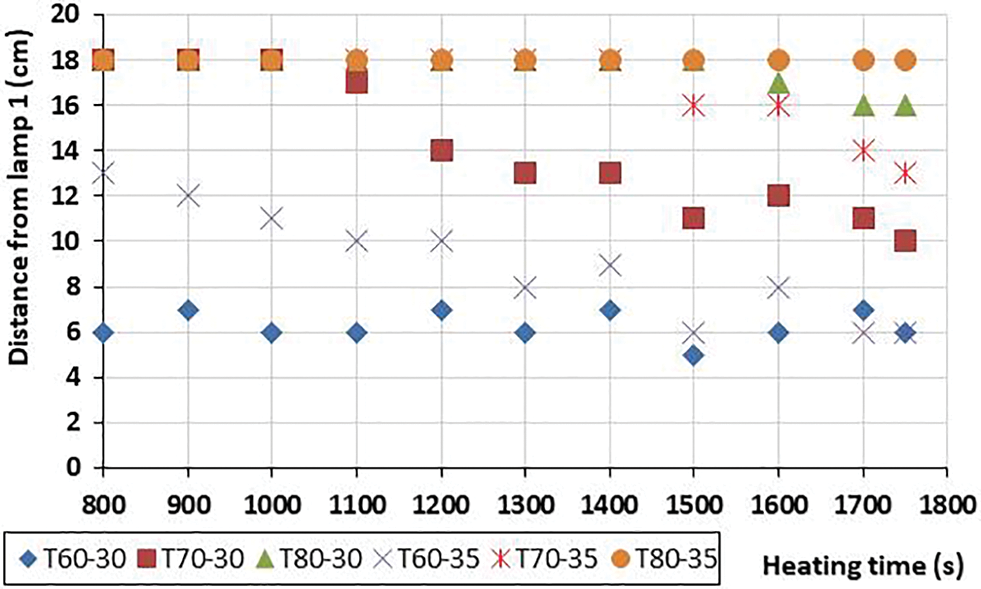
Figure 11: Trefl position of upper side from Lamp 1 at several dcam and dlamp
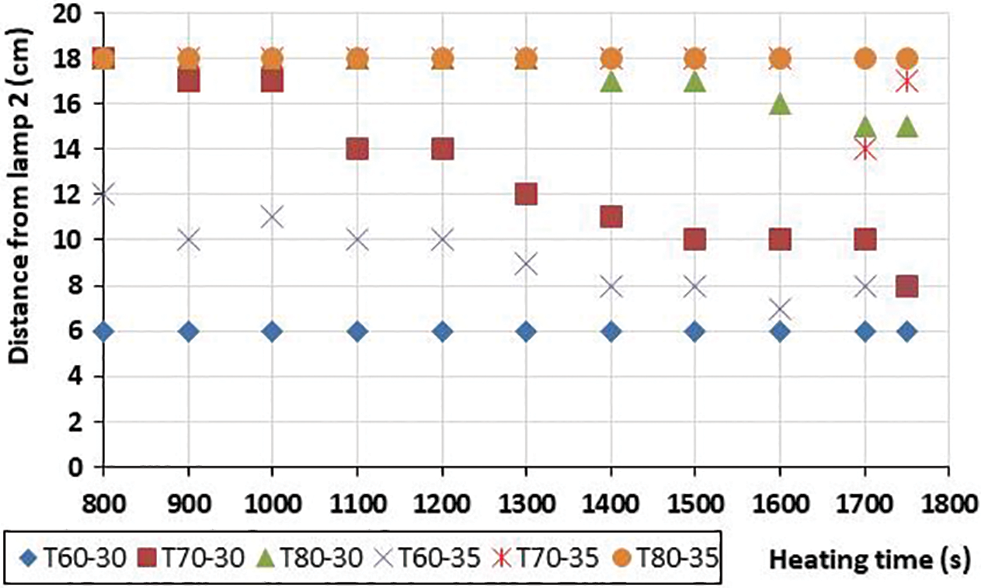
Figure 12: Trefl position of upper side from Lamp 2 at several dcam and dlamp
The analysis results for the Trefl locations at T60-30 were closer than the others. It is acceptable, as lighting illuminance is inversely proportional to the square of the object’s distance from the light source. The closer the object is to the lamp, the smaller the gradient of room temperature distribution in the concrete. The increase in the room temperature is followed by a rise in the surface temperature of the concrete. These phenomena make the Trefl position constant for the irradiation time from t = 800 to 1800 s. Trefl layout is 6 cm above the lamp for T60-30, T70-30 cm is quite varied (7 to 18 cm), and the T80-30 cm camera is at a distance of 18 cm. But Trefl layout will change if dlamp is 35 cm) [4].
This test will determine the accuracy of the concrete surface temperature resulting from the thermogram analysis using the Trefl value when compared to the measurement with a thermocouple. The Trefl value used to remove noise because of atmospheric conditions by Eq. (1), so Tobj as [24]:
Two thermocouples were installed on an objects that was used to measure surface temperature (Ttc) throughout the experimental testing. Meanwhile, two others were installed at the top of each halogen lamp to measure Trefl. Thermocouples to measure Trefl were mounted at 10 cm in front of the halogen lamp and measured at vertical distance according to the results of the analysis of the Trefl location on the contour line of the room temperature distribution [4]. Based on the trend line of change equation of concrete surface temperature, room temperature (Trefl) and heating time (t), at t = i and t expression as theat, so
Based on Fig. 13, we can show the temperature shift of the concrete surface before and after it has been corrected.
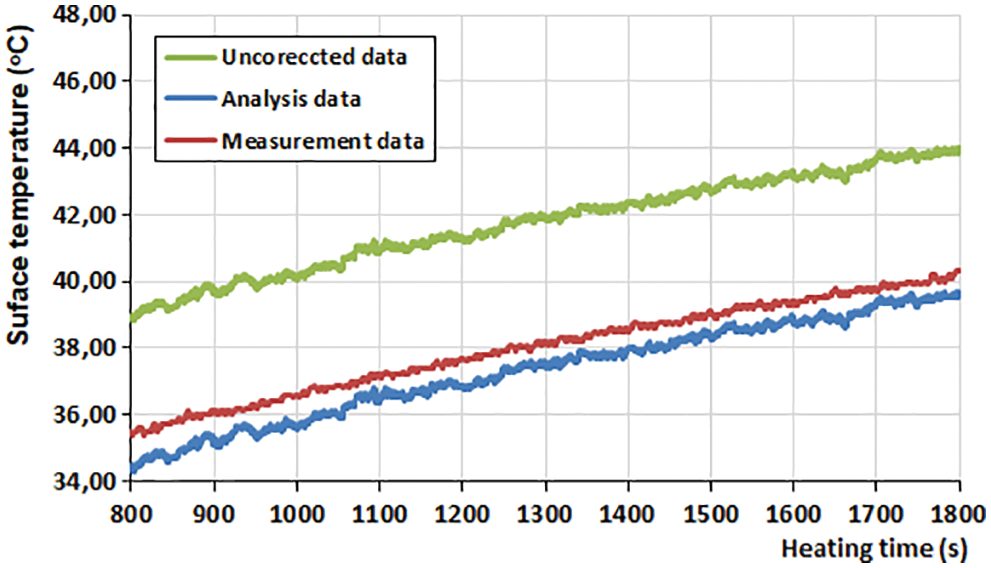
Figure 13: Surface temperature of concrete before and after noise correction
Error of analysis writen as:
The results of the error analysis can be seen below. The results analysis shows good accuracy, as can be seen from the average ΔTerr error percentage is <5% as shown in Fig. 14.
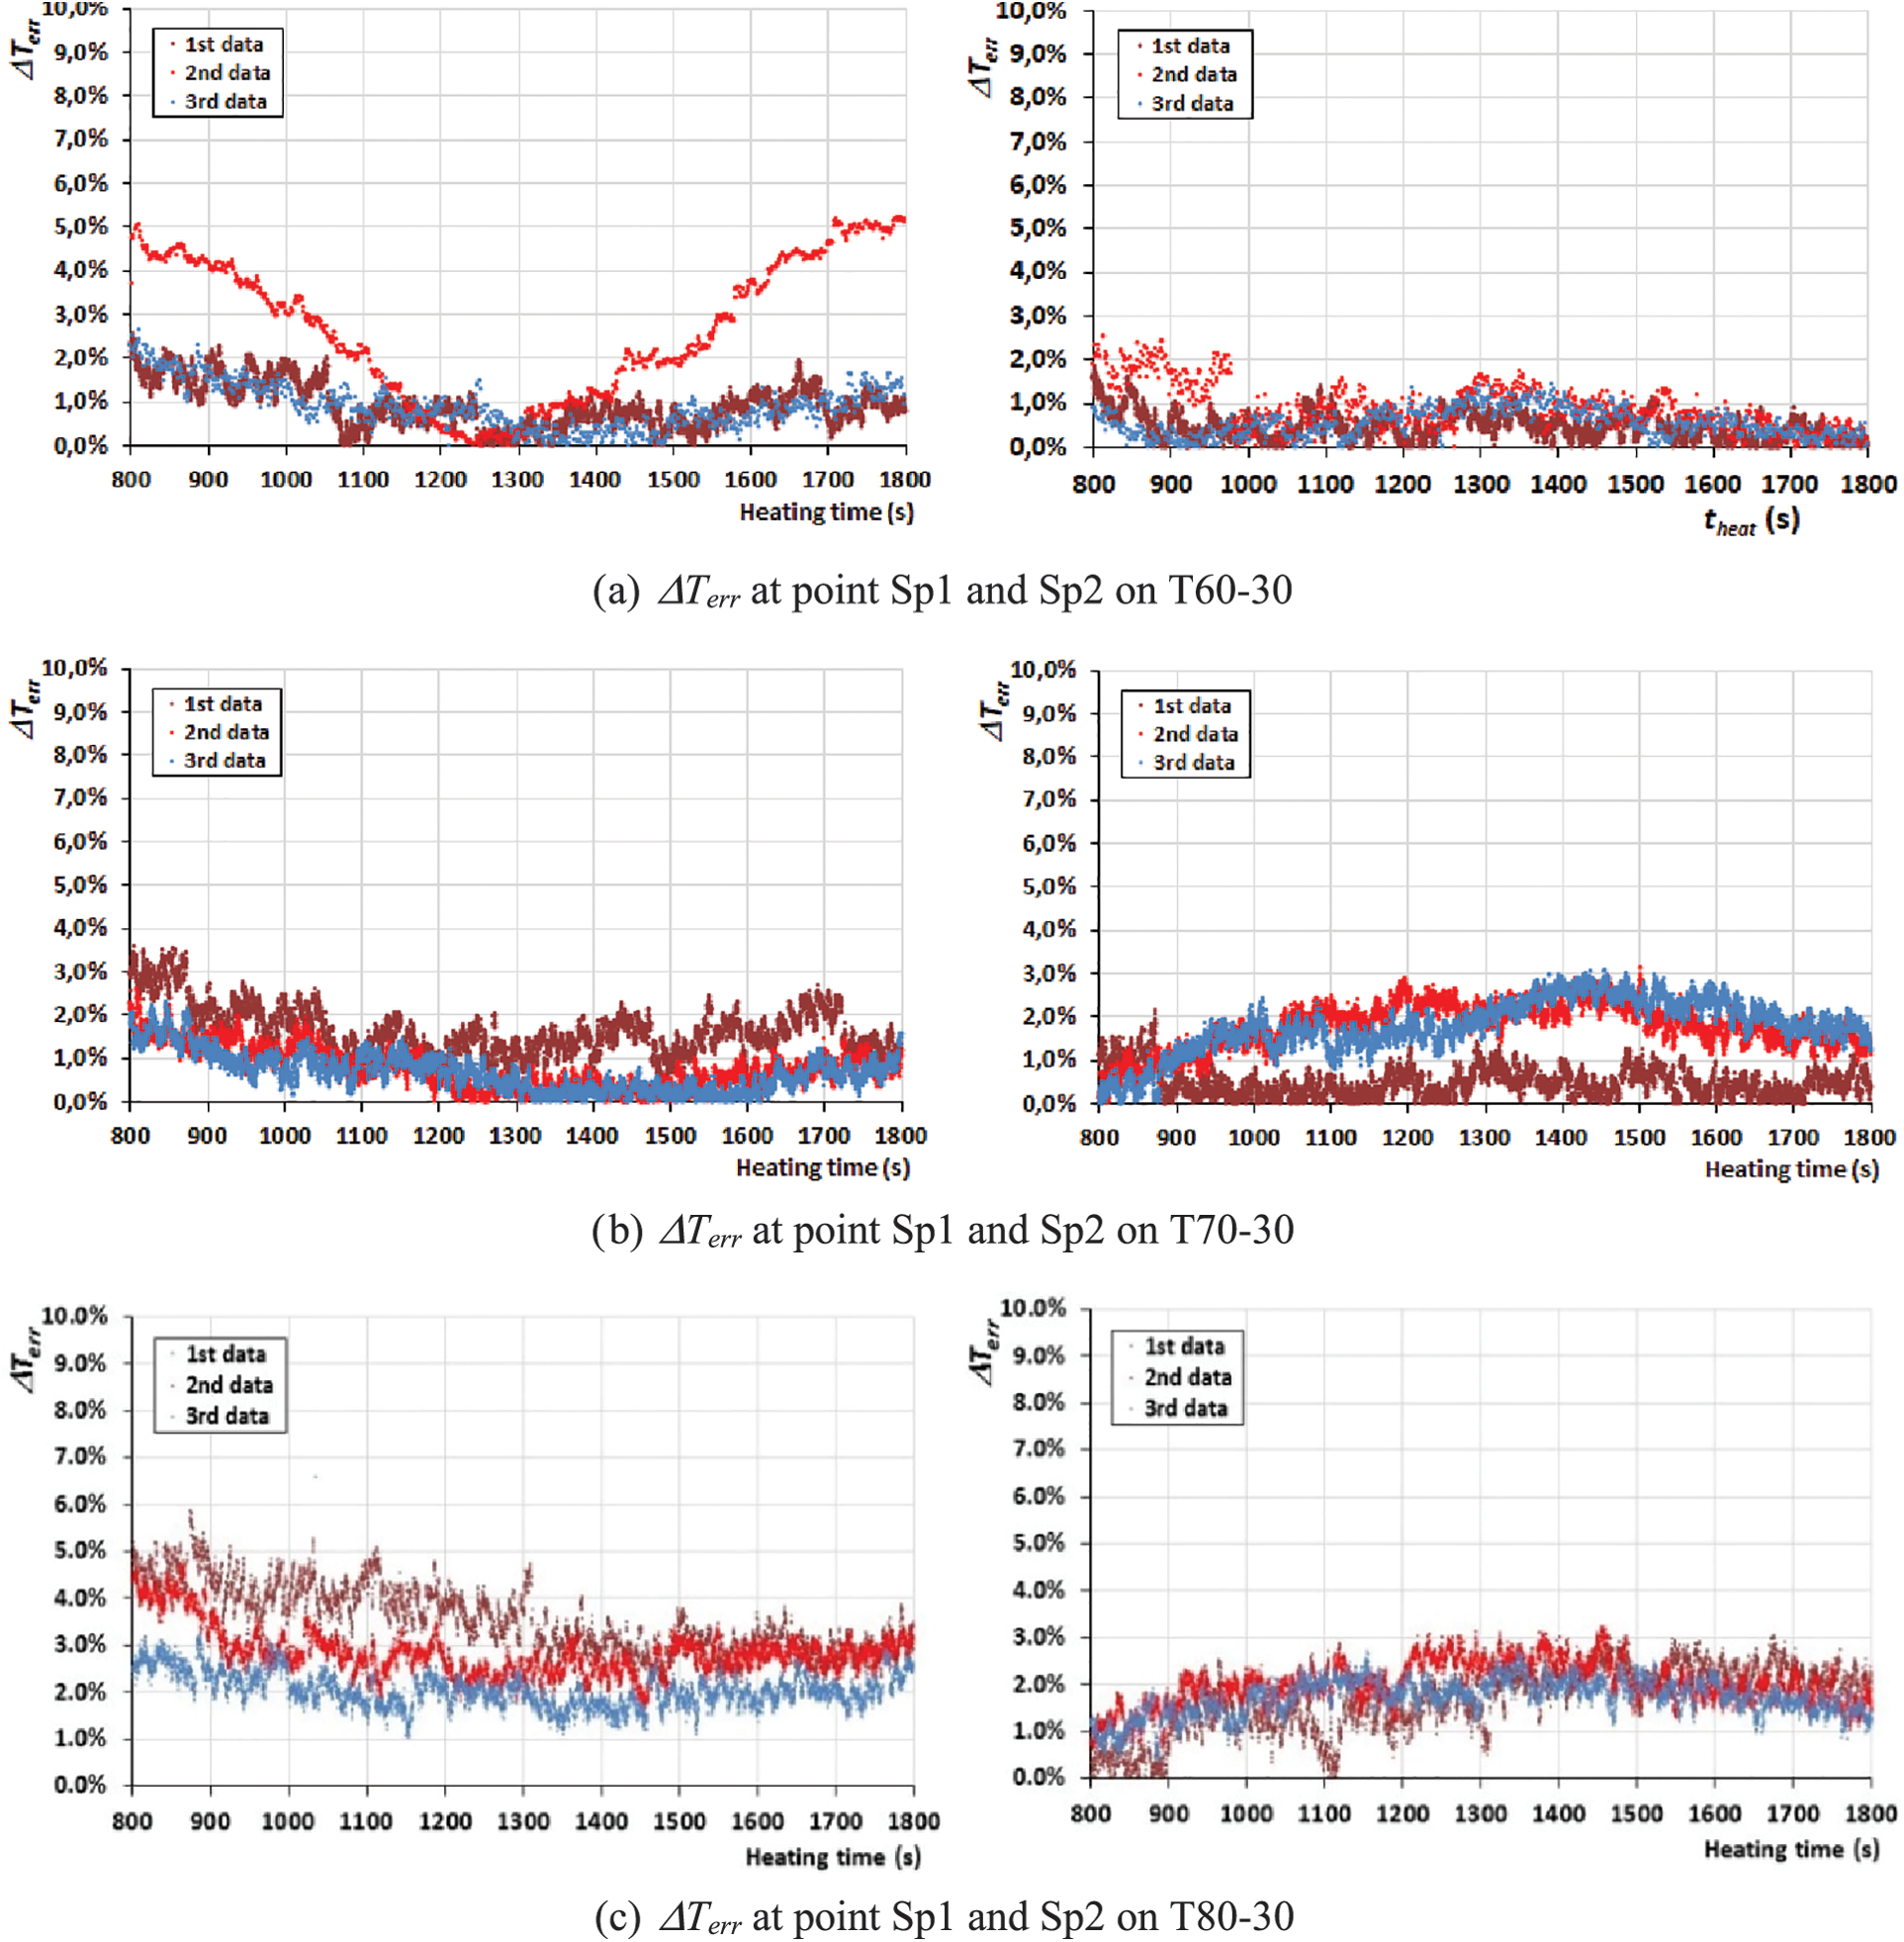
Figure 14: The percentage of ΔTerr at heating phase at several dcam and dlamp
The application of the Trefl value to the corroded reinforced concrete thermogram is shown in the Fig. 15.
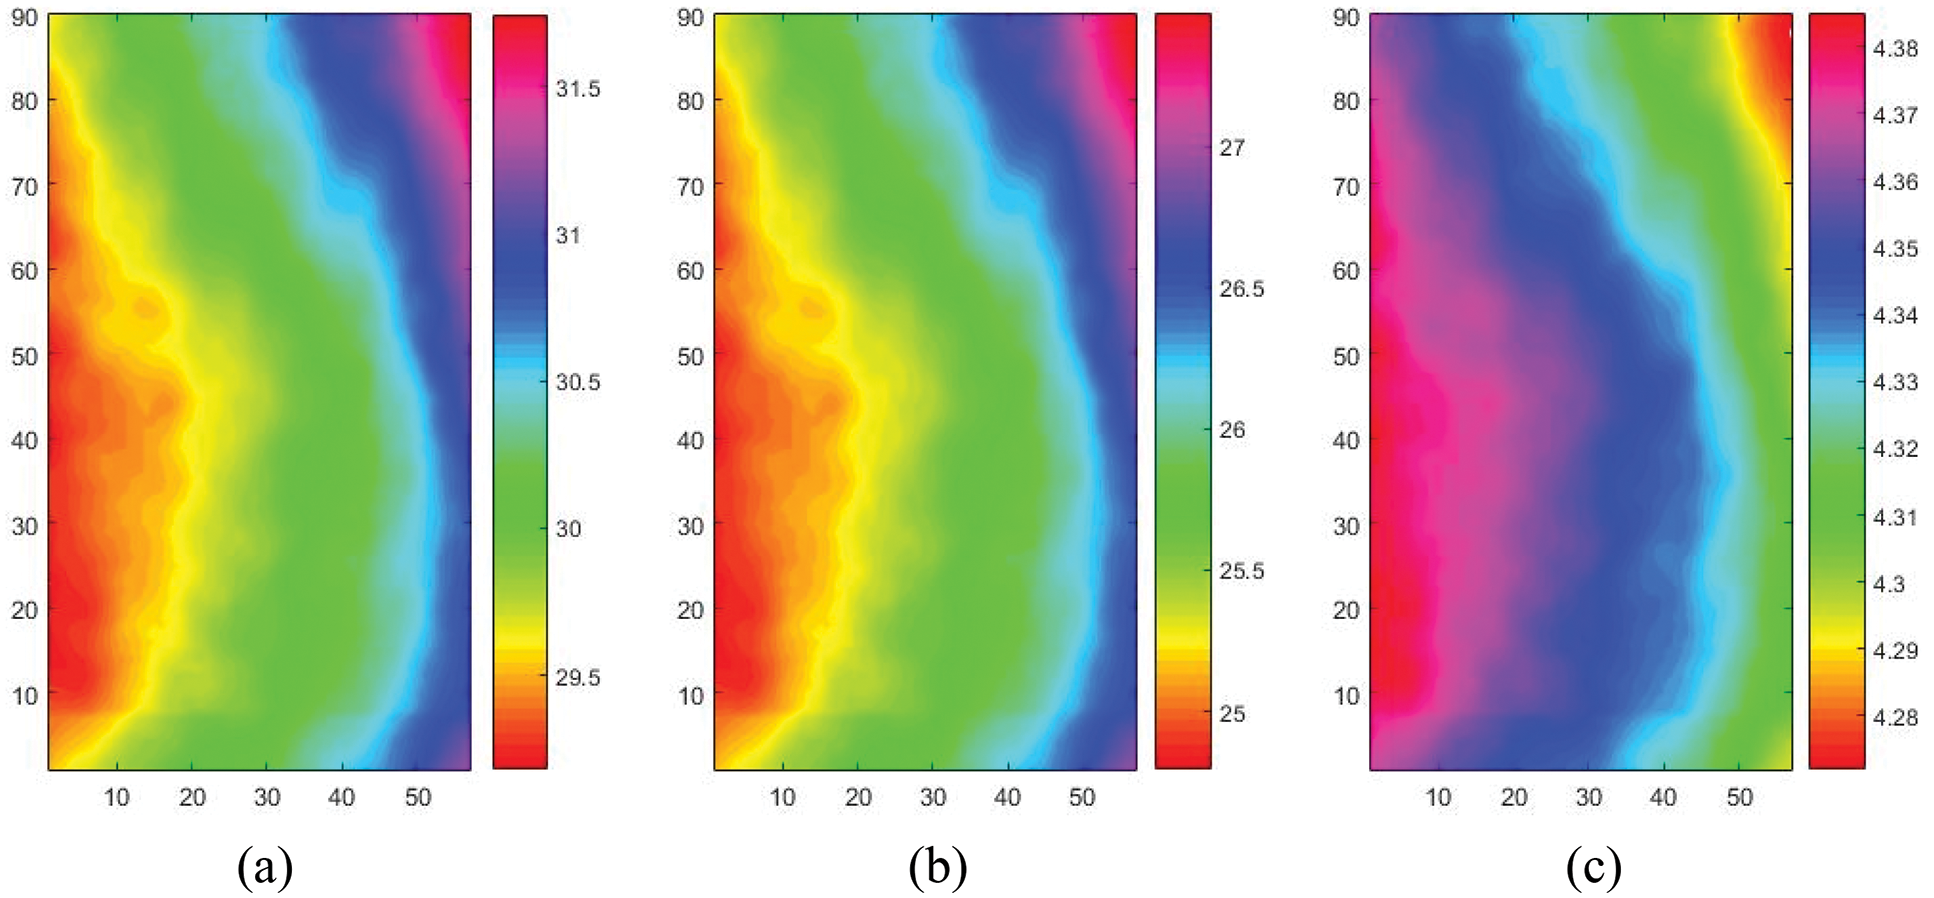
Figure 15: The thermogram difference between original (a), corrected (b) and intensity of the difference (c) at theat = 530,333 s
Based on Fig. 15, the difference between the original thermogram (Image a) and the corrected thermogram (Image b), as illustrated in Image c, shows the thermal contrast. This is the effect of the rebar in the concrete, causing variations in the thermal properties of the part. Of course, this will facilitate quantifying reinforcement corrosion, although it still requires other image processing.
The Trefl values and the location of the thermocouple installation are analyzed in such a way that the temperature value is the same as the Trefl value. The factors dobj, dcam, and dlamp influence this issue. Trefl reaches its maximum at dobj = 30 cm, dcam = 60 cm, and dlamp = 30 cm. Measurement of Trefl can be done using a thermocouple placed 6 cm above lamps 1 and 2. While for dcam = 70 cm, the location of the thermocouple installation is quite variable. It can be mounted at 18 cm from the top side of Lamps 1 and 2. However, according to some results for dcam = 80 cm, it must be mounted outside the grid. Regarding the variation in dobj, dcam and dlamp content during the tests, the following was observed:
1. The install location of the thermocouple for measuring the reflected temperature (Trefl) is affected by the object distance and the lamp axle distance, and the camera distance factor has the same effect as object distance because both are linear.
2. This means that the effect of light radiation is sufficient to determine the position Trefl.
3. In general, the change in the value of Trefl is proportional to the heating time (theat), for the various variables studied.
Acknowledgement: The authors would like to thank Bandung Institute of Technology for providing P3MI Research Grants.
Funding Statement: This research was supported by the P3MI Research Grants. Thanks to Prof. Herlien D Setio as authors who received the grant.
Conflicts of Interest: The authors declare that they have no conflicts of interest to report regarding the present study.
References
1. Kobayashi, K., Banthia, N. (2011). Corrosion detection in reinforced concrete using induction heating and infrared thermography. Journal of Civil Structural Health Monitoring, 1(1–2), 25–35. https://doi.org/10.1007/s13349-010-0002-4 [Google Scholar] [CrossRef]
2. Cecielle, N. D., Virgilio, A., Hana, A. C. (2020). Mechanical properties of corroded-damaged reinforced concrete pile-supporting wharves. Civil Engineering Journal, 6(12), 2375–2396. https://doi.org/10.28991/cej-2020-03091624 [Google Scholar] [CrossRef]
3. Overo, K. E., Tobi, D. S., Charles, K. (2021). Corrosion effects on cross-sectional area reduction of reinforcing steel embedded in concrete and exposed to saline media. Journal of Multidisciplinary Engineering Science and Technology, 8(7), 14311–14327. [Google Scholar]
4. Suyadi, K., Herlien, D. S., Adang, S., Ediansjah, Z. (2022). Determination of reflected temperature in active thermography measurements for corrosion quantification of reinforced concrete elements. Proceeding Book Sustainable Infrastructure and Built Environment 2022, Bandung, Indonescia. [Google Scholar]
5. Seungju, L., Yoonjae, C., Chunyoung, K., Ranjit, S., Wontae, K. (2022). Thermographic inspection of CLP defects on the subsurface based on binary image. International Journal of Precision Engineering and Manufacturing, 23, 269–279. https://doi.org/10.1007/s12541-021-00616-9 [Google Scholar] [CrossRef]
6. Im, D., Sancharoen, P., Julnipitawong, P., Tangtermsirikul, S. (2018). Effect of chloride and corrosion of reinforcing steel on thermal behavior of concrete and its modeling. Engineering Journal, 22(3), 143–163. https://doi.org/10.4186/ej [Google Scholar] [CrossRef]
7. Oshita, H. (2017). Quantitative estimation method for rebar corrosion degree of RC structures. 15th Asia Pacific Conference for Non-Destructive Testing, pp. 1–8. Singapore. [Google Scholar]
8. Na, S., Paik, I. (2019). Application of thermal image data to detect rebar corrosion in concrete structures. Applied Sciences, 9(21), 10–12. https://doi.org/10.3390/app9214700 [Google Scholar] [CrossRef]
9. Laaidi, N., Belattar, S. (2013). Numerical modeling of the thermal behavior of corrosion in conduit in transient mode. Open Journal of Safety Science and Technology, 3(4), 109–115. https://doi.org/10.4236/ojsst.2013.34014 [Google Scholar] [CrossRef]
10. Hoffmann, D., Bastian, M., Schober, G. (2020). New approach for layer thickness measurements of coatings using pulsed lock-in thermography. Quantitative InfraRed Thermography Journal, 19(2), 71–84. https://doi.org/10.1080/17686733.2020.1816752 [Google Scholar] [CrossRef]
11. Silva, A. R., Vaz, M., Leite, S. R., Mendes, J. (2021). Analyzing the influence of thermal NDT parameters on test performance. Russian Journal of Nondestructive Testing, 57(8), 727–737. https://doi.org/10.1134/S1061830921080039 [Google Scholar] [CrossRef]
12. Ranjit, S., Wontae, K. (2018). Non-destructive testing and evaluation of materials using active thermography and enhancement of signal to noise ratio through data fusion. Infrared Physics & Technology, 94, 78–84. https://doi.org/10.1016/j.infrared.2018.08.027 [Google Scholar] [CrossRef]
13. Arora, V., Mulaveesala, R., Dua, G., Sharma, A. (2020). Thermal non-destructive testing and evaluation for subsurface slag detection: Numerical modelling. Insight-Non-Destructive Testing and Condition Monitoring, 62(5), 264–268. [Google Scholar]
14. Clemente, I. C., Piau, J. M., Stephane, G., Nicolas, P. A., Marc, G. et al. (2009). Comparative study of active thermography techniques for the non-destructive evaluation of honeycomb structures. Research in Nondestructive Evaluation, 20(1), 1–31. https://doi.org/10.1080/09349840802366617 [Google Scholar] [CrossRef]
15. Sfarra, S., Ibarra, C. C., Avdelidis, N. P., Genest, M., Bouchagier, L. et al. (2010). A comparative investigation for the nondestructive testing of honeycomb structures by holographic interferometry and infrared thermography. Journal of Physics: Conference Series, 214(1), 012071. https://doi.org/10.1088/1742-6596/214/1/012071 [Google Scholar] [CrossRef]
16. Yang, R., He, Y., Mandelis, A., Wang, N., Wu, X. et al. (2018). Induction infrared thermography and thermal-wave-radar analysis for imaging inspection and diagnosis of blade composites. IEEE Transactions on Industrial Informatics, 14(12), 5637–5647. https://doi.org/10.1109/TII.2018.2834462 [Google Scholar] [CrossRef]
17. Milovanović, B., Gaši, M., Gumbarević, S. (2020). Principal component thermography for defect detection in concrete. Sensors, 20(14), 3891. https://doi.org/10.3390/s20143891 [Google Scholar] [PubMed] [CrossRef]
18. Mat, D. S., Suhaimi, N. N., Taib, M. Y., Alias, A. B. S. (2013). Analysis of heat gain in computer laboratory and excellent centre by using CLTD/CLF/SCL method. Procedia Engineering, 53, 655–664. https://doi.org/10.1016/j.proeng.2013.02.085 [Google Scholar] [CrossRef]
19. Lauriks, L., Severins, I., Peeters, J., Steenackers, G. (2018). Diffuse versus specular reflection: The influence of hot spots on reflected apparent temperature. QIRT 2018: 14th Quantitative InfraRed Thermography Conference, pp. 412–417. Berlin, Germany. https://doi.org/10.21611/QIRT.2018.031 [Google Scholar] [CrossRef]
20. Monieta, J. (2018). The use of thermography in the diagnosis of ship piston internal combustion engines. MATEC Web of Conferences, 182, 01027. https://doi.org/10.1051/matecconf/201818201027 [Google Scholar] [CrossRef]
21. Usamentiaga, R., Pablo, V., Jon, G., Laura, V., Julio, M. et al. (2014). Infrared thermography for temperature measurement and non-destructive testing. Sensors, 14. 12305–12348. https://doi.org/10.3390/s140712305 [Google Scholar] [PubMed] [CrossRef]
22. Michael, J. M. H., Natalie, H. I., Heather, M. W., Sean, A. R. (2018). Reporting of thermography parameters in biology: A systematic review of thermal imaging literature. Royal Society Open Science, 5(12), 181281. https://doi.org/10.1098/rsos.181281 [Google Scholar] [PubMed] [CrossRef]
23. Dziarski, K., Hulewicz, A., Dombek, G. (2021). Thermographic measurement of the temperature of reactive power compensation capacitors. Energies, 14, 5736. https://doi.org/10.3390/en14185736 [Google Scholar] [CrossRef]
24. Tran, Q. H., Han, D., Kang, C., Haldar, A., Huh, J. (2017). Effects of ambient temperature and relative humidity on subsurface defect detection in concrete structures by active thermal imaging. Sensors, 17(8), 1718. https://doi.org/10.3390/s17081718 [Google Scholar] [PubMed] [CrossRef]
25. Mac, V. H., Tran, Q. H., Huh, J., Doan, N. S., Kang, C. et al. (2019). Detection of delamination with various width-to-depth ratios in concrete bridge deck using passive IRT: Limits and applicability. Materials, 12(23), 3996. https://doi.org/10.3390/ma12233996 [Google Scholar] [PubMed] [CrossRef]
26. FLIR Systems (2012). The ultimate infrared handbook for R&D professionals. USA: FLIR Systems Inc. [Google Scholar]
27. Bhatia, A. (2012). A guide to heating & cooling load estimation, 5272 Meadow Estates Drive: PDHonline Course M196. [Google Scholar]
28. David, M. G., Juan, J. M. C., David, B. H., Daniel, A. (2020). Methodology to determine the adequacy of indoor enclosures to use infrared thermography cameras and their application to medical emergency services. Infrared Physics & Technology, 106. 103261. https://doi.org/10.1016/j.infrared.2020.103261 [Google Scholar] [CrossRef]
29. Hazim, M., Taib, I. M., Fayez, A. (2016). Radiation distribution uniformization by optimized halogen lamps arrangement for a solar simulator. Journal of Scientific and Engineering Research, 3(6), 29–34. [Google Scholar]
30. Smith, J. O. (2010). Determination of the convective heat transfer coefficients from the surfaces of buildings within urban street canyons (Ph.D. Thesis), Department of Mechanical Engineering, University of Bath. [Google Scholar]
Cite This Article
 Copyright © 2023 The Author(s). Published by Tech Science Press.
This work is licensed under a Creative Commons Attribution 4.0 International License , which permits unrestricted use, distribution, and reproduction in any medium, provided the original work is properly cited.
 Downloads
 Citation Tools