
 Submit a Paper
 Propose a Special lssue
 Open Access
ARTICLE

Selection and Parameter Optimization of Constraint Systems for Girder-End Longitudinal Displacement Control in Three-Tower Suspension Bridges
1 School of Transportation, Southeast University, Nanjing, 210096, China
2 Guangxi Rongwu Expressway Co., Ltd., Nanning, 530000, China
3 CCCC Highway Bridges National Engineering Research Centre Co., Ltd., Beijing, 100120, China
* Corresponding Author: Yuan Ren. Email:
Structural Durability & Health Monitoring 2025, 19(3), 643-664. https://doi.org/10.32604/sdhm.2025.060302
Received 29 October 2024; Accepted 09 January 2025; Issue published 03 April 2025
 View Full Text
 Download PDF
Abstract
To investigate the influence of different longitudinal constraint systems on the longitudinal displacement at the girder ends of a three-tower suspension bridge, this study takes the Cangrong Xunjiang Bridge as an engineering case for finite element analysis. This bridge employs an unprecedented tower-girder constraint method, with all vertical supports placed at the transition piers at both ends. This paper aims to study the characteristics of longitudinal displacement control at the girder ends under this novel structure, relying on finite element (FE) analysis. Initially, based on the Weigh In Motion (WIM) data, a random vehicle load model is generated and applied to the finite element model. Several longitudinal constraint systems are proposed, and their effects on the structural response of the bridge are compared. The most reasonable system, balancing girder-end displacement and transitional pier stress, is selected. Subsequently, the study examines the impact of different viscous damper parameters on key structural response indicators, including cumulative longitudinal displacement at the girder ends, maximum longitudinal displacement at the girder ends, cumulative longitudinal displacement at the pier tops, maximum longitudinal displacement at the pier tops, longitudinal acceleration at the pier tops, and maximum bending moment at the pier bottoms. Finally, the coefficient of variation (CV)-TOPSIS method is used to optimize the viscous damper parameters for multiple objectives. The results show that adding viscous dampers at the side towers, in addition to the existing longitudinal limit bearings at the central tower, can most effectively reduce the response of structural indicators. The changes in these indicators are not entirely consistent with variations in damping coefficient and velocity exponent. The damper parameters significantly influence cumulative longitudinal displacement at the girder ends, cumulative longitudinal displacement at the pier tops, and maximum bending moments at the pier bottoms. The optimal damper parameters are found to be a damping coefficient of 5000 kN/(m/s)0.2 and a velocity exponent of 0.2.Keywords
Suspension bridges, known for their light self-weight and strong spanning capability, have rapidly developed domestically and are widely used in various engineering projects. However, large-span suspension bridges also face prominent issues of significant deformation and large vibrations under loads [1]. The vertical deformation of suspension bridges has received considerable attention and research [2], but longitudinal deformation is often neglected. During the design phase, designers typically do not implement extensive longitudinal constraints in suspension bridges, and the vertical bearings at the tower-girder connections usually use low-friction PTFE (polytetrafluoroethylene) sliding plates to ensure free longitudinal movement of the stiffening girder. However, in daily operations and under environmental loads, the longitudinal displacement of the stiffening girder in suspension bridges is characterized by large amplitudes, high frequencies, and significant cumulative displacements [3]. The bearings, expansion joints, dampers, and other constraint devices, being directly connected to the stiffening girder, are constantly in the same state of motion. The cumulative sliding distance of these constraint devices often exceeds the design value, leading to structural damage, and the magnitude of longitudinal displacement at the girder ends determines whether the associated structures are within the normal operating range [4]. As a result, the actual service life of these devices is far shorter than expected [5,6]. The main failure manifestations of the restraint devices are as follows. The main issue with the bearings is the failure of the sliding plates, which can cause a lock between the lower and upper plates, potentially leading to complete failure. This turns the flexible sliding between the girder and the bridge piers into rigid contact, limiting the free movement and rotation of the girder, altering its stress state, and compromising bridge safety. Bearing failure can also change the dynamic characteristics of the entire bridge [7,8]. Common issues with expansion joints include loosened or missing anchoring components, bending deformation of the steel girder, excessive displacement, and uneven expansion, all of which affect vehicle comfort and increase impact on the bridge deck, speeding up pavement damage [5,9,10]. For dampers, oil leakage is a major issue. Significant leakage reduces the damper’s vibration damping and energy dissipation capacity [11]. The above failures may further lead to issues with the overall structural response of the bridge.
Scholars have conducted related research on various factors contributing to the longitudinal displacement of the stiffening girder, which can be broadly categorized into temperature effects and vehicle/wind loads. Regarding temperature effects, Ni et al. [12] established a temperature-displacement correlation model by analyzing long-term monitoring data of bridge expansion joint displacement and bridge temperature. Wu et al. [13] proposed a new time-varying temperature-displacement nonlinear model based on temperature sensors at different vertical positions of a steel box girder and girder-end displacement sensors. This model eliminates modeling errors caused by simplifying the temperature field, leading to more accurate estimates of girder-end displacements induced by temperature. Hu et al. [14], using monitoring data of longitudinal displacement at the expansion joints of the Aizhai Bridge, found that the longitudinal displacement caused by temperature exhibits long-period characteristics but is negligible in cumulative displacement. The cumulative displacement is predominantly influenced by environmental excitation and vehicle loads [15]. Therefore, studying the longitudinal movement characteristics of girder ends under wind and vehicle loads is of great significance for controlling cumulative girder-end displacement and, consequently, enhancing the service life of constraint devices.
In recent years, many scholars have observed that vehicle-bridge coupling effects can cause significant vibrations in stiffening girders and potentially alter the dynamic characteristics of bridges. Therefore, accurately simulating actual traffic flow and coupling it with the bridge model is crucial. Sheibani et al. [16] utilized traffic micro-simulation techniques to statistically analyze and simulate various traffic conditions, applying the equivalent nodal forces method to incorporate traffic flow into finite element models. Similarly, Carbonari et al. [17] investigated the dynamic coupling effects between bridges and trucks using finite element models, analyzing the influence of various parameters on the coupling interaction. Guo et al. [18] analyzed the time-frequency and frequency domain of girder-end displacement data from the Runyang Bridge and found that the main factors influencing cumulative girder-end displacement are the small-amplitude, high-frequency vibrations caused by vehicle loads and wind loads. Huang et al. [19] derived the deformation mechanism of longitudinal displacement in a single-span suspension bridge under vertical loads through theoretical analysis and further studied the effects of the sag-to-span ratio and central buckle on longitudinal displacement. Li et al. [20] established a wind-vehicle-bridge spatial coupling vibration analysis platform and conducted in-depth research on the longitudinal displacement characteristics of the stiffening girder under the combined action of random wind and vehicle loads. Han et al. [21] created a random vehicle flow model to study the effects of vehicle speed, flow rate, and heavy vehicle proportion on the longitudinal displacement of the stiffening girder.
Research on the longitudinal displacement of girder ends has primarily focused on two-tower suspension bridges, utilizing either monitoring data or finite element model analysis. However, compared to two-tower suspension bridges, three-tower suspension bridges exhibit significant differences in structural and dynamic characteristics [22]. In the field of longitudinal displacement control for three-tower suspension bridges, current studies are relatively scarce, and findings from two-tower suspension bridges are often not applicable. One critical factor affecting the longitudinal displacement of girder ends in suspension bridges is the longitudinal constraint system. However, current research on the constraint systems of three-tower suspension bridges primarily focuses on the impact of central tower rigidity [23,24] and static analyses [25], with little exploration of the relationship between constraint systems and girder-end longitudinal displacement.
This study selects the Cangrong Xunjiang Bridge as the research object. The bridge’s stiffening girder is not supported vertically by the three towers but only by vertical bearings at the two transition piers at the ends, forming a fully floating system [26,27], which has never been used in previous bridge constructions. The bridge faces challenges in controlling longitudinal displacement at the girder ends and the adverse effects of small rigidity at the transition piers on fatigue and stress.
This study begins by statistically analyzing vehicle parameters based on WIM data and generating dynamic vehicle traffic flows using the Monte Carlo method and a car-following model. These flows are applied to the FE model for time-history analysis. Subsequently, different longitudinal constraint systems are proposed based on existing three-tower suspension bridge design schemes. Considering multiple structural response factors, such as girder-end longitudinal displacement, transition pier-top longitudinal displacement, and transition pier-bottom bending moments, the optimal longitudinal constraint system is identified. Using this optimal constraint system as a foundation, the study first examines the impact of single viscous damper parameters on various structural responses. Finally, multi-objective optimization of viscous damper parameters is conducted using the CV-TOPSIS method, yielding the optimal damper parameter values for achieving the best structural response.
This paper bridges the gap by investigating the relationship between three-tower suspension bridges, girder-end longitudinal displacement, and longitudinal constraint systems. By doing so, it not only addresses the lack of research in this area but also provides new perspectives for selecting constraint systems during the design phase of three-tower suspension bridges.
2 Methodology for Analyzing Girder-End Displacement under Vehicle Loads
2.1 Framework for Girder-End Displacement Analysis
Since the Cangrong Xunjiang Bridge is not yet completed, obtaining actual displacement data of the girder ends under operational conditions is impossible. Therefore, the research methodology mainly involves using FE analysis to calculate the structural response of the bridge.
First, a finite element model is established based on the construction drawings. The boundary conditions are modified according to the mechanical characteristics of constraint devices such as bearings and dampers to facilitate subsequent time history analysis.
Next, a random vehicle load model is developed based on statistical parameters like vehicle type classification, vehicle weight distribution, speed, and lane distribution, derived from measured WIM data. This random vehicle load model is then applied to the finite element model as nodal loads.
The third step involves comparing the structural response of the girder and transition piers under different longitudinal constraint systems to select the most reasonable system. In this system, the damping coefficient (C) and velocity exponent of viscous dampers (α) are analyzed for their impact on structural response. Finally, the CV-TOPSIS method is used for multi-objective optimization to determine the optimal damper parameters. The complete research framework of this study is illustrated in Fig. 1.
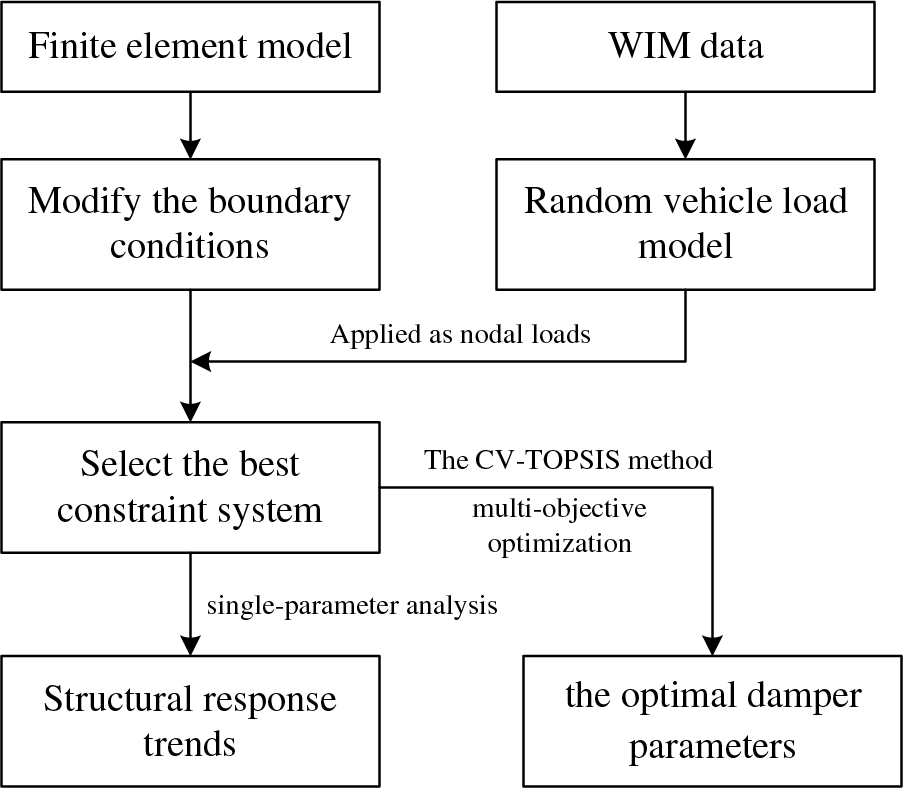
Figure 1: Framework for the selection of constraint systems and parameter optimization in the multi-tower suspension bridge
2.2 Simulation of Random Vehicle Load Model Based on WIM Data
For long-span suspension bridges, the actual traffic conditions often differ significantly from the sample data used to determine bridge design loads due to varying economic development levels and traffic patterns in the bridge’s location [28]. To more accurately analyze the longitudinal displacement response of girder ends under vehicle loads, this study simulates random traffic flow based on WIM data from a specific region. The primary factors influencing the structural response of the bridge in random traffic flow are the mass and distribution of vehicle platoons on the bridge deck. Therefore, vehicles are categorized into different types, and statistical models for different vehicle types’ weight, speed, and lane distribution are established as static parameters for the random traffic flow [29]. Finally, the static parameters are used to dynamically generate a time-varying model, which is then applied to the finite element model. Due to the ongoing construction of the bridge, WIM data from a nearby operational bridge downstream has been selected for traffic flow simulation, assuming that the traffic conditions of the two bridges are comparable.
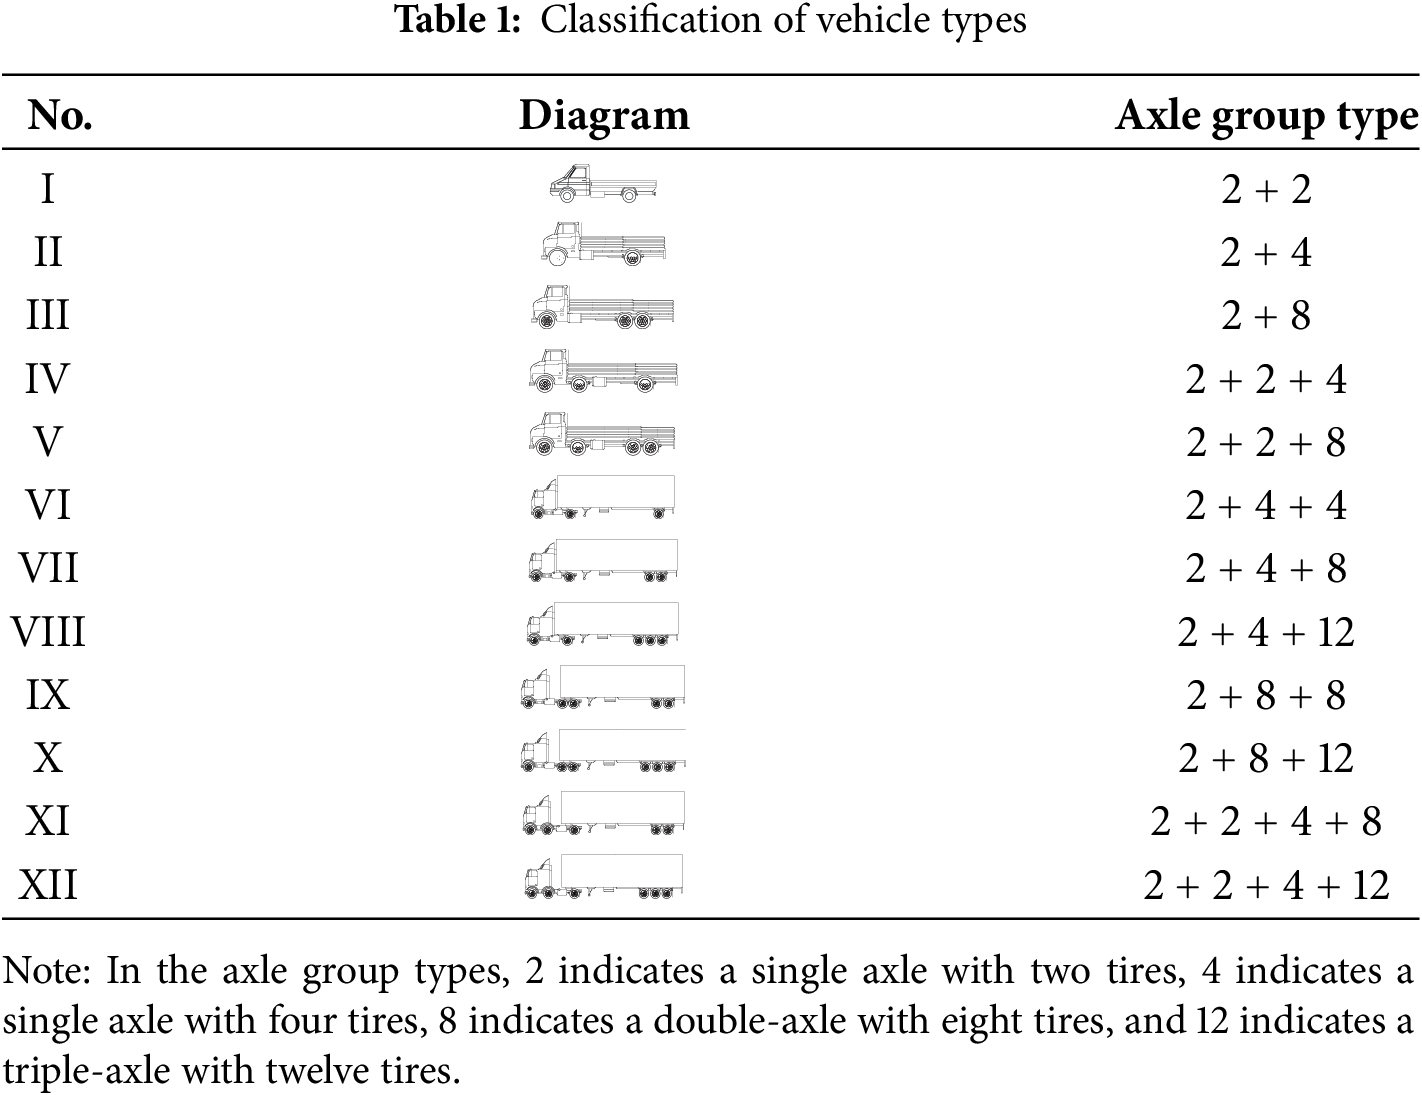
2.2.1 Classification of Vehicle Types
In current research on random vehicle load models for highways, axle group types are typically used as the basis for classifying vehicle types. This paper references existing research findings [28] and the collected WIM data, classifying vehicles into 12 types (as shown in Table 1). Since this study focuses only on analyzing the load effects on the girder, and the influence line (or surface) in the longitudinal direction of the bridge far exceeds the scale of the vehicles, the vehicles were simplified to single mass points for simulation. Their weights were added to the finite element model as nodal loads.
2.2.2 Estimation of Statistical Model Parameters
The statistical models for vehicle weights were determined based on the vehicle type classification in Section 2.2.1. The K-S test, a method used in statistics to verify the accuracy of a statistical model for a given dataset, operates by comparing data derived from the statistical model to original standard data. It evaluates the model’s accuracy by calculating the deviation between the two datasets. For vehicle weight fitting, an appropriate theoretical distribution model is first selected, and the distribution parameters are estimated using the maximum likelihood estimation method. If the resulting probability density function passes the single-sample K-S test, the vehicle weight is considered to follow the specified distribution [30]. Since the weight distribution of most vehicle types is complex or multimodal, the fitting results of commonly used theoretical distributions such as normal, log-normal, and Weibull distributions fail to pass the K-S test. Using mixture models yields better fitting results [31]. This study employed a mixture of normal distributions and a mixture of log-normal distributions for fitting, with their probability functions given as follows:
For a normal distribution:
For a log-normal distribution:
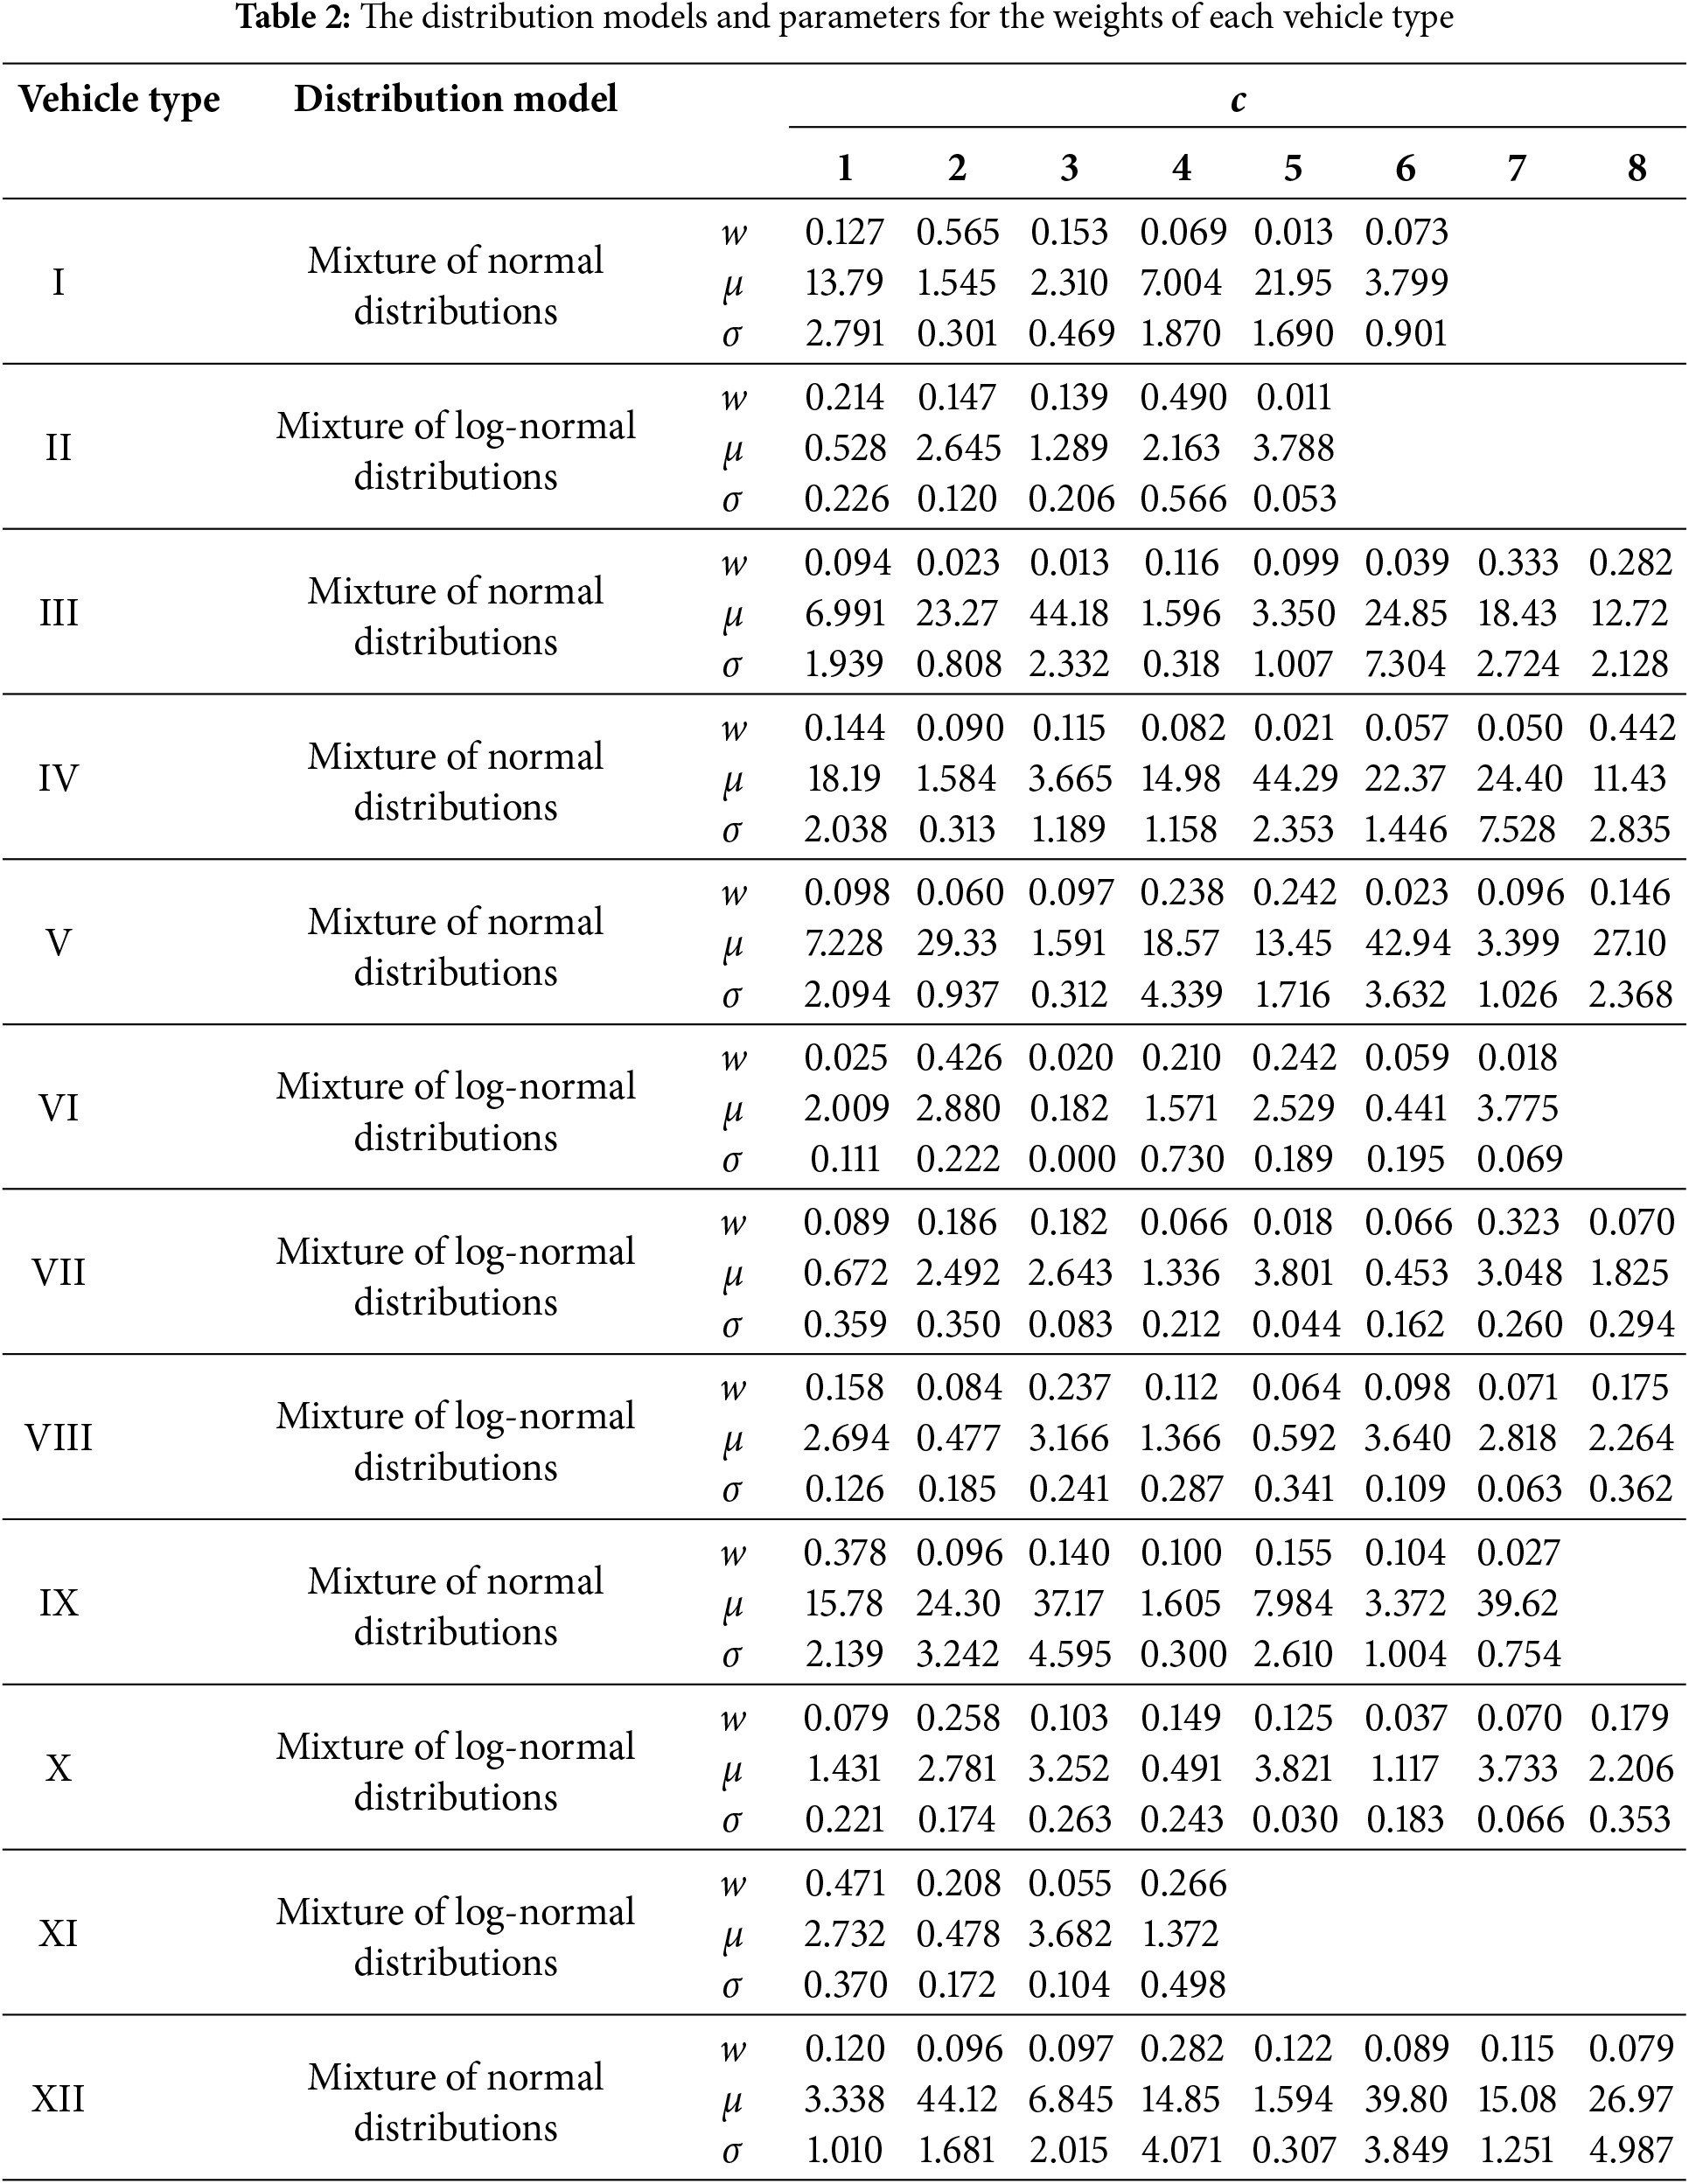
For parameters w, μ and σ in the probability distribution model, parameter estimation is conducted using the Expectation-Maximization (EM) algorithm, a type of iterative optimization method for maximum likelihood estimation [32,33]. Different parameters correspond to different likelihood function values f, with higher values indicating better fitting accuracy. The parameter c represents the complexity of the model, where a larger c corresponds to more location parameters in the model. When determining the optimal statistical model parameters, it is necessary to maximize the likelihood function while minimizing the number of unknown parameters. Thus, the Bayesian Information Criterion (BIC) is introduced as an evaluation standard [34]. The BIC is defined as follows:
where L is the maximum likelihood value under the model, k is the number of unknown parameters in the model, n is the number of observations.
Based on these two mixture models, the parameters of the statistical models for vehicle weights were finally determined using the EM algorithm and the BIC. The distribution models and parameters for the weights of each vehicle type are presented in the Table 2.
Similarly, for the initial vehicle speeds, after fitting and K-S testing, it was concluded that the speed distribution of all vehicle types could be well modeled by a t-distribution.
2.2.3 Generation of Random Vehicle Load Model
When generating random vehicle load model, it is essential to consider the characteristics of vehicle lane selection and arrival time intervals. Additionally, the interactions between vehicles on the bridge need to be considered, which can be simulated using a car-following model [35]. The vehicle lane selection can be obtained based on the statistical WIM data.
Based on previous studies, when the traffic flow density is low and no congestion occurs on the bridge deck, the vehicle arrival process follows a Poisson process [36]. The definition of the Poisson process is as follows:
A stochastic process {N(t), t ≥ 0} is said to be a Poisson process with parameter λ if it satisfies the following conditions:
1. {N(t), t ≥ 0} is a process that takes non-negative integer values, has stationary and independent increments, and satisfies N(0) = 0.
2. For any 0 ≤ s ≤ t, the increment N(t) − N(s) follows a Poisson distribution with parameter λ(t − s), i.e.,
If these conditions are met, the stochastic process {N(t), t ≥ 0} is called a homogeneous Poisson process with rate parameter λ.
Using the measured vehicle arrival time intervals from a specific month, it was verified that the data satisfies the above definition. Therefore, the process of vehicles arriving on the bridge can be regarded as a Poisson process with an arrival rate λ.
Using the statistical models for vehicle parameters and the Monte Carlo method [34], initial platoons for each lane were generated. Then, following related literature, a car-following model was introduced to calculate the acceleration of vehicles at any given time. By combining the vehicle arrival time intervals, the location of the vehicle load effect can be determined, effectively avoiding the overlap and collision of vehicles with different initial speeds on the bridge. As shown in Fig. 2, this process, combined with the measured vehicle data, generates a dynamic vehicle load model.
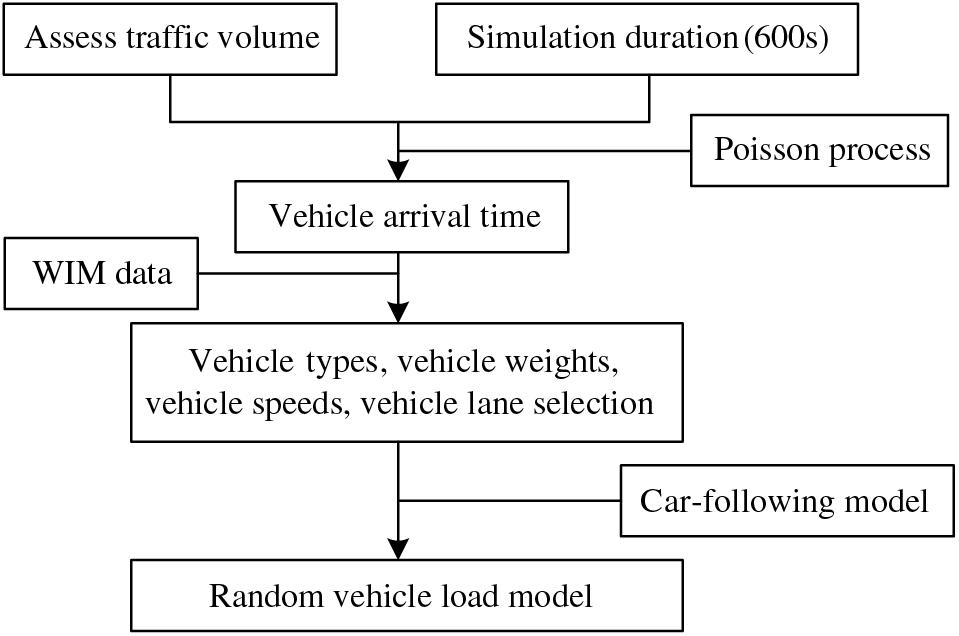
Figure 2: Simulation process of the random vehicle load model
Finally, by multiplying the random vehicle load weights by the amplification factors corresponding to different nodes of the FE model, the traffic flow model can be converted into equivalent nodal forces applied to the girder nodes in the FE model. This allows for the further calculation of the structural vehicle load effect time history.
3 Impact of Longitudinal Constraints on Girder-End Displacement under Vehicle Loads
The research object is the Cangrong Xunjiang Bridge, the three-tower spatial cable-stayed suspension bridge with a main span exceeding 500 m, as shown in Fig. 3. The main bridge is a 2 × 520 m double-span suspension bridge with a girder span arrangement of 55 m + 2 × 520 m + 55 m. The main cables are space cables, with a span arrangement of 153 + 2 × 520 + 210 m, and a sag-to-span ratio of 1/9. As shown in Fig. 4, lateral wind-resistant bearings are installed at the cable towers, vertical bearings and lateral wind-resistant bearings are installed at the transition piers, and longitudinal limit bearing are installed at the central tower. This structure is a fully floating system.
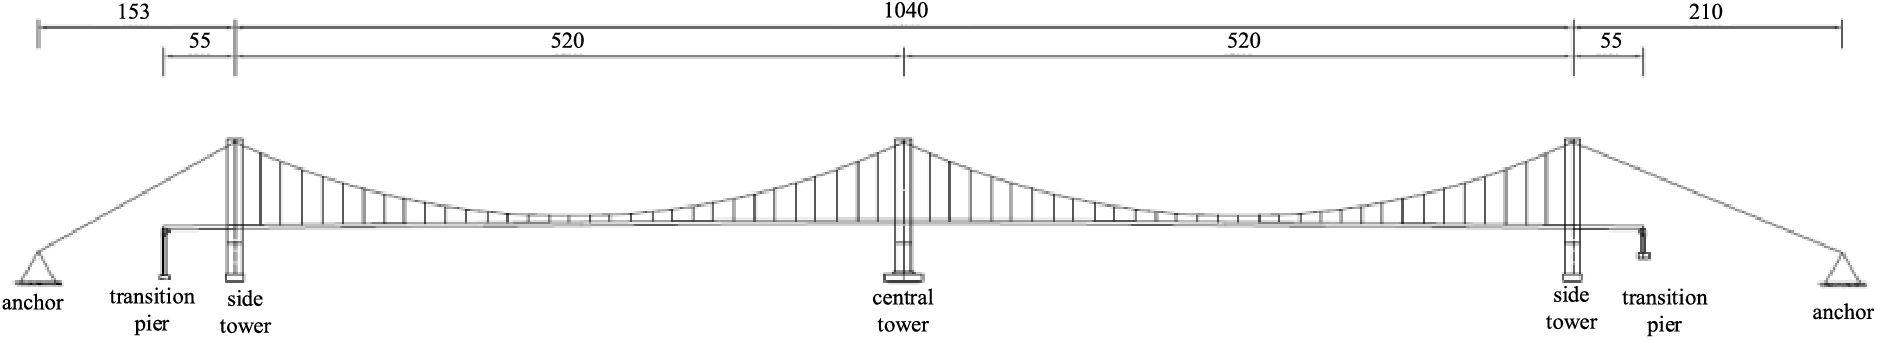
Figure 3: Diagram of the three-tower suspension bridge (Units: m)
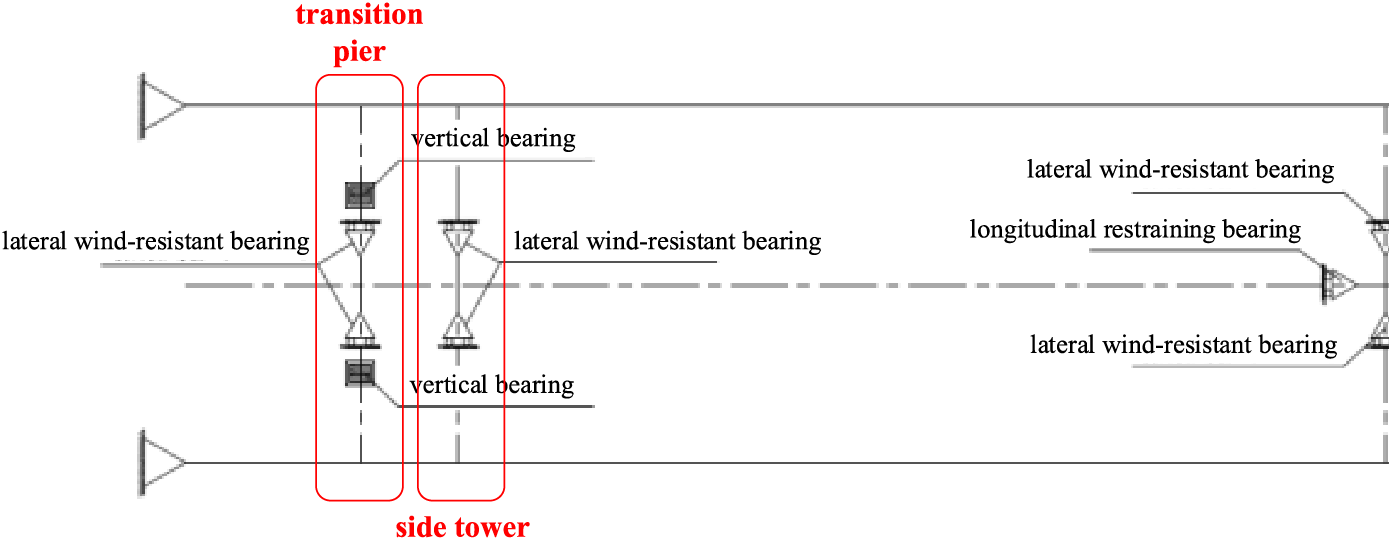
Figure 4: Diagram of the arrangement of constraint devices for the three-tower suspension bridge (This diagram shows half of the span; the other half is symmetrically arranged)
Based on the design drawings, the model was established using the finite element software MIDAS for analysis, as shown in Fig. 5. Bridge towers, stiffening girders, and transition piers are simulated using beam elements. The main cables and hangers are modeled with cable elements, and both components are subjected only to tension. To ensure result accuracy, an initial tensile force is applied to the main cable and hanger elements based on the designed cable forces. Elastic connections were used to simulate the lateral wind-resistant bearings and longitudinal limit bearings. As the sliding plates of the vertical bearings have some friction in the longitudinal direction of the bridge, a hysteresis curve was used to simulate the longitudinal contact behavior of the vertical bearings based on the mechanical performance tests of the bearings (Fig. 6). This curve is derived from the mechanical performance tests conducted on the vertical bearings of the Jiangyin Bridge. The yield strength is expressed as μ × N, where μ represents the sliding plate’s friction coefficient, and N denotes the bearing reaction force. The base of the transition piers is modeled as a general support, while the side towers and main towers incorporate pile-soil interaction simulated through nodal elastic supports. The main cable anchorages are constrained using general support models.
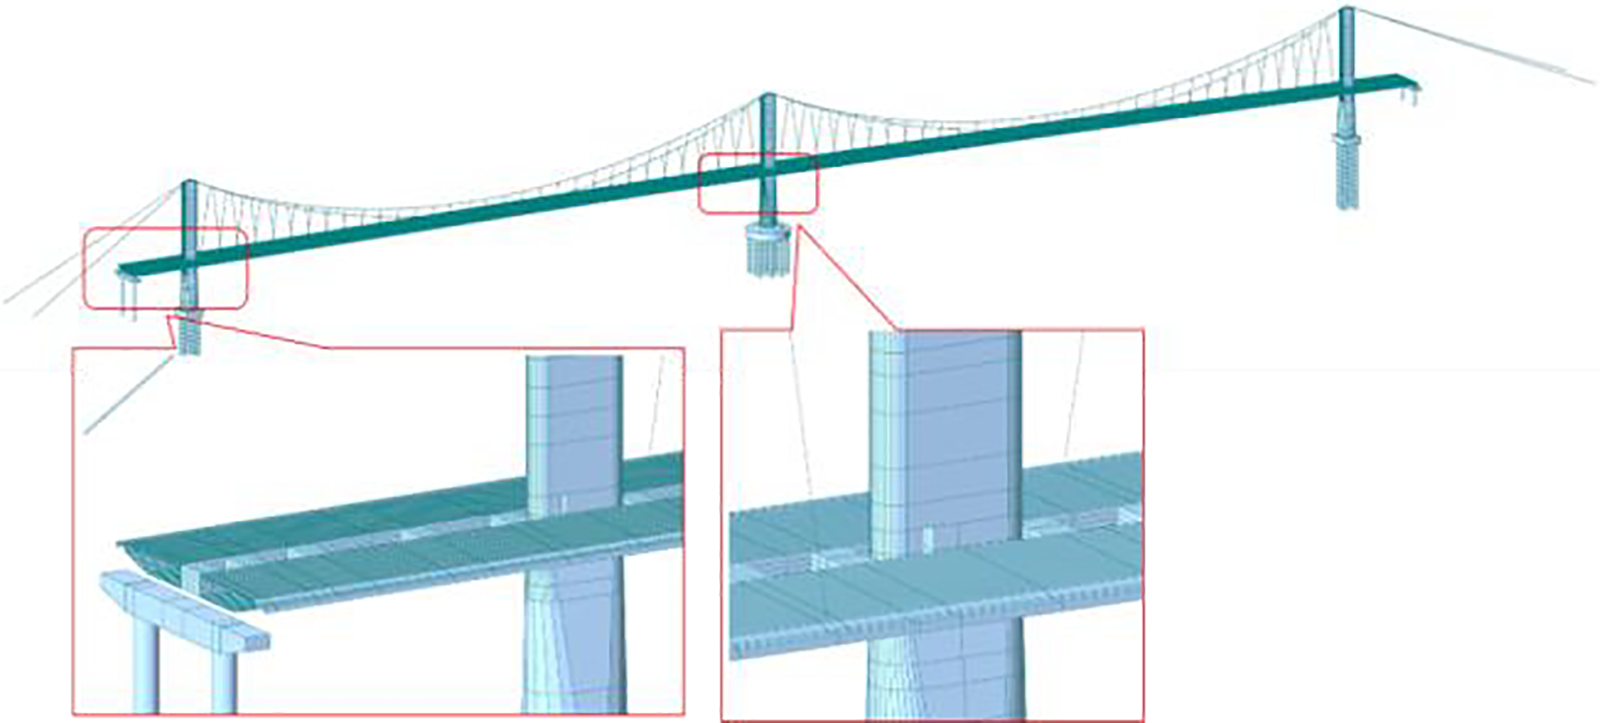
Figure 5: Finite element model
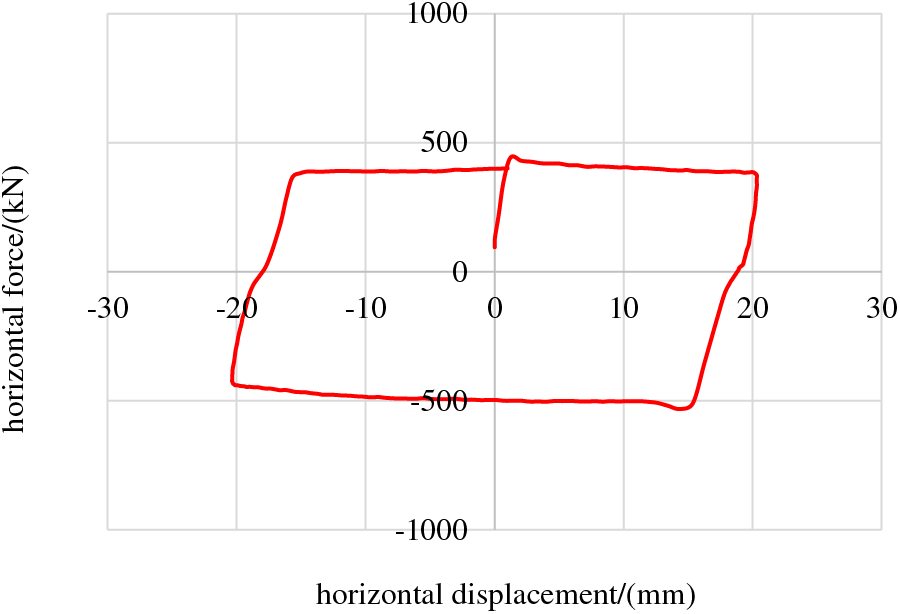
Figure 6: Longitudinal friction force-displacement curve of the vertical bearing
3.2 Classification of Constraint Systems
For three-tower multi-span suspension bridges, effectively increasing the overall longitudinal stiffness of the structure is key to controlling excessive longitudinal displacement at the girder ends. There are two main methods for enhancing the longitudinal stiffness of three-tower suspension bridges: using cable-girder constraints, such as short stay cables or central buckles at the mid-span of the suspension bridge [37], and using tower-girder constraints [38]. Existing research indicates that the cable-girder constraint system method has not been applied to the three-tower multi-span suspension bridges currently under construction or completed, so this study focuses on the impact of different tower-girder constraint systems.
China’s existing three-tower suspension bridges include the Taizhou Yangtze River Bridge, Ma’anshan Yangtze River Bridge, Yingwuzhou Yangtze River Bridge, and Wenzhou Oujiang Beikou Bridge. The Taizhou Yangtze River Bridge has elastic cables at the central tower and viscous dampers at the side towers, forming a semi-floating system [39]. The Ma’anshan Yangtze River Bridge rigidly connects the stiffening girder with the central tower’s lower crossgirder, and viscous dampers are installed at the side towers, forming a rigid system [22]. The Yingwuzhou Yangtze River Bridge adopts a simply-supported system at the central tower, with an additional longitudinal limit bearing [40]. The Wenzhou Oujiang Beikou Bridge has a simply-supported system at the central tower, with viscous dampers at the side towers [41].
The Cangrong Xunjiang Bridge, the subject of this study, has no vertical bearings at the central and side towers, only longitudinal limit bearings at the central tower. This structure’s longitudinal stiffness is much lower than that of the four suspension bridges mentioned above, which is disadvantageous for controlling longitudinal displacement at the girder ends. Therefore, based on other reference bridges, new longitudinal constraint systems were established for the research object. It should be noted that since the three towers and the girder of this bridge have no vertical bearings and the two transition piers are already in a disadvantageous position in terms of stress, the subsequent longitudinal constraint conditions were all set at the central and side towers to reduce the burden on the transition piers during service.
After screening, five types of constraints between the side towers or the central tower and the girder were identified: 1. No connection; 2. Longitudinal limit bearings; 3. Elastic cables; 4. Viscous dampers; 5. Rigid connections. Considering structural symmetry, along with the existing scheme, five reasonable longitudinal constraint systems were proposed, as shown in Table 3.
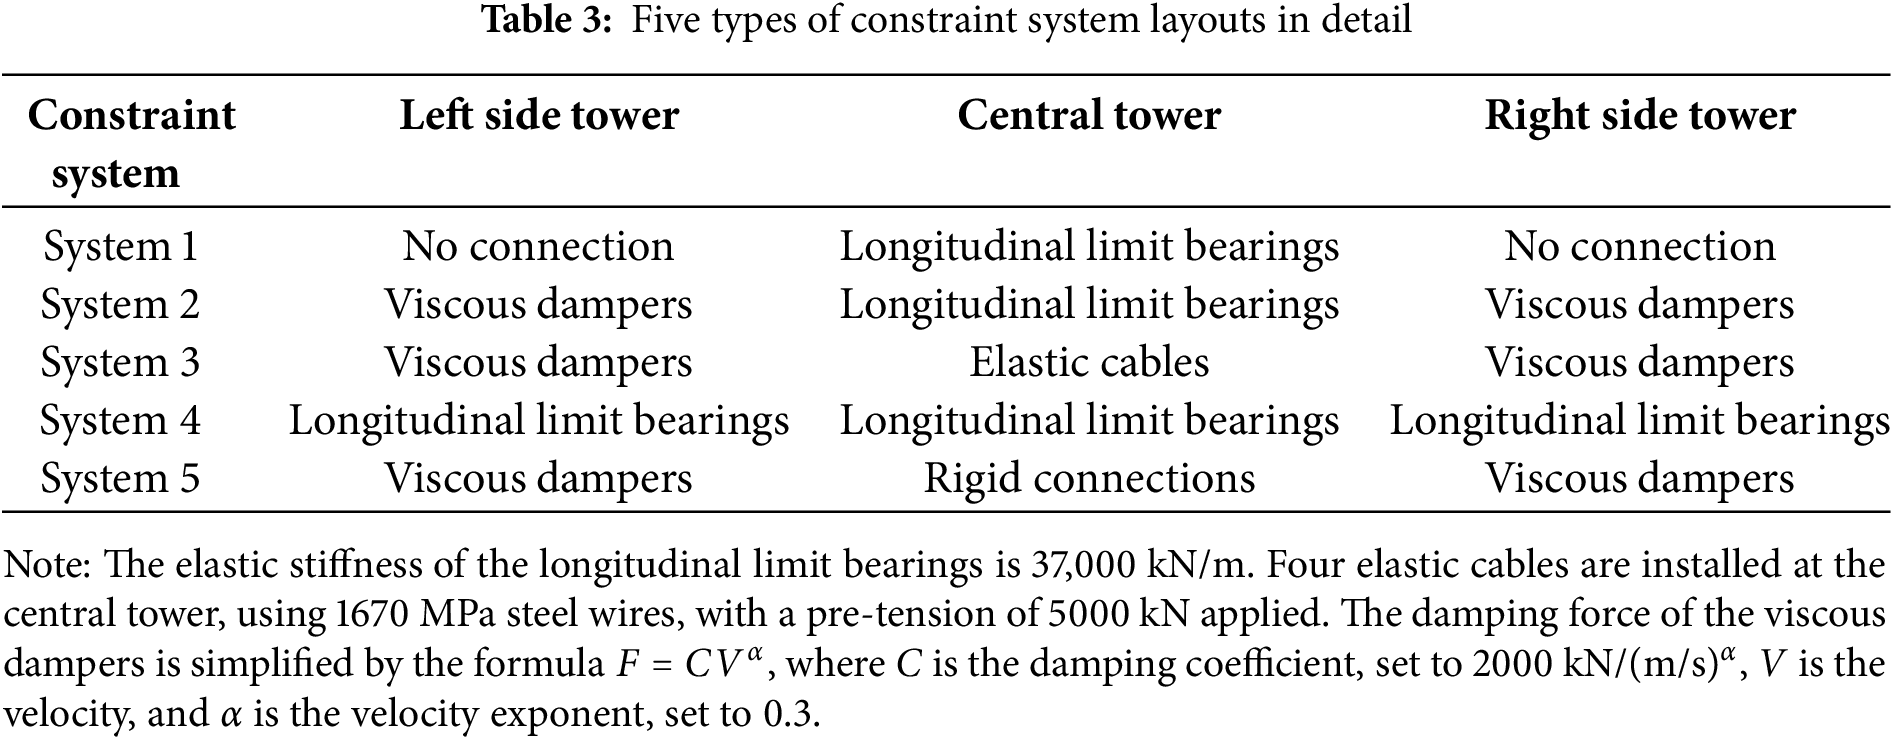
3.3 Comparison of Longitudinal Displacement Characteristics of Different Systems
The goal of this analysis is to minimize longitudinal displacement at the girder ends to extend the service life of bearings, expansion joints, etc., while making the stress on the transition piers more favorable. Therefore, cumulative and maximum longitudinal displacement at the girder ends (calculated as the longitudinal displacement of the girder ends relative to the top of the transition pier since the sliding bearings are installed on the transition pier), cumulative and maximum longitudinal displacement at the pier tops (calculated as the longitudinal displacement of the pier top relative to the ground), and maximum bending moment at the pier bottoms were selected as reference indicators for system selection.
Finite element calculations were conducted for each of the five systems, with a time history analysis duration of 600 s. The calculation results of each reference indicator are shown in Figs. 7–9, and the specific calculation values are listed in Table 4.
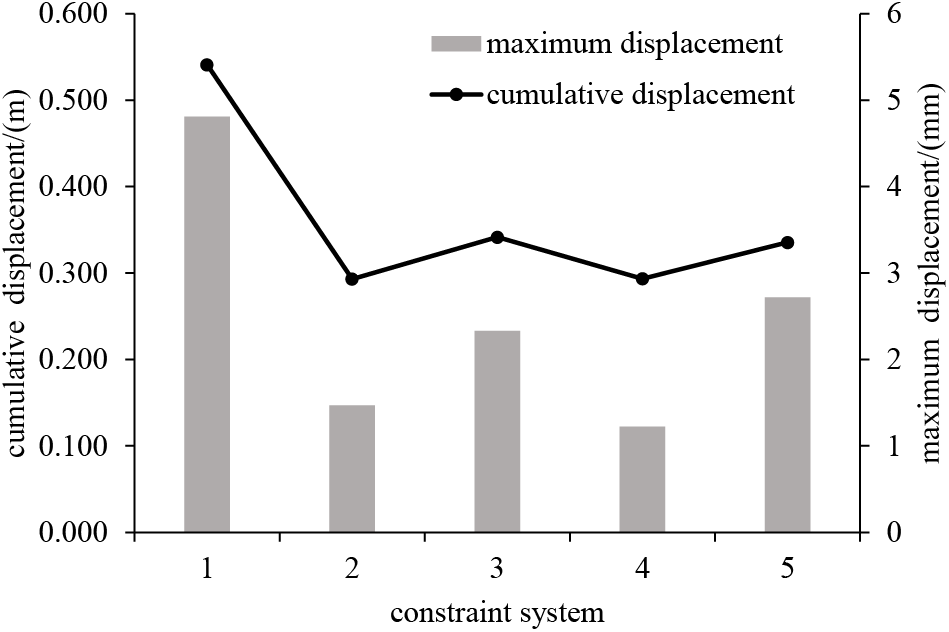
Figure 7: Cumulative and maximum longitudinal displacement at the girder ends
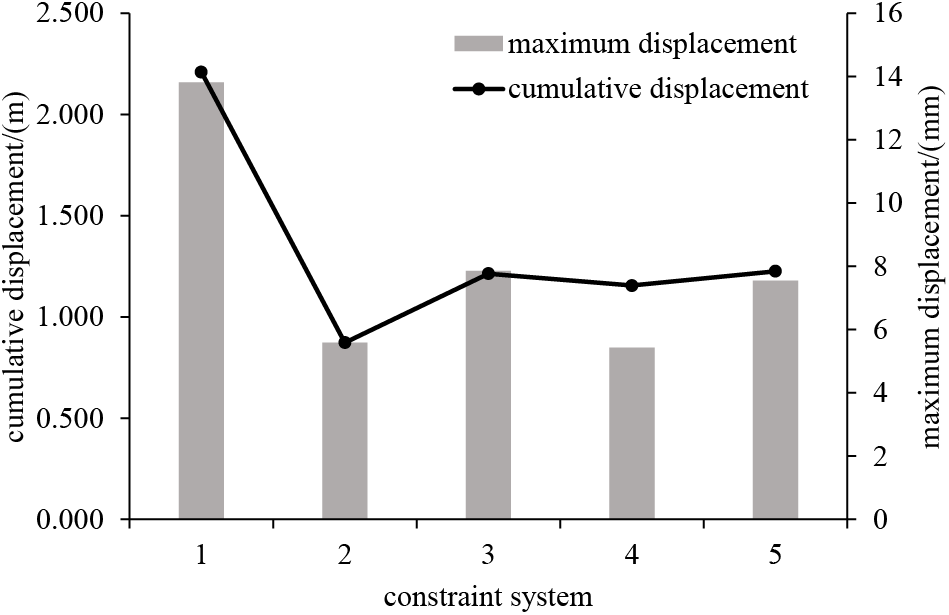
Figure 8: Cumulative and maximum longitudinal displacement at the pier tops
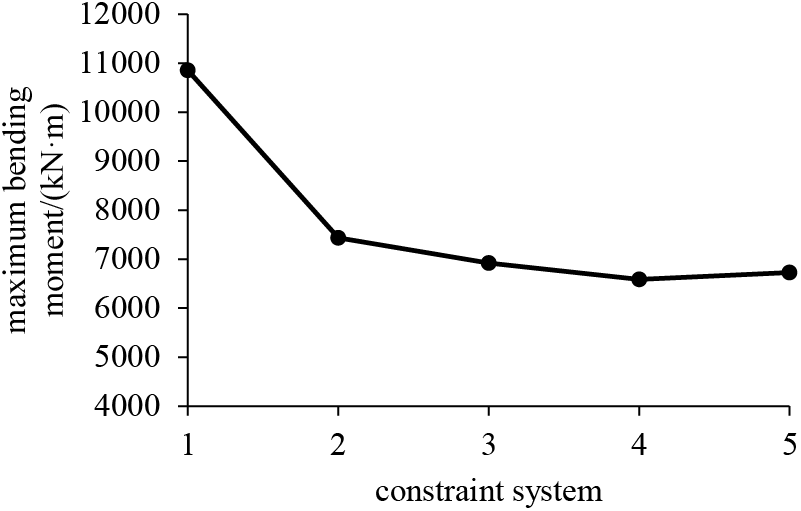
Figure 9: Maximum bending moment at the pier bottoms
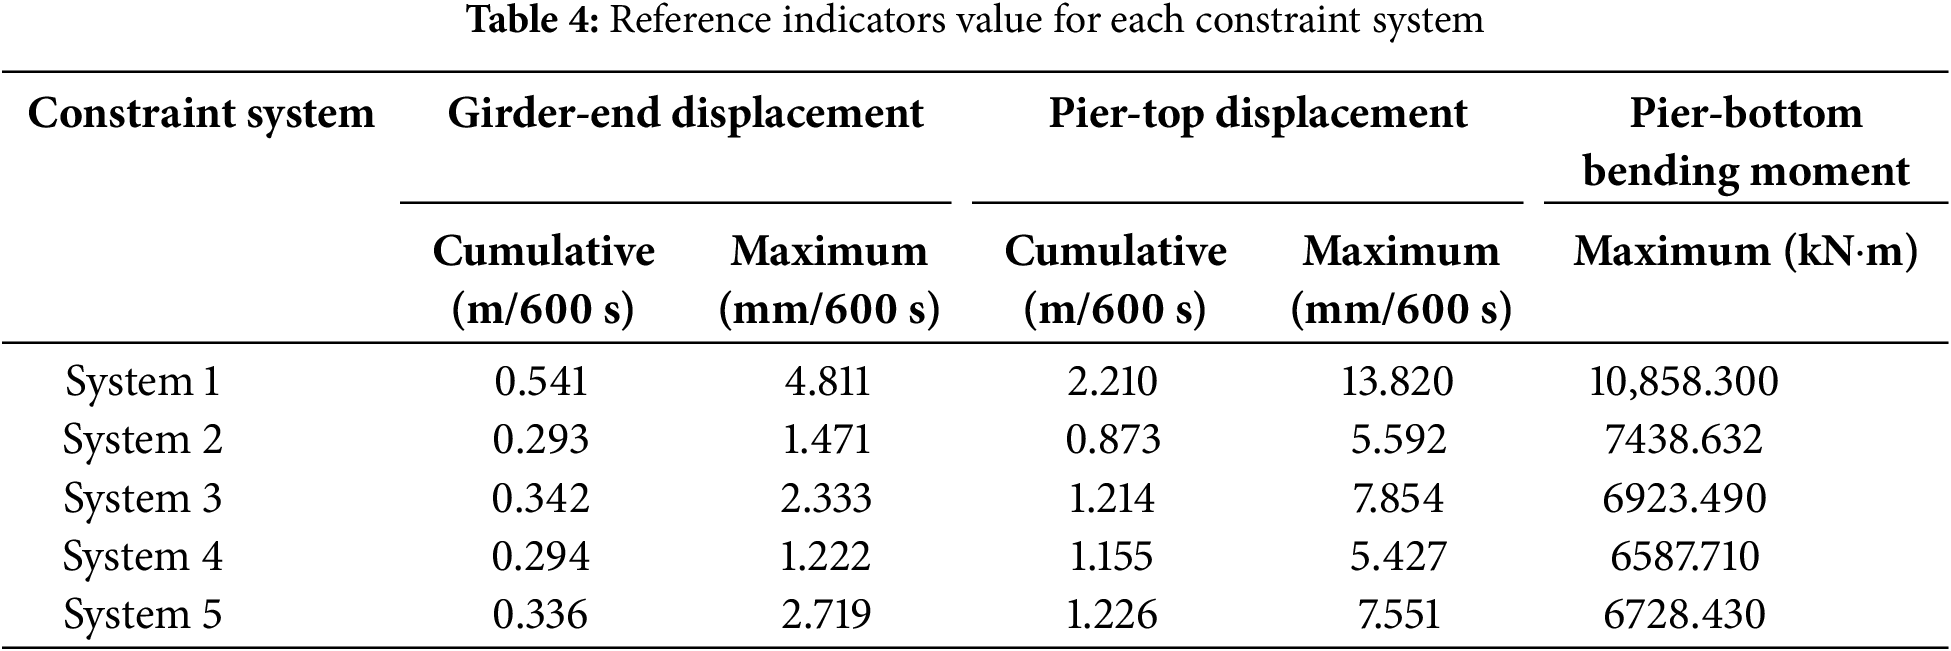
Based on Figs. 7–9 and Table 4, it is evident that System 1 has the poorest control over the longitudinal displacement at the girder ends under vehicle loads. Additionally, the longitudinal displacement at the top of the transition pier is relatively large under this system, and the maximum bending moment at the bottom of the transition pier is also the highest among the five constraint systems. This implies a shorter service life for the girder-end constraint devices (such as bearings and expansion joints), and the high-frequency, low-amplitude displacement of the transition pier could potentially lead to concrete fatigue issues during operation. Adding longitudinal constraints at the side towers (Systems 2, 3, 4, and 5) effectively reduces the longitudinal displacement at the girder ends and the transition piers, while also improving the stress distribution on the transition piers.
Using System 1 as the baseline, the installation of longitudinal limit bearings at the central tower proves more effective in controlling girder-end displacement compared to the installation of elastic cables or rigid connections (Systems 2 and 4 outperform Systems 3 and 5), with cumulative girder-end displacement reduced by up to 45.8% and maximum displacement by up to 74.6%. In terms of controlling displacement at the transition piers, System 2 performs best, with a maximum reduction of cumulative displacement by 60.5%. For the maximum bending moment at the bottom of the transition pier, the differences in reduction among the four systems (Systems 2, 3, 4, and 5) are relatively small, ranging between 30% and 40%.
Since the primary focus of this study is on controlling the longitudinal displacement at the girder ends while also considering the stress and fatigue issues at the transition piers caused by girder-end displacement, System 2 is ultimately considered the most reasonable longitudinal constraint system. Subsequent parametric analysis and optimization of the viscous dampers will be based on System 2.
4 Viscous Damper Parameter Analysis and Optimization
After determining System 2 as the optimal configuration, the parameters of the viscous dampers were optimized based on this foundation.
The code for fluid viscous dampers for bridges (JT/T 926-2014) [42] classifies dampers by velocity exponent into seven levels: 0.1, 0.2, 0.3, 0.4, 0.5, 0.6, and 1. However, the code does not specify classifications for the damping coefficient. This study selects viscous damper parameters with damping coefficients C of 1000, 2000, 3000, 5000, 7000, 10,000, 15,000, and 20,000 kN/(m/s)α for the seven levels of velocity exponent to analyze the structural time-history response over 600 s.
4.1 Viscous Damper Parameter Effects on the Girder
The cumulative and maximum displacements of the girder end were extracted for different damper parameter combinations. As shown in Figs. 10 and 11, both cumulative and maximum displacements generally decrease with increasing damping coefficient or decreasing velocity exponent. When the velocity exponent ranges from 0.1 to 0.6, the reduction rates of cumulative and maximum displacements gradually decrease to near-zero as the damping coefficient increases, eventually reaching a stable value. The smaller the velocity exponent, the less sensitive cumulative and maximum displacements are to changes in the damping coefficient, reaching stable values earlier. When the velocity exponent is 1, the damper behaves as a linear damper, providing significantly less damping force than the other six dampers. Consequently, even when the damping coefficient reaches 20,000 kN/(m/s)α, the data does not stabilize. The reduction in maximum displacement (69%) due to variations in damper parameters is more significant than that in cumulative displacement (35%).
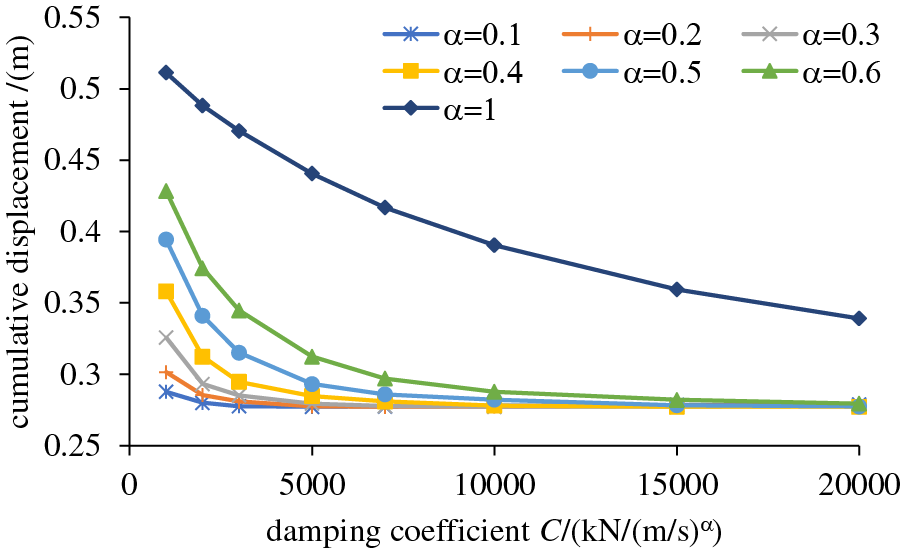
Figure 10: Cumulative displacement at the girder ends
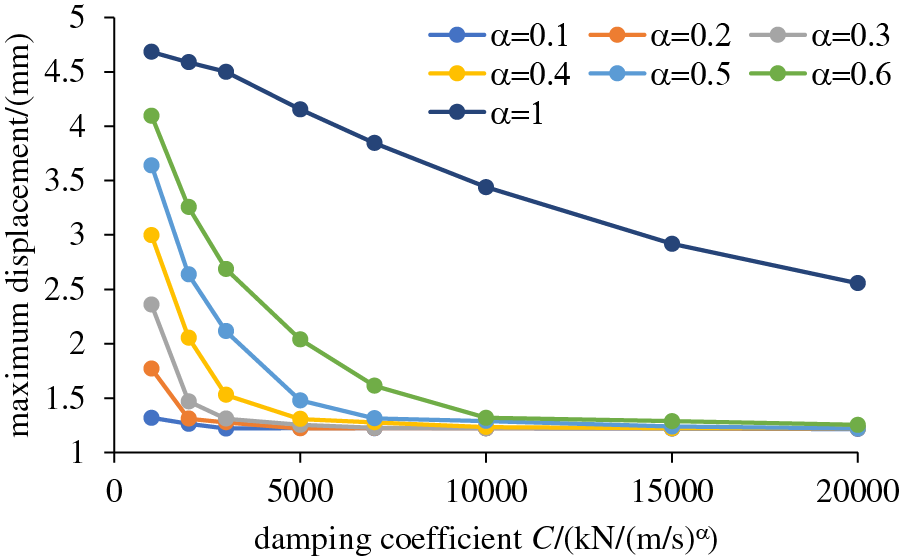
Figure 11: Maximum displacement at the girder ends
4.2 Viscous Damper Parameter Effects on the Transition Pier
The structural response of the transition pier under vehicle loads includes cumulative and maximum displacements at the pier tops, maximum bending moment at the pier bottom, and longitudinal acceleration at the pier tops. Figs. 12 and 13 show that cumulative and maximum displacements decrease with increasing damping coefficient or decreasing velocity exponent. The maximum reduction rates for cumulative and maximum displacements are similar, at 54% and 56%, respectively.
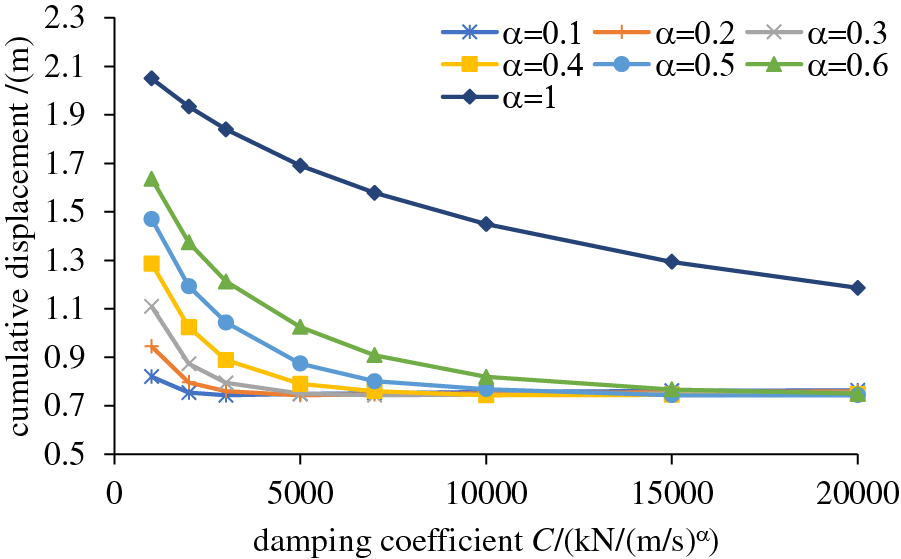
Figure 12: Cumulative displacement at the pier tops
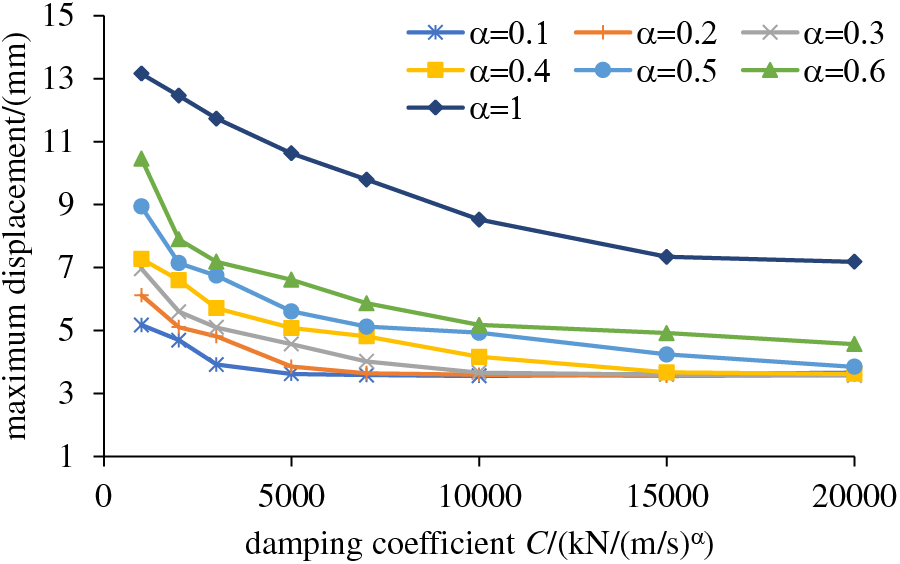
Figure 13: Maximum displacement at the pier tops
As shown in Fig. 14, when the velocity exponent is 1, longitudinal acceleration at the pier tops initially increases and then decreases with increasing damping coefficient. When the velocity exponent is between 0.1 and 0.6, longitudinal acceleration generally decreases initially and then increases as the damping coefficient increases. The smaller the velocity exponent, the smaller the damping coefficient corresponding to the minimum acceleration.
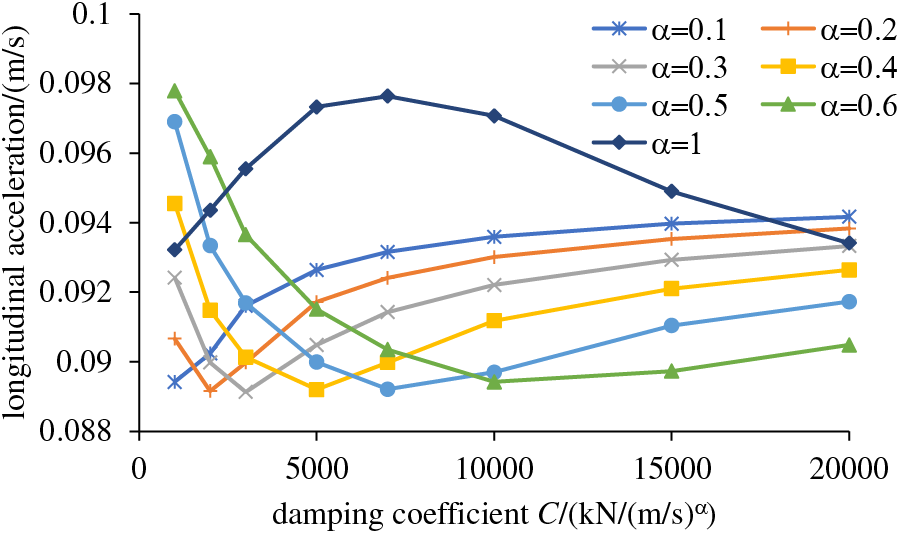
Figure 14: Longitudinal acceleration at the pier tops
As shown in Fig. 15, when the velocity exponent ranges from 0.5 to 1, the maximum bending moment at the pier bottoms decreases with increasing damping coefficient. When the velocity exponent ranges from 0.1 to 0.4, the value decreases initially and then increases with increasing damping coefficient. The smaller the velocity exponent, the earlier the value reaches the minimum. Overall, the data tends to decrease with decreasing velocity exponent.
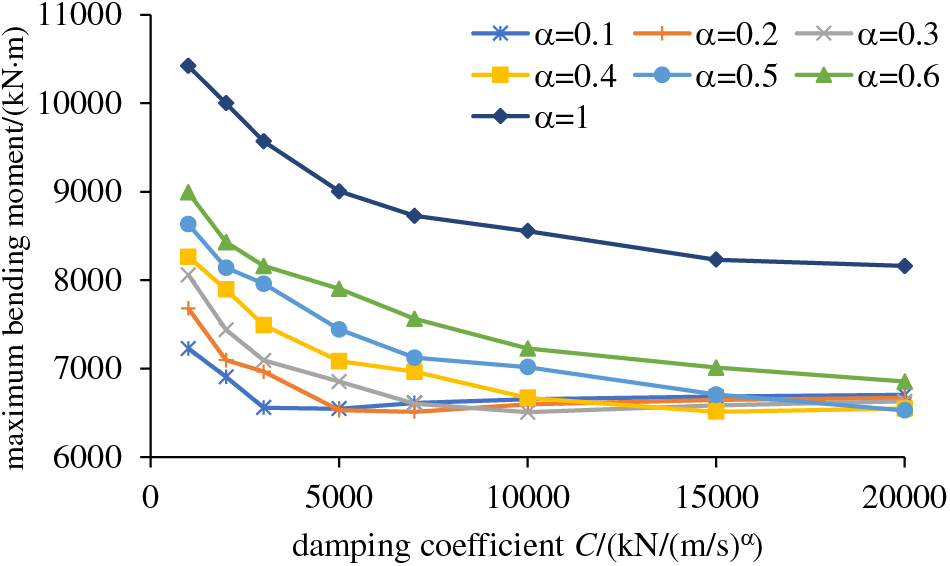
Figure 15: Maximum bending moment at the pier bottoms
4.3 Damper Parameter Optimization
Viscous damper parameter variations affect many indicators. Traditional nonlinear programming methods for finding the optimal solution often involve complex mathematical models that are difficult to fit, and it is challenging to determine the weights of various indicators. Similarly, the commonly used AHP method in bridge engineering has strong subjectivity and may lack consistency for non-common indicators like those in this study. Therefore, this study uses the coefficient of variation (CV) method to objectively determine the weight of each evaluation indicator, eliminating the impact of different units on the data. The TOPSIS method is then used to solve the multi-attribute decision-making problem [43], and the optimal parameter combination is identified based on the relative closeness of each parameter scheme to the ideal solution. The specific steps are shown in Fig. 16.
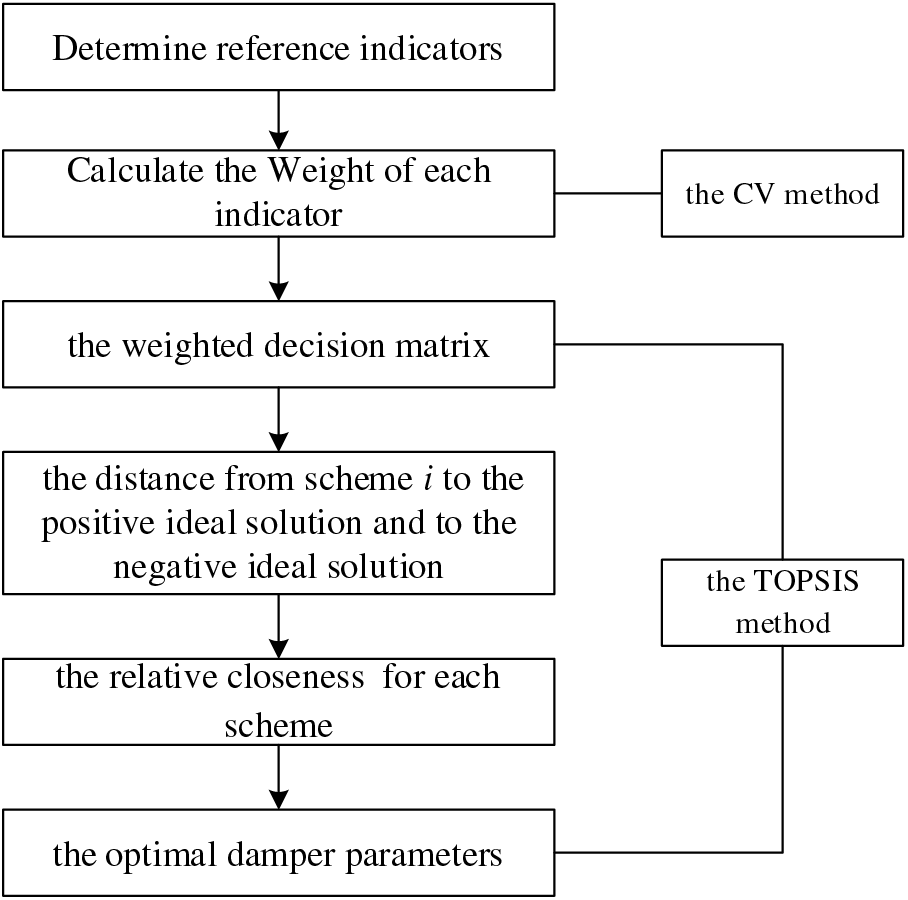
Figure 16: Multi-objective parameter optimization process
The coefficient of variation method assigns weights to each evaluation indicator based on the degree of variation between the current and target values. The greater the variation in an indicator, the more information it provides for discrimination, and thus it receives a higher weight [44]. The specific algorithm is as follows:
(1) Assume a dataset has m indicators and n samples to be evaluated. Define an
(2) Apply a positive transformation to all indicators. For positive indicators, retain the original data without any changes. For negative indicators, apply the following transformation:
where k is an arbitrary coefficient, with values such as 0.1, 0.2, etc.
(3) Matrix normalization are applied to eliminate the influence of units. The data standardization method is as follows, with the standardized data matrix denoted as R.
(4) Calculate the coefficient of variation
Once the weights for each indicator have been determined, the TOPSIS method can be used for parameter optimization [45]. First, construct the weighted decision matrix Z according to Eq. (10).
Based on the normalized weighted matrix, select the optimal and worst values among all indicators to obtain the positive ideal solution
where
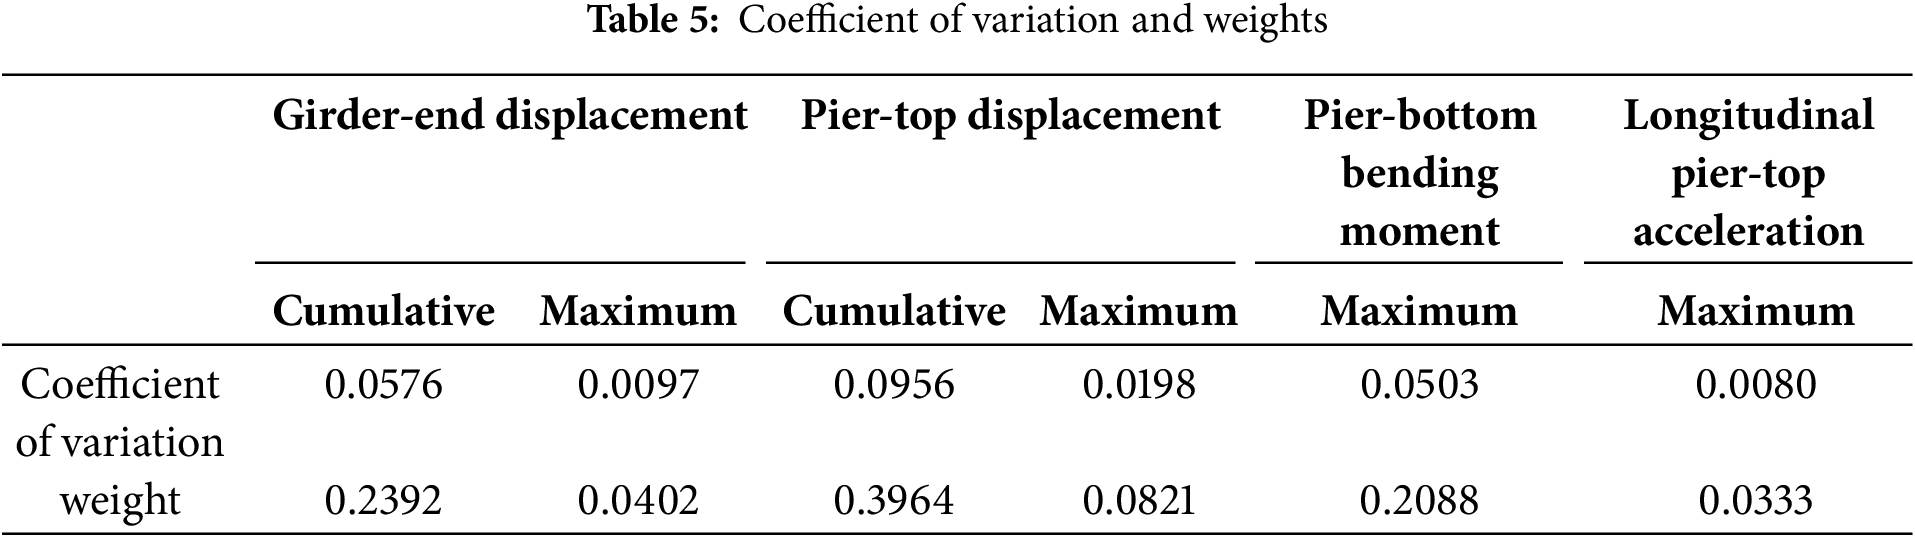
Based on the CV-TOPSIS method, the following indicators were selected as control objectives for parameter optimization: longitudinal cumulative and maximum displacements at the girder ends, cumulative and maximum displacements at the pier tops, maximum bending moment at the pier bottoms, and longitudinal acceleration at the pier tops. Table 5 shows the coefficient of variation and weights of each indicator calculated using the CV method. The results indicate that the cumulative displacement at the girder ends, cumulative displacement at the pier tops, and maximum bending moment at the pier bottoms have higher coefficients of variation and weights, suggesting that damper parameters significantly impact these indicators under vehicle loads. The weighted decision matrix is shown in Eq. (12), and the positive and negative ideal solutions are determined as shown in the Eq. (13).
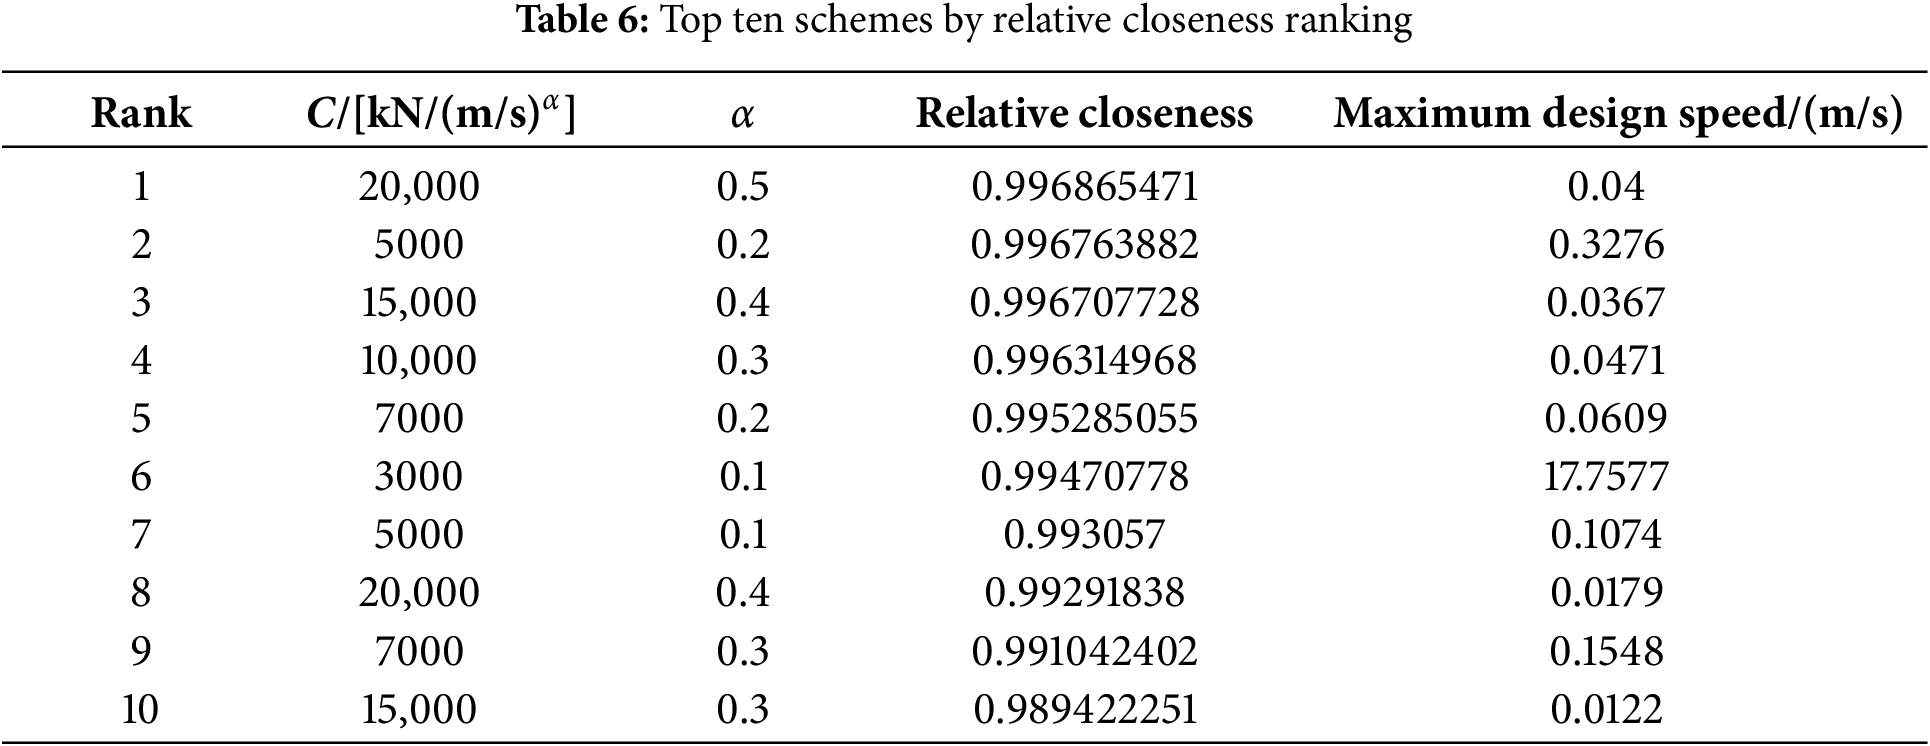
The relative closeness results for each parameter scheme were calculated, and the top 10 schemes were selected, as shown in Table 6. The design maximum operating speeds corresponding to a damping force of 4000 kN under each parameter combination were also calculated using the code for fluid viscous dampers (JT/T 926-2014) [42]. The results show that when the damping coefficient is 20,000 kN/(m/s)0.5 and the velocity exponent is 0.5, the structural response indicators are closest to the ideal solution. However, this combination has a large damping coefficient, and the corresponding maximum design speed is only 0.04 m/s, which is not conducive to damper performance under extreme conditions. When the damping coefficient is 5000 kN/(m/s)0.2 and the velocity exponent is 0.2, the relative closeness is very close to the former, and the corresponding maximum design speed can fully adapt to various service conditions. Therefore, the optimal damper parameters are C = 5000 kN/(m/s)0.2 and α = 0.2.
Regarding the control of girder-end displacement by longitudinal constraint systems in large-span, three-tower suspension bridges, this study simulates vehicle loads using WIM data and conducts finite element analysis. Based on existing three-tower suspension bridge cases in China, different longitudinal constraint systems are constructed, and the most reasonable system is selected. Under this system, the impact of various damper parameters on the bridge’s structural response is analyzed, and the CV-TOPSIS method is used for comprehensive evaluation of damper parameters, leading to the following conclusions:
(1) Under vehicle loads, the longitudinal constraint system significantly impacts the structural response of the bridge. Compared to a system with only a longitudinal limit bearing at the central tower (System 1), adding constraint devices at the side towers significantly reduces longitudinal displacement at the girder ends and transition piers, as well as the bending moment at the pier bottoms. Overall, the most reasonable constraint system is one with a longitudinal limit bearing at the central tower and viscous dampers at the side towers (System 2), reducing cumulative and maximum longitudinal girder-end displacements by 45.8% and 69.4%, respectively, and reducing cumulative and maximum longitudinal pier-top displacements by 60.5% and 59.5%, respectively. The maximum bending moment at the pier bottoms is also reduced by 31.5%.
(2) Under vehicle loads, cumulative and maximum longitudinal displacements at the girder ends, cumulative and maximum longitudinal displacements at the pier tops, and the maximum bending moment at the pier bottoms all decrease with increasing damping coefficient or decreasing velocity exponent. Under different velocity exponents, the trends of longitudinal acceleration at the pier top and the maximum bending moment at the pier bottom vary significantly with changes in the damping coefficient.
(3) In multi-attribute decision-making for damper parameters, the parameters significantly impact cumulative longitudinal displacement at the girder ends, cumulative longitudinal displacement at the pier tops, and the maximum bending moment at the pier bottoms, receiving higher weights. Considering the relative closeness of the solutions and the issue that large damping coefficients lead to small maximum design speeds, the optimal damper parameters under vehicle loads are C = 5000 kN/(m/s)0.2 and α = 0.2.
(4) Due to the specificity of the three-tower suspension bridge structure, the most reasonable restraint system, the effect of viscous damper parameters on structural response obtained from FE analysis, and the optimal damper parameters under multi-objective control cannot be directly applied to other three-tower suspension bridges. However, the methods used in this study, including random traffic flow generation, finite element time-history analysis, and parameter optimization, have strong applicability. They can ensure effectiveness for both two-tower and three-tower suspension bridges. Currently, these methods have been validated on several ultra-large-span suspension bridges in China.
Acknowledgement: None.
Funding Statement: The research reported in this article was supported by the National Key Research and Development Program of China (No. 2022YFB3706704), the Academician Special Science Research Project of CCCC (No. YSZX-03-2022-01-B).
Author Contributions: The authors confirm contribution to the paper as follows: study conception and design: Zihang Wang and Yuan Ren; data collection: Ying Peng; analysis and interpretation of results: Xiong Lan, Xiaoyu Bai and Chao Deng; draft manuscript preparation: Zihang Wang and Yuan Ren. All authors reviewed the results and approved the final version of the manuscript.
Availability of Data and Materials: The data that support the findings of this work are available from the corresponding author upon reasonable request.
Ethics Approval: Not applicable.
Conflicts of Interest: The authors declare no conflicts of interest to report regarding the present study.
References
1. Huang G, Hu J, Wan T, Hua X, Feng Z, Chen Z. Characteristics and mechanism of longitudinal displacement of suspension bridge under vertical loads. J Hunan Univ (Nat Sci). 2023 Jan 1–12;50(1):78–89 (In Chinese). [Google Scholar]
2. Fei H, Deng Z, Dan D. Vertical vibrations of suspension bridges: a review and a new method. Arch Computat Methods Eng. 2021 May 1;28(3):1591–610. doi:10.1007/s11831-020-09430-4. [Google Scholar] [CrossRef]
3. Guo T, Liu J, Huang L. Investigation and control of excessive cumulative girder movements of long-span steel suspension bridges. Eng Struct. 2016 Oct 15;125:217–26. doi:10.1016/j.engstruct.2016.07.003. [Google Scholar] [CrossRef]
4. Qu F, Deng X, Dong J, Shan D, Song Z. Field monitoring and analysis for cumulative longitudinal movements of girder ends for the medium-span suspension bridges. J Civil Struct Health Monit. 2023 Mar 1;13(2):505–22. doi:10.1007/s13349-022-00656-3. [Google Scholar] [CrossRef]
5. Sun Z, Zhang Y. Failure mechanism of expansion joints in a suspension bridge. J Bridge Eng. 2016 Oct 1;21(10):5016005. doi:10.1061/(ASCE)BE.1943-5592.0000942. [Google Scholar] [CrossRef]
6. Sun Z, Zou Z, Zhang Y. Utilization of structural health monitoring in long-span bridges: case studies. Struct Control Health Monit. 2017 Oct;24(10):e1979. doi:10.1002/stc.1979. [Google Scholar] [CrossRef]
7. Ala N, Power EH, Azizinamini A. Predicting the service life of sliding surfaces in bridge bearings. J Bridge Eng. 2016 Feb 1;21(2):4015035. doi:10.1061/(ASCE)BE.1943-5592.00007. [Google Scholar] [CrossRef]
8. Gibe HA, Tamai H, Sonoda Y. Numerical study on failure process and ultimate state of steel bearing under combined load. Heliyon. 2020 Apr;6(4):e03764. doi:10.1016/j.heliyon.2020.e03764. [Google Scholar] [PubMed] [CrossRef]
9. Li G, Han W, Chen X, Guo T, Xie Q, Yuan Y. Wear evaluation on slide bearings in expansion joints based on cumulative displacement for long-span suspension bridge under monitored traffic flow. J Perform Constr Facil. 2020 Feb 1;34(1):04019106. doi:10.1061/(ASCE)CF.1943-5509.0001388. [Google Scholar] [CrossRef]
10. Roeder CW. Fatigue and dynamic load measurements on modular expansion joints. Constr Build Mater. 1998 Mar 1;12(2):143–50. doi:10.1016/S0950-0618(97)00016-0. [Google Scholar] [CrossRef]
11. Hu S, Yang M, Meng D, Hu R. Damping performance of the degraded fluid viscous damper due to oil leakage. Structures. 2023 Feb 1;48(16):1609–19. doi:10.1016/j.istruc.2023.01.070. [Google Scholar] [CrossRef]
12. Ni YQ, Hua XG, Wong KY, Ko JM. Assessment of bridge expansion joints using long-term displacement and temperature measurement. J Perform Constr Facil. 2007 Apr 1;21(2):143–51. doi:10.1061/(ASCE)0887-3828(2007)21:2(143). [Google Scholar] [CrossRef]
13. Wu GM, Yi TH, Yang DH, Li HN, Liu H. Early warning method for bearing displacement of long-span bridges using a proposed time-varying temperature-displacement model. J Bridge Eng. 2021 Sep 1;26(9):4021068. doi:10.1061/(ASCE)BE.1943-5592.0001763. [Google Scholar] [CrossRef]
14. Hu J, Wang L, Song X, Sun Z, Cui J, Huang G. Field monitoring and response characteristics of longitudinal movements of expansion joints in long-span suspension bridges. Measurement. 2020 Oct;162(12):107933. doi:10.1016/j.measurement.2020.107933. [Google Scholar] [CrossRef]
15. Hongbin S, Jieyi Y, Yujing L. Research on the longitudinal movement and influence of restraint parameters of the long-span suspension bridge’s main girder. Front Mater. 2023 Jul 27;10:670. doi:10.3389/fmats.2023.1230097. [Google Scholar] [CrossRef]
16. Sheibani M, Ghorbani-Tanha AK. Obtaining mass normalized mode shapes of motorway bridges based on the effect of traffic movement. Structures. 2021 Oct 1;33(2):2253–63. doi:10.1016/j.istruc.2021.05.056. [Google Scholar] [CrossRef]
17. Carbonari S, Nicoletti V, Martini R, Gara F. Dynamics of bridges during proof load tests and determination of mass-normalized mode shapes from OMA. Eng Struct. 2024 Jul;310(6):118111. doi:10.1016/j.engstruct.2024.118111. [Google Scholar] [CrossRef]
18. Guo T, Liu J, Zhang Y, Pan S. Displacement monitoring and analysis of expansion joints of long-span steel bridges with viscous dampers. J Bridge Eng. 2015 Sep 1;20(9):4014099. doi:10.1061/(ASCE)BE.1943-5592.0000701. [Google Scholar] [CrossRef]
19. Huang G, Hu J, Hua X, Feng Z, Chen Z, Wan T. Analytic solution to longitudinal deformation of suspension bridges under live loads. J Bridge Eng. 2023 Feb 1;28(2):4022147. doi:10.1061/JBENF2.BEENG-5835. [Google Scholar] [CrossRef]
20. Li Y, Qian Y, Zhu J, Huang X. Longitudinal vibration characteristics of a long-span highway suspension bridge under stochastic wind and traffic loads. China J Highway Transp. 2021 Apr;34(4):93–104 (In Chinese). [Google Scholar]
21. Han D, Guo T, Huang L, Liu Z. A study on longitudinal displacements and damage control of expansion joints of long-span steel bridges under stochastic traffic loads. J Vib Shock. 2019 Dec;38(24):172–8 (In Chinese). [Google Scholar]
22. Qiang Z, He-qiang T, Guang-wu Y. Selection of a structural system for a three-tower suspension bridge of maanshan yangtze river highway bridge. Struct Eng Int. 2012 Feb;22(1):139–43. doi:10.2749/101686612X13216060213590. [Google Scholar] [CrossRef]
23. Cao H, Qian X, Zhou Y, Chen Z, Zhu H. Feasible range for midtower lateral stiffness in three-tower suspension bridges. J Bridge Eng. 2018 Mar 1;23(3):6017009. doi:10.1061/(ASCE)BE.1943-5592.0001196. [Google Scholar] [CrossRef]
24. Zhang W-M, Yang C-Y, Wang Z-W, Liu Z. An analytical algorithm for reasonable central tower stiffness in the three-tower suspension bridge with unequal-length main spans. Eng Struct. 2019 Nov 15;199(5):109595. doi:10.1016/j.engstruct.2019.109595. [Google Scholar] [CrossRef]
25. Cao H, Chen Y, Li J, Liu S. Static characteristics analysis of three-tower suspension bridges with central buckle using a simplified model. Eng Struct. 2021 Oct 15;245:112916. doi:10.1016/j.engstruct.2021.112916. [Google Scholar] [CrossRef]
26. Zhang P, Duan Y. Analysis on bridge type and structural optimization of the main bridge of Xunjiang super-large bridge. Western China Commun Sci Technol. 2022 Feb;2:119–21, 201 (In Chinese). [Google Scholar]
27. Yan Z, Li M. Optimization of main beam hoisting scheme of Xunjiang Large Bridge. In: Urban construction and management engineering IV. Boca Raton: CRC Press; 2024. [Google Scholar]
28. Lin S, Huang Q, Ren Y, Fan Y, Yang J. Traffic load model based on the third Nanjing Yangtze River Bridge. J Southeast Univ (Nat Sci Ed). 2016 Apr;46(2):365–70 (In Chinese). [Google Scholar]
29. Sun B, Xu YL, Wang FY, Li Z, Zhu Q. Multi-scale fatigue damage prognosis for long-span steel bridges under vehicle loading. Struct Infrastruct E. 2019 Apr 3;15(4):524–38. doi:10.1080/15732479.2018.1562478. [Google Scholar] [CrossRef]
30. Guo T, Frangopol DM, Chen Y. Fatigue reliability assessment of steel bridge details integrating weigh-in-motion data and probabilistic finite element analysis. Comput Struct. 2012 Dec 1;112–113(1):245–57. doi:10.1016/j.compstruc.2012.09.002. [Google Scholar] [CrossRef]
31. Alam MA, Farnham C, Emura K. Best-fit probability models for maximum monthly rainfall in bangladesh using gaussian mixture distributions. Geosciences. 2018 Apr;8(4):138. doi:10.3390/geosciences8040138. [Google Scholar] [CrossRef]
32. Park C, Padgett WJ. Analysis of strength distributions of multi-modal failures using the EM algorithm. J Stat Comput Sim. 2006 Jul 1;76(7):619–36. doi:10.1080/10629360500108970. [Google Scholar] [CrossRef]
33. Ng HKT, Chan PS, Balakrishnan N. Estimation of parameters from progressively censored data using EM algorithm. Comput Statist Data Anal. 2002 Jun 28;39(4):371–86. doi:10.1016/S0167-9473(01)00091-3. [Google Scholar] [CrossRef]
34. Nylund KL, Asparouhov T, Muthén BO. Deciding on the number of classes in latent class analysis and growth mixture modeling: a monte carlo simulation study. Struct Equ Model A Multidiscip J. 2007 Oct 23;14(4):535–69. doi:10.1080/10705510701575396. [Google Scholar] [CrossRef]
35. Wang FY, Xu YL. Traffic load simulation for long-span suspension bridges. J Bridge Eng. 2019 May;24(5):05019005. [Google Scholar]
36. Kingman JFC. Poisson processes. Oxford: Clarendon Press; 1992. 118 p. [Google Scholar]
37. Gao W, Li G, Su Q, Han W. Impact of rigid central clamps on longitudinal deformation of long-span suspension bridges under vehicle excitations. Struct Infrastruct Eng. 2022 Jun 3;18(6):760–74. doi:10.1080/15732479.2021.1875486. [Google Scholar] [CrossRef]
38. Liu S, Chen Z, Cao H, Shao C. An analytical model for three-tower self-anchored suspension bridges with longitudinal tower-girder connections. Structures. 2023 Feb 1;48(3):1455–67. doi:10.1016/j.istruc.2023.01.054. [Google Scholar] [CrossRef]
39. Zhang M, Wan T, Wang Y. Design and static analysis of the Taizhou Yangtze River Bridge. China Proc Inst Civ Eng Bridge Eng. 2015 Mar;168(1):52–63. doi:10.1680/bren.12.00017. [Google Scholar] [CrossRef]
40. Wang Z, Yang J, Zhou P. Study of steel and concrete composite girder suspension bridge scheme for Yingwuzhou Changjiang River Bridge. Bridge Constr. 2010 Aug;4:52–6 (In Chinese). [Google Scholar]
41. Gao Z, Shi F. Key techniques of design of main bridge of Oujiang River North Estuary Bridge in Wenzhou. Bridge Construction. 2017 Feb;47(1):1–5 (In Chinese). [Google Scholar]
42. Fluid viscous damper for bridges, JT/T 926-2014; 2014 [cited 2024 Dec 10]. Available from: http://www.weboos.cn:8083/assets/basicStandard/std_529954.pdf. [Google Scholar]
43. Liu P. Multi–attribute decision–making method research based on interval vague set and TOPSIS method. Ukio Technologinis ir Ekonominis Vystymas. 2009 Jan 1;15(3):453–63. [Google Scholar]
44. Bedeian AG, Mossholder KW. On the use of the coefficient of variation as a measure of diversity. Organ Res Methods. 2000 Jul;3(3):285–97. doi:10.1177/109442810033005. [Google Scholar] [CrossRef]
45. Tzeng GH, Huang JJ. Multiple attribute decision making: methods and applications. Boca Raton: CRC Press; 2011. 352p. [Google Scholar]
Cite This Article
 Copyright © 2025 The Author(s). Published by Tech Science Press.
This work is licensed under a Creative Commons Attribution 4.0 International License , which permits unrestricted use, distribution, and reproduction in any medium, provided the original work is properly cited.
 Downloads
 Citation Tools