
 Submit a Paper
 Propose a Special lssue
 Open Access
ARTICLE

In-Plane Bearing Capacity of CFST Truss Arch Bridges with Geometric Defects
1 State Key Laboratory of Mountain Bridge and Tunnel Engineering, Chongqing Jiaotong University, Chongqing, 400074, China
2 Sichuan Road and Bridge Construction Group Co., Ltd., Chengdu, 610093, China
3 China Railway First Group Eighth Engineering Co., Ltd., Chongqing, 401147, China
4 Chongqing Expressway Group Co., Ltd., Chongqing, 401120, China
* Corresponding Author: Yin Zhou. Email:
Structural Durability & Health Monitoring 2025, 19(3), 683-703. https://doi.org/10.32604/sdhm.2025.061549
Received 27 November 2024; Accepted 05 February 2025; Issue published 03 April 2025
 View Full Text
 Download PDF
Abstract
Failure tests were conducted on two concrete-filled steel tubular (CFST) truss arch bridges with a span of approximately 12 m to investigate the influence of initial geometric defects on the in-plane bearing capacity of CFST truss arch bridges. The effects of antisymmetric defect on the ultimate bearing capacity, failure mode, structural response, and steel–concrete confinement effect of CFST truss arch bridges under quarter-point loading were analyzed. On this basis, numerical simulations were conducted to investigate the in-plane bearing capacity of CFST truss arch bridges further under different scenarios. The initial defect form of the arch was obtained by using theoretical deduction, and the theoretical basis for the weakening of the ultimate bearing capacity of the arch bridge caused by geometric defects was clarified. Results indicate that the antisymmetric defect does not change the four-hinge failure mode of the model arch under quarter-point loading but increases the local cracking area and crack density of the concrete inside the pipe. The sine geometric defect with an amplitude of L/250 resulted in a 44.4% decrease in the yield load of the single hinge of the model arch, a 10.5% decrease in the failure load of the four hinges, and a 40.9% increase in the maximum vertical deformation during failure. At the initial stage of loading, the steel pipe and the concrete inside the pipe were subjected to relatively independent forces. After reaching 67% of the ultimate load, the catenary arch ribs began to produce a steel pipe concrete constraint effect. The initial geometric defects resulted in a decrease in the load when the constraint effect occurred. The antisymmetric defects with the same amplitude have a greater impact on the in-plane bearing capacity of the CFST arch bridge than the initial geometric defects with symmetry. The linear deviation at L/4 caused by construction must be controlled to be less than L/600 to ensure that the internal bearing capacity of the CFST arch bridge reaches 95% of the design bearing capacity. The structural deformation caused by geometric initial defects increases linearly with the increase in defect amplitude. The bearing capacity is weakened because the structural deflection and bending moment are amplified by initial defects.Keywords
Concrete-filled steel tubular (CFST) arch bridges, which have the advantages of high structural stiffness, excellent bearing capacity, and high economy, have been widely used in bridge engineering [1–5]. China has built nearly 500 CFST arch bridges in the past 30 years, with the maximum span reaching 575 m [6]. However, CFST arch bridges often inevitably have certain geometric defects due to manufacturing, transportation, and other construction procedures, and these defects may potentially weaken the ultimate bearing capacity of CFST arch bridges [7]. Therefore, exploring the influence of geometric defects on the in-plane bearing capacity of CFST arch bridges is crucial in providing a basis for the safe construction of CFST structures.
Scholars have conducted extensive research on the influence of geometric defects on the bearing capacity of CFST arch bridges. Some scholars have focused on identifying actual geometric defects in arch bridge structures [8–11], and a series of arch bridge defect detection methods has been proposed. However, they have not conducted further structural stress analysis on these defects and have not been able to obtain the impact of geometric defects on structural performance. Some scholars have conducted theoretical analysis on arch bridges with damage defects [12], and analytical expressions for the structural response of arch bridges have been derived. However, such methods are difficult to generalize to highly complex CFST truss arch bridges because of the complexity of theoretical derivation. Some scholars have also conducted research on the influence of specific geometric defects on the stress of CFST arch bridge structures. Wang et al. [13–16] used numerical simulation methods to calculate the bearing capacity and failure mode of CFST arches. They also analyzed the influence of initial defects on the failure mode and load–displacement curve of CFST arches. Their research has shown that geometric defects remarkably the bending moment and stress of structures, increase structural deformation at the same axial force level, and reduce the ultimate bearing capacity of CFST arches. When the initial geometric defects are controlled within 1/4000 of the span, the weakening of the ultimate bearing capacity can be ignored. However, the above numerical simulation studies lack experimental verification. Given the complexity and high cost of testing CFST arch structures, the existing arch structure tests [17–21] are mostly used for testing the mechanical performance of structures. Moreover, the research on the ultimate bearing capacity of CFST truss arch bridges with geometric defects in the plane is very limited in public literature. Therefore, conducting experimental research on CFST truss arch bridges with initial geometric defects is urgently needed to clarify the influence of geometric defects on the in-plane bearing capacity of CFST arch bridges.
In this regard, a quarter-point loading failure test on one perfect model arch and one antisymmetric defect model arch was conducted in this study. The influence of antisymmetric defect forms on the ultimate bearing capacity, failure mode, structural response, and steel tube concrete constraint effect of the structure under quarter-point loading conditions was clarified by comparing and analyzing the measured data. The numerical simulation verified the influence of defect amplitude, defect form, and loading method on the ultimate bearing capacity. The research results can provide a reference for similar experimental studies and the actual construction alignment of CFST arch bridges.
The experiment is based on a 380 m main span CFST catenary arch bridge [22]. Given that the main focus of this experiment is on the in-plane response of the structure, a single truss was selected for experimental research [23,24]. The test arch adopts a single rib arrangement with a scaling ratio of 1:31.7. After being scaled down according to the ratio, the span of the test arch is 11.988 m, and the rise is 2.524 m. The specific dimensions are shown in Fig. 1. The experimental arch is composed of a steel pipe truss and concrete inside the pipe. The steel pipe truss is made of Q345 steel and consists of chord members and web members. The outer diameter of the upper and lower chord members is 65 mm, the outer diameter of the belly member is 32 mm, and the wall thickness is 4 mm for all members. The concrete inside the pipe is made of C80 fine-grained concrete.
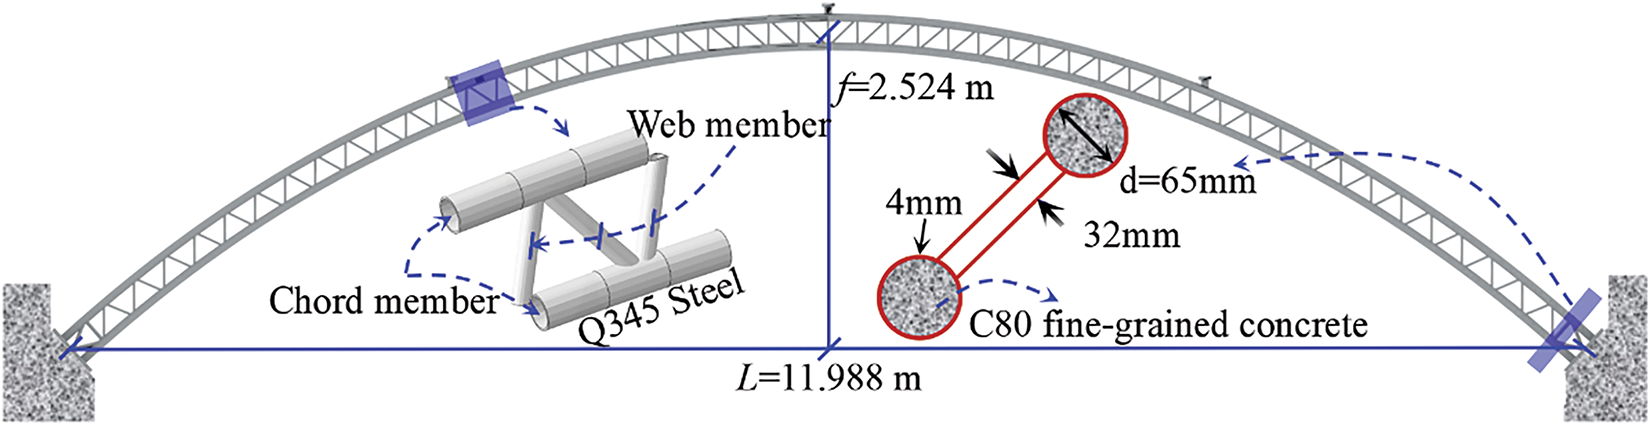
Figure 1: Layout of the model
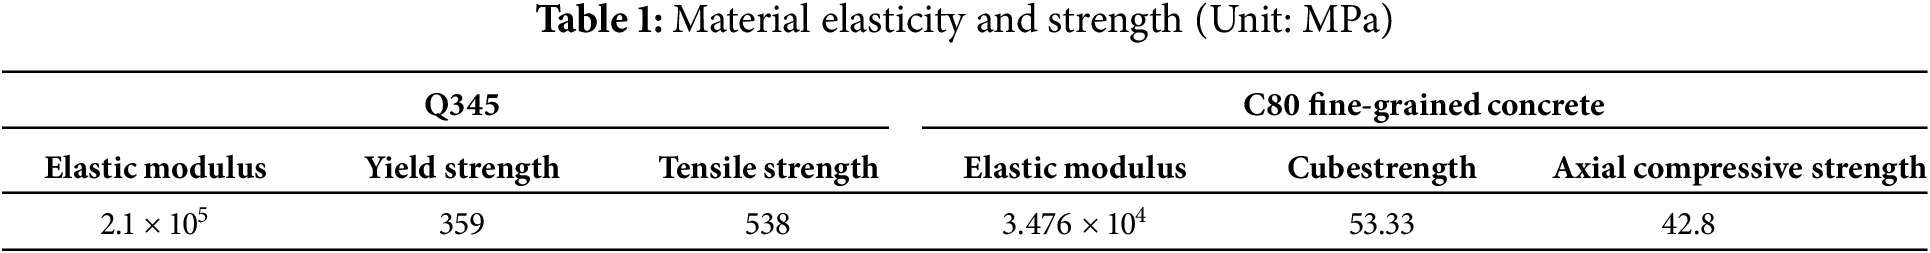
The experimental arch steel is made of Q345, and C80 concrete is poured into the steel pipe. Given the requirements for concrete fluidity in model construction [25], the coarse aggregate gradation of ordinary concrete was adjusted from the original 5–20 mm to 2–9.5 mm. The mechanical properties of the adjusted model materials are shown in Table 1. According to Table 1, the yield strength of the Q345 steel model is 359 MPa, the elastic modulus is 210,000 MPa, and its yield strain is 1.7 × 10³ με.
Two experimental models, A-1 and A-2, were designed to compare the effects of initial defects on ultimate bearing capacity. The A-1 model has no initial geometric defects, whereas the A-2 model has initial geometric defects. Given the high probability of first-order eigenvalue buckling and its proximity to the most unfavorable defect distribution, the initial geometric defect of the A-2 model adopted a sine curve consistent with the first-order buckling mode. The technical specification for CFST arch bridges (GB 50923-2013) stipulates that the elevation deviation of the arch ring should be less than ±L/3000. The previous calculation results showed that the initial geometric defect with an amplitude of L/3000 causes a decrease in bearing capacity of less than 1%. As shown in Fig. 2, the amplitude size of the initial defect in this experiment was set to L/250, which is 4.8 cm, to highlight the experimental phenomenon.
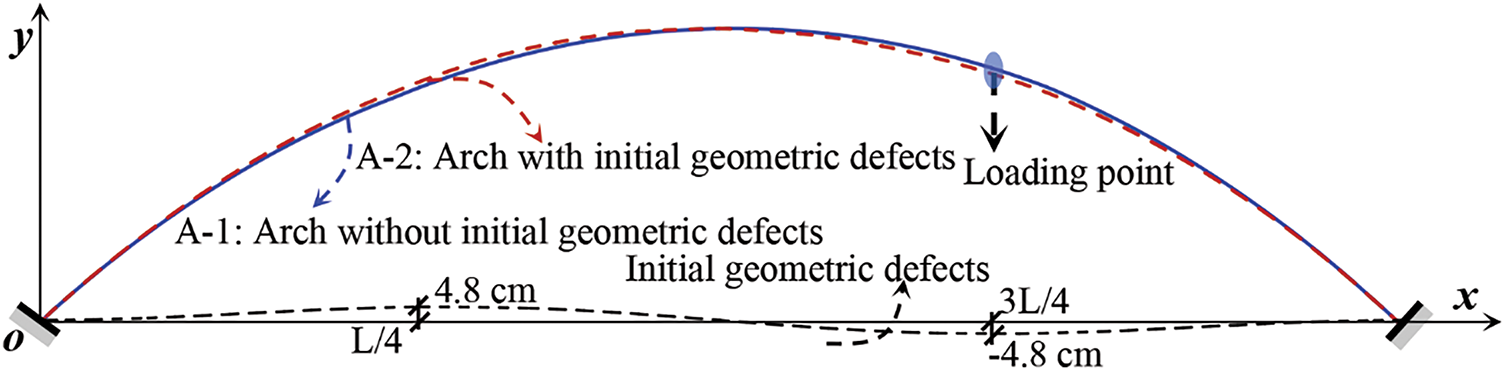
Figure 2: Design arch axis of A-1 and A-2
During the production, transportation, installation, and welding of the test arch steel pipe, the linearity is affected; thus, the actual arch axis shape of the test arch also has initial defects [26–28]. The initial defects of the test arch were measured by a total station. The initial geometric defect values of test arches A-1 and A-2 are shown in Fig. 3. The values in the figure represent the difference between the actual vertical coordinates of each measuring point and the ideal design vertical coordinates. When the measured vertical coordinate is higher than the design vertical coordinate, it is positive; when it is lower than the design vertical coordinate, it is negative.
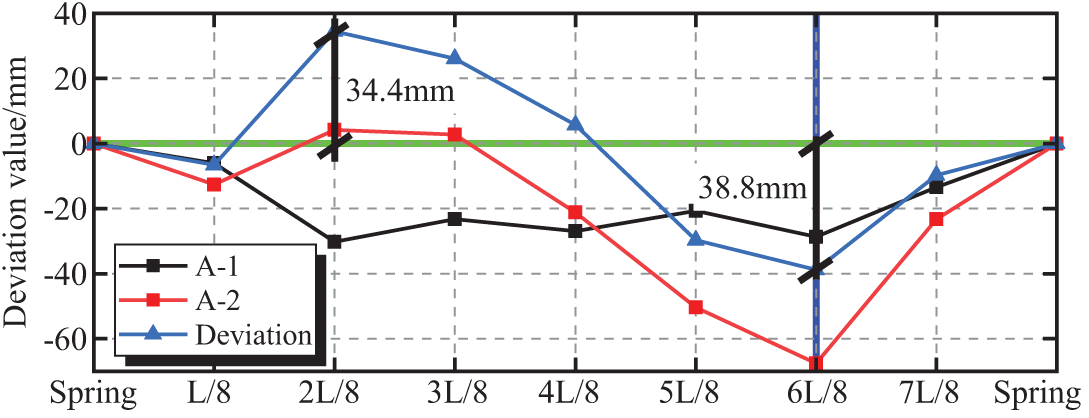
Figure 3: Initial geometric defect value of the test piece arch
The test arches A-1 and A-2 were designed for single-point loading at 3L/4. The test device consists of arch ribs, lateral limit devices, loading devices, arch supports, and reaction frame devices. The overall assembly of the model is shown in Fig. 4.
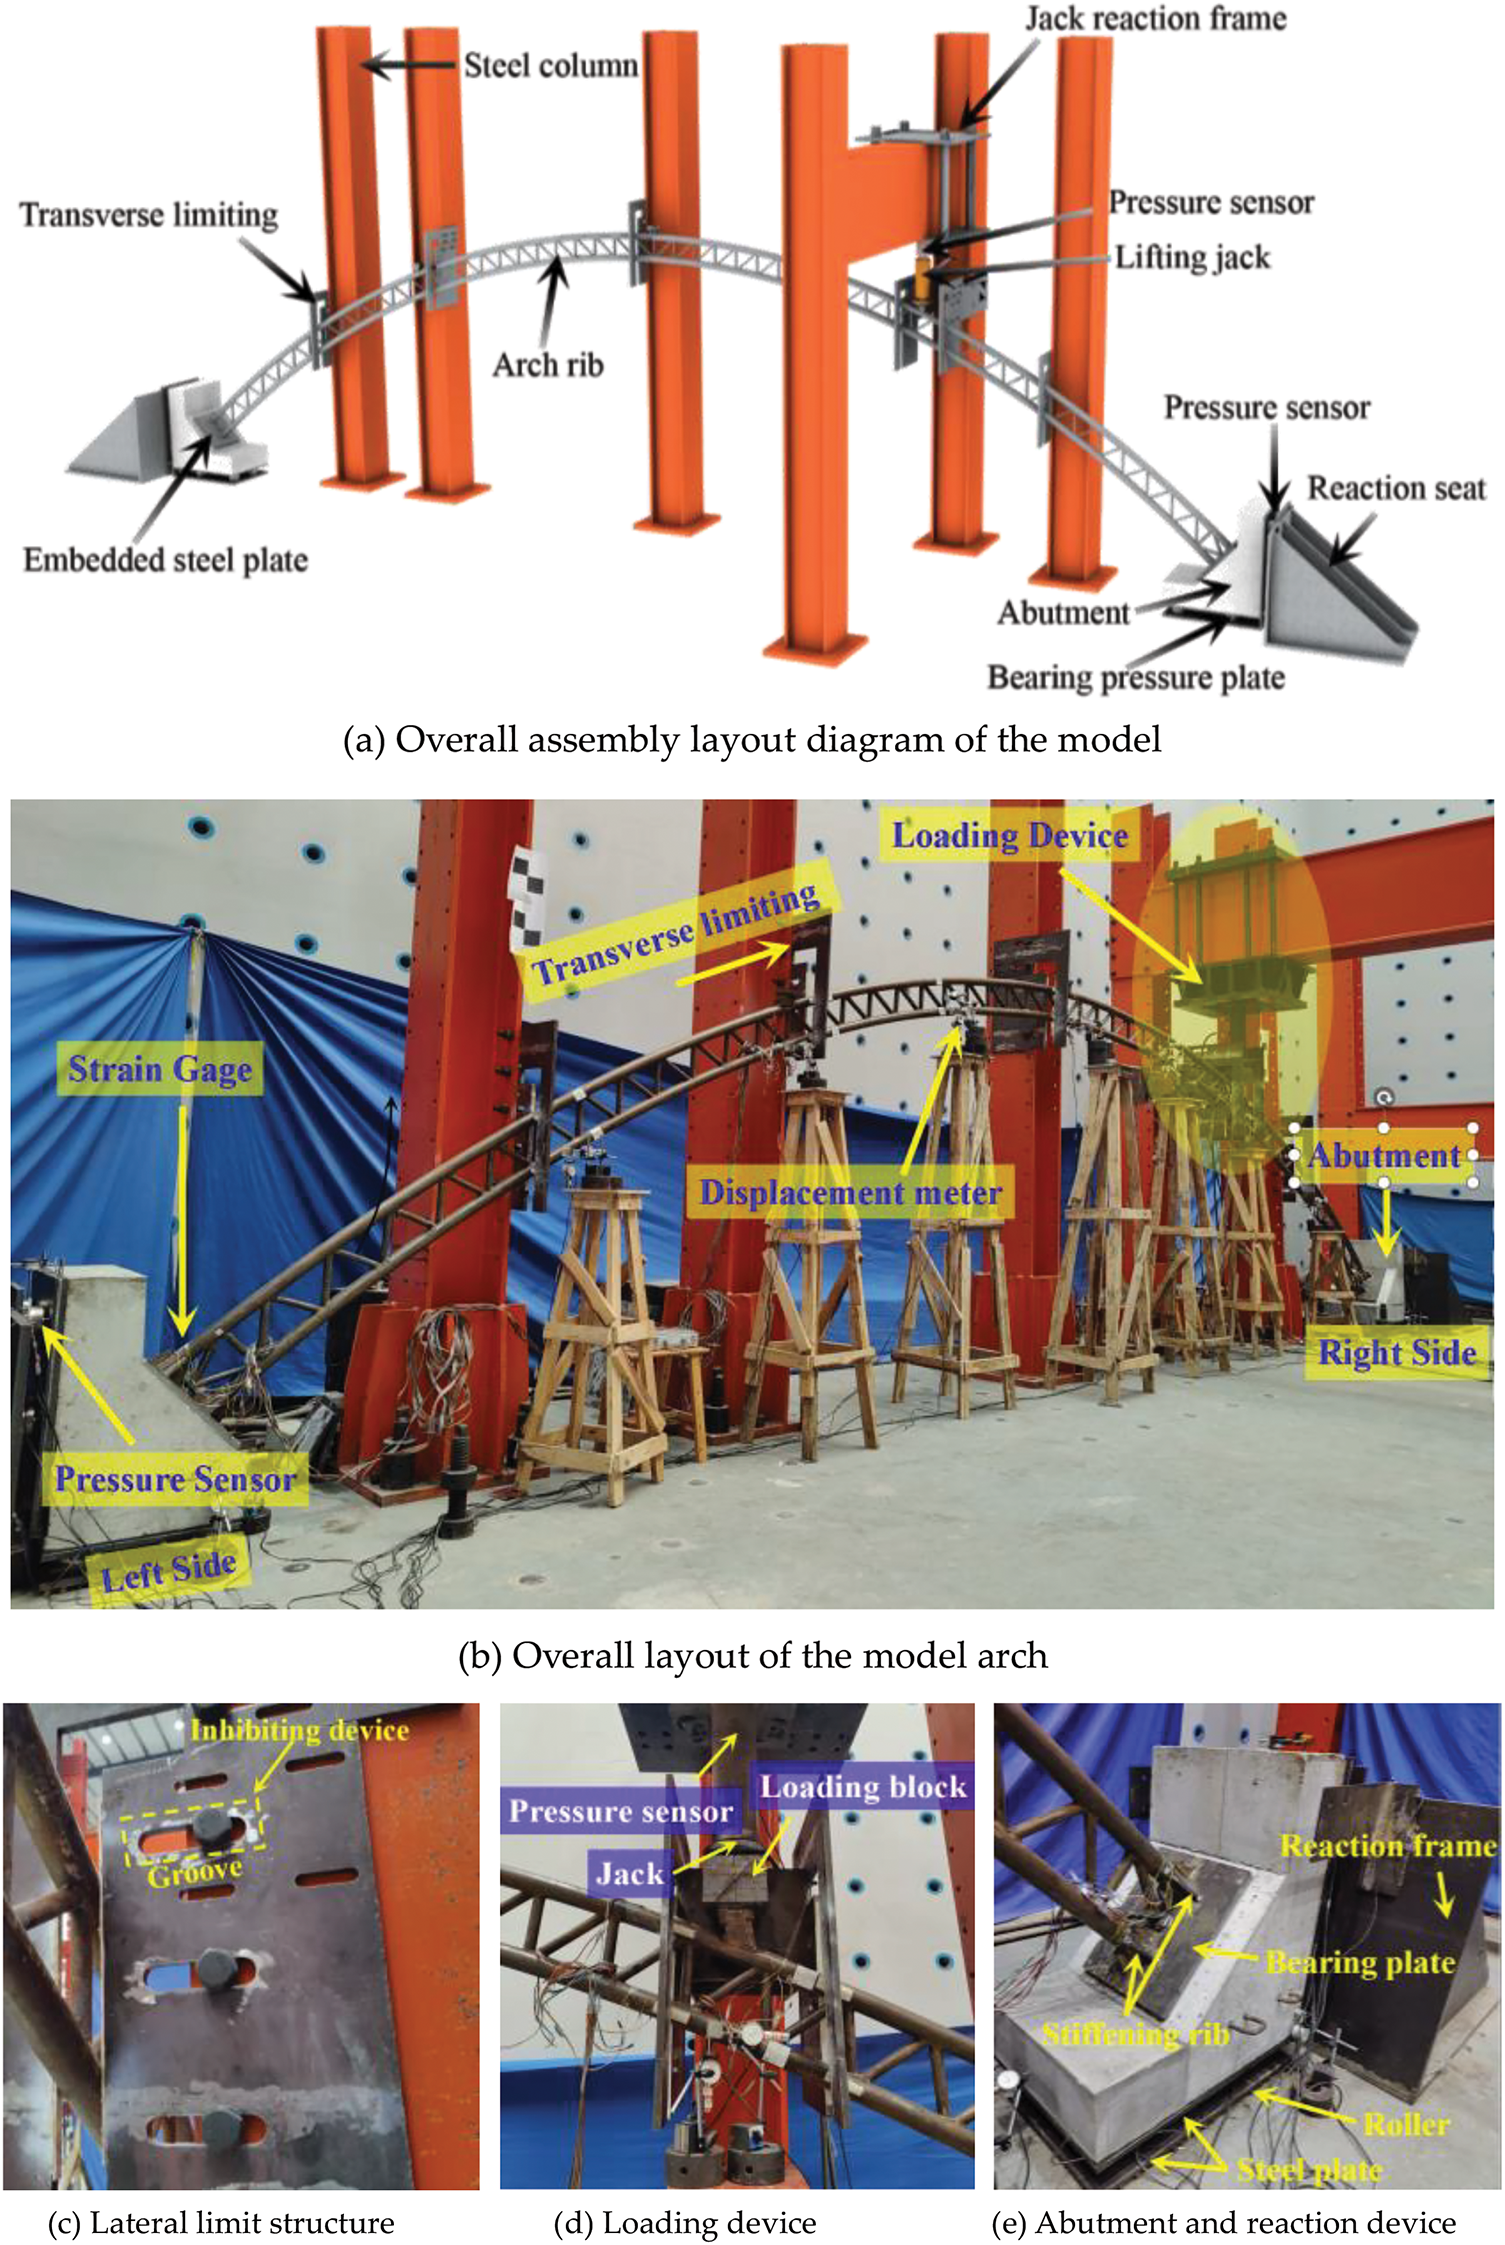
Figure 4: Experimental device
The experiment mainly investigates the bearing capacity of the arch under vertical load and in-plane deformation. Five lateral limit structures were set up throughout the arch (Fig. 4c) to avoid out-of-plane deformation causing structural instability and failure and to ensure that the arch only deforms freely in the plane during the loading process by constraining the out-of-plane deformation of the test arch. The lateral limit structure consists of a limit plate and fixed bolts. A polytetrafluoroethylene (PTFE) plate with a low friction coefficient was pasted on the contact surface between the limit structure and the arch rib to reduce the friction effect between the limit device and the arch rib.
The loading device (Fig. 4d) adopts a 50 t hydraulic jack. It has a pressure sensor at the top of the jack, which is installed in the matching fixture. The bottom surface is designed with a disc in contact with the arch rib loading block to ensure uniform force distribution.
The abutment and reaction device (Fig. 4e) consists of an arch, steel rollers, and a reaction frame device. The reaction frame device adopts a triangular structure with high stiffness to limit the sliding of the arch during the test process. Steel rollers can effectively reduce the horizontal friction generated during the loading process, thereby making the testing of horizontal force sensors highly accurate.
The experiment adopts graded loading and holds the load for 2 min after each loading to ensure the test arch’s deformation stability under each load level. A load of 10 kN is applied during each loading. Moreover, the load is reduced to 5 kN each time the deformation of the test arch increases rapidly. The loading process is stopped when the deformation of the test arch continues to increase during the holding time.
The experiment mainly tests the ultimate bearing capacity, deformation, and strain of the test arch. In the experiment, a dial gauge was used to collect model deformation data. Two dial gauges were set up at seven 8-point sections to collect horizontal and vertical displacement data, and three dial gauges were set up on both sides of the arch seat to monitor whether deflection occurred. A single test arch was equipped with 20 dial indicators.
Moreover, strain gauges were used to collect strain data throughout the entire loading process. A single model was set up with nine strain test sections, including the 8-point section and the arch feet on both sides. Four measuring points were arranged on each strain test section at the top and bottom edges of the upper and lower chord tubes. Each measuring point was equipped with one strain gauge along the axial and circumferential directions of the steel pipe to test the axial and circumferential strains of the steel pipe. A single test arch was equipped with 72 strain gauges. The layout of model measurement points is shown in Fig. 5.
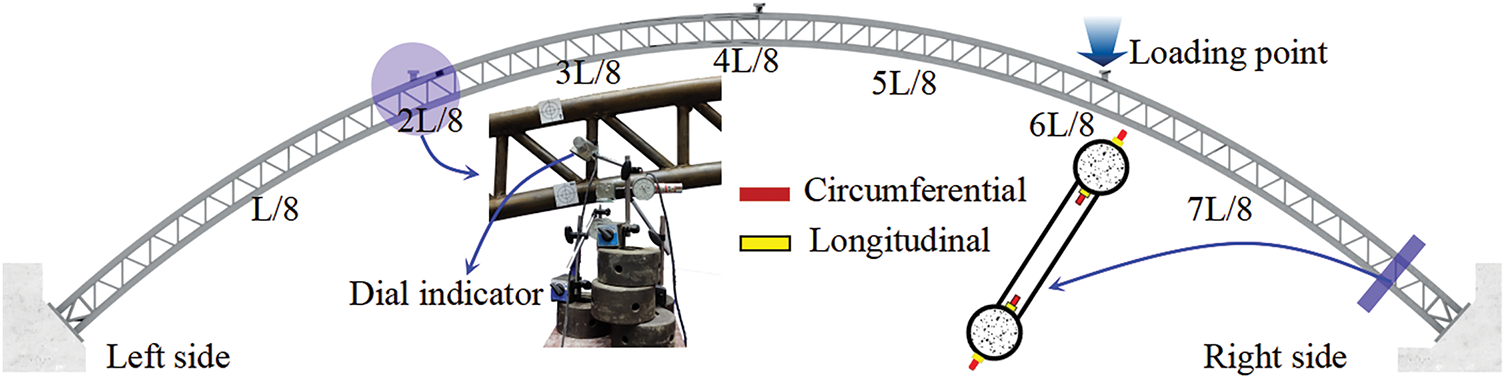
Figure 5: Layout of measuring points
Table 2 shows the horizontal, vertical, and lateral displacements of the arch supports on both sides of test arches A-1 and A-2 during failure, as well as the lateral displacement of the loading point. According to Table 2, the horizontal displacements of the test arches A-1 and A-2 are 0.68 and 0.51 mm, respectively. The vertical and horizontal displacements are less than 0.1 mm, which is close to the fixed boundary conditions of a fixed arch. During the loading process, the lateral displacement of the loading point of the test arch is less than 1 mm, and the failure of the model arch in this experiment belongs to the in-plane instability failure.
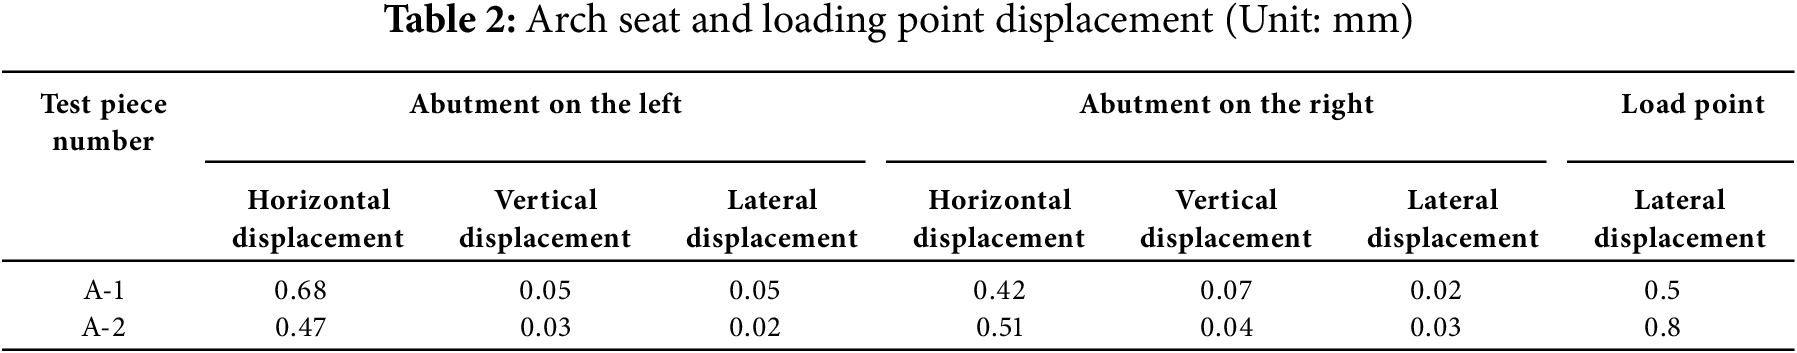
Fig. 6 shows a comparison of the failure modes of A-1 and A-2 during failure. As shown in Fig. 6, A-1 and A-2 exhibit an antisymmetric overall failure form, and the initial defects considered in this experiment do not cause a change in the overall structural failure form. Moreover, significant local buckling deformation occurred in the steel pipes of A-1 and A-2 at the loading point. After the steel pipes were cut open, no tensile cracks were found in the concrete inside the upper chord tube at the loading point, whereas multiple tensile cracks perpendicular to the arch axis direction appeared in the concrete inside the lower chord tube. When damaged, the upper chord at the loading point is under compression, and the lower chord is under tension. The loading point is in the form of a sizeable eccentric tension section failure. At this time, the loading point section is subjected to a significant bending moment.
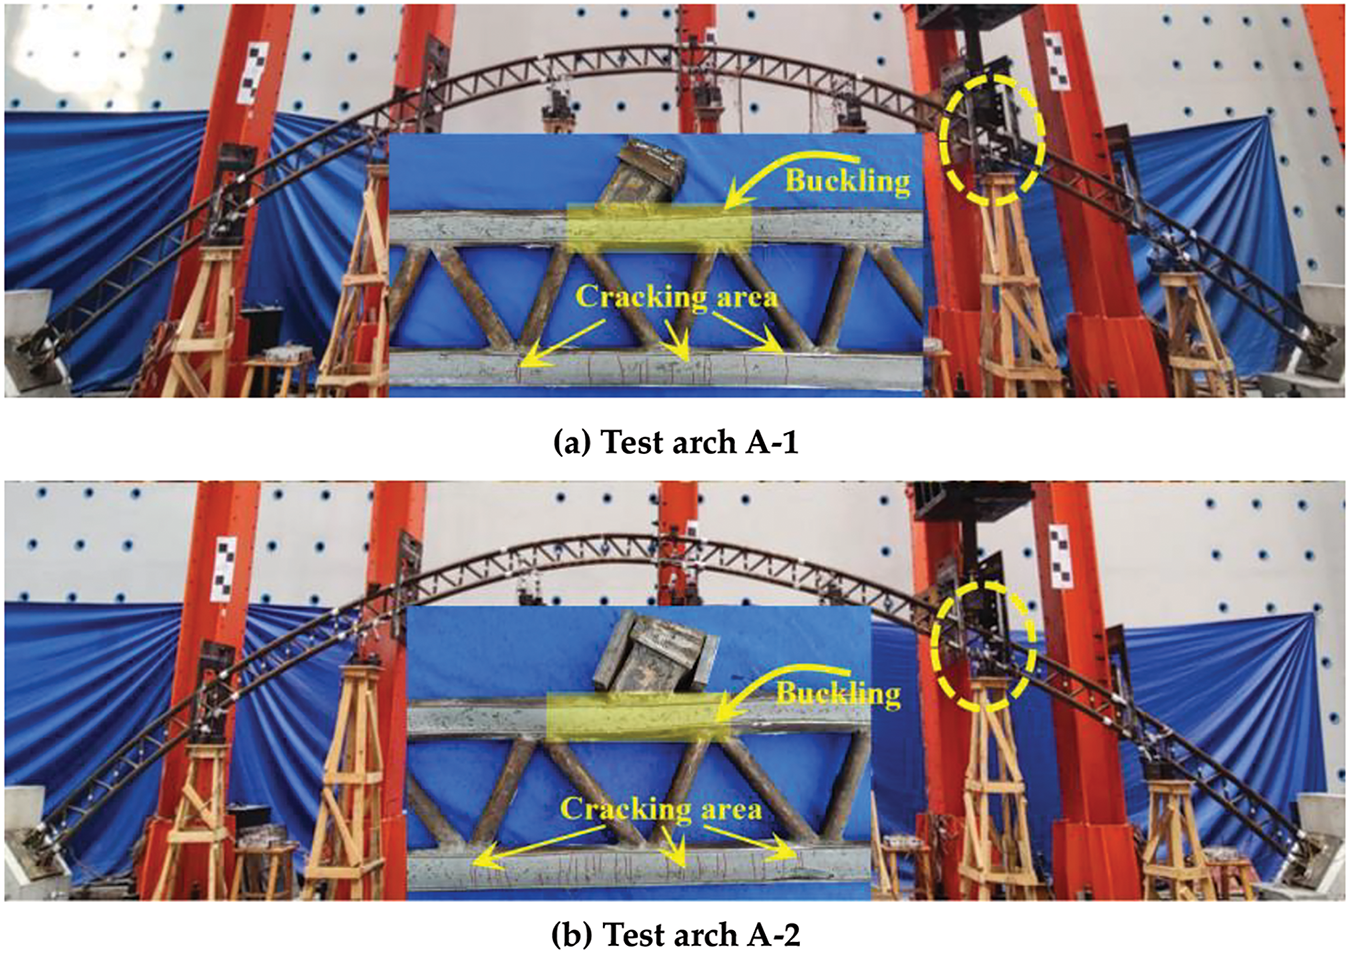
Figure 6: Comparison of the failure modes of experimental arches
Further comparison of the distribution of concrete cracks inside the lower chord tubes A-1 and A-2 reveals that A-2, which introduces initial defects, has a more extensive and denser range of tensile cracks than A-1. Therefore, the bending effect of A-2 is more pronounced than that of A-1.
3.2 Load–Vertical Displacement Curve
Fig. 7 shows the load vertical displacement curves at the 8-point position of the A-1 and A-2 arch ribs, where Pe, Ps, and Pu represent the elastic limit, elastic–plastic limit, and ultimate bearing capacity, respectively. As shown in Fig. 7, the failure process of the catenary arches A-1 and A-2 in this experiment is consistent and mainly divided into three stages: elastic, elastoplastic, and plastic; it is also similar to the parabolic arch of the steel tube concrete [20,21].
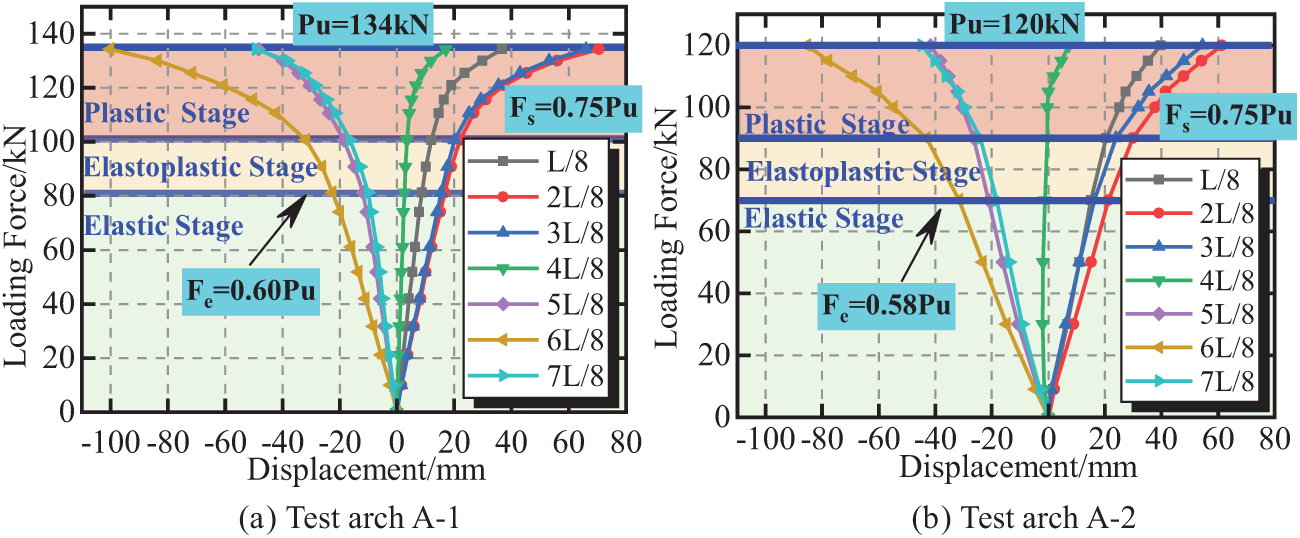
Figure 7: Load–vertical displacement curve at the 8-point position of the arch rib
At the initial stage of loading, the vertical displacement of each measuring point increases linearly with the increase in load. This phenomenon indicates that the chord tube is in the elastic stage during this process. At this point, the vertical displacement at the quarter points on both sides of the arch rib is close in magnitude and opposite in direction. When the load increases to 0.6 Pu, the test arch begins to enter the plastic stage, and the displacement shows a nonlinear variation characteristic with the increase in load. At this point, the vertical displacement of the loading point increases rapidly and is significantly greater than the symmetrical quarter-point position. When the load reaches 0.75 Pu, the vertical displacement of the entire arch continues to increase rapidly, and the nonlinear characteristics become increasingly pronounced until the test arch is crushed. When damaged, A-1 is loaded to 134 kN, and A-2 is loaded to 120 kN. The initial geometric defect reduces the ultimate bearing capacity of the model by 10.5%.
Fig. 8 shows the vertical displacement comparison at the 8-point position of the A-1 and A-2 arch ribs during the loading process. Fig. 8 also shows that A-1 and A-2 exhibit antisymmetric vertical displacement deformation. The maximum downward deflection is located at the loading point, and the maximum upward deflection is located at the symmetrical quarter point. The vertical displacement of the arch crown is close to zero. Under the same load, the vertical displacement of A-2 is greater than that of A-1. When the A-2 arch is damaged, its vertical displacement at the 3L/4 loading point under the load of 120 kN is 24.8 mm greater than the vertical displacement of A-1. This finding indicates an increase of 40.9%. The vertical displacement of A-2 at position L/4 is 19.0 mm greater than that of A-1, thereby indicating a rise of 53.6%.
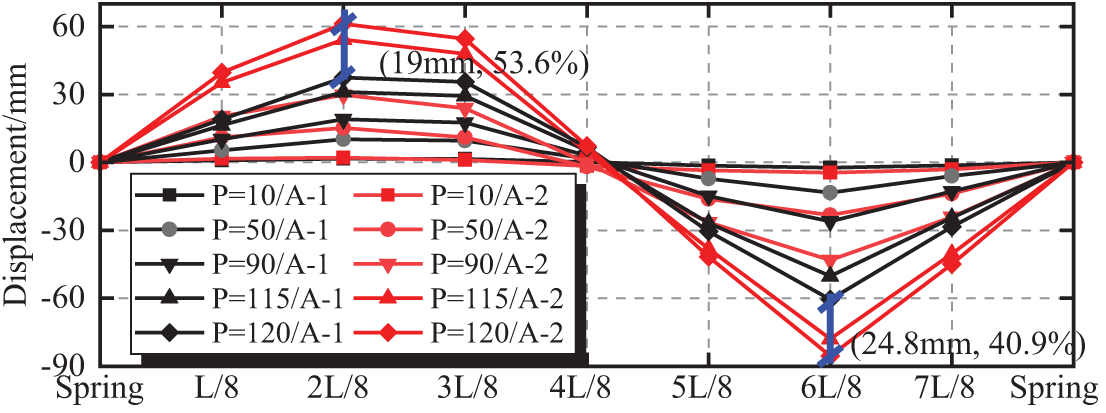
Figure 8: Comparison of the vertical displacement between A-1 and A-2
3.3 Load–Strain Distribution throughout the Entire Process
The top measuring point of the upper chord tube and the bottom measuring point of the lower chord tube in the model arch are farthest from the neutral axis of the section. As a result, their axial strain is the control strain of the section. Therefore, the axial strain of the two measuring points is analyzed. Fig. 9 shows the axial strain distribution curves of the steel pipes at the 8-point section of A-1 and A-2 arch ribs. Fig. 9a,b shows the strain distribution curves of the top and bottom measurement points of the upper chord tube at the 8-point section of the A-1 arch, respectively. Fig. 9c,d shows the strain distribution curves of the top and bottom measurement points of the upper chord tube at the 8-point section of the A-2 arch, respectively.
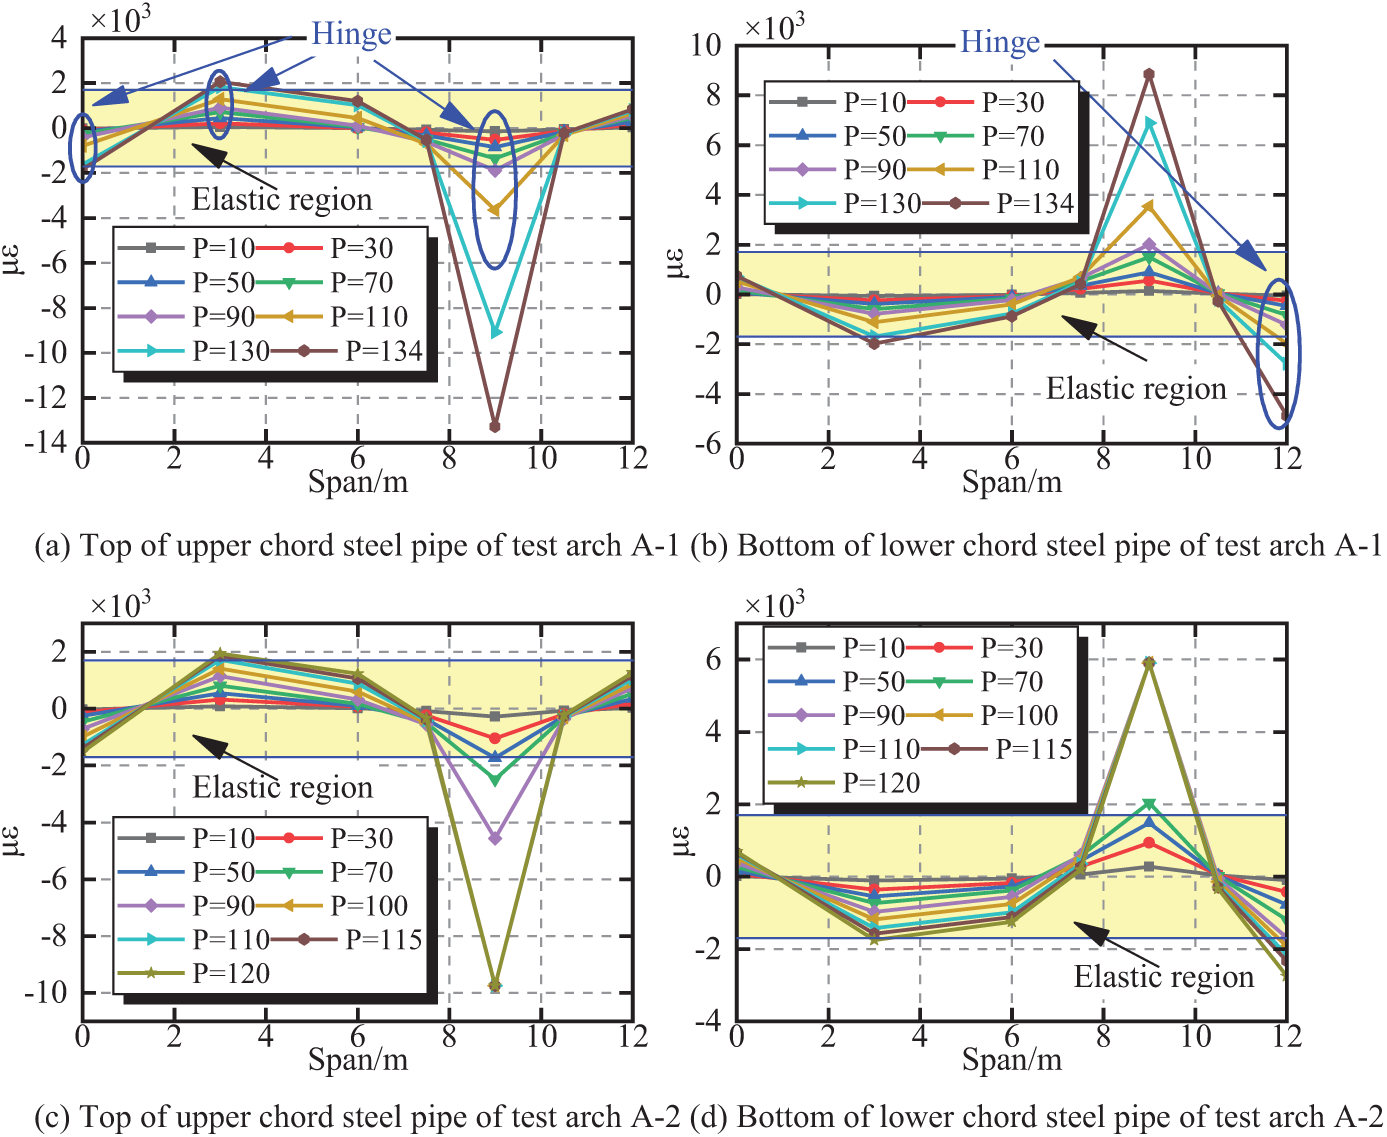
Figure 9: Strain distribution curves of the steel pipes at the 8-point section of A-1 and A-2 arch ribs
Fig. 9 shows that the strain distribution of the A-1 and A-2 test arches is consistent under the action of various levels of loads, with large strain values at the four positions of the arch feet on both sides and the 4-point section on both sides. Among them, the maximum tensile and compressive strains occur at the loading point section at 3L/4, and the strain growth rate at this measuring point is the fastest. The material test results show that the yield strain of model Q345 steel is 1.7 × 10³ με. A-1 and A-2 steel pipes yield when loaded to 90 and 50 kN, respectively. The initial geometric defect reduces the yield load of the model by 44.4%. After the local yielding of the steel pipe at the loading point, the subsequent application of load accelerates the growth rate of strain values at each measuring point step by step.
When the A-1 and A-2 arch ribs are loaded to the ultimate load, significant plastic strain occurs in the section of the loading point at 3L/4 and on the steel pipe at the side of the arch foot near the loading point. The steel pipe on the other side of the arch foot and the section at the 4-point section also reach the yield strain. The entire arch rib forms four plastic hinges at both sides of the arch feet and at quarter points on both sides. The structure becomes a mechanism system, thereby losing its bearing capacity. The hinge sequence of the arch ribs is as follows: 4-point loading section, near loading point arch foot, 4-point section on the other side, and arch foot on the other side.
3.4 Restraint of Steel Pipes on Concrete
The constraint effect of steel pipes on concrete expansion during loading can be analyzed by loading the axial strain and circumferential strain values of the compressed section. The circumferential strain and axial strain of the steel pipe during the initial loading stage should meet the following requirements:
In Eq. (1),
The variation curves of the circumferential strain
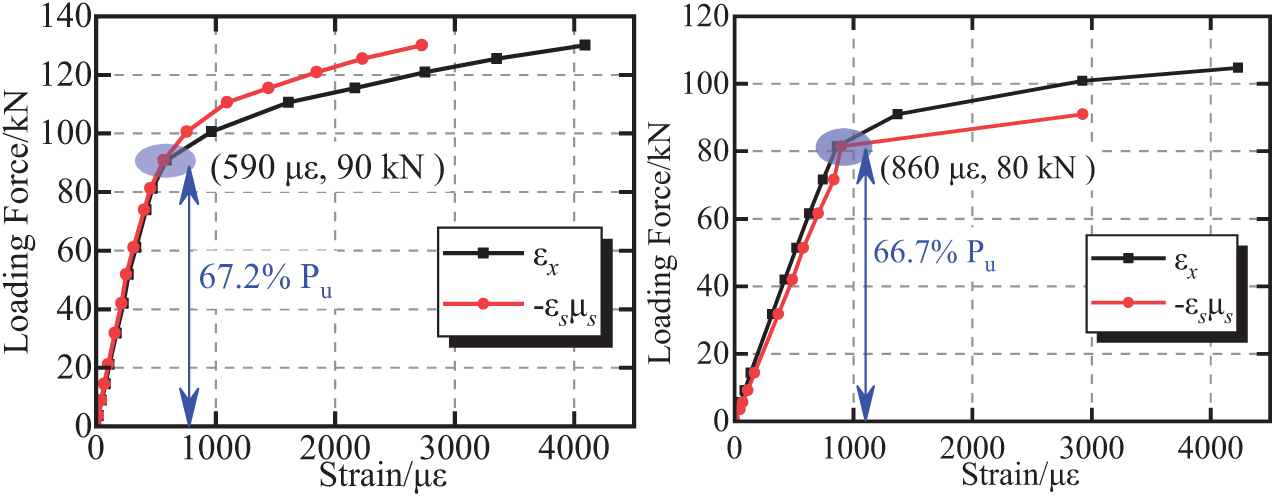
Figure 10: Loading point section upper chord steel pipe constraint effect of A-1 and A-2
Fig. 10 shows that the circumferential strains
A-1 and A-2 generate steel tube concrete confinement effects when loaded to 0.672 Pu and 0.667 Pu, respectively, with little difference in their proportions; their corresponding loading forces are 90 and 80 kN, respectively. Initial geometric defects can cause the concrete inside the pipe to enter the plastic state early and generate the confinement effect of steel pipe concrete in advance.
4 Influence of Initial Defects on Ultimate Bearing Capacity
4.1 Establishment and Verification of Simulation Models
This section establishes elastic–plastic simulation models for A-1 and A-2 arches. Moreover, the reliability of the simulation models is establishing by comparing the measured and calculated displacement values of the key sections during the loading and failure stages. Given the complex structure of the CFST arch bridge, which includes concrete inside the pipe, web members, and upper and lower chord steel pipes, directly dividing the grid results in poor grid quality. To this end, the concrete, web members, and upper and lower chord steel pipes inside the CFST arch bridge were decomposed and independently meshed in this study. Moreover, constraints were set between each component to ensure that they could work together. The simulation model was established using Abaqus, where the initial defects of the A-2 model were distributed according to the first-order antisymmetric vertical bending mode. The defect amplitude, which was 4.8 cm, was consistent with the experiment. The simulation model was evenly divided into 100 segments along the longitudinal bridge direction, as shown in Fig. 11.
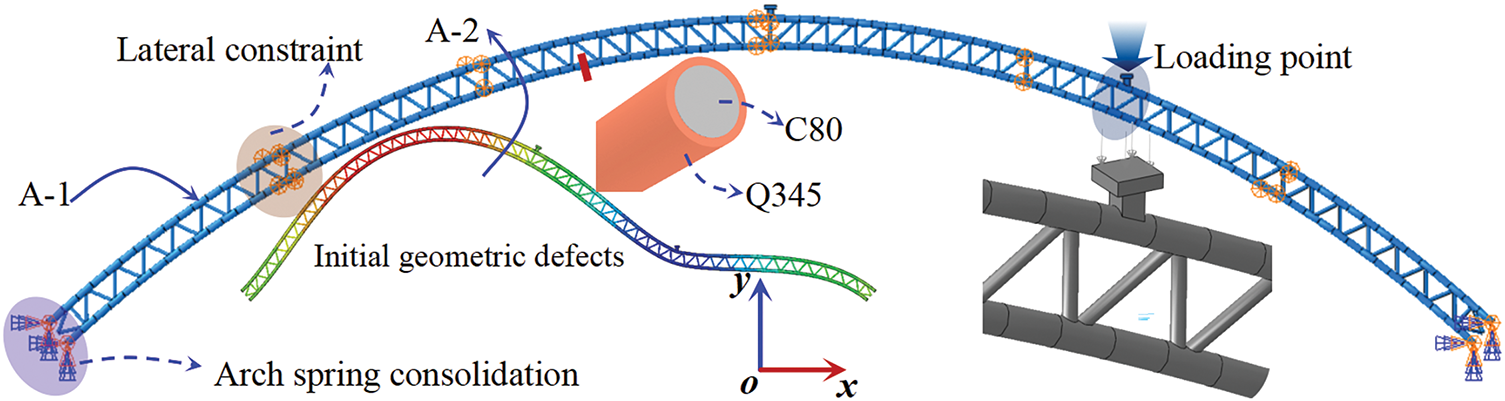
Figure 11: Simulation models
A total of 7924 plate elements were used by using S4R plate elements to simulate the main chord tube and web member. The thickness of the plate elements was the actual thickness of the steel plate, with a maximum size of 54 mm × 25 mm and a minimum size of 15 mm × 9 mm. A total of 2120 solid elements were used to simulate the concrete and loading blocks inside the pipe using C3D8R solid elements. The maximum size of the solid elements was 61 mm × 32.5 mm × 32.5 mm, and the minimum size was 54 mm × 32.5 mm × 32.5 mm. The adjacent nodes of the steel pipe plate element and the concrete solid element inside the pipe were coupled with degrees of freedom to ensure the coordinated force of the steel pipe and concrete. The analysis model set fixed boundary conditions on both sides of the arch feet. The boundary conditions in the transverse direction of the bridge were set at the five transverse limit points of the test arch to constrain the out-of-plane deformation of the arch and simulate the experiment accurately. The pressure at the top of the loading block was used to avoid the stress concentration effects at the loading point and ensure uniform structural stress by simulating the actual single-point loading of the jack. The calculation considered geometric and material nonlinearity, with material nonlinearity using the CDP model [29,30] and the steel ideal elastoplastic model, as shown in Fig. 12.
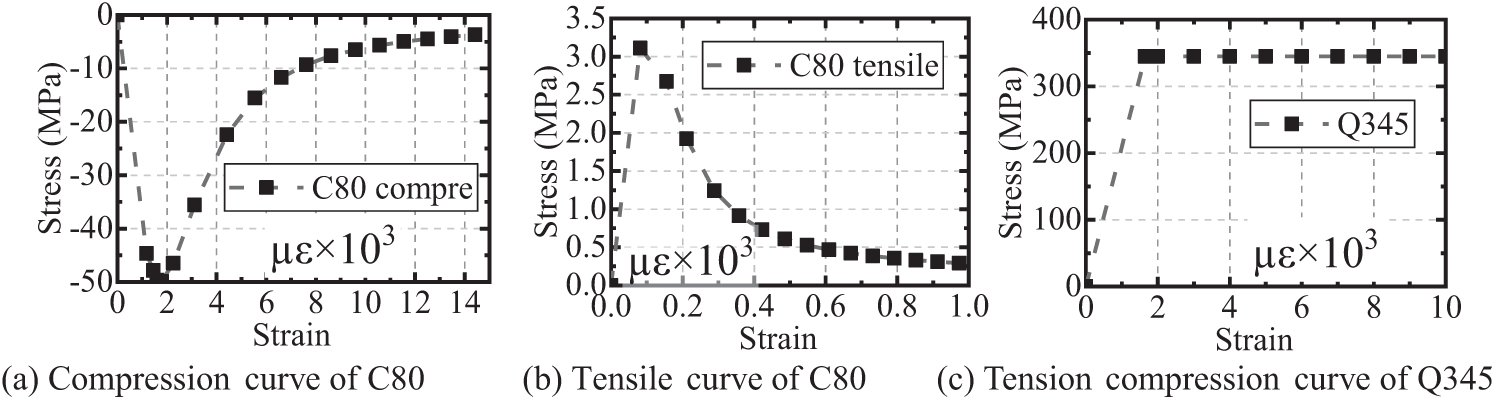
Figure 12: Constitutive curve of the model material
Fig. 13 shows the comparison between the measured and simulated load vertical displacement curves of the three key sections, L/4, L/2, and 3L/4. According to Fig. 13, the measured vertical displacement values of A-1 and A-2 are in good agreement with the simulation values. The calculated bearing capacity of the A-1 arch is 132.2 kN, whereas the measured value is 134 kN, which is 1.3% lower than the measured value. The calculated bearing capacity of the A-2 arch is 126.2 kN, whereas the measured value is 120 kN, which is 5.2% higher than the measured value. The error of the A-2 arch may be related to the difference in the initial defects between the experimental model and the simulation model.
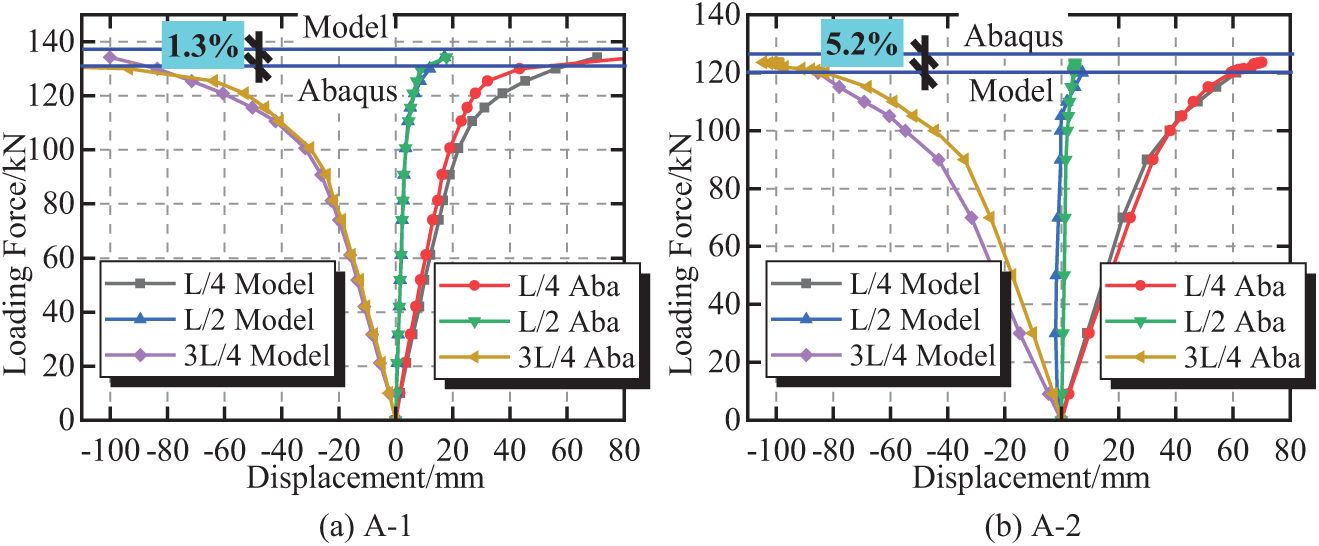
Figure 13: Comparison between measured and simulated vertical displacement values during L/4 loading
The above comparison results have verified the accuracy of the mesh division, boundary conditions, material properties, and initial defects in the finite element model. As shown in Fig. 14a, experimental research was conducted under single-point loading on the arch top, with specimen number A-3, to demonstrate the applicability of the finite element model further under different loads. The experimental test results were compared with the finite element model calculation results, as shown in Fig. 14b. According to Fig. 14b, the measured vertical displacement of A-3 is in good agreement with the simulation value. The calculated bearing capacity of the A-3 arch is 147.5 kN, whereas the measured value is 153.1 kN, which is 3.7% lower than the measured value. Overall, the finite element simulation method used in this article can effectively simulate the bearing capacity and deformation of CFST arches.
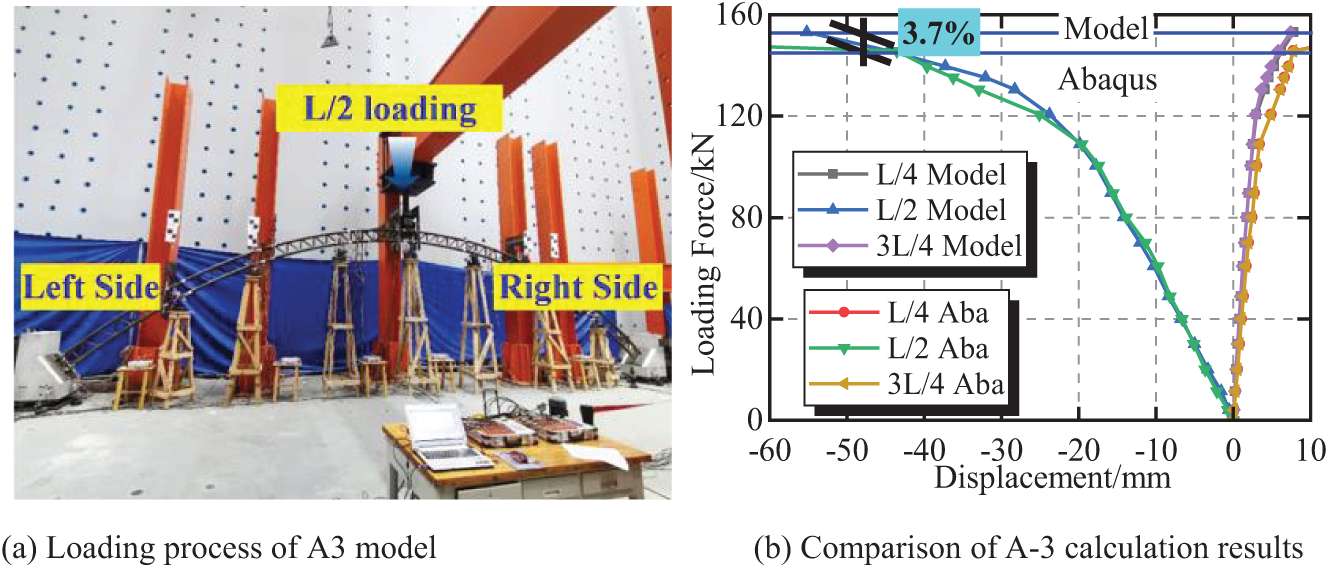
Figure 14: Comparison between the measured and simulated vertical displacement values during L/2 loading
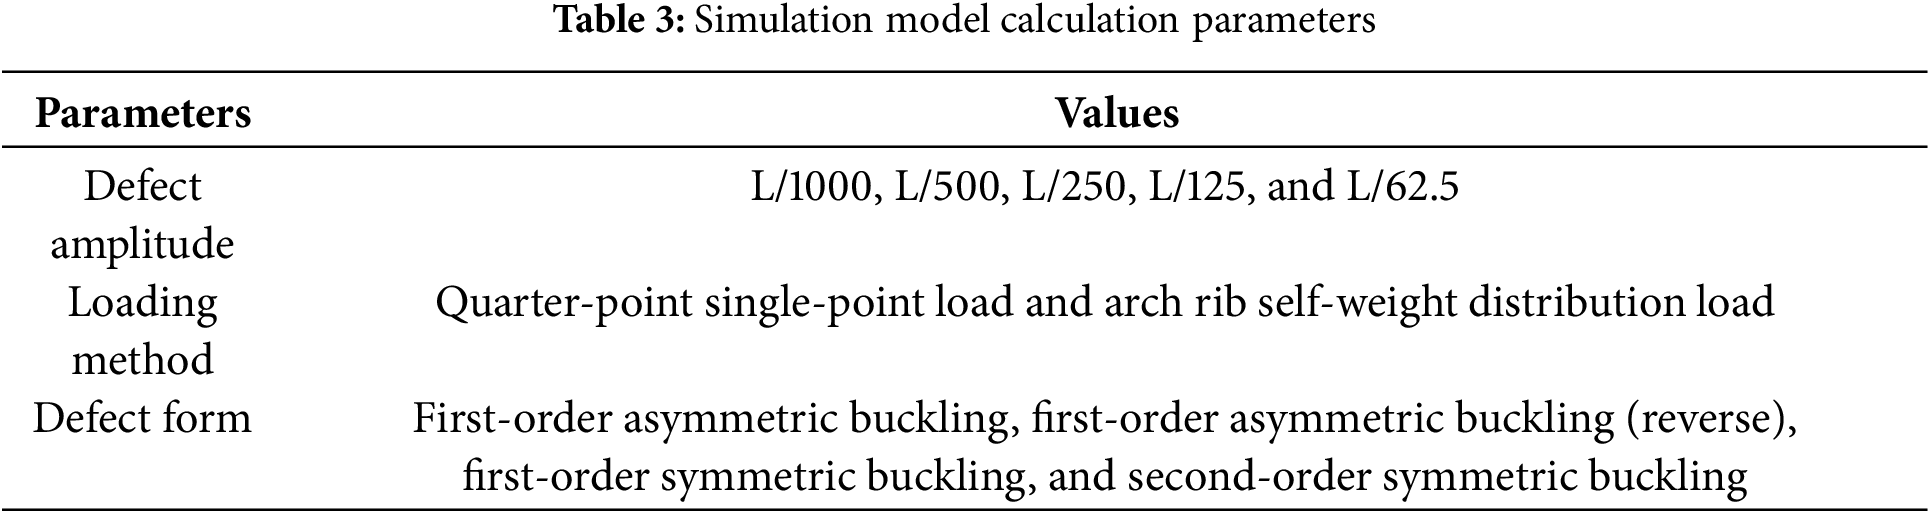
A validated finite element model was used for parameter analysis to explore further the influence of initial geometric defect parameters on the in-plane bearing capacity of CFST catenary truss arch bridges. Table 3 shows the finite element calculation parameters, including the loading method (quarter-point single-point load and arch rib self-weight distribution load), defect amplitude (L/1000 to L/62.5), and defect form (first-order antisymmetric buckling mode, first-order antisymmetric buckling mode [reverse], first-order symmetric buckling mode, and second-order symmetric buckling mode). The first-order antisymmetric buckling is the downward deflection at the loading point, whereas the first-order antisymmetric buckling (reverse) is the upward arching at the loading point. A total of 20 double nonlinear simulation operations were performed.
4.2 Influence of Defect Amplitude on Bearing Capacity
Model arch simulation calculations were performed with defect amplitudes of L/1000, L/500, L/250, L/125, and L/62.5 to explore the influence of the initial defect amplitude on the bearing capacity. The corresponding vertical coordinate differences at 3L/4 of the arch axis were 12, 24, 48, 96, and 192 mm. The loading method adopted quarter-point single-point loading, and the defect form adopted a first-order antisymmetric buckling form.
The calculation results show that the amplitude of the initial defect does not change the failure mode of the model arch. The calculation results of the failure mode of the model arch are shown in Fig. 15.
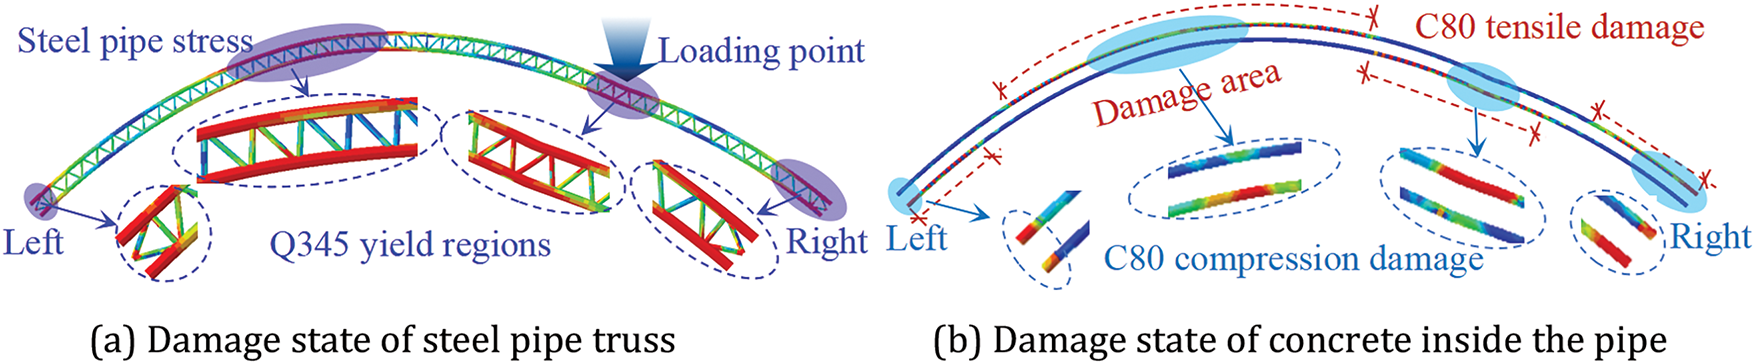
Figure 15: Calculation results of the model failure mode
Fig. 15 shows that when the model arch fails, the upper and lower chord steel pipes reach yield in four areas, including the arch feet on both sides and the quarter points on both sides. The stress on the web members near this area also shows a high-stress state. Moreover, the C80 concrete inside the pipe also suffers extensive damage. At 3L/4 and the left arch foot, the damage state of the concrete inside the tube is the same, with the upper chord tube experiencing compressive damage and the lower chord tube experiencing tensile damage. On the contrary, at L/4 and the right arch foot, the upper chord of the concrete inside the pipe is under tension, whereas the lower chord is under compression. Consistent with the experimental results, the entire arch rib forms four plastic hinges on both sides of the arch feet and at the 4-point positions on both sides during failure, thereby resulting in the loss of bearing capacity of the structure.
Fig. 16 shows the load–displacement curves for the defect amplitudes of L/1000, L/500, L/250, L/125, and L/62.5. For ease of comparison, the calculation results of the model without initial defects were plotted together.
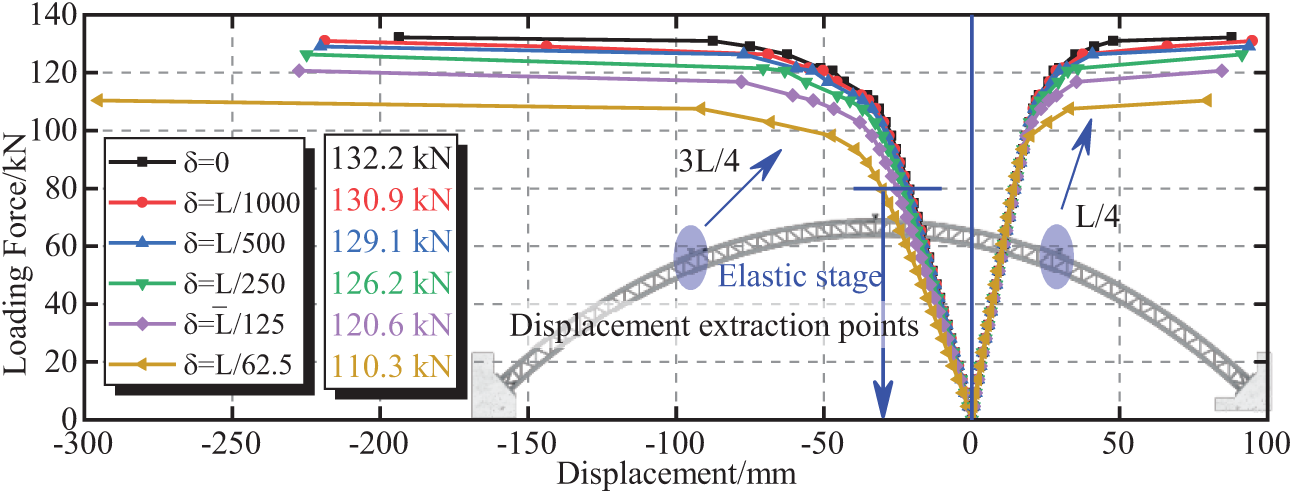
Figure 16: Load–vertical displacement curve under different defect amplitudes
As shown in Fig. 16, the increase in defect amplitude results in a gradual decrease in the calculated ultimate bearing capacity of the model arch. The calculated ultimate bearing capacity of the model arch without initial defects is 132.2 kN, and the calculated ultimate bearing capacities of the model arch with defect amplitudes of L/1000, L/500, L/250, L/125, and L/62.5 are 130.9, 129.1, 126.2, 120.6, and 110.3 kN, respectively, which are reduced by 1%, 2.4%, 4.5%, 8.8%, and 16.5% compared with the ultimate bearing capacity of the model arch without initial defects. The ultimate bearing capacity of the model is roughly linearly correlated with the amplitude of geometric defects.
As the defect amplitude increases, the slope of the elastic segment of the curve at 3L/4 decreases, whereas the slope of the elastic segment of the curve at L/4 remains unchanged. This finding indicates that as the defect amplitude increases, the stiffness at 3L/4 of the structure decreases, whereas the stiffness at L/4 remains unchanged. Therefore, initial geometric defects can affect the local stiffness of CFST arch bridges. The vertical deformation at 3L/4 of the model arch under different defect amplitudes is plotted in Fig. 17 to compare further the effect of defect amplitude on structural stress. Fig. 17a,b represents the elastic stage and the elastic–plastic stage, respectively.
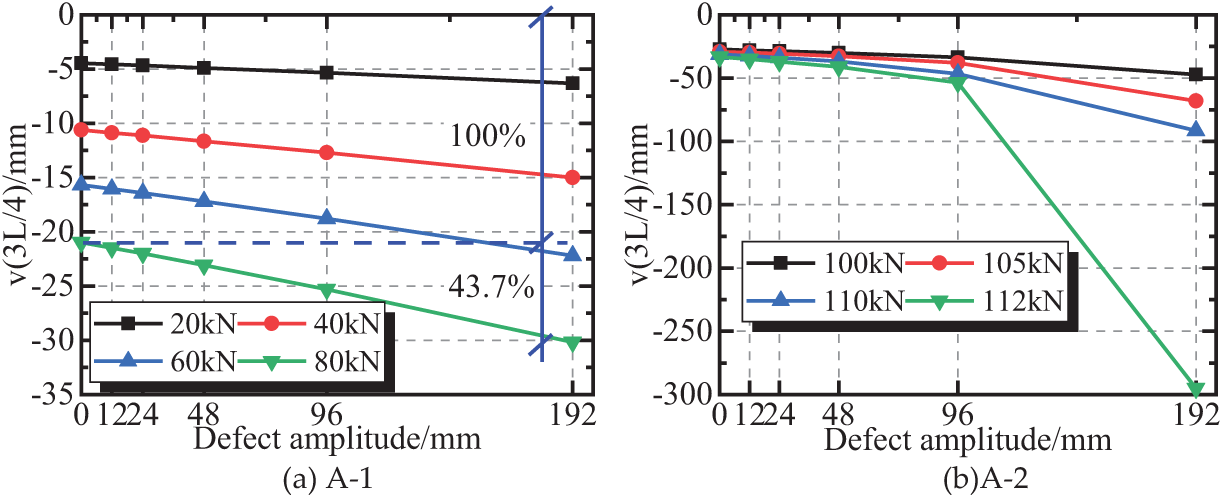
Figure 17: Vertical deformation at 3L/4 of the model arch under different defect amplitudes
Fig. 17a shows that during the elastic stress stage of the model arch, the vertical deformation at 3L/4 of the model arch is linearly correlated with the amplitude of the defect. When the loading force is 80 kN, the defect amplitude of 192 mm (L/62.5) increases the vertical deformation at 3L/4 of the arch by 43.7%. Fig. 17b shows that during the elastic–plastic stress stage of the model arch, the vertical deformation at 3L/4 of the model arch exhibits nonlinear growth when the defect amplitude increases.
4.3 Influence of Defect Form and Load Form on Bearing Capacity
Further analysis was conducted on the in-plane ultimate bearing capacity of CFST catenary truss arch bridges under different load forms and defect forms.
Fig. 18 shows the calculation results of the bearing capacity under the quarter-point loading condition, where the initial defects are the first-order antisymmetric buckling mode, first-order antisymmetric buckling mode (reverse), first-order symmetric buckling mode, and second-order symmetric buckling mode, with a defect amplitude of L/62.5.
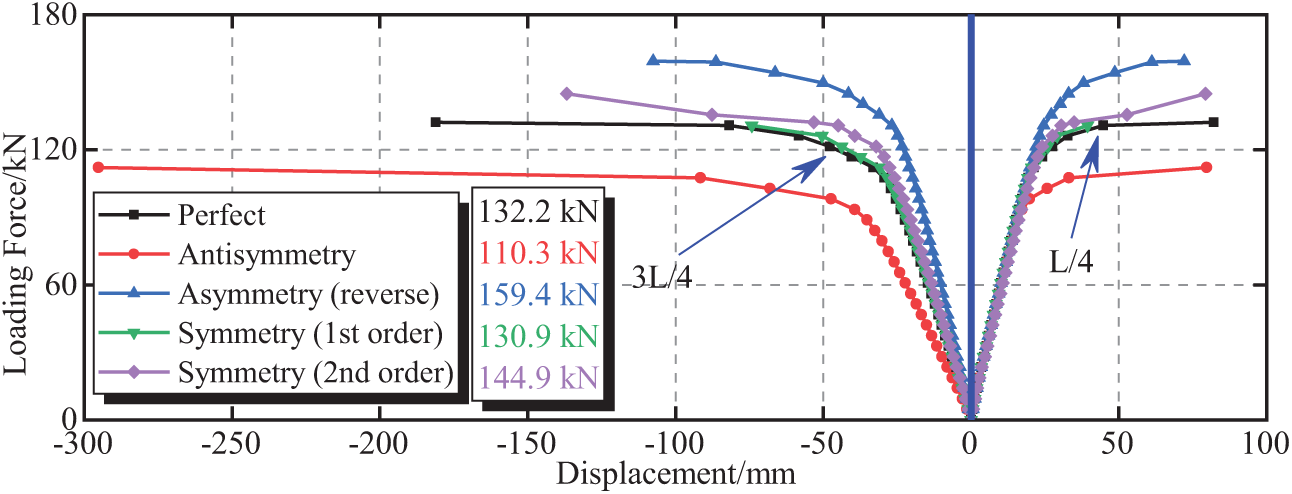
Figure 18: Load–vertical displacement curves under different defect forms
Fig. 18 shows that under the conditions of antisymmetric defect, antisymmetric defect (reverse), first-order symmetric defect, and second-order symmetric defect, the bearing capacities of the model under quarter-point loading conditions are 110.3, 159.4, 130.9, and 144.9 kN, respectively. Compared with the ultimate bearing capacity of the model arch without initial defects, that of the arch decreases by 16.5%, increases by 20.6%, decreases by 1%, and increases by 9.6%, respectively. The antisymmetric defect form has a great impact on the bearing capacity under quarter-point loading conditions, whereas the symmetric defect form has a small impact.
Fig. 19 shows the calculation results of the bearing capacity of the arch rib under the self-weight distribution load loading condition. The calculation and analysis were performed using the first-order antisymmetric buckling mode and the first-order normal symmetric buckling mode as defect forms, with the maximum amplitude of the defect being L/62.5.
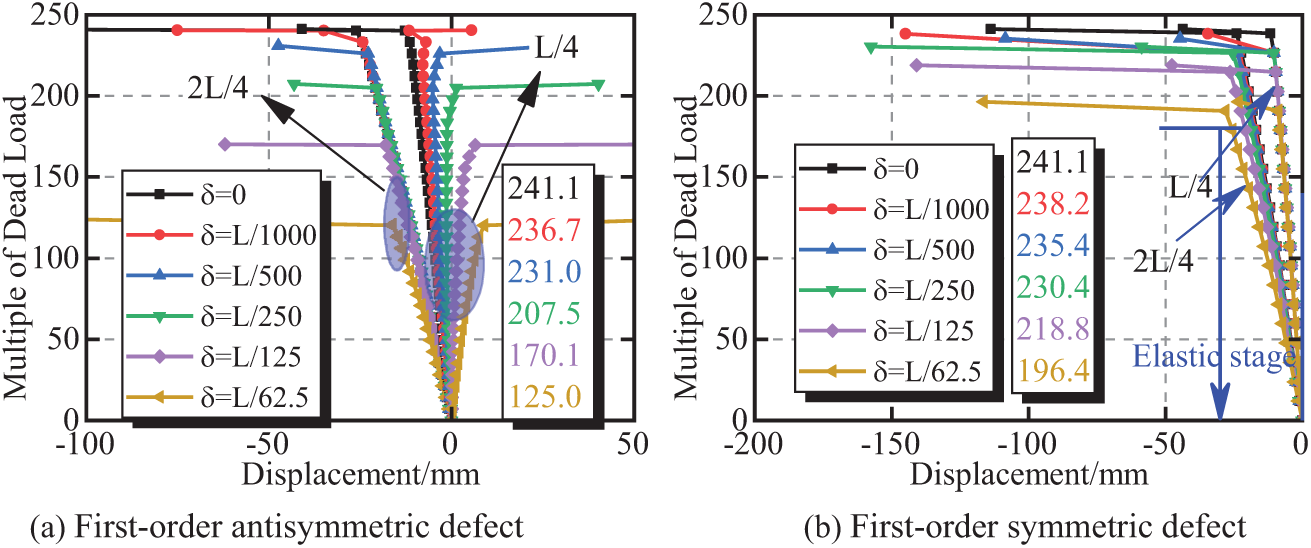
Figure 19: Vertical deformation at L/4 and 2L/4 of the model arch
As shown in Fig. 19a, the calculated ultimate bearing capacity of the model arch without initial defects is 241.1 times its weight. When the antisymmetric defect amplitude is L/62.5, the ultimate bearing capacity of the model arch decreases by 48.2%. Moreover, the antisymmetric defect has a huge effect on the calculated ultimate bearing capacity of the model arch under a self-weight load, and the ultimate bearing capacity of the model is roughly linearly correlated with the amplitude of geometric defects.
As shown in Fig. 19b, the increase in symmetric defect amplitude results in a gradual decrease in the calculated ultimate bearing capacity of the model arch. The calculated ultimate bearing capacity of the model arch decreases by 1.19%, 2.37%, 4.44%, 9.26%, and 18.53% when the defect amplitudes are L/1000, L/500, L/250, L/125, and L/62.5, respectively. The ultimate bearing capacity of the model is roughly linearly correlated with the geometric defect amplitudes.
5 Theoretical Analysis of the Arch-Bearing Capacity with Initial Defects
5.1 Deformation Equation of the Hingeless Arch with Initial Geometric Defects
The theoretical derivation is combined to analyze the effect of initial defects on the internal deformation of hingeless arches and demonstrate further the influence of initial geometric defects on the internal bearing capacity of hingeless arches. Fig. 20 shows the equilibrium relationship of arch microelements in a Cartesian coordinate system. If any microelement mn is selected on the arch axis, the horizontal displacement of point m is w, and the vertical displacement is v, then the horizontal displacement of point n is w + dw and the vertical displacement is v + dv. Moreover, the rotation angle of the arch axis is
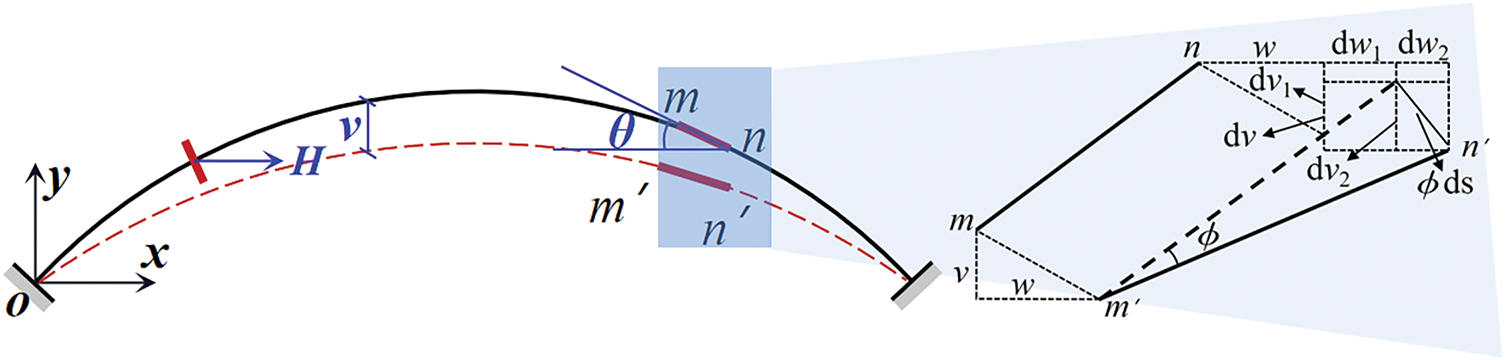
Figure 20: Equilibrium relationship of arch microelements in the Cartesian coordinate system
The equilibrium differential Eq. (4) of the arch can be obtained by combining Eqs. (2) and (3) and by combining the derivative relationship tan θ = y’. Given that the arch mainly bears bending moment and axial force and further ignores the influence of shear force on displacement, Eq. (4) can be simplified as Eq. (5). When the arch is subjected to concentrated or antisymmetric loads, the arch structure mainly bears bending moments, and the influence of axial forces can be ignored. Eq. (5) is further simplified to Eq. (6).
Fig. 21 shows an arch structure with initial defects, where y2 is the geometric initial defect and v is the structural deflection. Introducing the initial defect y2 into the equilibrium Eq. (6) yields Eq. (7). In Eq. (7), M(x) is the linear elastic bending moment of the structure under load, Hv is the second-order bending moment caused by the deformation of the arch structure, and Hy2 is the bending moment caused by the initial defect. Eq. (7) is derived twice to obtain Eq. (8).
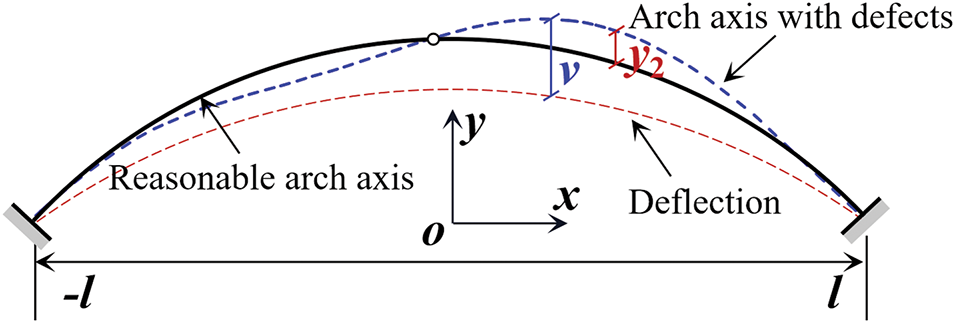
Figure 21: Arch with an initial geometric defect
Let
Eqs. (12) and (13) can be solved by further introducing the boundary condition
Furthermore, the buckling equation of the arch structure is introduced as an initial defect into the equilibrium equation, with the defect being assigned a value of C. Let
5.2 Theoretical Analysis of the Ultimate Bearing Capacity of the Hingeless Arch under Quarter-Point Concentrated Force
Theoretical derivation was used to analyze the in-plane ultimate bearing capacity of hingeless arches under the action of quarter-point concentrated force and demonstrate further the influence of initial geometric defects on the in-plane bearing capacity of hingeless arches. Fig. 22 shows the failure mode of a four-hinge arch without hinges under the action of concentrated force at the quarter point. In Fig. 22, the four plastic hinge positions of the arch under the L/4 single-point load are assumed to be two arch feet, L/4, and 3L/4. According to the principle of virtual work, the ultimate bearing capacity F of the arch can be calculated, as shown in Eq. (16).
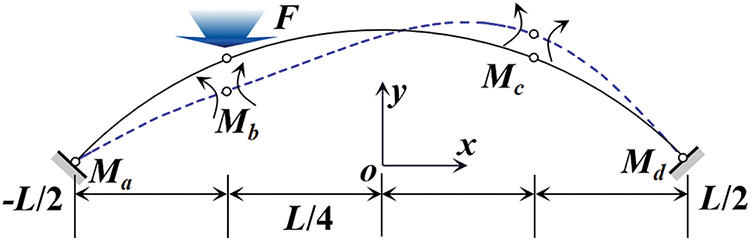
Figure 22: Four-hinge failure mode of the hingeless arch under the quarter-point concentrated force
Eq. (16) is the expression for the ultimate load of a hinged arch under the action of a concentrated force at the quarter point. In Eq. (16), Ma, Mb, Mc, and Md represent the ultimate bending moments of the cross-section at the four positions. Therefore, the ultimate load of the hingeless arch under the concentrated force of the quarter point is controlled by the bending moment resistance of each section. However, as shown in Eq. (16), the eccentricity of the section increases under the same load because of the amplification of structural deflection and bending moment by initial defects, thereby exacerbating the process of large eccentricity failure of the section and potentially weakening the bearing capacity.
This study takes a CFST arch bridge with a span of 380 m as the prototype. Moreover, model tests, simulation analyses, and theoretical derivation with a scale ratio of 1:31.7 were conducted, and the influence of different types of geometric defects on the ultimate bearing capacity of the CFST arch bridges was clarified. The main conclusions are as follows:
(1) When loaded at the quarter point until structural failure occurs, the CFST arch bridge model develops from a large eccentric tensile failure at the loading point section to a four-hinge integral failure mode on both sides of the arch feet and the four quarter points on both sides. The section near the loading point first forms a plastic hinge. Antisymmetric geometric defects do not change the overall failure mode but increase the local cracking area and crack density of the concrete inside the pipe.
(2) The sinusoidal geometric defect with an amplitude of L/250 results in a 44.4% decrease in yield load, a 10.5% decrease in bearing capacity of the CFST arch bridge model, and a 40.9% increase in maximum vertical deformation at failure.
(3) The steel tube concrete confinement effect of the catenary arch bridge appears at 0.67 times the ultimate load, which is earlier than that of the parabolic arch. Initial geometric defects can cause the concrete inside the pipe to enter the plastic state early and generate the steel pipe concrete confinement effect in advance.
(4) During the elastic stress stage of the CFST arch bridge model, the vertical deformation at 3L/4 of the model arch is linearly correlated with the amplitude of the defect. When the loading force is 80 kN, the defect amplitude of 192 mm (L/62.5) increases the vertical deformation at 3L/4 of the arch by 43.7%.
(5) The ultimate bearing capacity of CFST arch bridges is linearly related to the amplitude of geometric defects. Antisymmetric defects with the same amplitude have a greater impact on the in-plane bearing capacity of CFST arch bridges than the initial geometric defects of symmetry. Under the influence of antisymmetric defects with an amplitude of L/62.5, the ultimate bearing capacity of the model arch decreases by 16.5% under quarter-point loading and 48.2% under self-weight loading.
(6) The structural deformation caused by geometric initial defects increases linearly with the increase in defect amplitude. The bearing capacity is weakened because of the amplification of structural deflection and bending moment by initial defects.
Acknowledgement: This work was supported by the National Natural Science Foundation of China, the Science and Technology Project of Sichuan Provincial Transportation Department, and the Science and Technology Project of Guizhou Provincial Transportation Department.
Funding Statement: National Natural Science Foundation of China (Grant No. 52408314), Science and Technology Project of Sichuan Provincial Transportation Department (Grant No. 2023-ZL-03), and Science and Technology Project of Guizhou Provincial Transportation Department (Grant No. 2024-122-018).
Author Contributions: The authors confirm contribution to the paper as follows: Chao Luo: Test, Software, Validation, Writing—original draft, Writing—review & editing. Zhengsong Xiang: Validation, Formal analysis, Supervision, Funding acquisition. Yin Zhou: Funding acquisition, Formal analysis, Writing—review & editing. Dingsong Qin: Validation, Formal analysis, Visualization, Writing—review & editing. Tianlei Cheng: Test, Software, Validation. Qizhi Tang: Validation, Formal analysis, Visualization, Software. All authors reviewed the results and approved the final version of the manuscript.
Availability of Data and Materials: The data used to support the findings of this study are available from the corresponding author upon request.
Ethics Approval: Not applicable.
Conflicts of Interest: The authors declare no conflicts of interest to report regarding the present study.
References
1. Zheng J, Wang J. Concrete-filled steel tube arch bridges in China. Engineering. 2018;4(1):143–55. doi:10.1016/j.eng.2017.12.003. [Google Scholar] [CrossRef]
2. Joseph JR, Henderson JH. Concrete-filled steel tube truss girders—a state-of-the-art review. J Eng Appl Sci. 2023;70(1):49. doi:10.1186/s44147-023-00220-w. [Google Scholar] [CrossRef]
3. Han LH, Li W, Bjorhovde R. Developments and advanced applications of concrete-filled steel tubular (CFST) structures: members. J Constr Steel Res. 2014;100:211–28. doi:10.1016/j.jcsr.2014.04.016. [Google Scholar] [CrossRef]
4. Zheng J. Recent construction technology innovations and practices for large-span arch bridges in China. Engineering. 2024;41:110–29. doi:10.1016/j.eng.2024.05.019. [Google Scholar] [CrossRef]
5. Hu N, Dai GL, Yan B, Liu K. Recent development of design and construction of medium and long span high-speed railway bridges in China. Eng Struct. 2014;74:233–41. doi:10.1016/j.engstruct.2014.05.052. [Google Scholar] [CrossRef]
6. Chen BW, Han LH, Qin DY, Li W. Life-cycle based structural performance of long-span CFST hybrid arch bridge: a study on arch of Pingnan Third Bridge. J Constr Steel Res. 2023;207:107939. doi:10.1016/j.jcsr.2023.107939. [Google Scholar] [CrossRef]
7. Tomás A, Tovar JP. The influence of initial geometric imperfections on the buckling load of single and double curvature concrete shells. Comput Struct. 2012;96:34–45. doi:10.1016/j.compstruc.2012.01.007. [Google Scholar] [CrossRef]
8. Farbák M, Chromčák J, Bačová D, Odrobiňák J. Investigation of actual in-plane geometric imperfections of steel tied-arch bridges. Appl Sci. 2023;13(11):6393. doi:10.3390/app13116393. [Google Scholar] [CrossRef]
9. Odrobiňák J, Farbák M, Chromčák J, Kortiš J, Gocál J. Real geometrical imperfection of bow-string arches—measurement and global analysis. Appl Sci. 2020;10(13):4530. doi:10.3390/app10134530. [Google Scholar] [CrossRef]
10. Sánchez-Rodríguez A, Riveiro B, Conde B, Soilán M. Detection of structural faults in piers of masonry arch bridges through automated processing of laser scanning data. Struct Control Health Monit. 2018;25(3):e2126. doi:10.1002/stc.2126. [Google Scholar] [CrossRef]
11. De Backer H, Outtier A, Van Bogaert P. Determining geometric out-of-plane imperfections in steel tied-arch bridges using strain measurements. J Perform Constr Facil. 2014;28(3):549–58. doi:10.1061/(ASCE)CF.1943-5509.0000445. [Google Scholar] [CrossRef]
12. Viola E, Tornabene F. Vibration analysis of damaged circular arches with varying cross-section. Struct Durab Health Monit. 2005;1(2):155–70. [Google Scholar]
13. Wang J, Guo J. Analysis of influence factors and stability of concrete-filled steel tube arch bridge. IOP Conf Ser: Mater Sci Eng. 2020;768(3):032053. doi:10.1088/1757-899X/768/3/032053. [Google Scholar] [CrossRef]
14. Yang L, Xie W, Zhao Y, Zheng J. Linear elastic iteration technique for ultimate bearing capacity of circular CFST arches. J Constr Steel Res. 2020;172:106135. doi:10.1016/j.jcsr.2020.106135. [Google Scholar] [CrossRef]
15. Han X, Fernando D, Han B. Numerical modelling of the in-plane behaviour of concrete-filled circular steel tubular arches. Constr Build Mater. 2020;264:120693. doi:10.1016/j.conbuildmat.2020.120693. [Google Scholar] [CrossRef]
16. Song X, Yue Z, Zheng E, Zhou J, Xu Y, Kong X, et al. Numerical simulation on the load-bearing capacity of CFRP-strengthened concrete arches. Case Stud Constr Mater. 2024;20:e03137. doi:10.1016/j.cscm.2024.e03137. [Google Scholar] [CrossRef]
17. Pi YL, Liu C, Bradford MA, Zhang S. In-plane strength of concrete-filled steel tubular circular arches. J Constr Steel Res. 2012;69(1):77–94. doi:10.1016/j.jcsr.2011.08.008. [Google Scholar] [CrossRef]
18. Wei C, Liu C, Hu Q, Wang D, Wang Y. In-plane behaviors of FRP confined concrete-filled steel tubular arches under mid-span concentrated loads. Structures. 2024;68:107151. doi:10.1016/j.istruc.2024.107151. [Google Scholar] [CrossRef]
19. Guo C, Lu Z. Air void and cap gap composite defects of concrete-filled steel-tube arch bridge transverse brace. J Perform Constr Facil. 2020;34(4):04020073. doi:10.1061/(ASCE)CF.1943-5509.0001479. [Google Scholar] [CrossRef]
20. Liu C, Wang Y, Wu X, Zhang S. In-plane stability of fixed concrete-filled steel tubular parabolic arches under combined bending and compression. J Bridge Eng. 2017;22(2):04016116. doi:10.1061/(ASCE)BE.1943-5592.0000993. [Google Scholar] [CrossRef]
21. Hu Q, Liu C, Yuan C, Wang Y, Zhang S. Experimental investigation into in-plane stability of concrete-filled steel tubular parabolic arches under five-point concentrated loads. Int J Steel Struct. 2020;20:2038–50. doi:10.1007/s13296-020-00429-y. [Google Scholar] [CrossRef]
22. Liu Q, Nie S, Ding S, Zheng G. Design of main bridge of Shuangbao bridge of second Chongqing-Hunan railway in Chongqing. Bridge Const. 2023;53(283):16–24. doi:10.20051/j.issn.1003-4722.2023.S1.003. [Google Scholar] [CrossRef]
23. Ransom VH, Wang W, Ishii M. Use of an ideal scaled model for scaling evaluation. Nuclear Eng Design. 1998;186(1–2):135–48. doi:10.1016/S0029-5493(98)00220-9. [Google Scholar] [CrossRef]
24. Gusella F, Orlando M. Analysis of the dissipative behavior of steel beams for braces in three-point bending. Eng Struct. 2021;244:112717. doi:10.1016/j.engstruct.2021.112717. [Google Scholar] [CrossRef]
25. Luo C, Zhou J, Xin J, Fan Y, Zhou Y, Tang Q, et al. Large-scale model test on the construction process of a stiff skeleton arch bridge with the span of 600 m. Case Stud Constr Mater. 2024;21:e03783. doi:10.1016/j.cscm.2024.e03783. [Google Scholar] [CrossRef]
26. Shayan S, Rasmussen KJR, Zhang H. On the modelling of initial geometric imperfections of steel frames in advanced analysis. J Constr Steel Res. 2014;98:167–77. doi:10.1016/j.jcsr.2014.02.016. [Google Scholar] [CrossRef]
27. Chan TM, Huai YM, Wang W. Experimental investigation on lightweight concrete-filled cold-formed elliptical hollow section stub columns. J Constr Steel Res. 2015;115:434–44. doi:10.1016/j.jcsr.2015.08.029. [Google Scholar] [CrossRef]
28. Teng JG, Lin X, Michael Rotter J, Ding XL. Analysis of geometric imperfections in full-scale welded steel silos. Eng Struct. 2005;27(6):938–50. doi:10.1016/j.engstruct.2005.01.013. [Google Scholar] [CrossRef]
29. Jason L, Huerta A, Pijaudier-Cabot G, Ghavamian S. An elastic plastic damage formulation for concrete: application to elementary tests and comparison with an isotropic damage model. Comput Methods Appl Mech Eng. 2006;195(52):7077–92. doi:10.1016/j.cma.2005.04.017. [Google Scholar] [CrossRef]
30. Le Minh H, Khatir S, Abdel Wahab M, Cuong-Le T. A concrete damage plasticity model for predicting the effects of compressive high-strength concrete under static and dynamic loads. J Build Eng. 2021;44:103239. doi:10.1016/j.jobe.2021.103239. [Google Scholar] [CrossRef]
Cite This Article
 Copyright © 2025 The Author(s). Published by Tech Science Press.
This work is licensed under a Creative Commons Attribution 4.0 International License , which permits unrestricted use, distribution, and reproduction in any medium, provided the original work is properly cited.
 Downloads
 Citation Tools