
 Submit a Paper
 Propose a Special lssue
 Open Access
ARTICLE

Simulation of Restraint Device Degradation of Long-Span Suspension Bridge Based on Finite Element Model
1 Nanjing Public Engineering Construction Center, Nanjing, 210019, China
2 School of Transportation, Southeast University, Nanjing, 210096, China
* Corresponding Author: Yuan Ren. Email:
(This article belongs to the Special Issue: Advanced Data Mining in Bridge Structural Health Monitoring)
Structural Durability & Health Monitoring 2025, 19(4), 851-868. https://doi.org/10.32604/sdhm.2025.060906
Received 12 December 2024; Accepted 03 January 2025; Issue published 30 June 2025
 View Full Text
 Download PDF
Abstract
The girder end restraint devices such as bearings and dampers on long span suspension bridge will deteriorate over time. However, it is difficult to achieve the quantitative assessment of the performance of the restraint device through existing detection methods in actual inspections, making it difficult to obtain the impact of changes in the performance of the restraint device on the bridge structure. In this paper, a random vehicle load model is firstly established based on the WIM data of Jiangyin Bridge, and the displacement of girder end under the actual traffic flow is simulated by using finite element dynamic time history analysis. On this basis, according to the performance test data of the bearings and dampers, the performance degradation laws of the above two restraint devices are summarized, and the performance degradation process of the two restraint devices and the effects of different restraint parameters on the bridge structure are simulated. The results show that the performance degradation of the damper will significantly reduce the damping force at low speed, resulting in a significant increase in the cumulative displacement of the girder end; in the presence of longitudinal dampers, the increase in the friction coefficient caused by the deterioration of the bearing sliding plate has little effect on the cumulative displacement, but excessive wear of the bearing sliding plate adversely affects the structural dynamic performance.Keywords
Bridges are critical infrastructure in the transport system. As the global bridge network continues to expand rapidly, the operation, maintenance, and safety management of these bridges have become more challenging. Increasing traffic loads, structural degradation due to bridge ageing, and frequent natural disasters highlight the urgent need for efficient performance assessment and response prediction of bridge structures. Many in-service bridges are experiencing performance degradation or even structural deficiencies, highlighting the importance of timely structural assessment to detect potential damage and plan for necessary repairs or modifications. Therefore, performance assessment of in-service bridge structures has become a prominent topic in academia and industry.
Suspension bridges are affected by their structural form, vehicle loads, and the use of the environment, the disease problems of the restraint devices (bearings, dampers and expansion joints, etc.) at the end of the bridge are very prominent. The restraint device is an important component connecting the upper and lower structures of the bridge, and its normal operation plays an important role in maintaining the stability of the boundary constraint conditions and dynamic characteristics of the bridge and avoiding the unfavorable local stress at the end of the stiffening beams [1]. However, it is difficult to realize the quantitative evaluation of the performance of the restraint device by relying on the existing inspection methods in the actual inspection, and some researchers choose to evaluate the performance of the restraint device through the bridge health monitoring data [2]. The girder end displacement is an important parameter reflecting the performance of restraint devices. Existing studies have confirmed the direct correlation between girder end displacement and restraint performance [3,4], and some have achieved favorable results by using girder end displacement monitoring data for restraint devices anomaly detection [5,6].
Large-span suspension bridges experience continuous longitudinal displacements of stiffened girders during daily operation, resulting in large cumulative displacements, which often cause premature failure of the girder end displacement restraints [7,8]. Temperature loads, vehicle loads and wind loads are all major factors that cause longitudinal displacements of girder ends in suspension bridges, with the large cumulative displacements generated by vehicle loads being an important cause of premature failure of the restraint devices [9–12]. The girder end displacements caused by vehicle loads can be calculated individually by finite element analysis and simulating the traffic flow in the operation stage, and the life of the restraint device can be evaluated accordingly [13]. Further, by studying the performance deterioration pattern of restraint devices, it can provide support for their maintenance and replacement decisions [14].
The girder end displacements caused by vehicle loads can be calculated by finite element analysis (FEM) and simulating the traffic flow in the operation stage, and the life of the restraint device can be evaluated accordingly. Recent advancements in FEM have allowed more accurate modeling of bridge behavior under various dynamic loads, including random traffic flows [15–17]. For instance, studies have incorporated random vehicle load models to better represent real-world traffic conditions and account for the stochastic nature of vehicle speeds, weights, and distribution [18–20]. Additionally, the use of raw vehicle accelerations for bridge health monitoring has provided valuable insights into real-time dynamic load simulations, enhancing the accuracy of stress and displacement predictions [21]. This has led to more realistic simulations of longitudinal displacements and the evaluation of restraint device performance under such variable conditions. Furthermore, the degradation of restraint devices, such as bearings and dampers, under dynamic traffic loads has been a subject of increasing focus, with research indicating that these devices’ performance declines over time, leading to significant impacts on bridge stability [22–24]. The use of advanced monitoring techniques and performance tests based on FEM simulations has facilitated a better understanding of how restraint devices can be optimized and maintained to prevent early failure.
Nevertheless, most of the previous studies only stayed at the stage of data analysis and finite element simulation, which lacked the support of real test results. Furthermore, there is a lack of further investigation on the actual performance of the restraint device and the girder end displacement, which hinders the ability to ascertain the impact of the change in restraint device performance on the bridge structure. This paper takes Jiangyin Bridge as the engineering background bridge, and firstly combines the random vehicle load model and finite element model of the bridge to propose a dynamic analysis method to simulate the girder end displacement response during the operation stage. Then, the effectiveness of the proposed method is verified by comparing monitoring data. On this basis, the performance degradation process of the bearings and dampers are simulated according to the performance test data. The influence of different restrain device parameters on the bridge structure is also investigated. Finally, the degradation law of the dampers and bearings in service is analyzed to put forward the corresponding maintenance suggestions.
This study, in comparison with previous research, provides validation for the use of the dynamic analysis method in conjunction with actual monitoring data. By integrating the random vehicle load model, finite element analysis, and real-world degradation data of bearings and dampers, a comprehensive framework for understanding the long-term performance of restraint devices in suspension bridges is provided. By examining the influence of various restraint device parameters, this study provides a comprehensive understanding of the role these devices play in affecting the overall structural performance of the bridge, thus facilitating informed decisions regarding the maintenance or replacement of these critical components.
2 Introduction of Jiangyin Bridge
Since the opening of the Jiangyin Bridge in September 1999, the traffic flow has been increasing day by day, and by the end of 2008, the cumulative traffic flow over the bridge exceeded 100 million vehicles, by the end of 2013, the cumulative traffic flow over the bridge reached 200 million vehicles, and by the end of October 2017, the cumulative traffic flow over the bridge exceeded 300 million vehicles. The average daily traffic volume across the bridge grew from 14,000 vehicles at the beginning of the opening to 95,300 vehicles in the first half of 2019, and will remain on a growing trend for some time in the future. The over-saturated traffic flow has brought great pressure to the bridge operation and management, accelerated the accumulation of damage to bridge components such as bridge deck pavement, steel box girders, slings and bearings, viscous dampers, expansion joints, etc. of the Jiangyin Bridge, and the traffic of large flow and heavy load has brought great pressure to the management of the Jiangyin Bridge. The current situation has brought serious challenges to the management and maintenance of Jiangyin Bridge. An overview of the Jiangyin Bridge is shown in Fig. 1.
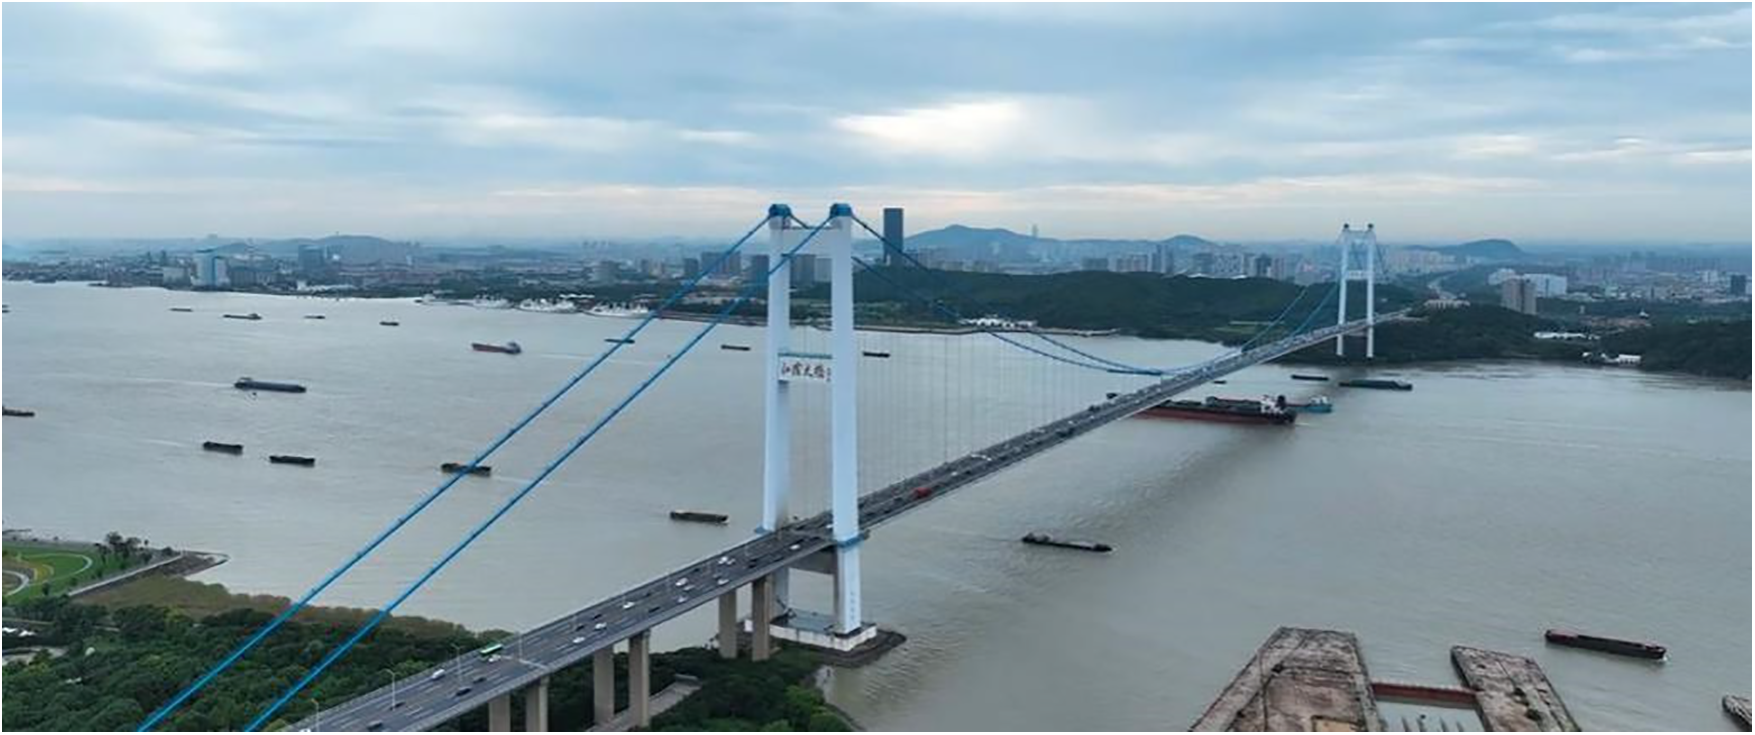
Figure 1: Overview of Jiangyin Yangtze river
Based on the 2022 inspection, it was observed that the poly tetra fluoroethylene (PTFE) plates of the bridge bearings were severely worn out and some rubber bearings of the expansion joint cracked, resulting in reduced wear performance and increased friction. These damages affected the free longitudinal movement of the girder end.
Restraining devices are crucial for ensuring the safety, reliability, and durability of cable-supported bridge systems. Therefore, it is necessary to analyse the control effect of different constraint conditions on girder end displacement under different circumstances, so as to provide reference for the decision-making of relevant maintenance units.
In this paper, a finite element simulation of girder end data is used for analysis in comparison with the measured girder end data. The girder end displacement is recorded by pull on the rope displacement sensor, the arrangement of which is illustrated in Fig. 2.
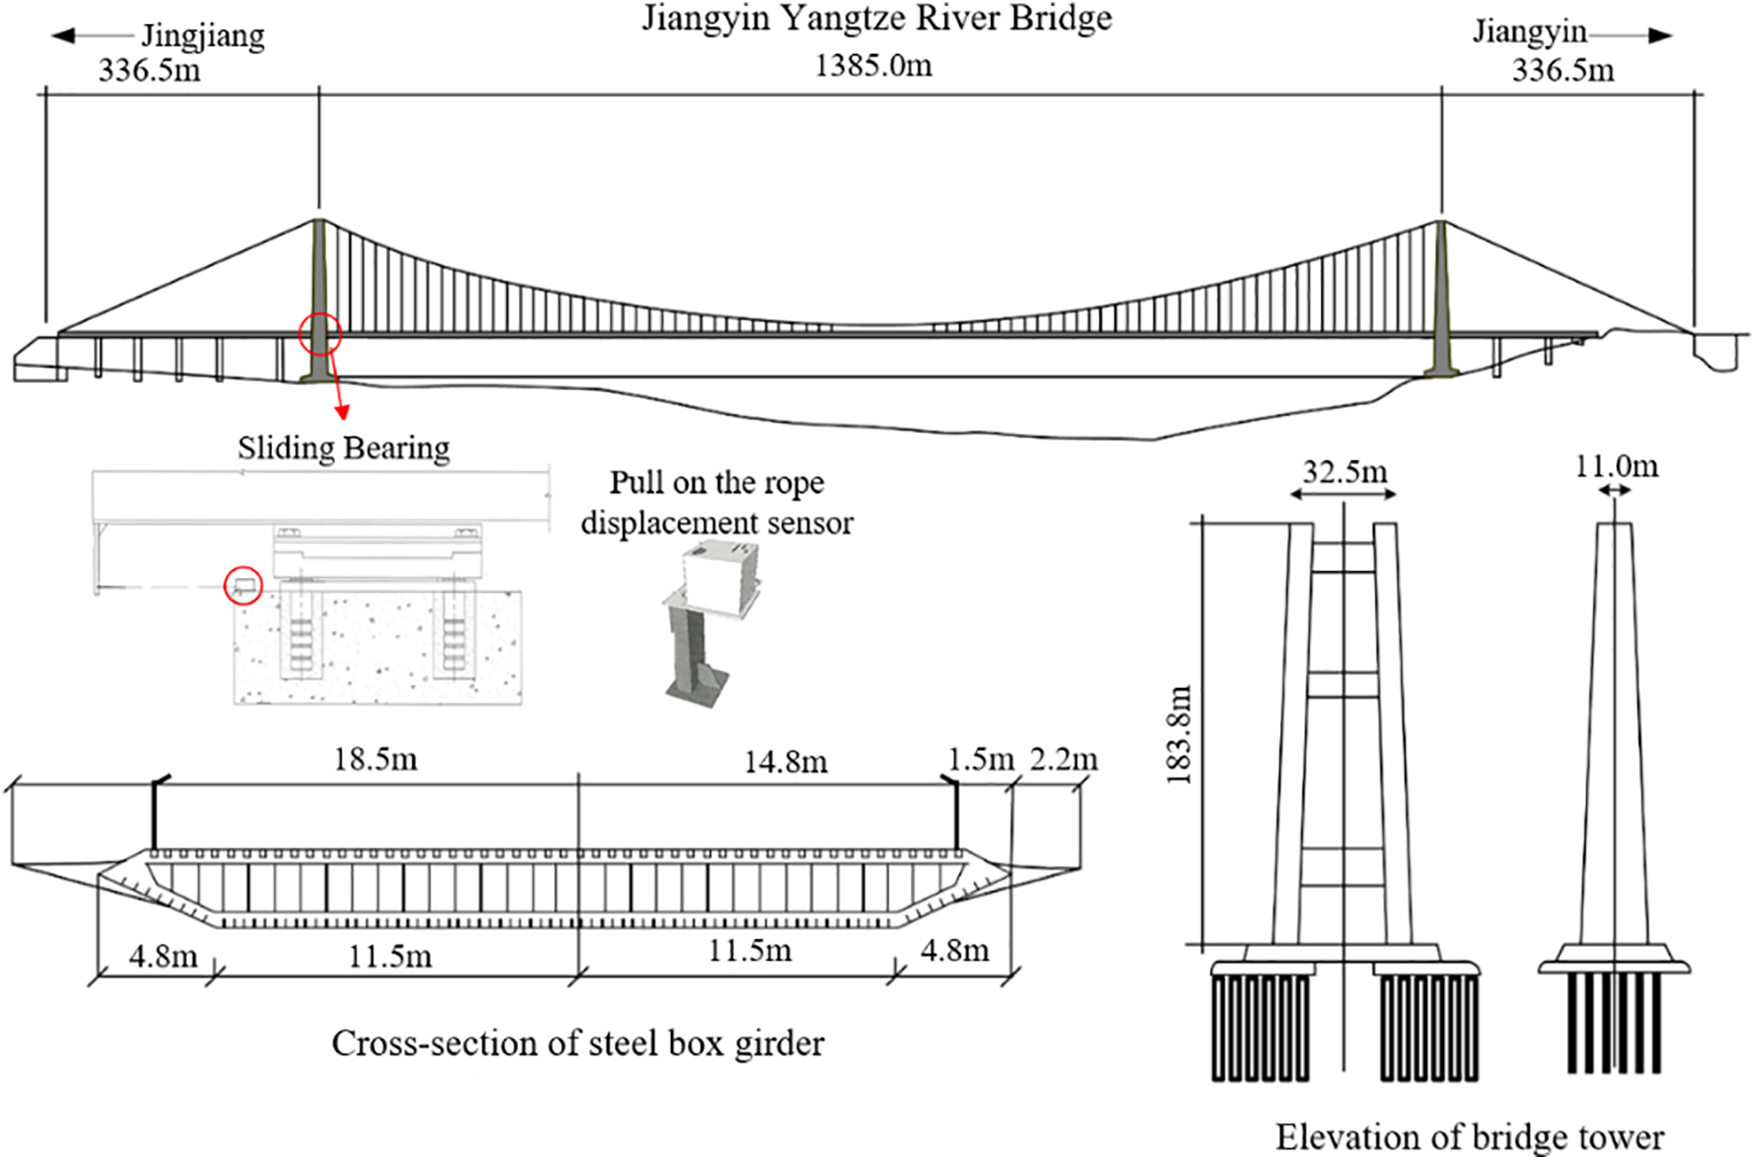
Figure 2: Jiangyin bridge displacement sensor arrangement
3 The FE Model for Dynamic Analysis of Girder End Displacement
The suspension bridge typically falls under the floating system category and experiences significant longitudinal deformation in its main beam due to various loads (such as traffic loads, temperature variations, wind loads, earthquake loads, etc.). Consequently, the service life of the girder end restraint device is considerably lower than anticipated. Existing research indicates that fatigue failure of the expansion joint device, cracking of the slide mechanism, and excessive wear of bearing sliding plate are directly linked to excessive longitudinal displacement at the girder end. Notably, a substantial proportion of this cumulative displacement is attributed to high-frequency displacement components caused by vehicular loads [3,11]. This factor primarily contributes to premature failure of the girder end restraint device. By employing finite element models and random vehicle load models, it becomes feasible to conveniently and independently investigate vehicle-induced displacements at the girder end. Such investigations can provide valuable insights for parameter setting and maintenance measures concerning constraint devices.
3.1 Simulation of Random Vehicle Load Model Based on WIM Data
Currently, numerous domestic and international scholars have conducted simulations and analyses on the girder end displacement under vehicle load [25]. However, previous studies primarily employed macroscopic traffic flow models for simulating traffic flow, where vehicles move uniformly at a constant speed in a straight line. The vehicle loads that are loaded on highway bridges exhibit significant randomness. As a result, the design vehicle loads that are specified in bridge codes cannot fully reflect the actual operating conditions of vehicle loads on the bridge. Consequently, when simulating the longitudinal displacement response of the girder ends under vehicle loads, it is essential to initially establish a random traffic flow model based on the measured traffic flow data of a specific bridge and use it as the input vehicle loads in the finite element model for calculation. In this study, a random traffic flow was simulated using the WIM (Weigh-In-Motion) data of the Jiangyin Bridge [26]. The vehicles were categorised according to their respective types, and statistical models were developed for the weight, speed, and lane distribution of each vehicle type, which were then established as the static parameters of the random traffic flow. Ultimately, a time-varying model was constructed on the basis of the aforementioned static parameters and implemented in the finite element model.
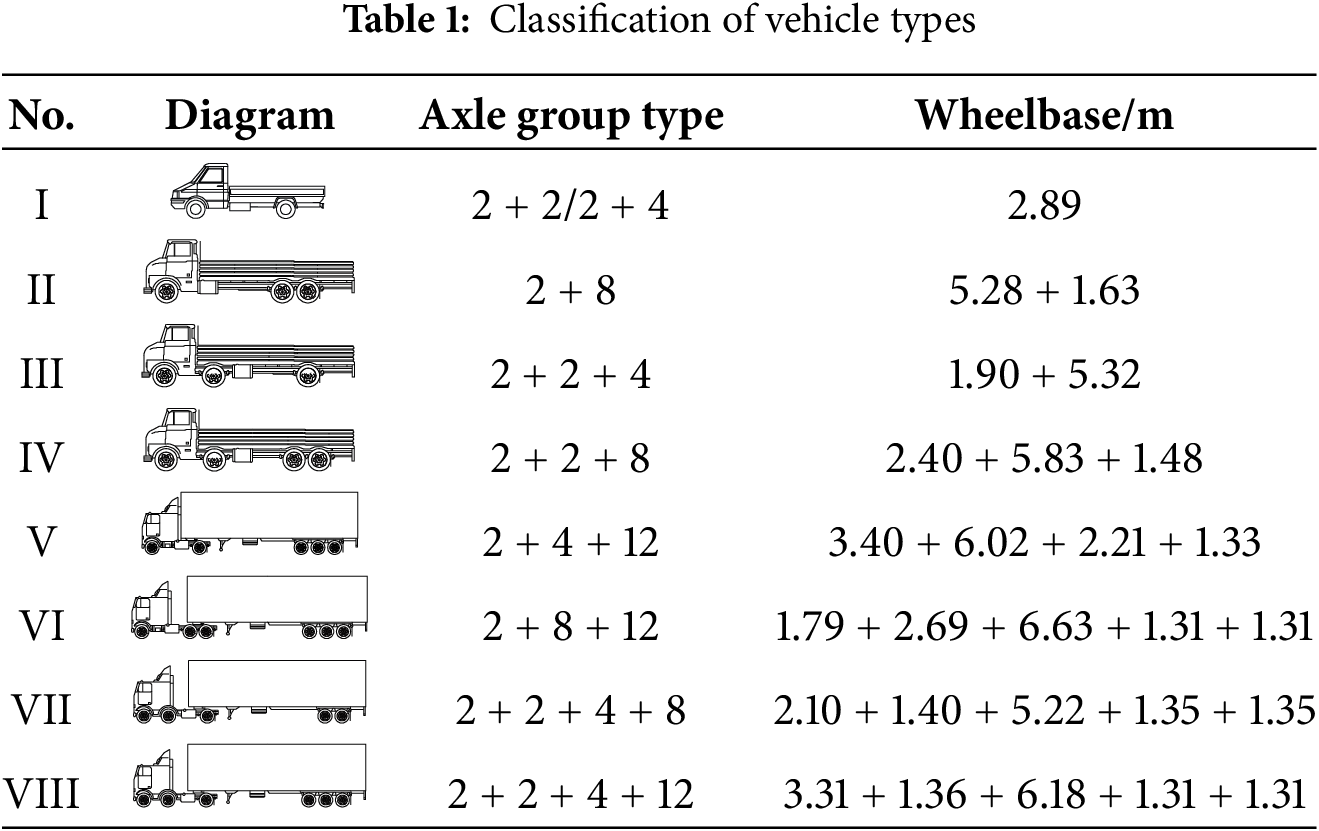
Vehicle models are classified according to different axle group types. Based on the two-year vehicle weight database of the WIM dynamic weighing system on the bridge, the vehicle models are divided according to the axle types, and eight basic models are established, as shown in Table 1.
The statistical models of vehicle weight and speed data of different models were determined respectively. According to the EM algorithm (Expectation Maximization algorithm), the weight data of the above eight models were fitted with mixed normal distribution and mixed lognormal distribution to determine the parameters of the statistical model. Based on the speed data of different models, the speed distribution law was fitted. For example, the weight distribution of the type III car is shown in Fig. 3.
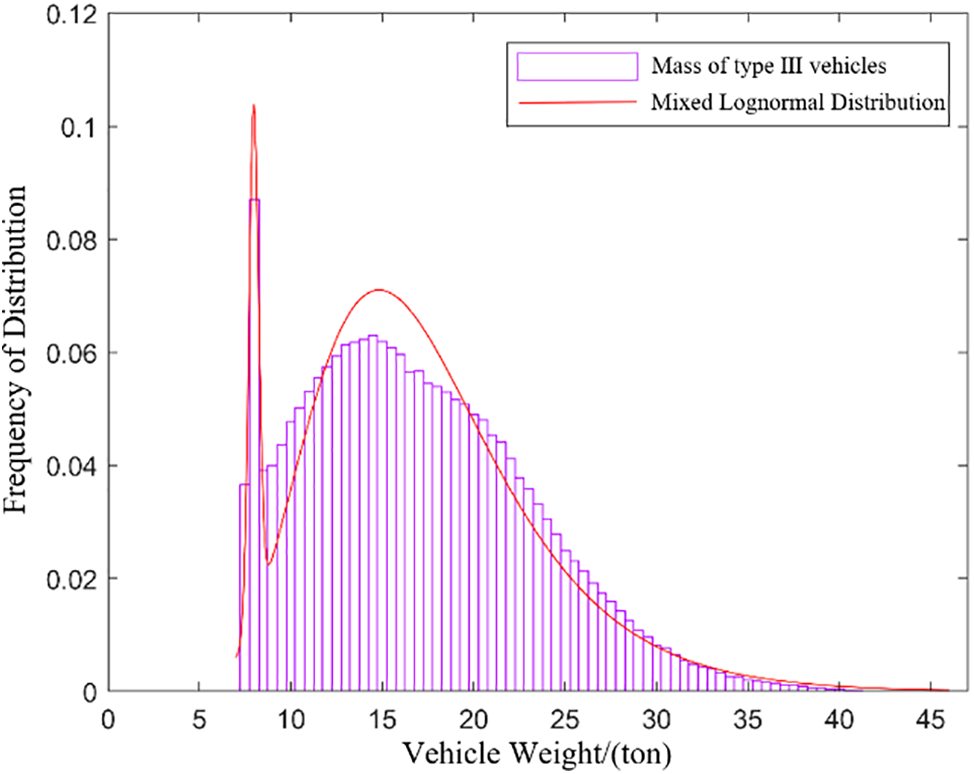
Figure 3: Weight distribution fitting for type Ⅲ vehicles
When generating a random vehicle load model, it is essential to consider the characteristics of vehicle lane selection and arrival time intervals. Additionally, the interactions between vehicles on the bridge must be accounted for, which can be simulated using a car-following model. Vehicle lane selection can be determined based on WIM statistical data, and the process of vehicles arriving at the bridge can be modeled as a Poisson process with an arrival rate
3.2 Establishment of FE Model and Simulation of Constraint Devices
Based on the design drawings, the model was established using the finite element software MIDAS for analysis. The main girder and bridge towers were modelled using beam elements, the main cables were modelled using cable elements, and the hangers were modelled using truss elements that only bear tension. The hanger elements in the model were rigidly connected to the main girder, and the nodes of the main cables were rigidly connected to the tower-top nodes using master-slave constraints. The base of the towers and the anchorage points were constrained using fixed boundary conditions.
The random vehicle model established cannot be directly used for finite element model calculations. It must first be converted into dynamic loads acting on the main beam nodes, integrating the random vehicle model with the finite element model for subsequent beam-end displacement time history calculations. For simulating vehicle movement on a bridge, scholars have introduced a simplification method by separating the gravitational and inertial effects: the vehicle’s gravity moves as a vertical force on the bridge, while its mass is fixed at the beam’s mid-span. For long-span bridges, the inertial effect of the moving vehicle is much smaller than its gravitational effect and can be ignored, treating the vehicle as a moving vertical load. Since the wheel load on the main beam node can be considered an instantaneous impact load, a triangular load with a maximum value equal to the vehicle’s weight is used to approximate the load variation when the wheel passes.
The load on the main beam node under random traffic is equivalent to extending the single vehicle load to that of a convoy, where the load at a node at a given time is the sum of the loads from multiple vehicles. Based on the random vehicle model, the vehicle positions on the bridge and corresponding weights at each time step can be obtained, allowing the calculation of the load on the main beam nodes at each time step. In this study, the time step interval is taken as
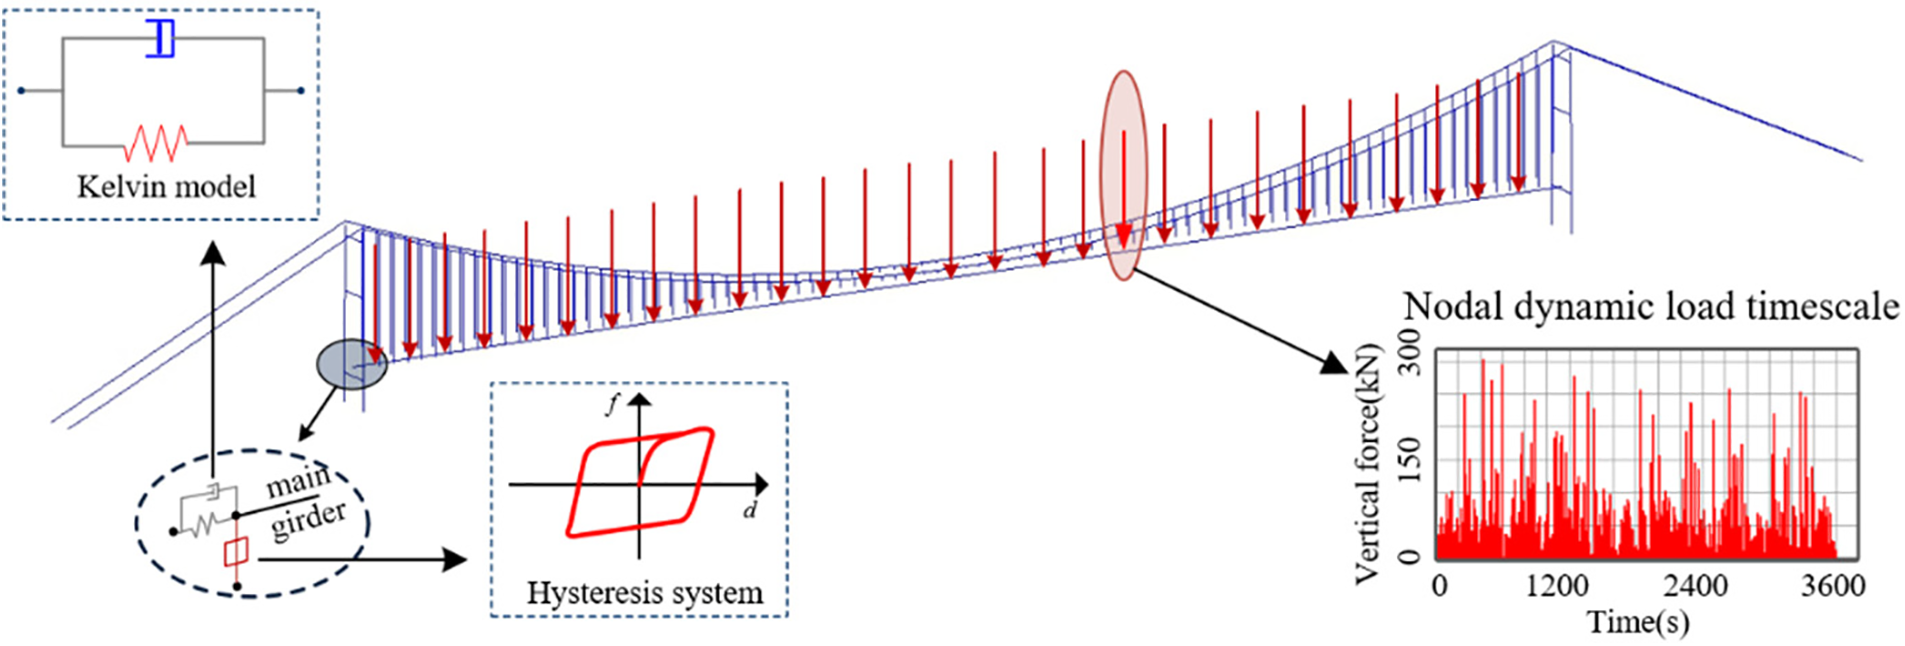
Figure 4: Dynamic load of Jiangyin Bridge nodes and longitudinal constraints of girder ends
The longitudinal boundary conditions of the main beam of the bridge significantly impact the calculation of girder end displacement. To better simulate the girder end constraint device of Jiangyin Bridge and ensure its consistency with actual conditions. In this study, viscoelastic energy dissipators and hysteresis systems based on the Kelvin model were used to simulate the longitudinal dampers and vertical bearings of bridges, respectively.
The viscoelastic energy dissipator based on the Kelvin model can be considered as a parallel damping unit and a spring unit, in this model the damping unit is connected in parallel with the spring unit and the output force in the model is the sum of the two, with the damping force of the damping unit expressed by the following equation:
where
The determination of viscoelastic energy dissipator and hysterescent system parameters should be based on the actual performance of the constraint device. The damping coefficient
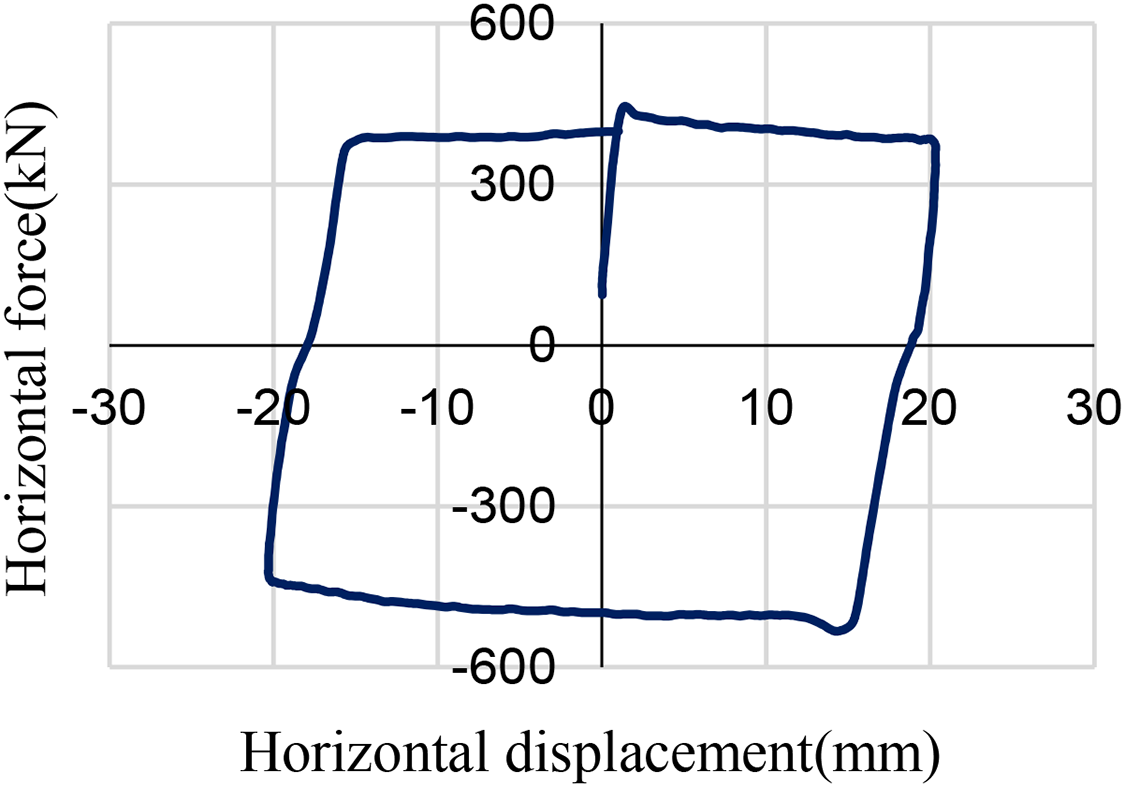
Figure 5: Jiangyin Bridge bearing hysteresis curve
Using the established dynamic analysis model, the dynamic time history analysis was carried out. The resulting simulated displacement time history curve of the girder end was then compared with the high-frequency displacement components obtained through the Butterworth high-pass filtering method. The comparative results are presented in Fig. 6.
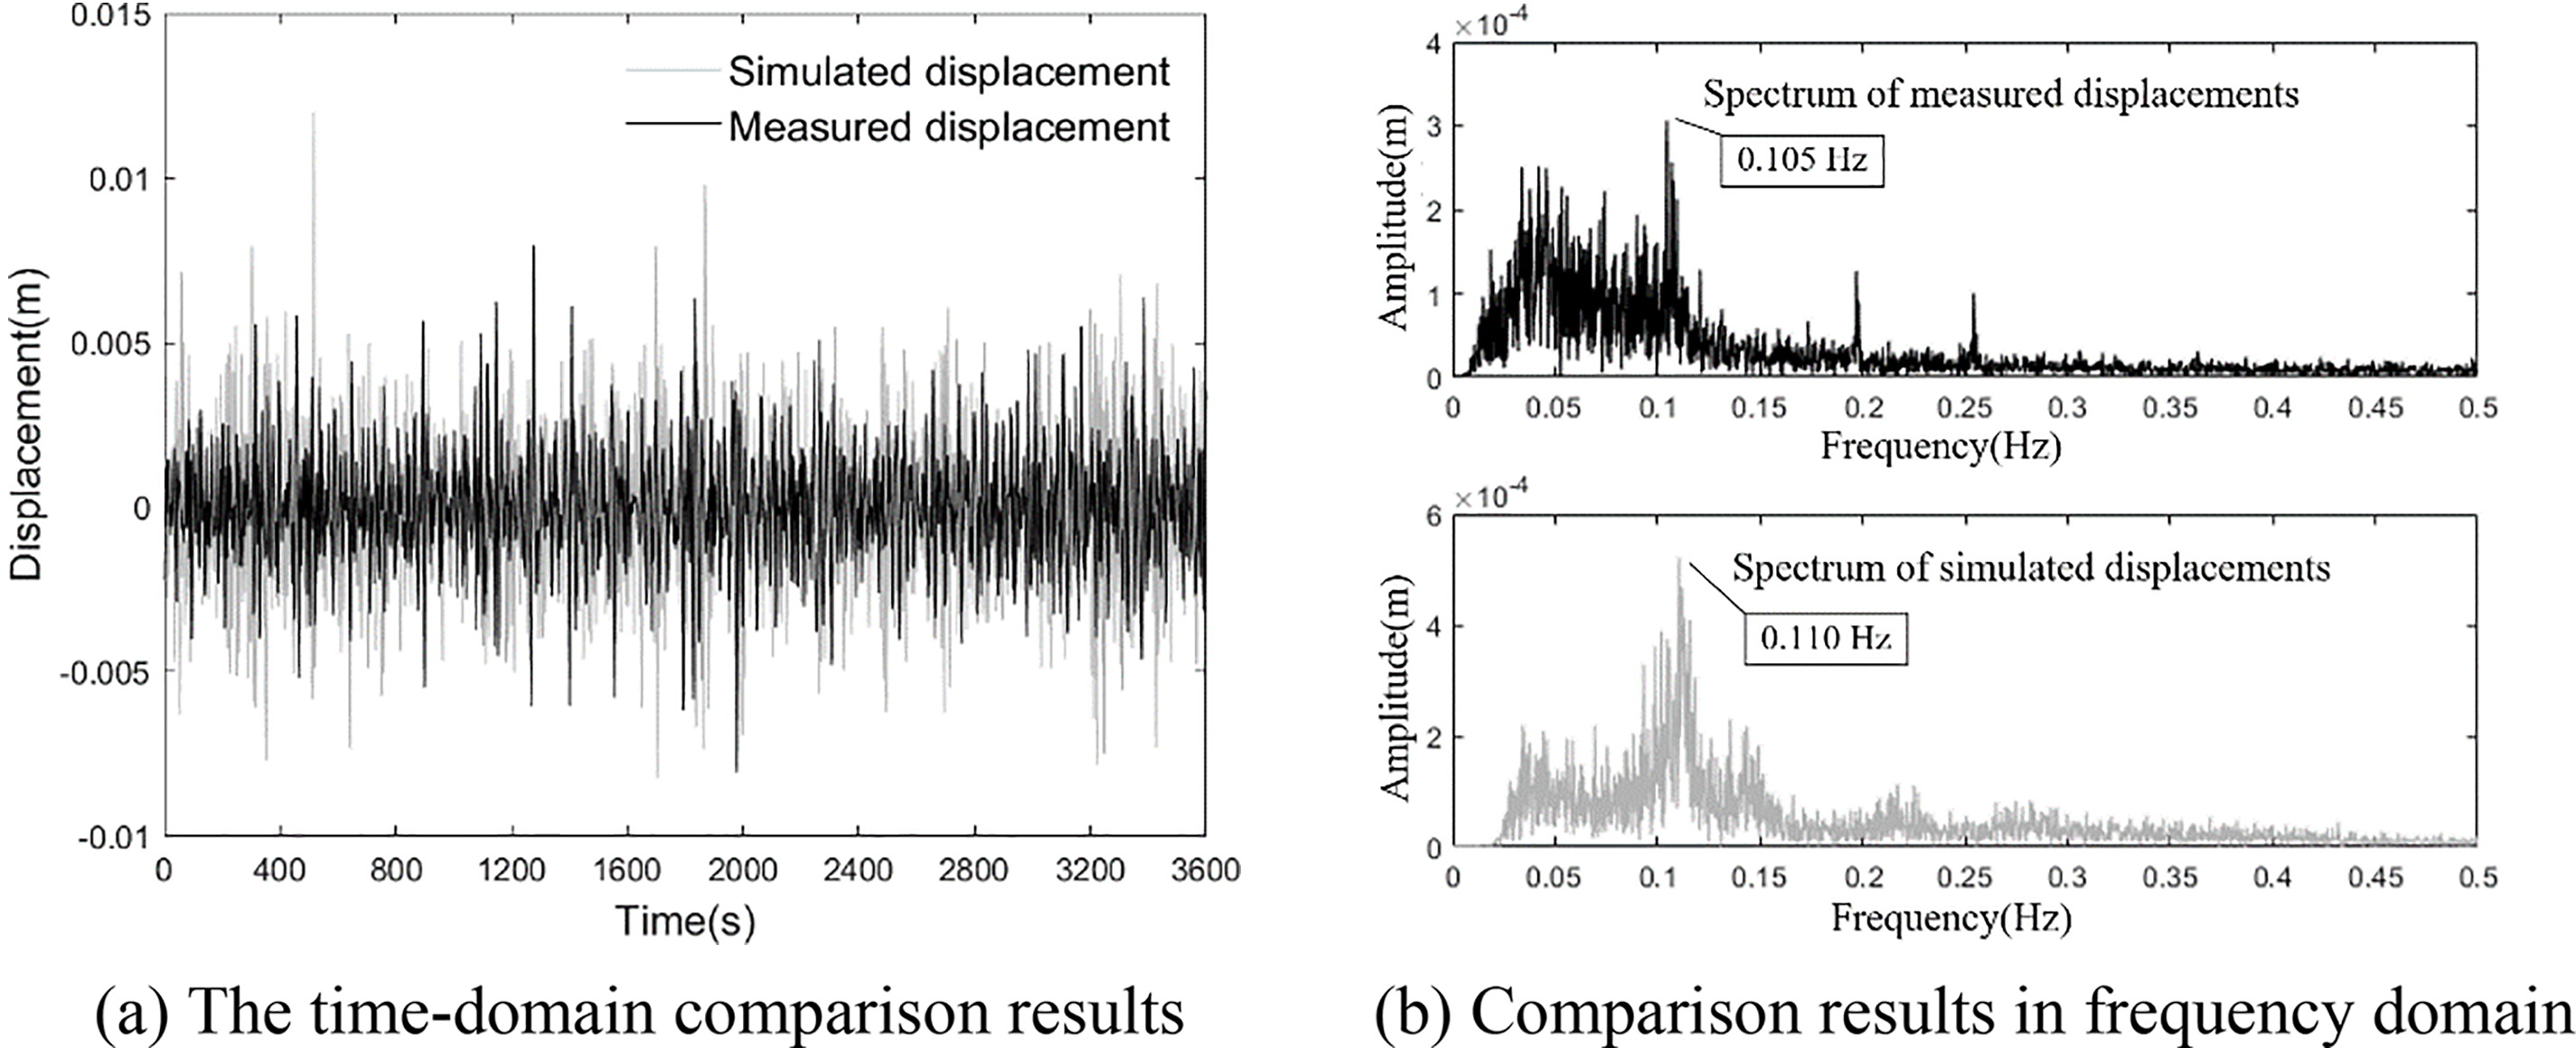
Figure 6: Comparison between simulated and measured girder end displacement
From the figure, it is evident that the displacement-time history of the girder end, calculated using the random vehicle load model proposed in this study. The amplitudes of the simulated and measured displacements are 0.0254 and 0.0219 m, respectively, which exhibits a high waveform similarity and closely matches the amplitude of the vehicle dynamic effect components separated from measured data. Furthermore, upon comparing the frequency domain characteristics of simulated and measured displacement data, it can be observed from the spectrum diagram that there is close alignment between peak frequencies of principal components in both simulated and measured displacements.
In order to quantitatively test the similarity between the simulated time history and the measured time history, this article evaluates the similarity between the simulated displacement and the measured displacement using the Kullback–Leibler divergence. Assuming that
where
4 Performance Analysis and Degradation Simulation of Dampers
The degradation patterns of dampers and bearings and have been extensively researched by scholars, with the results substantiated by accompanying test data. The established dynamic analysis model of girder end displacement in this study enables the calculation of the structural impact resulting from performance degradation of restraint devices through dynamic time history analysis. Following the replacement of dampers and bearings on Jiangyin Bridge, a maintenance unit conducted a performance test on the replaced restraint devices to assess changes in their functionality before and after service, along with corresponding deterioration patterns.
Prior to replacement, the Jiangyin Bridge was equipped with a liquid viscous damper system. However, after seven years of service, a significant decrease in damping force has been observed in these dampers, resulting in a gradual decline in their control effectiveness on the cumulative displacement of the girder ends. Adopt the special damping device test system to carry out mechanical performance test on viscous dampers, including slow force verification, damping relationship verification, dynamic maximum load, fatigue test and other items, and after decommissioning, pre-service mechanical performance comparison, observation of the damping force attenuation, as shown in Fig. 7. Fig. 8 illustrates the variation in damper damping degree at different temperatures and relative speeds. It is noteworthy that across all scenarios examined, the damping force exhibited by the dampers in 2020 is approximately 15% lower than that recorded in 2013.
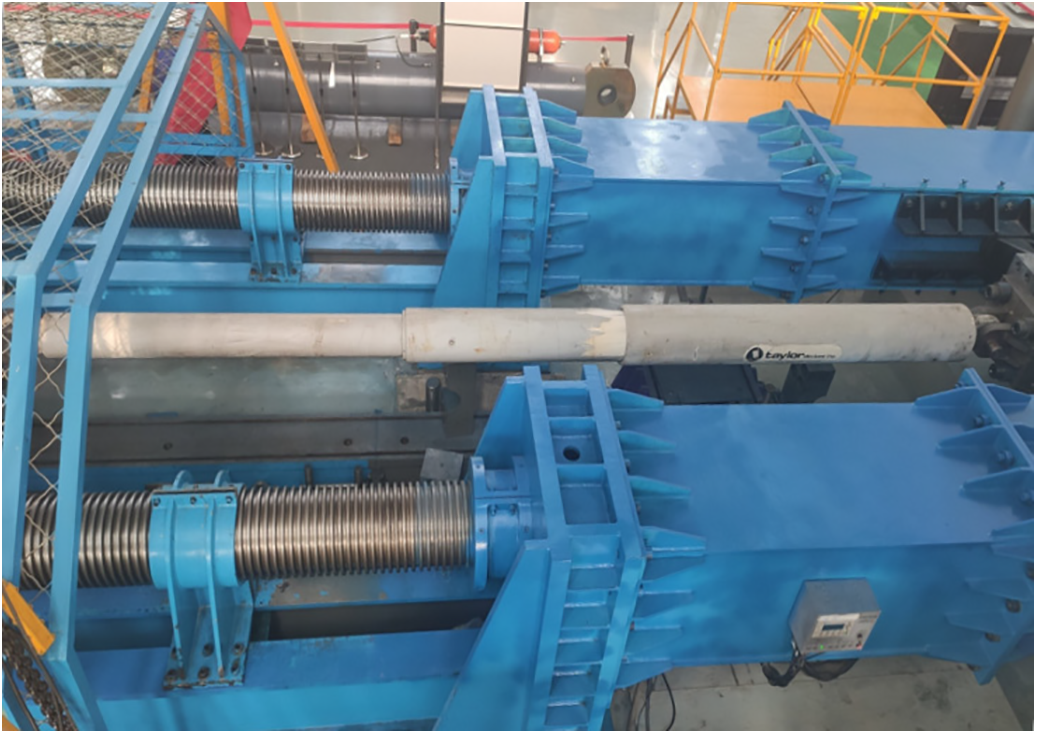
Figure 7: Mechanical properties test of decommissioned viscous dampers
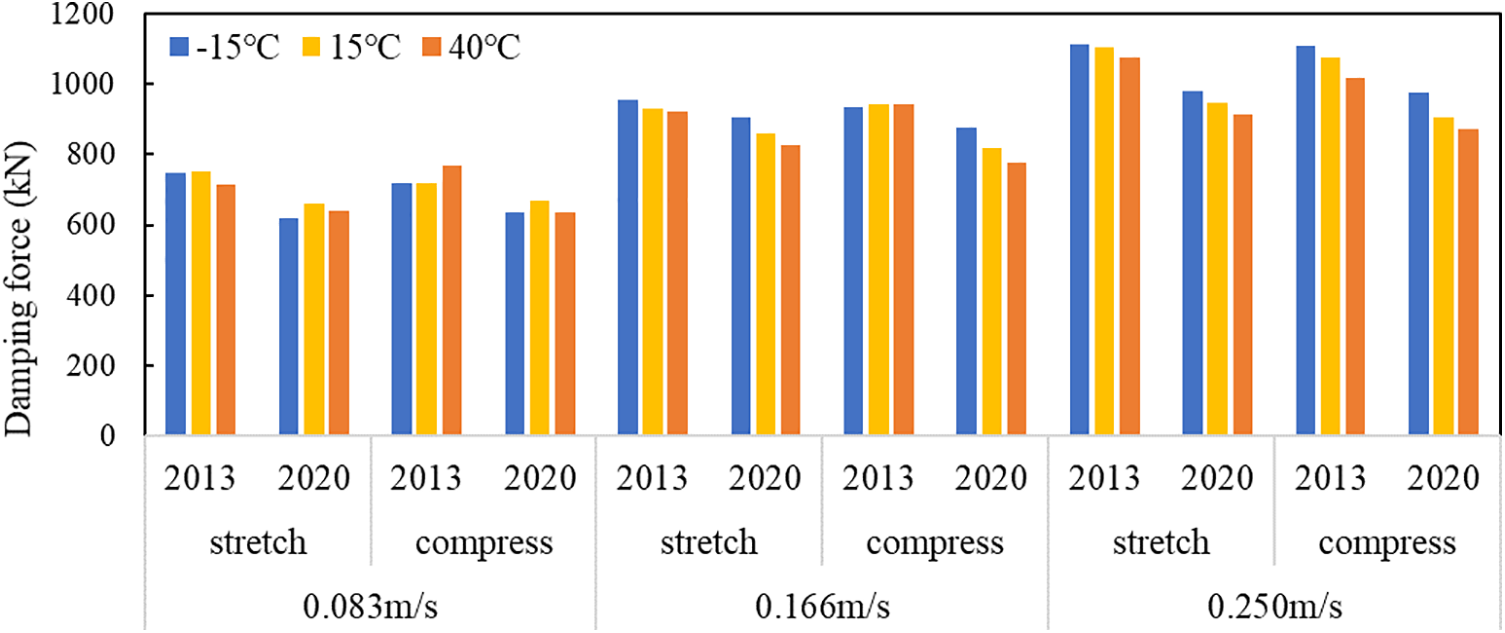
Figure 8: Comparison of damping forces under different conditions
Based on the analysis of actual monitoring data on girder end displacement, it is observed that the motion speed of the girder end typically remains below 5 mm/s under normal conditions. Therefore, for longitudinal dampers in suspension bridges, it is crucial to monitor changes in damping force at low relative speeds. Fig. 9 illustrates slow force test results of the damper under a relative motion speed of 1.2 mm/s. Performance tests reveal that damping force attenuation rates exceed 50% when relative speeds are low (1~10 mm/s). Consequently, decommissioned dampers experience significant reductions in damping forces and exhibit diminished control over cumulative girder end displacement, leading to accelerated wear and tear diseases affecting bearing and expansion joints.
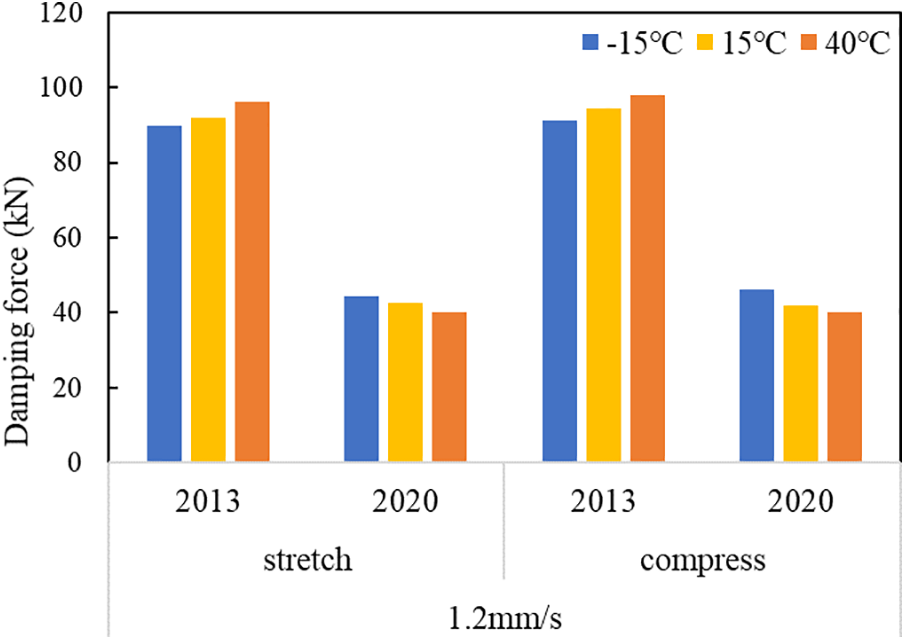
Figure 9: Comparison of damping force under slow speed
The damping force index model in the above section was used,
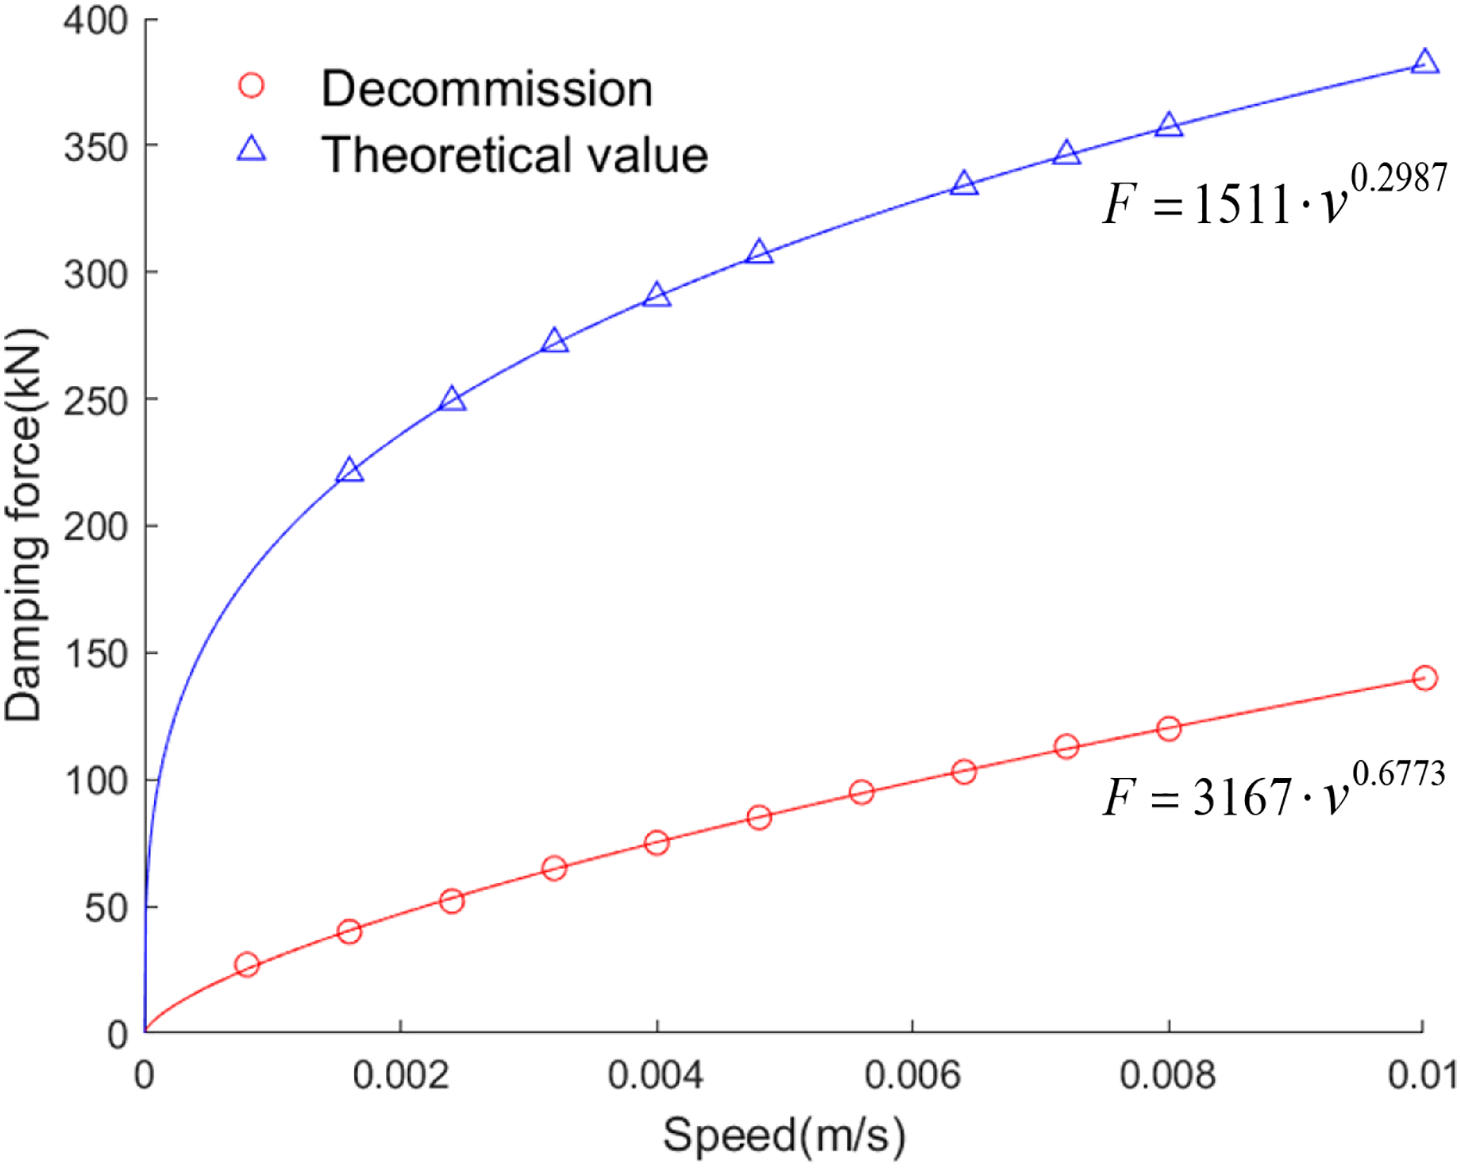
Figure 10: Damper parameter fitting based on exponential model
Dynamic time history analysis was conducted to determine the displacement of the girder end under the aforementioned two damper parameter settings, and a comparison of the displacement time history was obtained, as illustrated in Fig. 11a. In comparison with the theoretical value, the displacement amplitude of the girder end calculated by the damper parameters during decommissioning increased by more than double. The cumulative displacement per hour corresponding to the girder end’s displacement time history is further computed. The theoretical value and damper parameters at decommissioning yield respective cumulative displacements of 4.90 and 8.43 m, indicating a significant decrease in the damper’s control effect on girder end displacement under conditions of performance degradation. This decline represents a primary factor contributing to the rapid development of wear and fatigue diseases in bearing and expansion joints. The displacement spectrum of the girder end under different damper parameters is illustrated in Fig. 11b. As illustrated in the figure, the peak value of the high-frequency displacement component around 0.1 Hz rises significantly after the performance degradation of the damper.
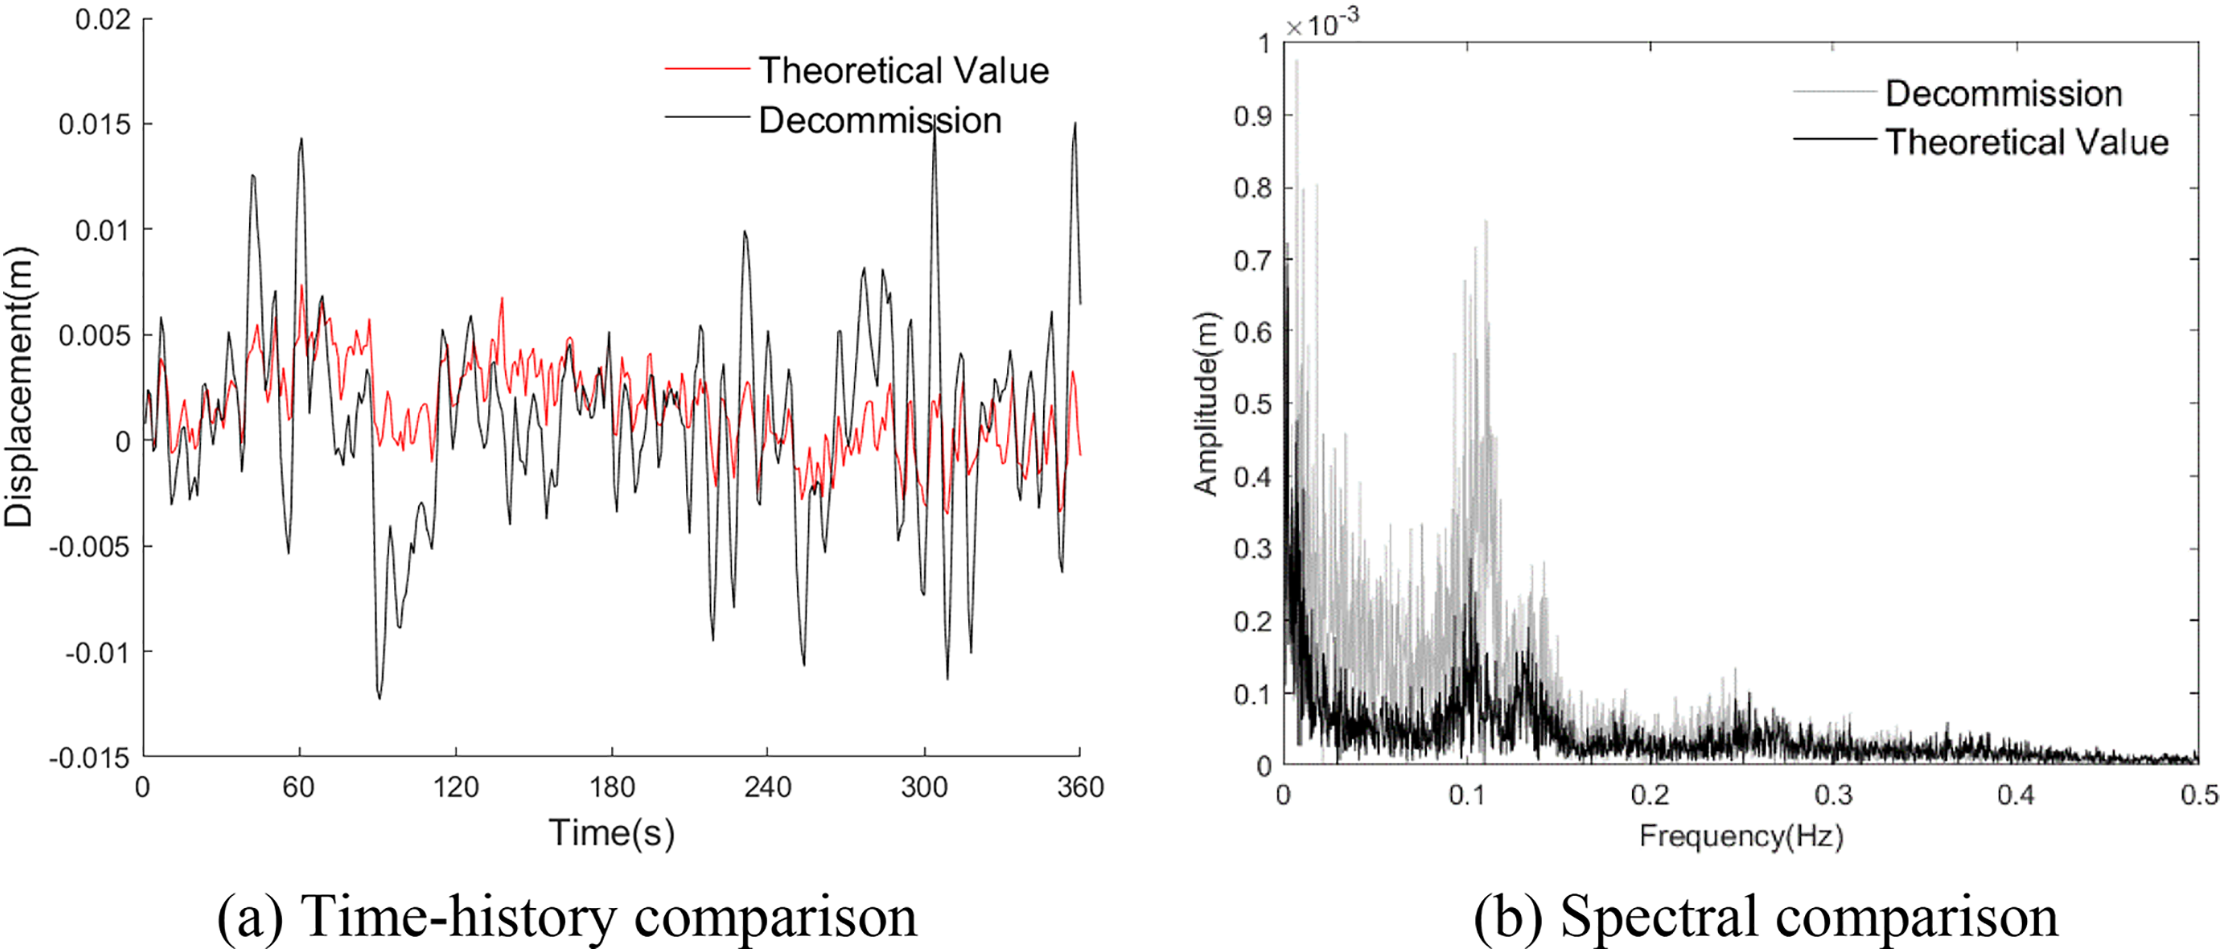
Figure 11: Comparison of girder end displacements with different damper parameters
The aforementioned analysis indicates that the cumulative displacement of the girder end can reflect the performance of the damper to a certain extent, thereby providing a reference for the maintenance decision. The results of the finite element calculation indicate that a 50% reduction in the damping force of the damper is associated with an increase in the cumulative displacement of the girder end by 72%. If the damping force of the damper is reduced by more than 50% as the failure state, then when the accumulated travel of the measured displacement data is significantly higher than before, the actual performance of the damper should be paid attention to and replaced if necessary.
5 Analysis of Performance Degradation of Bearing Sliding Plate
The friction coefficient of the bearing sliding plate is a crucial performance parameter, and polytetrafluoroethylene (PTFE) is extensively employed in its production due to its exceptional characteristics such as low friction coefficient and wear rate. During the bearing service process, the accumulation of girder end travel leads to gradual wear of the bearing sliding plate. As wear increases and bearing sliding plate grinding chips come into play, the friction coefficient between the bearing sliding plate and stainless steel mirror on the upper bearing gradually rises, further exacerbating sliding plate wear. Once the bearing sliding plate is worn out, even steel parts are affected, resulting in a significant increase in friction coefficient for the bearing system. This adversely impacts sliding performance and may lead to frustration, sticking, or even pose a risk to other bridge components.
A number of researchers have examined the failure process of bridge bearings under seismic loading, and on this basis, combined with the inspection and repair process of some large-span bridges, summarized the failure process of bearings in operation stage: (1) the accumulation of bridge girder end displacements make the bearing sliding plate gradually worn out, and the thickness of the sliding plate decreases; (2) if the excessively worn out bearing sliding plate is not replaced in time, it will cause the bearing to lock up quickly, bearing activity capacity is limited; (3) finally, due to the deformation of the steel box girder end, it will produce a large shear force at the bearing, resulting in bearing bolt shearing, bearing overall failure [28–30].
In order to study the performance changes of the bearing during operation, the relevant maintenance units of Jiangyin Bridge conducted bearing wear tests, and obtained the relationship between different wear degrees of the bearing sliding plate and the friction coefficient of the bearing. Based on this, this paper categorizes the operational condition of the bearing sliding plate into three stages: normal state, dry grinding period of the bearing sliding plate, and grinding period of the steel parts. These stages are determined based on the varying wear degree of the bearing sliding plate from light to heavy and a gradual increase in friction coefficient. The bearing friction at different stages varies in accordance with the displacement curve, as illustrated in Fig. 12. It is evident from the figure that the variation pattern of horizontal force exerted by the bearing aligns closely with the hysteresis curve. As the bearing sliding plate undergoes increased wear, there is a continuous escalation observed in sliding friction experienced by the bearing sliding plate.
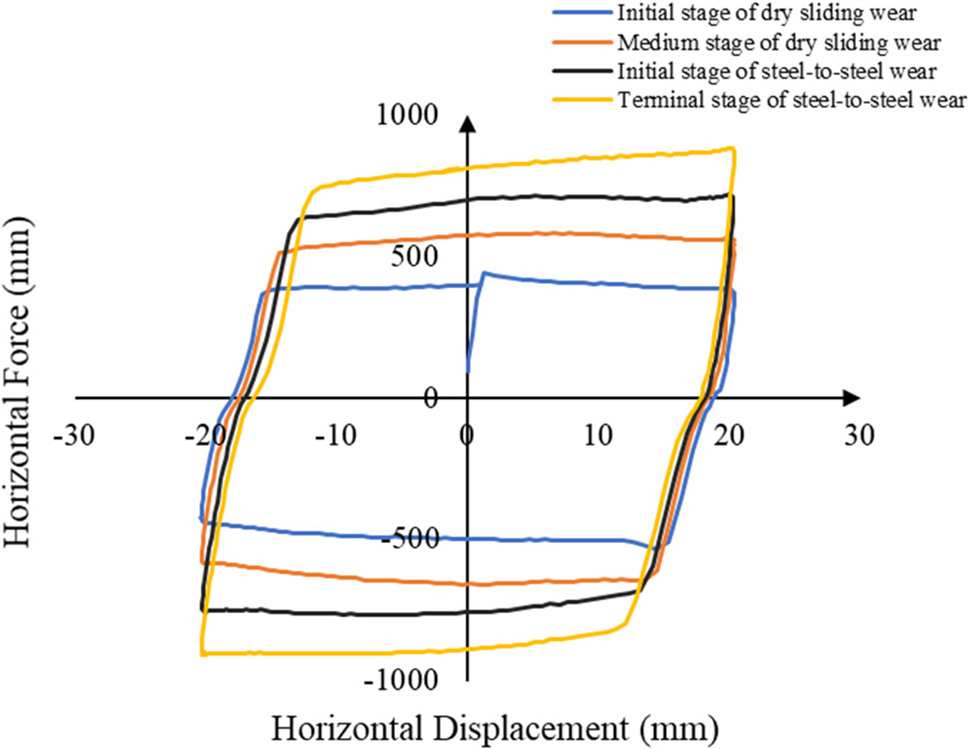
Figure 12: Horizontal force curve of the bearing sliding plate under different wear degrees
According to the results obtained from the friction performance test conducted on the bearing, Table 2 presents the friction coefficients corresponding to four distinct working conditions: normal sliding with silicone grease, depletion of silicone grease, wear and tear of the sliding plate, and direct grinding between upper and lower steel parts of the bearing. In our finite element model, we simulate the friction curve of the bearing using a hysteresis system while determining model parameters based on different working condition-specific friction coefficients.
Finite element model was utilized to calculate the displacement time history of the girder end under the above four working conditions in the absence of longitudinal damper at the girder end, and the cumulative displacement and displacement amplitude were further calculated according to the displacement time history, as shown in Fig. 13a. As depicted in the figure, the amplitude of girder end displacement gradually diminishes with an increase in the sliding friction force of the bearing. Simultaneously, the cumulative displacement demonstrates an initial decline, followed by an increase. This phenomenon can be attributed to the restraining effect imposed on longitudinal motion at the girder end by an augmented friction coefficient within its normal range. Consequently, both the amplitude and cumulative amount of girder end displacement experience a reduction. When the friction coefficient increases to a certain extent, it is difficult for the girder end to move freely due to the excessive maximum static friction force, resulting in the accumulation of potential energy. Once the longitudinal force exceeds the maximum static friction force of the bearing, the girder end will undergo high-frequency reciprocating motion due to the conversion of potential energy into kinetic energy, resulting in a rapid increase in cumulative displacement. Relevant studies show that the friction pendulum bearing has almost no effect on the cumulative displacement control of the girder end, and it is also confirmed that when the friction coefficient of the bearing is too large, the cumulative displacement will increase.
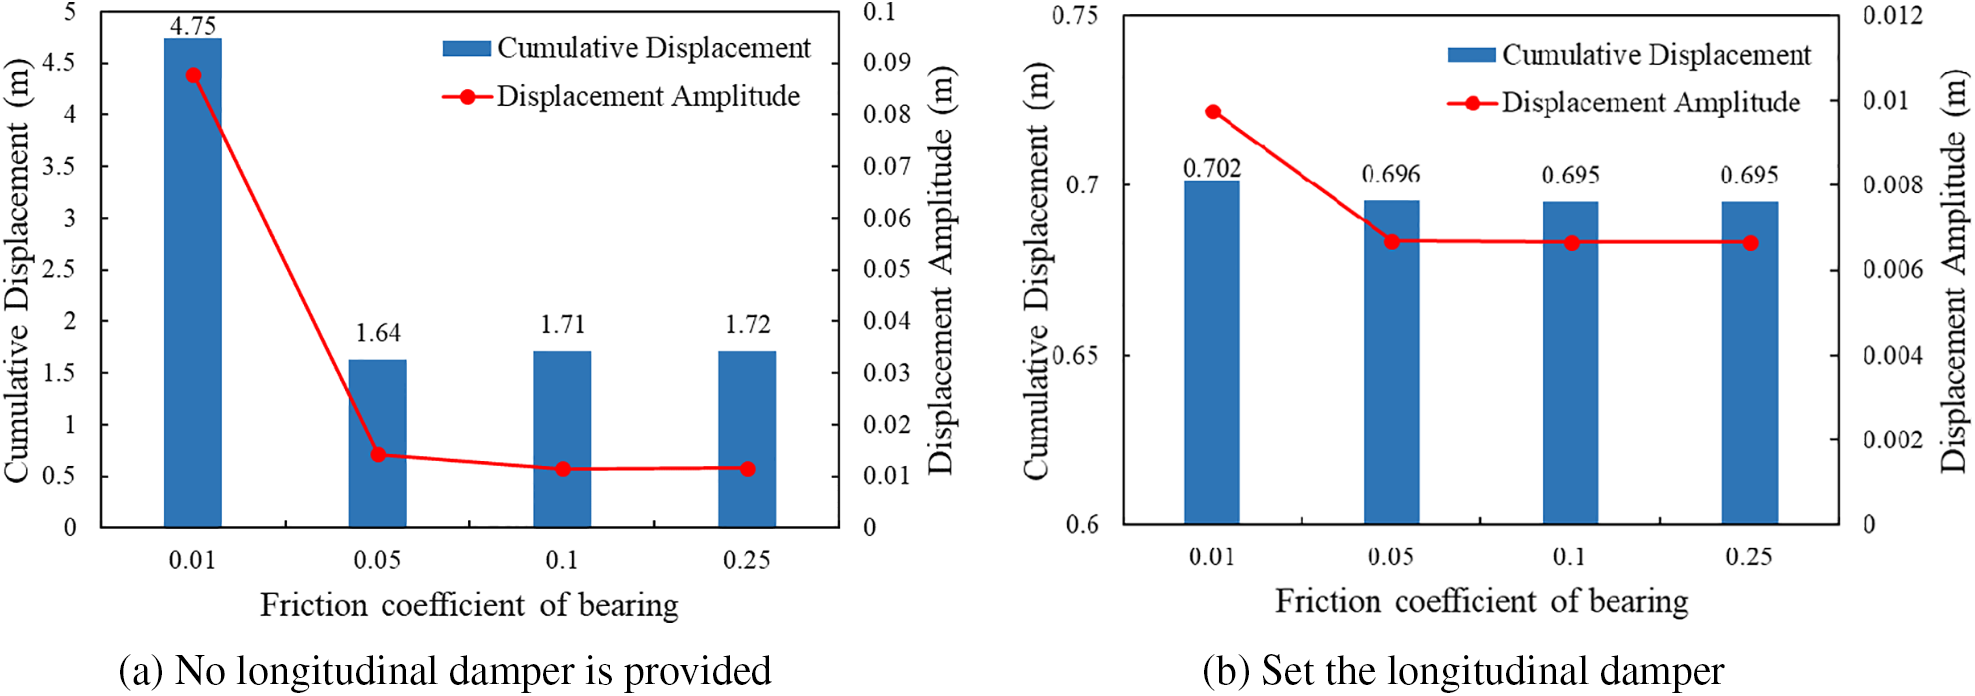
Figure 13: Cumulative displacement and peak displacement as a function of friction coefficient
In practice, the end of the long span suspension bridge is usually equipped with longitudinal dampers and bearings at the same time, so it is necessary to consider the joint action of the bearings and dampers on the stiffened beam. The damper parameters are taken as the damper coefficient and damping index under the above normal conditions, and the displacement response of the girder end and the corresponding cumulative displacement and peak displacement under different bearing friction coefficients are calculated, respectively, as shown in Fig. 13b. The findings indicate that the friction coefficient variation in the bearing has minimal impact on the cumulative displacement of the girder end when the damper is configured, merely resulting in a slight reduction in peak displacement. Consequently, it can be inferred that the primary function of the longitudinal damper lies in controlling and mitigating cumulative displacement at the girder end.
The maximum longitudinal force of the girder end element under different working conditions using the finite element model, as shown in Fig. 14. From the graph, it can be observed that the maximum axial force increases with the increase of friction coefficient under the condition without longitudinal damper, and the increase is not obvious when the friction coefficient is greater than 0.05. Under the condition of setting longitudinal dampers, as the friction coefficient of the bearing increases, the maximum axial force first decreases and then increases, which is due to the coupling effect between the damper and the bearing. When the friction coefficient of the bearing decreases, the obstruction effect on the girder end displacement is not obvious, and the movement speed is large. According to the damping force calculation formula

Figure 14: Changes of the maximum axial force of the girder end with the friction coefficient under different working conditions
Compare the energy dissipation curves of the bearing under varying friction coefficients when longitudinal dampers are implemented, as depicted in Fig. 15a,b. When the friction coefficient of the bearing is relatively low, the energy dissipation curve exhibits a hysteresis pattern closely resembling the horizontal force change curve obtained from previous testing. However, when the friction coefficient exceeds a certain threshold, the excessive maximum static friction force impedes the longitudinal motion of the girder end, making it difficult for it to slip freely. Consequently, the bearing becomes closer to an elastic structure with higher stiffness at the end of the stiffened beam. Under abnormal vibrations caused by earthquakes or heavy vehicle passage, this unfavorable energy dissipation may lead to structural damage. Henceforth, meticulous attention should be paid to the frictional performance of the bearing sliding plate and timely replacement should be carried out in case of severe wear and tear to prevent any further adverse effects on the structure.
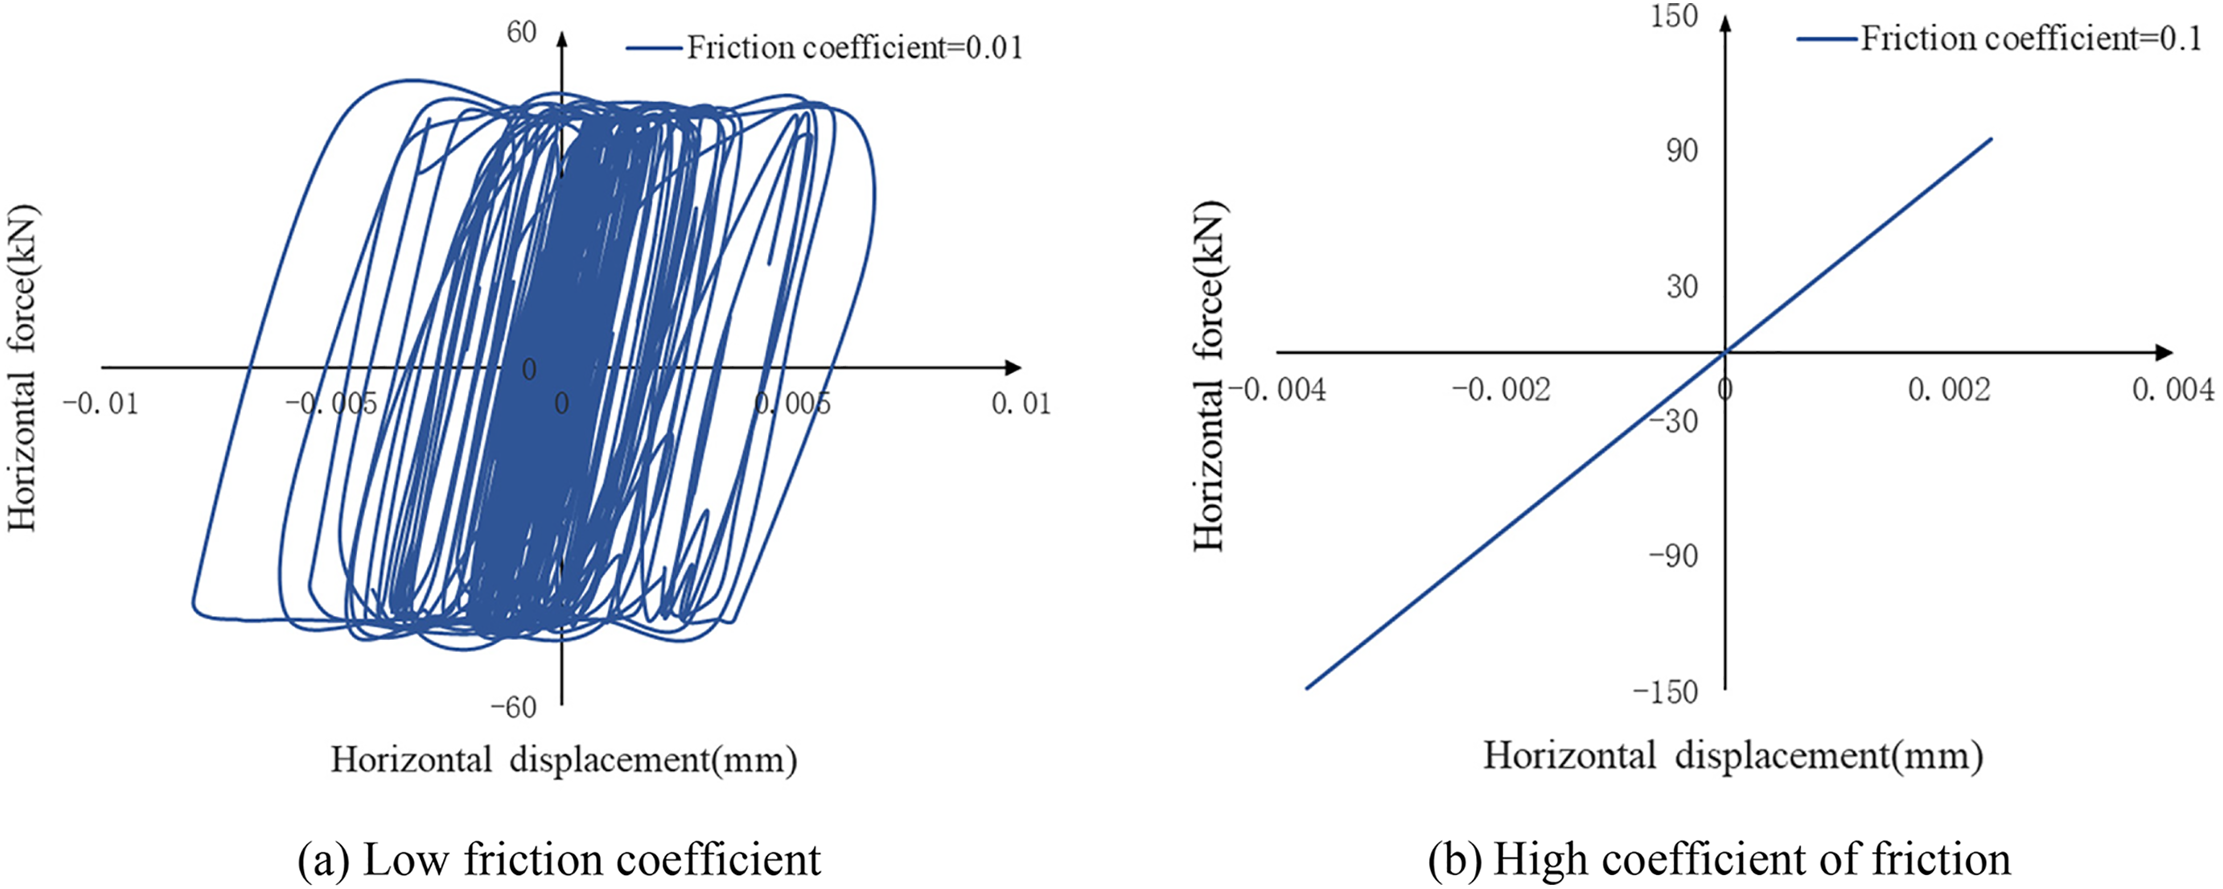
Figure 15: Energy dissipation curves of bearing with different friction coefficients
By establishing a random vehicle load model, this paper simulates the longitudinal displacement time history of girder end caused by automobile load. On this basis, according to the performance test data of dampers and bearings, the influence of dampers and bearings deterioration on bridge structure is simulated by finite element analysis, and the control effect of different constraints on girder end displacement under various circumstances is analyzed. So as to provide a reference for the decision making of relevant maintenance units. The specific conclusions are as follows:
(1) The displacement response at the beam end of the bridge under vehicle dynamic loads can be effectively simulated using a random vehicle load model and finite element dynamic analysis. The KL divergence between the simulated displacement time history and the measured displacement component time history is 0.113, indicating that the time-domain and frequency-domain characteristics of the simulated displacement are highly consistent with those of the measured displacement.
(2) In 2020, the damping force of the viscous dampers on the Jiangyin Bridge had decreased by approximately 15% compared to 2013. After degradation, the damping force of the viscous dampers showed more significant attenuation under low-speed conditions, with an attenuation rate exceeding 50%. The cumulative displacement calculated using the theoretical damping values and the parameters of the retired dampers was 4.90 and 8.43 m, respectively. When the damping force decreased by 50%, the cumulative displacement at the beam end increased by 72%. This indicates that the control effectiveness of the dampers on beam-end displacement significantly diminishes as their performance degrades, leading to intensified wear on bearings and expansion joints.
(3) In the absence of longitudinal dampers, the deterioration of the bearing sliding plate has a greater impact on the cumulative displacement. However, when longitudinal dampers are installed, the deterioration of the bearing sliding plate almost does not affect the cumulative displacement of the girder end, but when the sliding friction coefficient of the bearing is excessively high, it will have a certain impact on the seismic performance of the structure as a whole due to the adverse energy dissipation.
(4) A comprehensive analysis of the effect of restraint device performance on beam end displacement was conducted based on the bridge finite element stochastic traffic model. This involved changing the damper parameters and bearing friction coefficient. The friction coefficient can be considered the quantitative index of bearing performance. In order to improve the viscous dampers on the beam end displacement control effect and reduce the bearing local stress, it is recommended that the bearing deterioration interval be controlled within 0.05.
Acknowledgement: We thank the anonymous reviewers for their careful reading of our manuscript and their many insightful comments and suggestions.
Funding Statement: The research reported in this article was supported by the National Key Research and Development Program of China (No. 2022YFB3706704), the Academician Special Science Research Project of CCCC (No. YSZX-03-2022-01-B).
Author Contributions: The authors confirm contribution to the paper as follows: study conception and design: Qiaowei Ye and Yuan Ren; data collection: Zihang Wang; analysis and interpretation of results: Ying Peng, Xiang Xu and Chao Deng; draft manuscript preparation: Qiaowei Ye and Ying Peng. All authors reviewed the results and approved the final version of the manuscript.
Availability of Data and Materials: The data supporting the results reported in the paper can be accessed from the first author or the corresponding author.
Ethics Approval: Not applicable.
Conflicts of Interest: The authors declare no conflicts of interest to report regarding the present study.
References
1. Steenbergen MJ. Dynamic response of expansion joints to traffic loading. Eng Struct. 2004;26(12):1677–90. doi:10.1016/j.engstruct.2004.05.020. [Google Scholar] [CrossRef]
2. Ni Y-Q, Hua X-G, Wong K-Y, Ko J-M. Assessment of bridge expansion joints using long-term displacement and temperature measurement. J Perform Constr Facil. 2007;21(2):143–51. doi:10.1061/(ASCE)0887-3828(2007)21:2(143). [Google Scholar] [CrossRef]
3. Guo T, Liu J, Zhang Y-F, Pan S-J. Displacement monitoring and analysis of expansion joints of long-span steel bridges with viscous dampers. J Bridge Eng. 2015;20(9):04014099. doi:10.1061/(ASCE)BE.1943-5592.0000701. [Google Scholar] [CrossRef]
4. Guo T, Liu J, Huang L-Y. Investigation and control of excessive cumulative girder movements of long-span steel suspension bridges. Eng Struct. 2016;125(10):217–26. doi:10.1016/j.engstruct.2016.07.003. [Google Scholar] [CrossRef]
5. Wu G-M, Yi T-H, Yang D-H, Li H-N, Liu H. Early warning method for bearing displacement of long-span bridges using a proposed time-varying temperature-displacement model. J Bridge Eng. 2021;26(9):04021068. doi:10.1061/(ASCE)BE.1943-5592.0001763. [Google Scholar] [CrossRef]
6. Ren Y, Ye Q-W, Xu X, Huang Q, Fan Z-Y, Li C, et al. An anomaly pattern detection for bridge structural response considering time-varying temperature coefficients. Structures. 2022;46(12):285–98. doi:10.1016/j.istruc.2022.10.020. [Google Scholar] [CrossRef]
7. Liang LT, Feng ZQ, Chen ZQ, Niu HW, Hua XG. Longitudinal movement characteristics of long span suspension bridge girder and its control based on eddy current dampers. J Earthquake Eng Eng Vibrat. 2020;40(4):118–27. [Google Scholar]
8. Guo H, Hu ST, Liu XG, Su PF. Displacement at girder end of long-span railway steel bridges and performance requirements for bridge expansion joint. In: Ninth International Conference on Advances in Steel Structures; 2018; Hong Kong, China: ICASS. [Google Scholar]
9. Guo T, Huang L, Liu J, Zhou Y. Damage mechanism of control springs in modular expansion joints of long-span bridges. J Bridge Eng. 2018;23(7):04018038. doi:10.1061/(ASCE)BE.1943-5592.0001255. [Google Scholar] [CrossRef]
10. Sun Z, Zhang YF. Failure mechanism of expansion joints in a suspension bridge. J Bridge Eng. 2016;21(10):05016005. doi:10.1061/(ASCE)BE.1943-5592.0000942. [Google Scholar] [CrossRef]
11. Hu J-H, Wang L-H, Song X-P, Sun Z-H, Cui J-F, Huang G-P. Field monitoring and response characteristics of longitudinal movements of expansion joints in long-span suspension bridges. Measurement. 2020;162(12):107933. doi:10.1016/j.measurement.2020.107933. [Google Scholar] [CrossRef]
12. Huang G-P, Hu J-H, Liu H-B, Sun X-G. Girder longitudinal movement and its factors of suspension bridge under vehicle load. Adv Civil Eng. 2021;2021(1):1443996. doi:10.1155/2021/1443996. [Google Scholar] [CrossRef]
13. Li G-L, Han W-S, Chen X, Guo T, Xie Q, Yuan Y-G. Wear evaluation on slide bearings in expansion joints based on cumulative displacement for long-span suspension bridge under monitored traffic flow. J Perform Constr Facil. 2019;34(1):04019106. doi:10.1061/(ASCE)CF.1943-5509.0001388. [Google Scholar] [CrossRef]
14. Xu X, Forde MC, Caballero A, Ren Y, Huang Q. Cost-effective maintenance policy for sliding surfaces of bridge bearings using a gamma stochastic process for forecasting. Struct Cont Heal Monitor. 2023;2023(1):5751636. doi:10.1155/2023/5751636. [Google Scholar] [CrossRef]
15. Xu J, Li J, Ye Y, Xu Y, Li C. Dynamic response of a long-span double-deck suspension bridge and its vibration reduction. Buildings. 2023;13(7):1791. doi:10.3390/buildings13071791. [Google Scholar] [CrossRef]
16. Hongbin S, Jieyi Y, Yujing L. Research on the longitudinal movement and influence of restraint parameters of the long-span suspension bridge’s main girder. Front Mater. 2023;10:1230097. doi:10.3389/fmats.2023.1230097. [Google Scholar] [CrossRef]
17. Yu Z, Xia H, Goicolea JM, Xia C. Bridge damage identification from moving load induced deflection based on wavelet transform and Lipschitz exponent. Int J Struct Stab Dyn. 2016;16(5):1550003. doi:10.1142/S0219455415500030. [Google Scholar] [CrossRef]
18. Lan Y, Li Z, Lin W. Physics-guided diagnosis framework for bridge health monitoring using raw vehicle accelerations. Mech Syst Signal Process. 2024;206:110899. doi:10.1016/j.ymssp.2023.110899. [Google Scholar] [CrossRef]
19. Lan Y, Li Z, Koski K, Fülöp L, Tirkkonen T, Lin W. Bridge frequency identification in city bus monitoring: a coherence-PPI algorithm. Eng Struct. 2023;296(2):116913. doi:10.1016/j.engstruct.2023.116913. [Google Scholar] [CrossRef]
20. Wang F-Y, Xu Y-L. Traffic load simulation for long-span suspension bridges. J Bridge Eng. 2019;24(5):05019005. doi:10.1061/(ASCE)BE.1943-5592.0001381. [Google Scholar] [CrossRef]
21. Yang G, Chen S, Wang J, Zhang S. Mapping model between lateral responses of bridges under random traffic loads based on data-driven approach. Intell Transport Infrastruct. 2024;3:liae005. doi:10.1093/iti/liae005. [Google Scholar] [CrossRef]
22. Ni YQ, Wang YW, Zhang C. A Bayesian approach for condition assessment and damage alarm of bridge expansion joints using long-term structural health monitoring data. Eng Struct. 2020;212(1):110520. doi:10.1016/j.engstruct.2020.110520. [Google Scholar] [CrossRef]
23. Deng Y, Ding YL, Li AQ. Structural condition assessment of long-span suspension bridges using long-term monitoring data. Earthq Eng Eng Vibrat. 2010;9(1):123–31. doi:10.1007/s11803-010-9024-5. [Google Scholar] [CrossRef]
24. Wang G, Ding Y, Guo H, Zhao X. Safety evaluation of the wear life of high-speed railway bridge bearings by monitoring train-induced dynamic displacements. Shock Vib. 2018;2018(1):6479480. doi:10.1155/2018/6479480. [Google Scholar] [CrossRef]
25. Sun B, Xu Y-L, Wang F-Y, Li Z, Zhu Q. Multi-scale fatigue damage prognosis for long-span steel bridges under vehicle loading. Struct Infrastruct Eng. 2019;15(4):4. doi:10.1080/15732479.2018.1562478. [Google Scholar] [CrossRef]
26. Caprani CC, OBrien EJ, Lipari A. Long-span bridge traffic loading based on multi-lane traffic micro-simulation. Eng Struct. 2016;115(93):207–19. doi:10.1016/j.engstruct.2016.01.045. [Google Scholar] [CrossRef]
27. Nylund KL, Asparouhov T, Muthén BO. Deciding on the number of classes in latent class analysis and growth mixture modeling: a Monte Carlo simulation study. Struct Equ Model: A Multidiscip J. 2007;14(4):535–69. doi:10.1080/10705510701575396. [Google Scholar] [CrossRef]
28. Ala N, Power EH, Azizinamini A. Experimental evaluation of high-performance sliding surfaces for bridge bearings. J Bridge Eng. 2016;21(2):04015034. doi:10.1061/(ASCE)BE.1943-5592.0000708. [Google Scholar] [CrossRef]
29. Ala N, Power EH, Azizinamini A. Predicting the service life of sliding surfaces in bridge bearings. J Bridge Eng. 2016;21(2):04015035. doi:10.1061/(ASCE)BE.1943-5592.0000767. [Google Scholar] [CrossRef]
30. Gibe HA, Tamai H, Sonoda Y. Numerical study on failure process and ultimate state of steel bearing under combined load. Heliyon. 2020;6(4):e03764. doi:10.1016/j.heliyon.2020.e03764. [Google Scholar] [PubMed] [CrossRef]
Cite This Article
 Copyright © 2025 The Author(s). Published by Tech Science Press.
This work is licensed under a Creative Commons Attribution 4.0 International License , which permits unrestricted use, distribution, and reproduction in any medium, provided the original work is properly cited.
 Downloads
 Citation Tools