
 Submit a Paper
 Propose a Special lssue
 Open Access
ARTICLE

Hydration Heat Analysis and Crack Control of Composite Box Girders with Corrugated Steel Webs in Prefabrication
1 China Construction Sixth Engineering Bureau Co., Ltd., Tianjin, 300000, China
2 China Construction Bridge Co., Ltd., Chongqing, 400000, China
3 School of Water Conservancy and Transporation, Zhengzhou Unversity, Zhengzhou, 450001, China
* Corresponding Author: Ke Jiao. Email:
(This article belongs to the Special Issue: Sensing Data Based Structural Health Monitoring in Engineering)
Structural Durability & Health Monitoring 2025, 19(4), 985-1010. https://doi.org/10.32604/sdhm.2025.061554
Received 27 November 2024; Accepted 13 February 2025; Issue published 30 June 2025
 View Full Text
 Download PDF
Abstract
This study examines the temperature field distribution characteristics and temperature effects during the prefabrication of composite box girders with corrugated steel webs (CBGCSWs), aiming to provide practical recommendations for controlling temperature-induced cracking and technical guidance for concrete mix proportions and placement processes. Based on field measurement data, a three-dimensional finite element model was developed to simulate the temperature effects at critical locations during the prefabrication phase. By varying the concrete mix proportions, initial casting temperature, and ambient temperature, the study elucidates the variation patterns of the temperature field during precast placement. The results show that the temperature rise caused by hydration heat increases with higher cement and fly ash content, whereas reducing cement and using minimal fly ash effectively lower the hydration temperature. However, the influence of fly ash on prestress losses should be carefully evaluated during the design phase. Higher initial casting temperatures accelerate hydration rates, leading to a rapid temperature rise. Significant differences between the initial casting and ambient temperatures result in larger residual temperature stresses. Based on concrete mix proportions, curing conditions, and ambient temperatures, three recommended casting temperature ranges were identified: 5°C–10°C, 10°C–25°C, and 25°C–30°C. Variations in the average ambient temperature affect the peak temperature of the hydration reaction and indirectly influence the final temperature distribution of the concrete structure. Optimizing the demolding time and applying geotextiles and water curing effectively reduces the peak temperature, maximum internal-to-surface temperature gradients, and surface tensile stresses, thereby mitigating the risk of temperature-induced cracking.Keywords
Composite box girders with corrugated steel webs (CBGCSWs) are favored in bridge construction due to their lightweight design and efficient force transmission [1–3]. However, the hydration heat reaction of cement causes a rapid internal temperature increase, leading to significant temperature gradients between the surface and core. These gradients induce temperature-induced shrinkage cracks, exacerbated by the high thermal conductivity of steel, which is approximately 50 times that of concrete [4,5]. Controlling temperature-induced cracks and managing hydration heat are therefore crucial to ensuring the structural integrity of CBGCSWs [6–8]. Despite the importance of these issues, there remains a lack of standardized technical specifications and construction process guidelines for the prefabrication of CBGCSWs. This gap underscores the need for comprehensive research on hydration heat analysis and crack control measures, particularly in the context of optimizing the thermal performance of these composite structures.
At present, studies on the temperature behavior of concrete mainly focus on the thermal temperature field in the casting stage of mass concrete [9–13], the environmental temperature field [14], and the solar temperature gradient field in the usage stage of concrete bridges [15–17], the temperature field of cast-in-place zero block [18,19], temperature gradient field [20–24] of CBGCSWs and so on. However, limited research addresses the temperature effects of CBGCSWs during prefabrication. The 50 m long inclined web PC composite box girder with corrugated steel webs and concrete lining at the end of the project is rare in engineering cases. Based on the research above, this study focuses on the National Highway 240 Fanxian Yellow River Highway Bridge and its connecting projects. Using actual working conditions and field-measured data, a three-dimensional temperature field simulation model is established to explore the temperature and stress field distribution characteristics of corrugated steel web composite box girder bridges during the prefabrication stage. The study investigates the temperature effects of these structures, analyzing the influence of concrete mix proportions, pouring temperature, and ambient temperature on concrete temperature effects. Reasonable recommendations for controlling temperature-induced cracks in concrete are summarized and proposed. The findings provide technical guidance for concrete mix design and placement, offering valuable references for future design and construction.
National Highway 240 Fanxian Yellow River Highway Bridge and its wiring project wind through for 15.6 km, with 36 links and 145 spans. Among them, the approach bridge in the north embankment has a total of 13 links and 50 spans. The span arrangement is 2 × (3 × 47 m) + (4 × 47 m) + 10 × (4 × 50 m), while the superstructure adopts 50 (47) m assembled CBGCSWs, which initially simply supported and then continuous, with three beams in a single frame. Three diaphragms were set for each beam. The corrugated steel web adopted Q355D (thickness: 9–10 mm) and 1200 type. It has a flat width of 330 mm, a slanted width of 336 mm, a slanted horizontal length of 270 mm, and a wave height of 200 mm. The longitudinal section of the 1/2 span of the 50 m long corrugated steel webs of the middle span side beam is shown in Fig. 1.

Figure 1: Longitudinal section of 1/2 span of 50 m long corrugated steel webs of middle span side beams (mm)
The corrugated steel web is situated between the concrete roof and the bottom plate attached to the embedded connection. The web was connected with lining concrete and diaphragm by 22 × 150 welded nails. The cross-section of the inner side beam diaphragm position is shown in Fig. 2.

Figure 2: Cross-sectional view of inner side beam (mm)
The region belongs to the temperate semi-dry early climate zone, with four distinct seasons, dry and less rain in spring, hot and rainy in summer, cool and dry in autumn, cold and less snow in winter. The maximum temperature is 42.6°C and the minimum temperature is −19.3°C over the years. The average annual temperature is 13.1°C.
2.2 Test of Concrete Mix Proportion
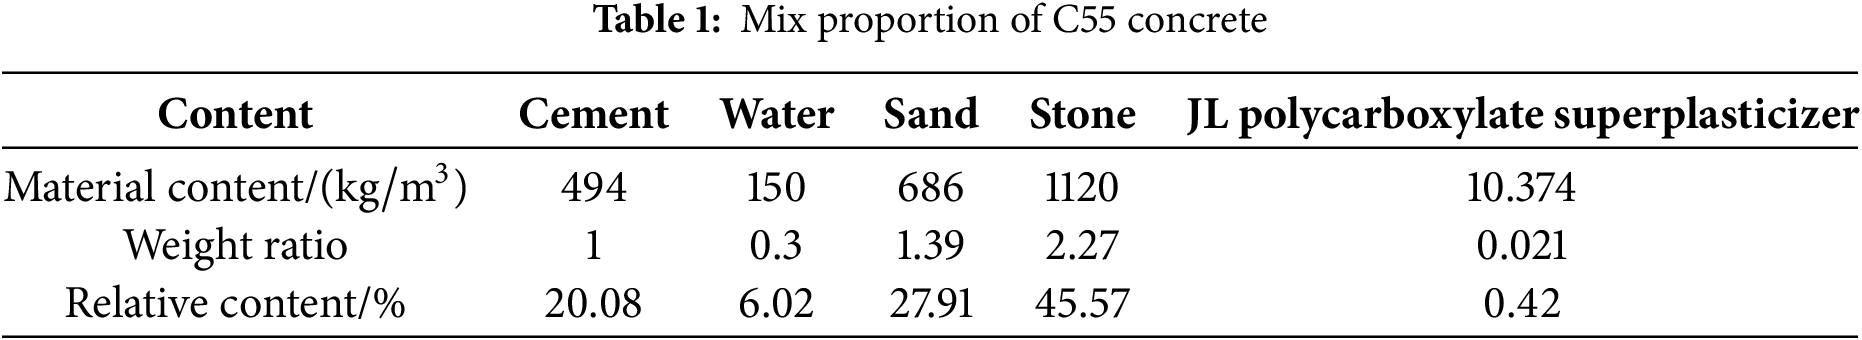
C55 concrete mix ratio design was carried out for a 50 m long precast corrugated steel web PC composite beam. The ratio calculation and detection method were based on references [25,26], and the determination of physical and mechanical parameters such as strength referred to [27]. Cement used P.052.5 grade ordinary portland cement produced by Henan Tongli Cement Co., Ltd. (Hebi, China); coarse aggregate was taken from 5–20 mm continuous graded gravel produced by Anyang Zhonglian Aggregate Co., Ltd. (Anyang, China); fine aggregate was used from river sand produced by Dawenhe sand chief of Tai’an, Shandong, China, with the fineness modulus of 2.5; water was tap water; JL polycarboxylate superplasticizer was used as admixture, purchased from Kunming Jinli Industry and Trade Co. (Kunming, China). The main material dosage of C55 concrete used in the project is shown in Table 1. The water-cement ratio was 0.3, sand ratio was controlled at 38%.
The design slump was 180–220 mm, which was determined according to G240-41 slump tester. A 150 mm × 150 mm × 150 mm standard test block is made (Fig. 3a). In order to ensure that the concrete can harden normally and increase its strength, standard curing is carried out, as shown in Fig. 3b. Based on references [25,26], the compressive strength of 7-day age was 62.3 MPa, and the compressive strength of the 28-day age was 67.3 MPa, which reached 103.7% of the preparation strength and met the design requirements. The mix ratio obtained by the experimental study can be used for the on-site prefabrication of 50 m long prefabricated corrugated steel web PC composite beams.

Figure 3: Manufacture and maintenance of concrete cube test block
Using the finite element software MIDAS FEA NX, a finite element model of a corrugated steel web composite beam was established to analyze the temperature and stress fields of the composite box girder concrete during prefabrication. The model includes the corrugated steel web composite beam (top slab, bottom slab, and diaphragms poured simultaneously), the girder construction platform, and the subgrade soil. Solid elements were used to simulate the reinforced concrete components of the composite beam, the construction platform, and the subgrade soil, with a hybrid mesh of tetrahedral and hexahedral elements. The corrugated steel web was modeled using plate elements. The overall model comprises 172,474 nodes and 164,304 elements. The mesh size of the corrugated steel web beam was controlled between 0.083 and 0.12 m to improve simulation accuracy, while the maximum mesh size for the construction platform and subgrade soil was set at 0.2 m.
To directly observe and analyze the variations in the temperature field and thermal stress after the hydration heat reaction, a 1/2 model of a 50-m assembled CBGCSW was established, considering the structural symmetry. The numerical model is shown in Fig. 4. Since the relative slip between the concrete top slab, bottom slab, and the corrugated steel web is minimal, and the stud connectors in the contact area between the steel web and concrete are densely arranged, the slip effect between these components can be disregarded [28]. Thus, the steel-concrete interaction in the model is treated as a common joint connection.

Figure 4: 1/2 model of composite beam
Based on the characteristics of CBGCSW in this article, the following boundary conditions were set referring to the setting method of boundary conditions of the symmetric model of hydration heat analysis in references [29–32]:
(1) Boundary condition of support
When the heat generated by the superstructure is fully transferred to the foundation, the temperature is no longer transferred and there is no temperature differential, so there will be no relative displacement. Thus, fixed constraint boundaries were imposed on the three sides (asymmetric plane) and the bottom of the foundation soil in the model.
(2) Boundary condition of symmetry
In the modeling, symmetry is considered and a 1/2 model is adopted, which belongs to the unidirectional symmetric structure model. Normal displacement constraint was applied to the composite beam, pedestal foundation, and foundation on a symmetric plane.
(3) Boundary condition of adiabatic
When no data related to environmental heat transfer is input, it defaults to an adiabatic boundary, which mainly reflects that heat transfer only occurs inside the concrete structure and does not dissipate externally. The symmetry plane of the model belongs to this type of boundary.
(4) Boundary condition of convection
Convection boundary (heat conduction boundary) refers to the heat exchanged with the outside at each time defined by the convective coefficient, which is realized by inputting different convection coefficients to different contact media. During prefabrication, steel formwork is used on the core and surface, and the top surface is exposed to the air (maintenance measures of geotextile are set after the prefabrication). In the simulation, the corresponding convection boundaries of steel formwork geotextile and air are set at different locations and times according to the specific situation on site.
(5) Boundary condition of fixed temperature
The fixed temperature boundary condition means that the temperature at the boundary is constant and does not change over time. To ensure that the temperature differential between the core and the surface of the concrete structure will be reasonable which would prevent the appearance of large temperature stress, the boundary was set at the fixed constraint boundary position of the bottom foundation.
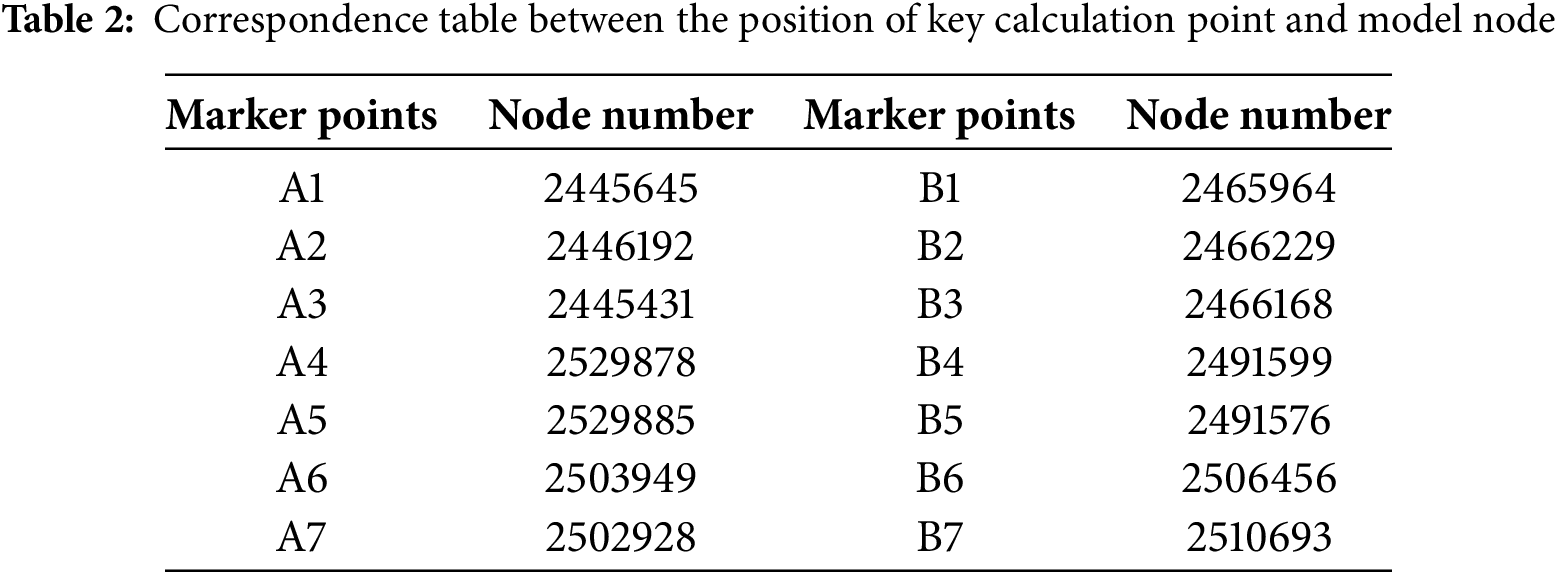
The key calculation points for the numerical model of the structure were selected. Two cross-sections were intercepted in the overall model. There are 7 key points on markers A1–A7 in the first section (Concrete with lining) and 7 key points on the markers B1–B7 in the second section (Inter-span diaphragm), as shown in Fig. 5. Corresponding node numbers of key points in the model are listed in Table 2.

Figure 5: Settings of key calculation points
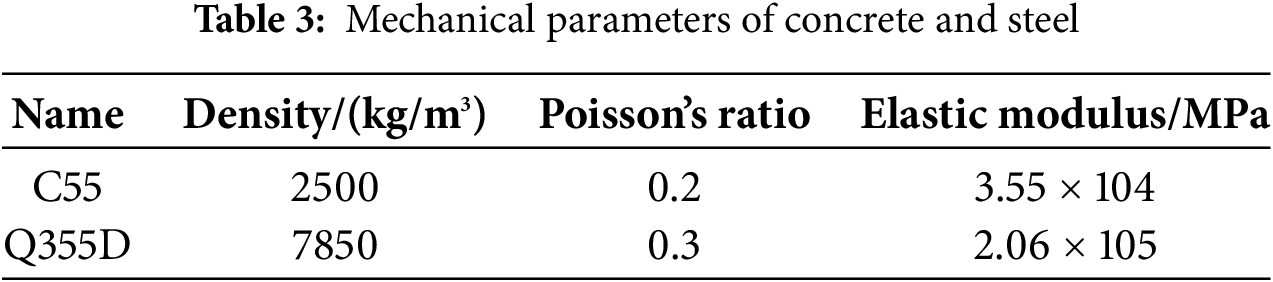
In the finite element model, the concrete is considered an isotropic homogeneous material, and the influence of internal reinforcement on the temperature distribution caused by hydration heat is ignored [33,34]. The mechanical properties of C55 concrete and Q355D steel used in the project are shown in Table 3.
3.3 Correlative Parameters of Hydration Heat Calculation
(1) Ambient temperature
Prefabrication of CBGCSWs is mainly concentrated in summer and autumn when the environment is relatively high. To study the impact of external environmental conditions on the hydration heat effect, temperature data from the meteorological station at the bridge site were analyzed, extracting temperature change curves for June and September over the past two years, as shown in Fig. 6.

Figure 6: Comparison of daily maximum and minimum temperatures in a single month
As illustrated in Fig. 6, the highest recorded temperature in June reaches 40°C, while the lowest drops to 15°C. The average monthly high is 34°C, and the average monthly low is 22°C, resulting in a maximum day-night temperature differential of 18°C. In September, the highest temperature recorded is 33°C, the lowest is 14°C, with an average monthly high of 29°C and a monthly low of 17°C, leading to a maximum temperature differential of 16°C between day and night.
The temperature variation over time for two typical days in June is presented in Fig. 7, demonstrating a pattern that closely follows a sine curve. The corresponding function expression is provided in Eq. (1).

Figure 7: 24-h ambient temperature on a certain day in June
(2) Temperature of concrete casting into the mold
The initial temperature of concrete pouring is the pouring-to-mold temperature. Considering the friction with pipe walls during transportation and pumping, the influence of outside air temperature on aggregate, and other factors, ice treatment is often carried out in the mixing process to reduce the mold temperature. Therefore, the initial temperature of the model was tentatively set at a certain value of 20°C, and the value will be analyzed in detail in subsequent chapters.
(3) Thermal parameters
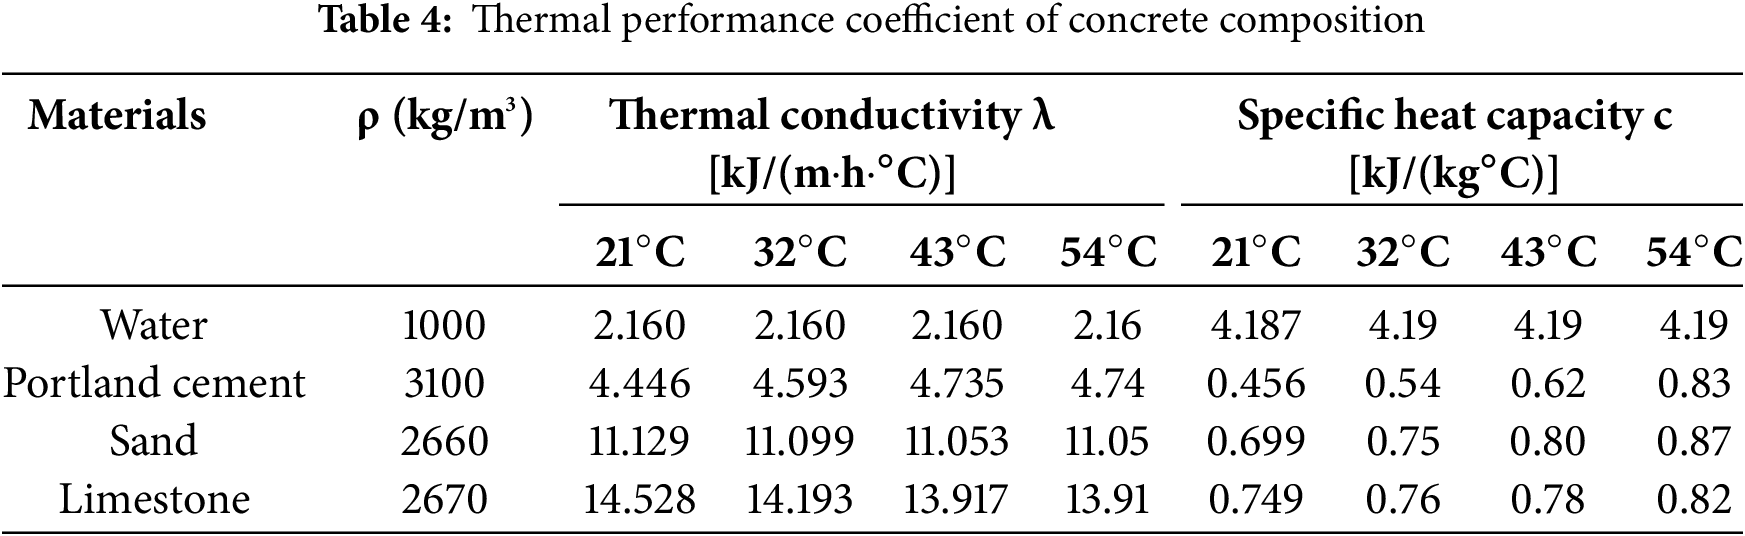
The thermal performance was estimated according to the weight ratio of each component of concrete. Combined with reference [33], the thermal performance coefficients of each component can be obtained (Table 4). Then, weighted calculations were carried out based on the concrete mix ratio, and the thermal parameters corresponding to each component material. Thus, the specific heat coefficient, heat transfer coefficient, and thermal conductivity coefficient of concrete can be obtained. At the same time, reference [35] pointed out that through a large number of tests and field monitoring data, it is found that the thermal performance parameters recommended by reference [35] are more universal in estimating the thermal conductivity, which is consistent with the actual situation, but the estimated specific heat is low, which can be adjusted by multiplying the correction factor of 1.05. Finally, the thermal conductivity
(4) Adiabatic temperature rise
When the use of mixture is not considered, the adiabatic temperature rise at the concrete age t is calculated according to Eq. (2):
where W is taken as 494 kg/m3, which is the amount of cementitious material used per unit of concrete. Q0 is taken as 461 kJ/kg, which is the total hydration heat per unit mass of concrete cementitious material [35]. c is the specific heat capacity of concrete, taken as 0.961. ρ is the density of concrete; t is the age of concrete; m is taken as 0.362, which is the reaction rate coefficient at 20°C.
When considering the use of mixture, the adiabatic temperature rise of concrete is calculated according to Eq. (3):
where Q(t) is the cumulative heat of hydration of cement [35], which is also taken as 461 kJ/kg; k is the reduction factor, which is 0.25 when adding fly ash; F represents the total amount of mixture.
(5) Boundary convection coefficient
When the concrete is in contact with air, the heat flux on the surface of the cement can be expressed as follows:
where η refers to the outer normal direction of the concrete surface. Assume that the heat flow on the concrete surface is proportional to the differential between the concrete surface temperature T and the ambient air temperature Ta, i.e.,
where η is the direction of the external normal of the concrete surface; β is the heat release coefficient of the concrete surface.
For rough surfaces
For smooth surfaces
where va represents wind speed (m/s).
The heat release coefficient of concrete surface is related to the actual wind speed. When template or insulation layer exists on the concrete surface, their influence on temperature effect can be considered by equivalent heat release coefficient βs. The equivalent heat release coefficient of different insulation materials can be calculated according to Eq. (8).
where λi, hi refers to the thermal conductivity and thickness of the surface covering material of concrete.
Combined with the statistics of wind speed on-site, the wind of magnitude 3–4 is mostly in this area in a year. Based on the relationship between wind level and speed, it is estimated that the annual average wind speed at the construction site is about 5.6 m/s. While it is assumed that the internal wind speed of the box girder is 0 m/s considering the relatively closed internal surface. Steel formwork with a thickness of 5 mm was used on the external and internal surfaces of the construction, and the thermal conductivity of the steel formwork is 163.29 kJ/(m·h·°C). The equivalent heat release coefficients of concrete steel formwork outside the box girder are 97.28 kJ/(m2
4.1 Analysis of Temperature Field Variation
Referring to [19] and [31], combined with the model boundary conditions, material mechanics, hydration heat parameters, and the actual engineering situation in Section 2, simulation was carried out based on the established model.
The temperature field results within 45 days from the beginning of pouring to the completion. The temperature field cloud diagram of representative time nodes is shown in Fig. 8.


Figure 8: The temperature change cloud diagram of the composite beam after concrete casting
(1) Since the ambient temperature was set at 30°C, the initial temperature of the concrete when poured into the mold was 20°C. The heat source function was activated simultaneously with the concrete pouring. Once initiated, the hydration heat reaction in the composite box girder caused its temperature to rise. The temperature of the top and bottom slabs, webs, and diaphragm center continued increasing, exceeding the ambient temperature. Moreover, the most significant temperature rise was concentrated in the lining concrete area at both ends. The peak concrete temperature reached 47.86°C on the 2nd day after pouring (the 2nd day of the hydration heat reaction). Over time, the temperature at the core of the concrete gradually decreased from its peak, and the overall temperature of the concrete, pedestal, and lower foundation approached the ambient temperature.
(2) Although the interior of the box girder exhibits relatively poor convective heat dissipation due to its enclosed space, the top and bottom slabs in the central region of the structure are thinner. Additionally, the corrugated steel web is thinner than the concrete web, providing superior heat conduction performance. Consequently, the steel formwork has limited thermal insulation capacity. As a result, even though the maximum adiabatic temperature rise of the concrete mix ratio used in the field reached 96.273°C (calculated according to Eq. (3)), the overall temperature rise of the composite box girder did not reach its theoretical maximum. This indirectly demonstrates that the corrugated steel web composite beam structure exhibits better heat dissipation.
4.2 Analysis of Temperature and Stress Time History from Key Nodes
The temperature time history changes of key calculation points. A1–A7 and B1–B7 sections are shown in Figs. 9 and 10.

Figure 9: Temperature time history diagram of A1–A7 after pouring

Figure 10: Temperature time history diagram of B1–B7 after pouring
(1) As is shown in Fig. 9, for the sections of A1–A7, A1, and A3 reached the maximum values of 33.65°C and 34.08°C respectively on the 2nd day after pouring. Due to the thinness of the middle part of the roof and the flange, they gradually decreased in the process of heat exchange and heat dissipation with the ambient temperature and approached the ambient temperature of 30°C on about the 12th day. There is relatively more concrete around A2, A4, A5, A6, and A7, and the heat dissipation performance was weak, so the temperature rise was relatively large. A2, A4, and A5 all reached the maximum temperature rise of 42.59°C, 47.15°C and 47.50°C on the 2nd day of the heat of hydration reaction, respectively, while A6 and A7 reached the maximum temperature rise of 43.29°C and 45.60°C on the third day of the heat of hydration reaction, respectively. At the same time, due to the existence of lining concrete, the temperature difference between the inner surface of A4 and A5 was large, and the maximum temperature appreciation was obviously higher than that of other monitoring points. After each node reached the maximum temperature rise, the hydration heat reaction reached its limit, and the temperature gradually decreased under the action of convection heat transfer.
(2) As shown in Fig. 10, for cross-sections B1–B7, the maximum temperatures recorded for B1, B2, B3, B4, B5, and B6 were 33.5°C, 36.7°C, 36.5°C, 33.3°C, 33.4°C, and 35.9°C, respectively, on the 2nd day of the hydration heat reaction. These temperatures then gradually decreased as heat dissipated to the ambient environment, eventually approaching the ambient temperature of 30°C between the 11th and 14th day. B7 recorded a peak temperature of 37.7°C on the third day of the hydration heat reaction.
By analyzing the temperature rise variations in both sections, it was observed that thinner structural areas exhibited better heat transfer performance, allowing them to reach their peak temperature more quickly. In contrast, thicker sections or areas with limited convection experienced a slower temperature rise but attained a higher peak temperature. Since the concrete diaphragm in section B1–B7 enhanced the heat dissipation capability of the composite beam, the maximum temperature rise in this section was significantly lower than that in the concrete lining areas at both ends. Additionally, both A7 and B7, located near the pedestal and enclosed above the box girder, exhibited the slowest rate of temperature reduction after reaching their peak temperature.
The change of temperature stress at key calculation points of sections A1–A7 and B1–B7 with time is shown in Figs. 11 and 12.

Figure 11: The main tensile stress of A1–A7 key nodes varies with time


Figure 12: The main tensile stress of B1–B7 key nodes varies with time
(1) At calculation points A1 and A3, located at the flange position and the central area of the concrete roof, the temperature-induced tensile stress increased rapidly as the hydration heat reaction caused the internal temperature to exceed the ambient temperature. The stress reached its peak value of 2 MPa on the third day (Fig. 11). Subsequently, the tensile stress at this location gradually decreased and stabilized over time. The absolute temperature stress at this point was the highest among the tensile stress values. However, since the temperature-induced stress remained below the allowable tensile stress limit, cracking did not occur at this position.
(2) The concrete in the areas of A2, A4, A5, A6, and A7 is relatively thick, which consequently hampers efficient heat dissipation. As a result, the temperature stress underwent only a negligible alteration (Fig. 12). Both the tensile stress and compressive stress fluctuated in the range of absolute value of 0.25 MPa, which is far less than the allowable tensile stress. Since the compressive stress of concrete is larger, the risk of fracturing is even less.
As for Fig. 12, the law of variation is similar to Fig. 11, but the maximum temperature rise of the diaphragm position is smaller than that of the concrete lining area at both ends, so the maximum stress is relatively smaller.
5 Analysis of Sensitive Factors
5.1 Influence of Different Concrete Mix Ratios on Temperature Effect
The impact of various concrete mix ratios on the hydration heat temperature field and stress field was analyzed, considering the mix ratio as the sole variable. The design conditions are listed in Table 5. The effect of varying cement content on the heat generation and temperature stress from the hydration reaction was primarily examined in conditions 1 to 3. Meanwhile, the influence of different fly ash ratios (11.3%, 15%, and 18.3%) on heat generation and temperature stress was evaluated in conditions 4 to 6.
The hydration heat reaction of different working conditions was analyzed by selecting the top and bottom A1 and A3 points in the numerical model of the concrete structure. The calculation results are shown in Fig. 13.

Figure 13: Influence of different concrete ratios on the temperature-time history of key nodes
The data presented in Fig. 13 indicates that the adiabatic temperature rise varied depending on the concrete mix ratio. The higher the adiabatic temperature rose, the higher the heat generated by the hydration reaction in the center of the concrete, and the higher the temperature of the concrete. After the hydration reaction occurred, the highest temperature was basically reached on the 2nd day after concrete casting under each working condition. As the degree of hydration heat reaction weakened, the maximum temperature at the reference point began to decrease gradually. The linear change of temperature was basically the same on the 12th day after pouring, and it is consistent with the ambient temperature.
The temperature data in the calculation results were compared and analyzed.
(1) In contrast with working conditions 1, 2 and 3, the amount of cement affects the heat generated by the hydration reaction. The higher the amount of cement, the higher the temperature of the reaction;
(2) Compared with working conditions 4, 5, and 6, the less fly ash is used, the lower the temperature of the hydration heat reaction produces. It can also be seen from Fig. 10 that the hydration heat can be effectively reduced by using a small amount of fly ash and reducing the amount of cement.
According to the time history change of temperature stress at the reference point in Fig. 14, the calculated adiabatic temperature rise was different due to the different mix ratios of concrete. The higher the adiabatic temperature rise, the higher the heat generated by the hydration reaction in the center of the concrete, and the higher the temperature stress.

Figure 14: Influence of different concrete ratios on the temperature stress time history of key nodes
Based on the data of conditions 1 to 3, the greater the amount of cement, the higher the heat generated by the hydration reaction which made the concrete center produce a large compressive stress. According to the data of working conditions 4 to 6, the less the amount of fly ash used, the lower the heat generated by the hydration reaction, which can effectively reduce the tensile stress of concrete and prevent the occurrence of cracks.
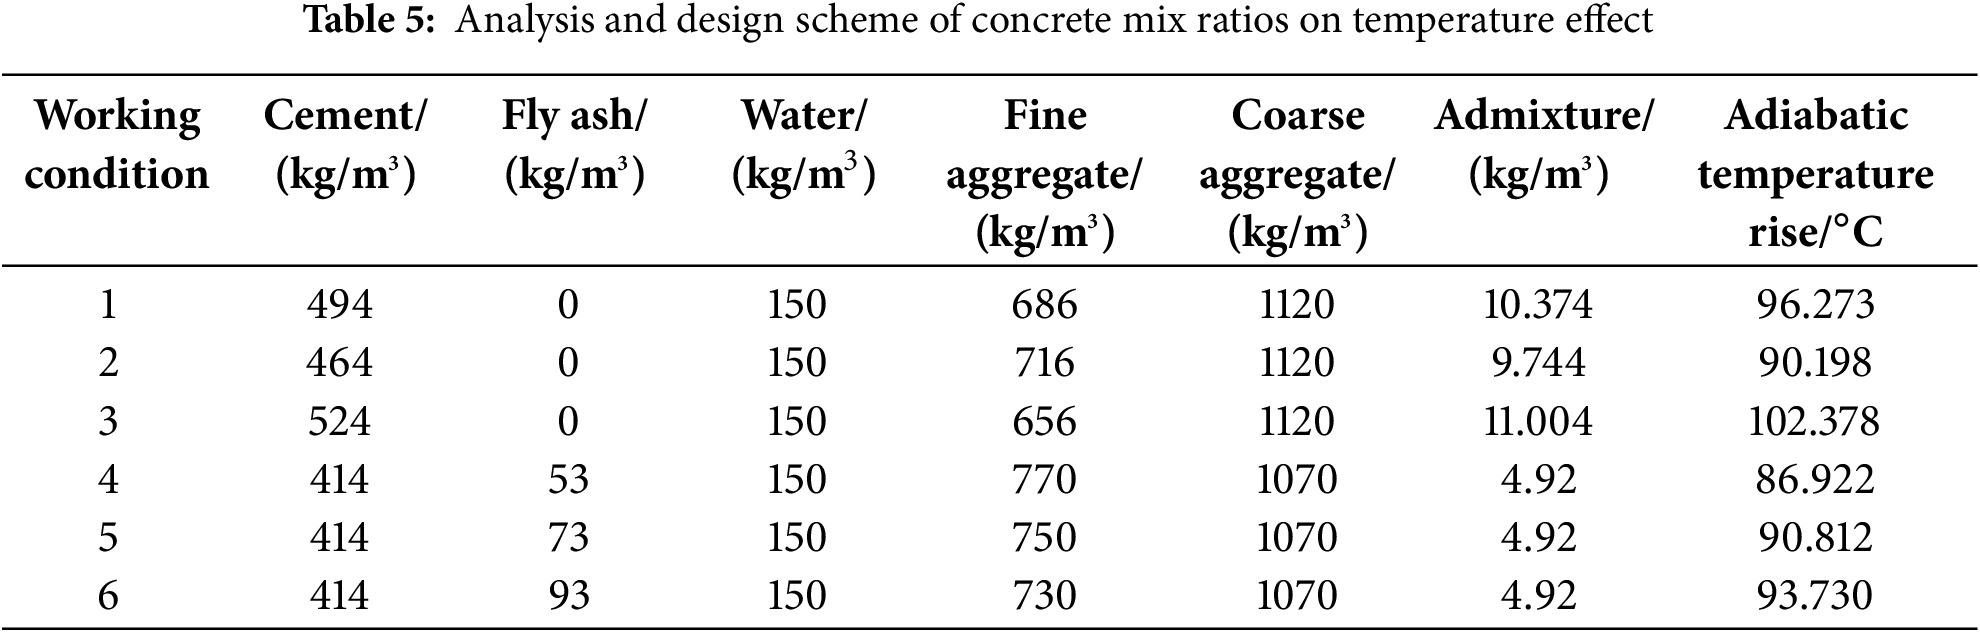
5.2 Influence of Different Initial Pouring Temperatures on Temperature Effect
When the initial temperature of concrete casting was defined as the only variable, the influence of the initial temperature on the temperature stress and heat generated by the hydration reaction was analyzed. Table 6 compares the working conditions because the initial temperature of casting mainly affects the hydration reaction coefficient m.

Similarly, A1 and A3 on the top and bottom plates of the structural model were extracted to analyze. The changes in temperature stress and temperature are depicted in Figs. 15 and 16.

Figure 15: Influence of different initial casting temperatures on temperature time history of key nodes
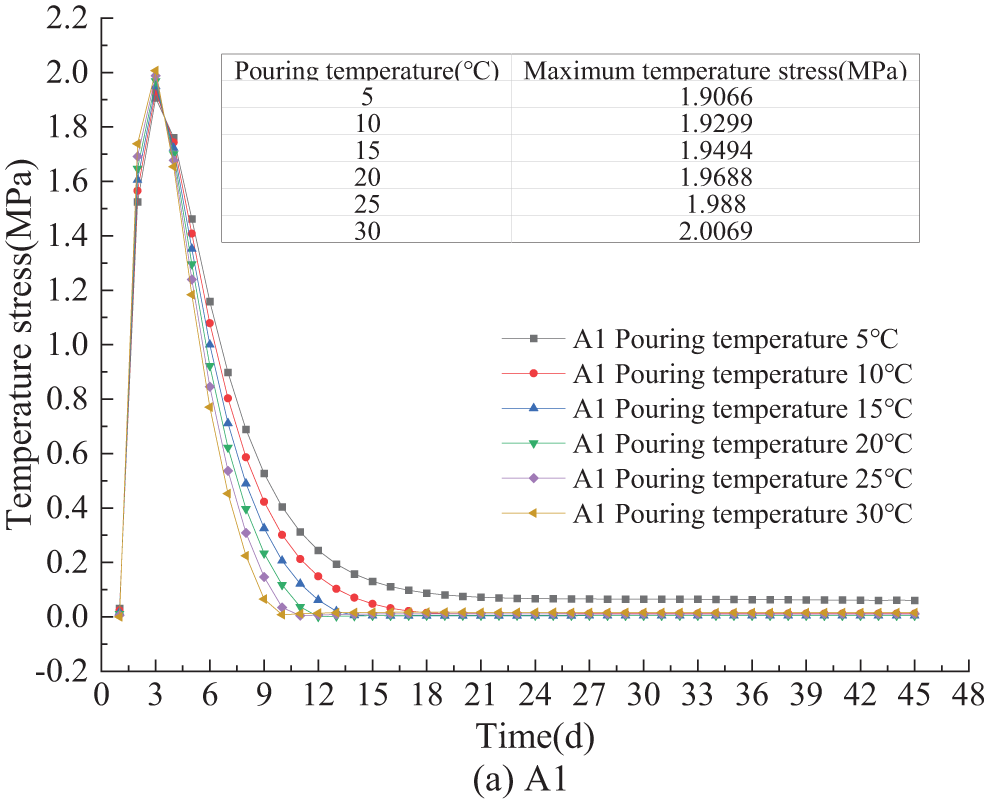
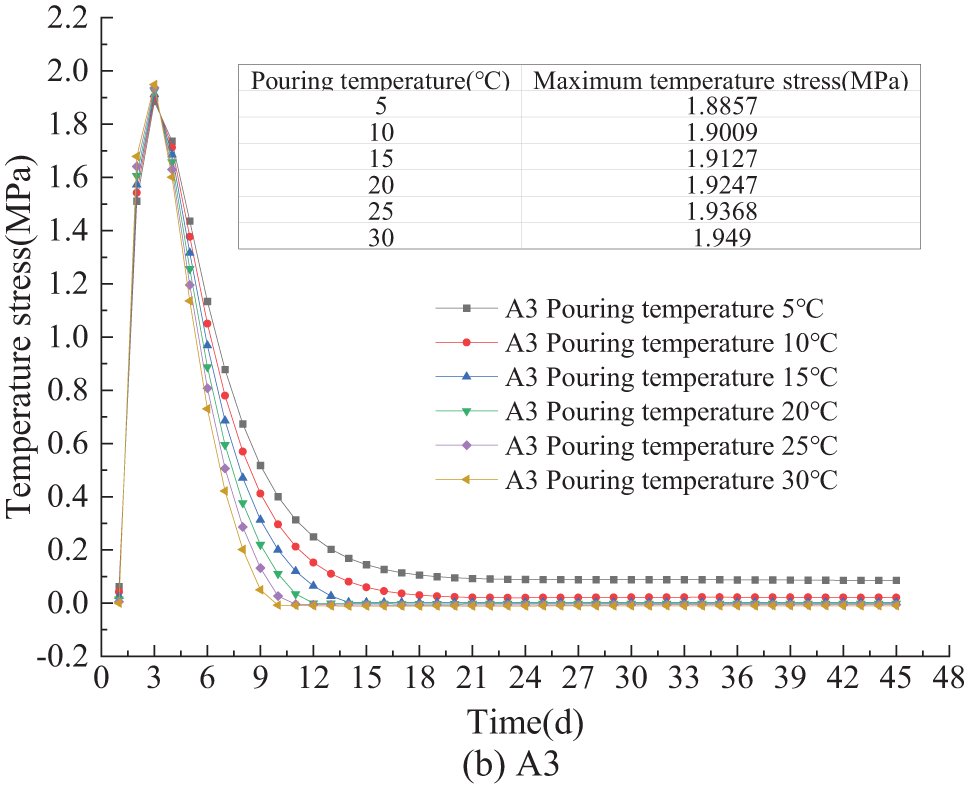
Figure 16: Influence of different initial casting temperatures on temperature stress time history of key nodes
As is shown in Fig. 15, different initial pouring temperatures had a great influence on the maximum temperature generated by the hydration heat reaction of concrete. Before the hydration heat of the concrete structure did not occur, the temperature of the key points A1 and A3 of the top and bottom plates of the concrete structure first changed to the ambient temperature, and then after the hydration heat occurred, the temperature of the concrete center rose rapidly until the temperature peak, and finally slowly decreased to about the 12th day. The consistent linear law is maintained until it approaches the ambient temperature. From the slope of the curve, the higher the molding temperature, the shorter the time to reach the highest temperature inside the structure, indicating that the higher the molding temperature, the faster the hydration rate, the faster the heat production rate, and the faster the temperature rise.
In actual construction, ice can be added to concrete to reduce the initial temperature of concrete pouring, thus the maximum temperature of concrete hydration heat can be effectively reduced [36,37].
According to Fig. 16, the initial temperature of casting has little effect on the thermal stress. When the initial temperature is 5°C, 10°C, 15°C, 20°C, 25°C, and 30°C, the temperature stress of A1 varied from 1.9 to 2.0 MPa, while that of A2 varied from 1.89 to 1.95 MPa. Although the effect of different initial casting temperatures on the thermal stress of concrete structures is not particularly large, it is suggested that the initial temperature should be controlled at a lower temperature during construction, which can effectively reduce the temperature cracks formed by the thermal stress of concrete [38–40].
As shown in Fig. 15, at key points A1 and A3, with an ambient temperature of 30°C, the residual stress in the stable phase of temperature stress remains similar when the initial pouring temperature exceeds 5°C. However, at an initial pouring temperature of 5°C, the residual stress is significantly higher than in other cases. This indicates that a substantial difference between the pouring temperature and ambient temperature can influence residual stress levels during the stable phase of temperature stress. When the pouring temperature is excessively high, it accelerates the cement hydration reaction, leading to heat accumulation within the structure and the formation of temperature gradients. Additionally, higher temperatures cause rapid water evaporation, increasing the risk of dry shrinkage cracks. Conversely, when the pouring temperature is too low, the hydration reaction slows significantly, particularly in the early stages after concrete placement. This results in delayed strength development, potentially preventing the concrete from adequately supporting its self-weight, construction loads, or external forces, which may lead to deformation, cracking, or other structural defects. Therefore, both excessively high and low pouring temperatures, along with substantial differences between the pouring and ambient temperatures, can compromise the safety and stability of concrete structures.
5.3 Influence of Different Average Ambient Temperatures on Temperature Effect
The ambient temperature around concrete is defined as the only variable, and the influence of ambient temperature on heat generated by hydration reaction temperature and thermal stress is analyzed when the ambient temperature is 5°C, 10°C, 15°C, 20°C, 25°C, 30°C and 40°C. Similarly, A1 and A3 from the top and bottom plates of the structural model were extracted to analyze the hydration reaction at different average ambient temperatures. The calculation results are shown in Figs. 17 and 18.


Figure 17: Influence of different average temperature on the temperature-time history at key nodes
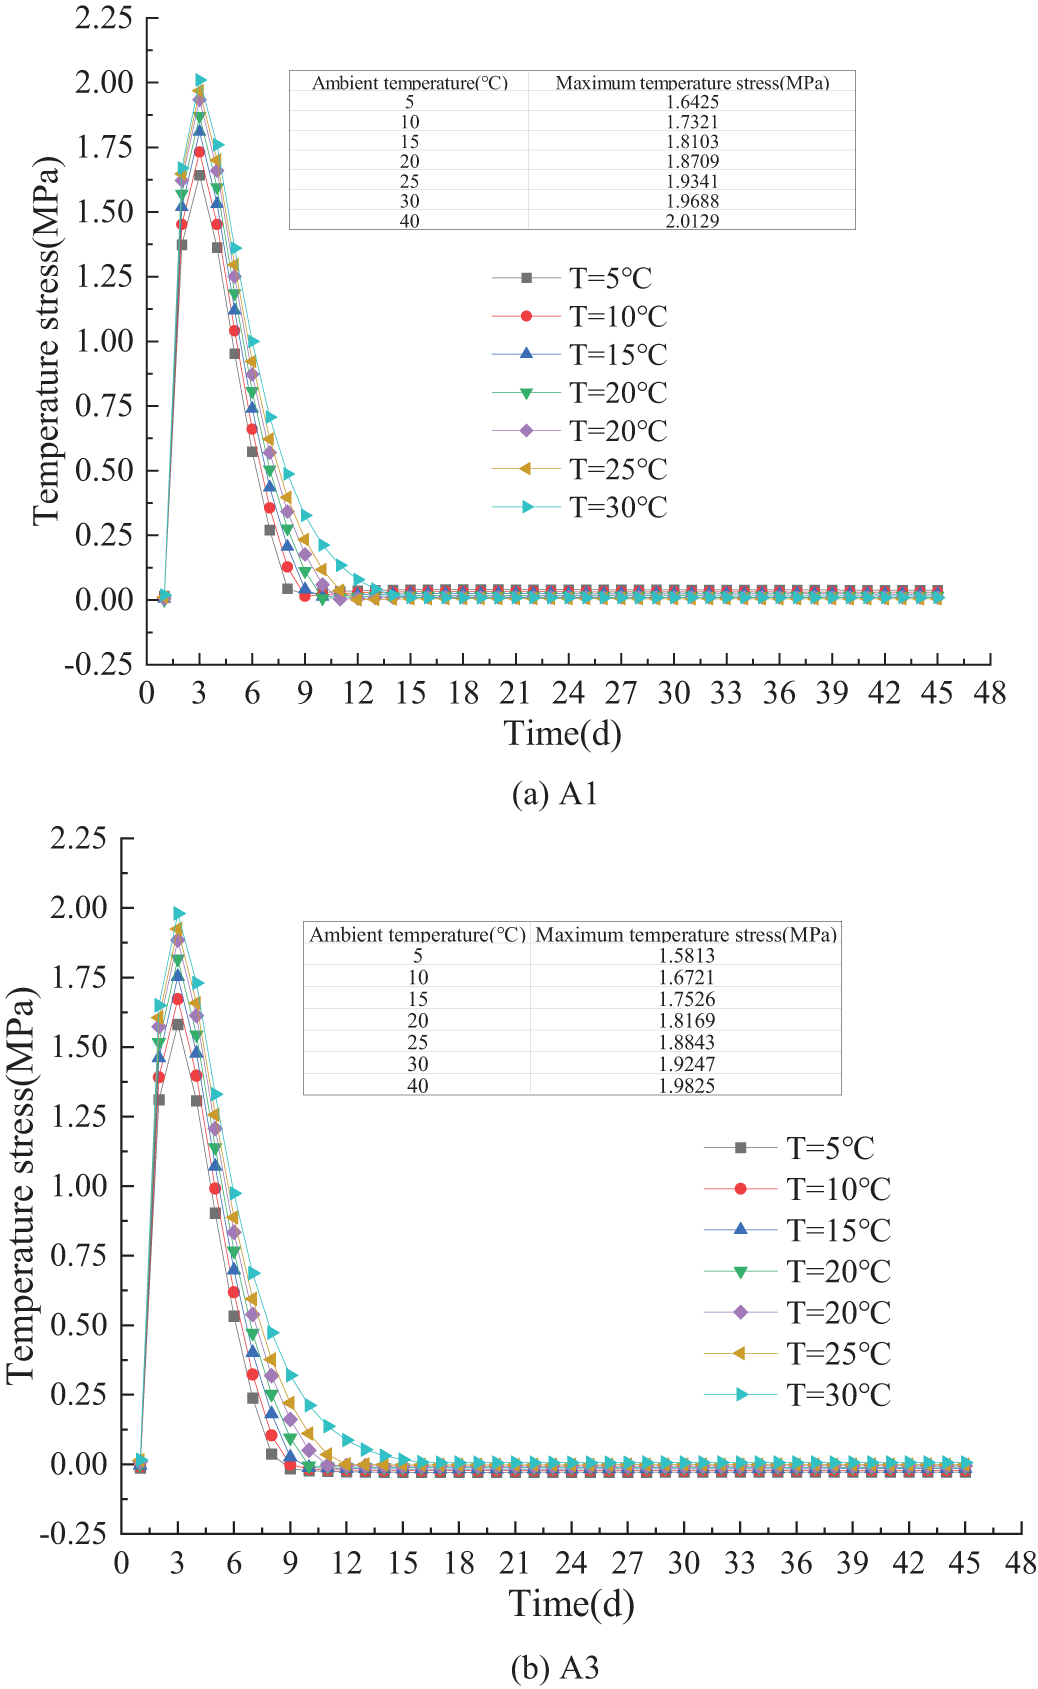
Figure 18: Influence of different average ambient temperatures on temperature stress time history at key nodes
Combined with Figs. 17 and 18, different ambient temperatures have a great influence on the maximum temperature of the hydration reaction, and indirectly affect the final temperature of the concrete structure. Before the hydration reaction started, the temperature approached the ambient temperature; After the hydration reaction occurred, the increase in ambient temperature resulted in elevated tensile stress, showing a certain linear relationship. As the hydration reaction weakened as it ended, the temperature slowly declined to ambient temperature, and the corresponding temperature stress gradually decreased tending towards stability.
Based on analysis of the influence of different environmental average temperatures on temperature effect, it can be seen that ambient temperature affects the adiabatic temperature rise of hydration heat reaction of the concrete structure to a certain extent, and then leads to temperature stress fluctuation. Therefore, in order to effectively prevent concrete cracks, concrete pouring should be carried out in the lower temperature period as much as possible during construction, and it is best to concentrate on the construction in the morning or evening in summer.
6 Prevention for On-Site Temperature Cracks
Through the analysis above, some measures can be obtained to guide the on-site control of concrete temperature cracks during the pouring of CBGCSWs.
(1) Raw materials and mixture ratio are the most direct factors affecting the heat of hydration. To a certain extent, the maximum temperature rise of the hydration can be effectively controlled by choosing suitable cement varieties, controlling reasonable cement dosage, and adding necessary mineral admixtures, thus preventing the occurrence of temperature cracks. However, it should be noted that the concrete mixed with fly ash will have a certain impact on the prestress of composite beams, which needs to be considered during prefabrication.
(2) Control the temperature of output and casting. In the raw materials of concrete, stones have a small specific heat capacity, yet they constitute the largest proportion in terms of mass within a concrete unit. While the specific heat capacity of water is larger, it is necessary to control the temperature of stone and water in order to control the output temperature of concrete. Cooling can be achieved by washing aggregate with cold water and mixing it with ice on site.
(3) Different ambient temperatures are factors affecting the heat of hydration. The temperature composition of mass concrete includes the heat generated by the hydration reaction of cement, the heat of the concrete itself during casting, and the heat dissipation during the cooling process after casting. Choosing the right season and temperature for the casting process can help reduce hydration heat and prevent temperature cracks.
(4) Considering that excessively high or low concrete pouring temperatures, as well as significant differences between the pouring temperature and ambient temperature, may affect the safety and stability of concrete structures, the following temperature ranges are recommended based on the analysis in this study, taking into account concrete mix ratios, curing conditions, and ambient temperatures: 1) 5°C–10°C: At the lower end of this range, the hydration reaction progresses slowly, leading to a relatively slower strength gain. However, this reduces water evaporation, minimizing the risk of shrinkage cracks. It is suitable for projects where early concrete strength is not critical but crack prevention is prioritized, such as winter construction of large-volume concrete. 2) 10°C–25°C: This range supports normal hydration reactions, ensuring good workability and flowability of concrete. It provides ease of operation for workers, allowing the concrete to properly fill the mold space with stable strength development. This range is ideal for most standard concrete structure projects, ensuring construction quality and molding performance. 3) 25°C–30°C: In this range, the hydration reaction accelerates, shortening the initial setting time of the concrete. Construction time becomes more constrained, requiring faster progress in tasks such as compaction and surface finishing. During high-temperature seasons, if effective cooling measures are implemented (e.g., using chilled water, ice chips, or cooling aggregates), the concrete’s basic performance can still be ensured. This range is suitable for summer high-temperature conditions with appropriate precautions to prevent rapid water evaporation, which could lead to surface cracking. 4) Above 30°C: Beyond this threshold, the hydration heat increases significantly, leading to faster slump loss, greater mixture stickiness, and excessively rapid early strength gain. This may result in increased strength variability, more shrinkage cracks, accelerated rebar corrosion, and weakened impermeability and freeze-thaw resistance.
(5) Demolding at the right time point. Strengthen the real-time monitoring of concrete temperature, remove the formwork when the concrete begins to cool down/ and cover it with geotextile for maintenance. Assuming that the top plate of CBGCSWs is covered with geotextile during the implementation of the project, the thickness of the geotextile is 1.5 cm, anptd its thermal conductivity is 0.18 kJ/(m2·h·°C). At this time, the equivalent heat release coefficient of the upper part of the top plate is 10.71 kJ/(m2·h·°C), which is greatly reduced compared with the coefficient of 99.67 kJ/(m2·h·°C) directly exposed in the air, and the effect of controlling the temperature gap is obvious. It is also important to ensure proper wet curing of reinforced concrete structures after formwork removal, with the timing determined based on specific conditions: 1) Normal Environmental Conditions: Under typical conditions, curing should generally begin within 12 h after concrete pouring. For standard reinforced concrete structures, if the ambient temperature is around 20°C, relative humidity is 60%–70%, and surface water evaporation is normal, wet curing can start immediately after formwork removal. This ensures the concrete surface remains moist, preventing rapid water loss that could lead to shrinkage and cracking. 2) High-Temperature and Dry Conditions: In environments with high temperatures (above 30°C) and low humidity (below 40%), rapid water evaporation can exacerbate concrete shrinkage, causing plastic shrinkage cracks as early as 4–6 h after pouring. In such cases, wet curing should commence immediately after formwork removal by spraying water or covering the surface with moisture-retaining materials. If feasible, curing measures can begin as early as 2–3 h after pouring. 3) Low-Temperature Conditions: When the ambient temperature is below 5°C, water evaporation slows, and the cement hydration reaction is significantly delayed. However, curing is still necessary to ensure concrete strength development. Direct water curing should be avoided to prevent freezing damage. Instead, insulation materials like blankets or straw mats can be used for thermal and moisture retention. Covering should typically be completed within 6–8 h after formwork removal, with adjustments based on factors such as initial concrete temperature and cement type. 4) Special Concrete Types: For special types of concrete, such as large-volume or high-strength concrete, which have higher cement content, greater hydration heat, or stricter curing requirements, thermal and moisture retention curing should commence immediately after final setting (usually 8–12 h after pouring). In such cases, curing may need to start as soon as the formwork is removed.
(6) Control the quality of concrete vibration. Avoid under-vibration or over-vibration, ensure that the concrete is uniform and dense, and avoid touching the steel bar and formwork. Before the initial setting of concrete when the concrete has a certain strength, the surface of concrete can be closed many times, thus slurry can be removed, and the small cracks on the surface can be compacted.
To verify the effectiveness of the proposed temperature control measures, on-site prefabrication trials of CBGCSWs were conducted. The results from the finite element simulation, which predicted temperature rise and potential cracking, were compared with real-time monitoring data collected during the prefabrication process. The finite element simulation results exhibited a strong correlation with the observed temperature profiles and on-site crack formation patterns. By implementing these measures, no visible cracks were detected in the prefabricated CBGCSWs. The successful application of these methods is illustrated in Fig. 19. This integrated approach, combining simulation and practical validation, establishes a robust framework for controlling temperature-induced cracking in CBGCSW prefabrication and offers a reliable strategy for enhancing future prefabrication practices.

Figure 19: Prefabrication of composite beam with corrugated steel webs on site
(1) The cement content directly influences the temperature of the hydration reaction: a higher cement content leads to greater heat generation during hydration. Conversely, a lower fly ash content results in reduced hydration heat. By decreasing cement content and incorporating a moderate amount of fly ash, hydration heat can be effectively reduced, thereby minimizing the risk of crack formation.
(2) The higher the initial pouring temperature, the shorter the time required for the structure’s internal temperature to reach its peak, indicating a faster hydration rate, increased heat generation, and a more rapid temperature rise. When there is a significant difference between the initial pouring temperature and the ambient temperature, the residual temperature stress becomes notably higher. Based on the concrete mix ratio, curing conditions, and ambient temperature, three optimal pouring temperature ranges are recommended: 5°C–10°C, 10°C–25°C, and 25°C–30°C.
(3) The average environmental temperature significantly influences the peak hydration reaction temperature and indirectly affects the final temperature of the concrete structure. To prevent cracking in zero-block concrete, casting should be conducted during the early morning or cooler evening hours.
(4) During the determination of the boundary convection coefficient, to account for unfavorable working conditions, geotextile and sprinkler curing were not considered, and only natural ventilation conditions were analyzed. However, the equivalent heat release coefficient under geotextile conditions was calculated, clearly demonstrating its superior effectiveness in controlling temperature differences. By combining an optimized demolding time with supplementary geotextile and sprinkler curing, the temperature peak, the maximum temperature difference between the internal and external surfaces, and the tensile stress in mass concrete can be effectively reduced, thereby preventing the occurrence of temperature-induced cracks.
Based on the findings of this study, future work will focus on investigating the long-term effects of initial pouring temperatures on the durability and microstructural evolution of concrete. Additionally, advanced environmental control techniques should be explored to enhance temperature control in mass concrete structures. Finally, large-scale validation of these conclusions in real-world construction projects under diverse site conditions, including extreme climates and complex geometries, will further solidify the applicability of the findings and guide the development of refined construction practices.
Acknowledgement: We would like to express their sincere gratitude to all those who provided valuable support during the course of this research. Special thanks are extended to the technical and administrative staff who assisted with data collection and analysis. Finally, we appreciate the constructive feedback from the anonymous reviewers, which helped improve the quality of the manuscript.
Funding Statement: This work was supported by the National Natural Science Foundation of China (U22A20598, 52279113), Key Research and Development Special Program of Henan Province (241111322500) and Support Plan for University Science and Technology Innovation Team of Henan Province (24IRTSTHN009).
Author Contributions: The authors confirm contribution to the paper as follows: study conception and design: Xuefeng Wang; data collection: Haiqing Cao; analysis and interpretation of results: Ke Jiao; draft manuscript preparation: Aoxiang Li, Zhongwei Li. All authors reviewed the results and approved the final version of the manuscript.
Availability of Data and Materials: The data that support the findings of this study are available from the corresponding author, Ke Jiao, upon reasonable request.
Ethics Approval: Not applicable.
Conflicts of Interest: The authors declare no conflicts of interest to report regarding the present study.
Abbreviations
| CBGCSWs | Composite box girders with corrugated steel webs |
| PC | Precast Concrete |
| C55 | Grade of Concrete. A standard classification for concrete based on its compressive strength (55 MPa at 28 days curing) |
| JL | Polycarboxylate Superplasticizer. A chemical admixture used to improve the workability of concrete and reduce water content while maintaining strength |
References
1. Wang L, Liu SZ, Lu W, Niu SS, Shi XL. Temperature effects of the new composite box girder with corrugated steel webs. Zhejiang Univ J Eng Sci. 2021;55(4):675–83. [Google Scholar]
2. Hassanein MF, Elkawas AA, El Hadidy AM, Elchalakani M. Shear analysis and design of high-strength steel corrugated web girders for bridge design. Eng Struct. 2017;146(1):18–33. doi:10.1016/j.engstruct.2017.05.035. [Google Scholar] [CrossRef]
3. Huang S, Cai C, He X, Li C. Comparison of the corrugated steel web composite box-girder and traditional girders regarding temperature field under solar radiation. Eng Struct. 2023;291:1–10. doi:10.1016/j.engstruct.2023.116419. [Google Scholar] [CrossRef]
4. Wang HL, Dai JG, Sun XY, Zhang XL. Characteristics of concrete cracks and their influence on chloride penetration. Constr Build Mater. 2016;107:216–25. doi:10.1016/j.conbuildmat.2016.01.002. [Google Scholar] [CrossRef]
5. Du X, Jin L, Zhang R, Li Y. Effect of cracks on concrete diffusivity: a meso-scale numerical study. Ocean Eng. 2015;108(1):539–51. doi:10.1016/j.oceaneng.2015.08.054. [Google Scholar] [CrossRef]
6. Cao XL. Temperature field analysis of steel-concrete composite girder bridges. In: Proceedings of the 2018 China Steel Structure Conference; 2018 Dec 5–7; Hong Kong, China. p. 552–60. [Google Scholar]
7. Han F, Zhang Z, Wang D, Yan P. Hydration heat evolution and kinetics of blended cement containing steel slag at different temperatures. Thermochim Acta. 2015;605:43–51. doi:10.1016/j.tca.2015.02.018. [Google Scholar] [CrossRef]
8. Wang Q, Shi MX, Wang DQ. Contributions of fly ash and ground granulated blast-furnace slag to the early hydration heat of composite binder at different curing temperatures. Adv Cem Res. 2016;28(5):320–7. doi:10.1680/jadcr.15.00077. [Google Scholar] [CrossRef]
9. Su HJ. Study on hydration heat temperature control scheme for the pier of a certain arch bridge based on Midas/FEA. Constr Technol. 2020;49(4):32–5, 49. [Google Scholar]
10. Fu YF, Wang LF, Cheng P, Tang N, Zhou N. Temperature stress field and crack control of cast-in-place mass concrete in box-type tunnel. Mod Tunnelling Technol. 2021;58(6):173–81. [Google Scholar]
11. Luo RX, Wang J, Liu J, Hu AX, Zhang L. Mix design and crack control of mass concrete for super-large bridges. In: 2021 National Engineering Construction Industry Construction Technology Exchange Conference; Construction Technology; 2021. p. 316–20. [Google Scholar]
12. Chen JY, Li Y, Liao WH, Yang GF. Effect of hydration heat on early-age cracking of continuous rigid box girder bridges. Highway. 2023;68(1):106–10. [Google Scholar]
13. Wu XY. Study on temperature effects of continuous rigid box girder bridges [Ph.D. thesis]. Chengdu, China: Southwest Jiaotong University; 2018. [Google Scholar]
14. Wang YC, Hua Y, Zhang C. Temperature distribution and evolution of concrete box girders under different environmental temperatures. Bull Chin Ceram Soc. 2017;36(10):3373–9. [Google Scholar]
15. Gu B, Xie FZ, Lei LH, Gao W. 3D calculation method of temperature field in large-span bridges. J Southeast Univ (Nat Sci). 2019;49(4):664–71. [Google Scholar]
16. Wei JL. Simulation and measurement of temperature effects in large-span high-speed railway continuous box girder bridge considering temperature effects. Nanjing, China: Southeast University; 2021. [Google Scholar]
17. Wei JL, Wang H, Mao JX, Zhu QX, Wang FQ, Xie YS. Numerical simulation and measurement verification of temperature field in continuous box girder bridges. J Southeast Univ (Nat Sci). 2021;51(3):378–83 (In Chinese). [Google Scholar]
18. Hu WB. Study on temperature effects of No.0 block in large-span PC corrugated steel web bridges in Jinsha River dry hot valley [Ph.D. thesis]. Kunming, China: Yunnan University; 2020. [Google Scholar]
19. Yin J. Temperature effects of hydration heat on No.0 block in corrugated steel web bridges [Ph.D. thesis]. Kunming, China: Kunming University of Science and Technology; 2022. [Google Scholar]
20. Shan CL, Liu WF. Temperature stress analysis of prestressed concrete box girder with corrugated steel webs. Trans Tianjin Univ. 2012;18(2):97–103. doi:10.1007/s12209-012-1626-8. [Google Scholar] [CrossRef]
21. Ma H, Liu X, Chen Y, Yuan C. Research in the temperature effect of corrugated steel webs combined bridge. In: Proceedings of the International Conference on Civil Engineering & Transportation; 2015; Paris: Atlantis Press. [Google Scholar]
22. Wang L, Niu SS, Liu SZ, Ding WP, Lu W. Study on temperature effects of new composite box girder bridges with corrugated steel webs. J Rail Sci Eng. 2020;17(8):2021–9. [Google Scholar]
23. Wang L, Liu SZ, Ding WP, Niu SS, Wu WH. Temperature effects analysis of composite box girder bridges with corrugated steel webs in cold regions. Eng Sci Technol. 2021;53(1):60–6. [Google Scholar]
24. Ning Z. Study on temperature gradient model and effects of corrugated steel web composite box girder bridges [Ph.D. thesis]. Changsha, China: Changsha University of Science and Technology; 2021. [Google Scholar]
25. Ministry of Housing and Urban-Rural Development of the People’s Republic of China. JGJ 55-2011 code for mix proportion design of ordinary concrete. Beijing, China: China Architecture & Building Press; 2011. [Google Scholar]
26. Ministry of Transport of the People’s Republic of China. JTG 3420-2020 test code for cement and cement concrete in highway engineering. Beijing, China: People’s Transport Press; 2020. [Google Scholar]
27. Ministry of Transport of the People’s Republic of China. JTG/T 3650-2020 technical specification for construction of highway bridges and culverts. Beijing, China: People’s Transport Press; 2020. [Google Scholar]
28. Pang JL, Mao YC. Study on stress performance of corrugated steel web box girder in positive bending moment region. Highway Transp Sci Technol. 2024;41(5):87–96,107. [Google Scholar]
29. Liang D, Chen HS, Dong W. Analysis of hydration heat temperature strain field of No. 0 box girder. J Beijing Jiaotong Univ. 2018;42(4):51–6. [Google Scholar]
30. Wang S. Effect of initial temperature on hydration heat of mass concrete. J Hunan City Univ (Nat Sci). 2020;29(6):12–5. [Google Scholar]
31. Hui YX, Sun XR, Wang HY, Zhang YJ. Study on temperature effects during the construction period of large-span variable-section concrete box girder. Highway Transp Sci Technol. 2023;40(1):98–105. [Google Scholar]
32. Jiang YX, Wang P, Zhang F, Huang C, Huang WW. Study on the influence of concrete pouring method on hydration heat of wide box girder No. 0 block. J Transp Sci Eng. 2024;40(1):79–89,126. [Google Scholar]
33. Liu GX, Huang YH, Wan Y. Experimental study and numerical simulation of hydration heat in mass concrete for bridge piers. Concrete Cement Prod. 2018;9:94–7 (In Chinese). [Google Scholar]
34. Zhao Y, Zhu JL, Mei Y, Liu HL, Lin S, Luo X, et al. Study on the variation law of temperature stress and parameter optimization of mass concrete side walls in subway stations. Build Struct. 2024;54(22):69–73, 110 (In Chinese). [Google Scholar]
35. Zhu BF. Temperature stress and control of mass concrete. 2nd ed. Beijing, China: Water Resources and Hydropower Press; 2012. [Google Scholar]
36. Li Y, Nie L, Wang B. A numerical simulation of the temperature cracking propagation process when pouring mass concrete. Autom Constr. 2014;37(1):203–10. doi:10.1016/j.autcon.2013.08.005. [Google Scholar] [CrossRef]
37. Zhou YH, Huang YY, Qu LX, Liu DD, Zhou SW, Li JH, et al. Study on drafting and pre-warning of double-control index for concrete pouring surface temperature in cold seasons. Water Power. 2012;38(8):3. [Google Scholar]
38. Guo JC. Experimental research on the splitting tensile strength of concrete at different temperatures and time. Ind Constr. 2008;38(9):74–6. [Google Scholar]
39. Zhang L, Ma R, Lai J, Ruan S, Qian X, Yan D, et al. Performance buildup of concrete cured under low-temperatures: use of a new nanocomposite accelerator and its application. Constr Build Mater. 2022;335:127529. doi:10.1016/j.conbuildmat.2022.127529. [Google Scholar] [CrossRef]
40. He Y, Huo J, Xiao Y. Experimental study on dynamic behavior of concrete at elevated temperatures. Adv Sci Lett. 2011;4:1128–31. doi:10.1166/asl.2011.1732. [Google Scholar] [CrossRef]
Cite This Article
 Copyright © 2025 The Author(s). Published by Tech Science Press.
This work is licensed under a Creative Commons Attribution 4.0 International License , which permits unrestricted use, distribution, and reproduction in any medium, provided the original work is properly cited.
 Downloads
 Citation Tools