
 Submit a Paper
 Propose a Special lssue
 Open Access
ARTICLE

Research on a Simulation Platform for Typical Internal Corrosion Defects in Natural Gas Pipelines Based on Big Data Analysis
1 Safety, Environment & Technology Supervision Research Institute, PetroChina Southwest Oil & Gasfield Company, Chengdu, 610041, China
2 Pipeline Management Department, PetroChina Southwest Oil & Gasfield Company, Chengdu, 610056, China
* Corresponding Author: Shuai Zhao. Email:
(This article belongs to the Special Issue: Intelligent Fault Diagnosis and Health Monitoring for Pipelines)
Structural Durability & Health Monitoring 2025, 19(4), 1073-1087. https://doi.org/10.32604/sdhm.2025.061898
Received 05 December 2024; Accepted 13 February 2025; Issue published 30 June 2025
 View Full Text
 Download PDF
Abstract
The accuracy and reliability of non-destructive testing (NDT) approaches in detecting interior corrosion problems are critical, yet research in this field is limited. This work describes a novel way to monitor the structural integrity of steel gas pipelines that uses advanced numerical modeling techniques to anticipate fracture development and corrosion effects. The objective is to increase pipeline dependability and safety through more precise, real-time health evaluations. Compared to previous approaches, our solution provides higher accuracy in fault detection and quantification, making it ideal for pipeline integrity monitoring in real-world applications. To solve this issue, statistical analysis was conducted on the size and directional distribution features of about 380,000 sets of internal corrosion faults, as well as simulations of erosion and wear patterns on bent pipes. Using real defect morphologies, we developed a modeling framework for typical interior corrosion flaws. We evaluated and validated the applicability and effectiveness of in-service inspection processes, as well as conducted on-site comparison tests. The results show that (1) the length and width of corrosion defects follow a log-normal distribution, the clock orientation follows a normal distribution, and the peak depth follows a Freundlich EX function distribution pattern; (2) pipeline corrosion defect data can be classified into three classes using the K-means clustering algorithm, allowing rapid and convenient acquisition of typical size and orientation characteristics of internal corrosion defects; (3) the applicability range and boundary conditions of various NDT techniques were verified, establishing comprehensive selection principles for internal corrosion defect detection technology; (4) on-site inspection results showed a 31% The simulation and validation platform for typical interior corrosion issues greatly enhances the accuracy and reliability of detection data.Keywords
During the transfer of oil and gas resources through pipelines, the inner walls of metal pipelines are susceptible to substantial corrosion defects caused by corrosive agents such as water, hydrogen sulfide, and carbon dioxide, resulting in pipeline wall thinning and lower strength [1–3]. Corrosion can readily lead to mishaps such as leaks, perforations, and explosions in oil and gas pipelines, endangering human safety and incurring major economic losses and environmental harm [4,5]. As a result, improving the identification of pipeline corrosion faults and the level of pipeline integrity evaluation have become critical measures for ensuring the inherent safety of pipeline transportation systems. Currently, regularly used in-service pipeline defect detection technologies include ultrasonic [6], guided ultrasonic [7], X-ray detection [8], and others, each with a different ideal utilization range and defect detection sensitivity [9–13]. To assure the accuracy of identifying internal corrosion faults in pipelines, it is critical to assess the efficiency of various detection systems. However, there is little public reporting on this topic, both domestically and globally, and a valid evaluation approach has yet to be developed.
Creating a standard corrosion defect simulation platform and using simulated flaws to analyze and verify various detection systems is currently a useful way of analyzing detection technologies. However, because the size, location, and morphology of corrosion defects formed in pipelines made of different materials under various pipeline transportation conditions, conveying media, and service time conditions vary, extracting information, such as defect location distribution and morphology characteristics from a large amount of corrosion defect detection data is difficult [14,15]. The K-means clustering method, a classic data mining method, can divide a data set into k clusters based on specific criteria, ensuring that data characteristics within the same cluster are as similar as possible while differences between clusters are more noticeable [16]. While various studies have investigated the use of finite-element models to forecast fracture propagation in pipelines, these methods sometimes miss their real-time applicability and accuracy under a variety of environmental situations. Our technique builds on these previous studies while expanding their capabilities by including real-time sensor data and more accurate material models. This yields an approach that not only forecasts crack propagation with greater precision but also allows for dynamic, real-time monitoring, making it more appropriate for application in operational pipeline systems [17]. Because of its tremendous scalability and efficiency in processing huge amounts of data, it is commonly employed in industrial data processing [18]. Recent research has looked into finite-element models to prevent crack propagation in steel gas pipes, taking into account temperature impacts. These investigations have greatly improved our understanding of pipeline integrity under a variety of environmental circumstances. However, its applicability to real-time monitoring systems is restricted. Our research expands on previous studies by including more dynamic aspects such as real-time sensor data and multi-parameter simulations to improve forecast accuracy and give a more comprehensive pipeline maintenance solution [19].
Pipeline integrity management is an important issue in the oil and gas sector, especially for steel gas pipelines that are subjected to extreme operating conditions. Numerous studies have been conducted to identify and inhibit fracture development, however, most current approaches lack sufficient precision or real-time capability. This work describes a unique numerical strategy that combines finite-element simulations with improved monitoring techniques to provide a more reliable solution for preventing fracture development and corrosion in steel gas pipelines. Our approach is more accurate and practical than prior research because it takes into consideration many environmental elements that affect pipeline health. As a result, this study gathered corrosion data from over 2000 pipelines and more than 140 station process pipelines, selecting 380,000 sets of corrosion defect data. Statistical approaches were utilized to investigate the size and orientation distribution characteristics, as well as the rules governing internal corrosion flaws in straight pipes. Multiphase flow erosion wear simulations on elbows were performed to investigate the morphology and distribution of erosion wear at elbows. The K-means clustering algorithm was used to quantitatively describe the size and circumferential distribution of faults in straight pipes. Adjustments were made based on the macroscopic morphology and distribution orientation of various types of pipeline and elbow defects under actual operating conditions, resulting in the proposal of a simulation platform for typical internal corrosion defects in gathering and transportation system stations and pipelines, to provide effective support for the validation of internal corrosion detection technology application boundaries.
2 Analysis of Corrosion Defect Characteristics
A classification statistical analysis was performed using approximately 380,000 sets of internal corrosion fault data gathered from domestic and international sources. Non-linear curve fitting was used to create a model for the distribution of internal corrosion defects, revealing the patterns of corrosion defect sizes. When combined with simulation modeling that showed the variance of corrosion locations in elbows, the characteristic distribution was clearly defined.
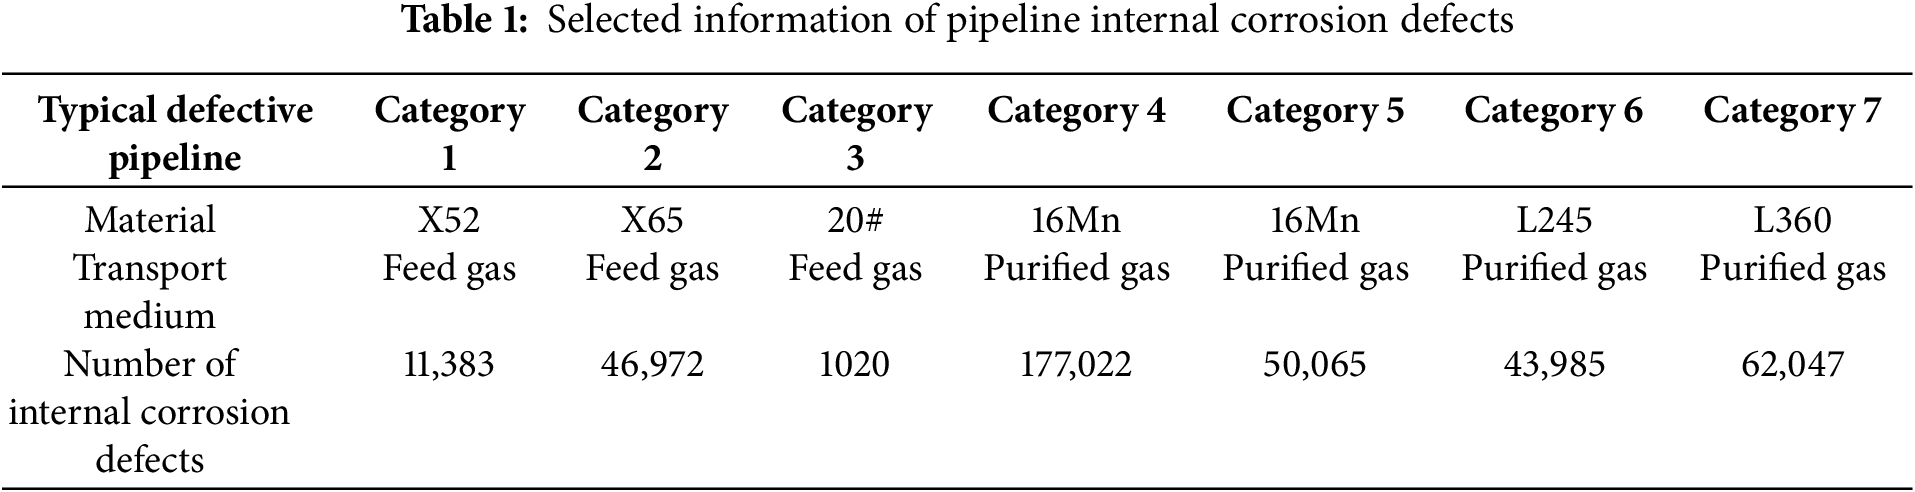
This study took into account variables that affect pipeline corrosion flaws, such as conveying medium and pipeline material. Purified gas and raw gas were the primary conveying media, and approximately 380,000 sets of pipeline corrosion defect data were gathered and processed. These sets covered materials including 20#, X52, X65, 16Mn, L245, and L360. As indicated in Table 1, corrosion defect data was categorized and examined by material and conveying medium for the purpose of statistical analysis.
The maximum corrosion depth (dmax) and average corrosion depth (davg) for each category of corrosion faults were determined based on the pre-classification in Table 1. The Pearson correlation coefficient between the dmax and the defect length (L) and the Pearson correlation coefficient between the davg and L were then calculated using Eq. (1). We eliminated L, dmax, and davg data with lower Pearson correlation coefficients in order to lessen the effect of erroneous data. The Pearson correlation coefficient can be computed using the following formula for two sets of sample data: X: {x1, x2, …, xn}, and Y: {y1, y2, …, yn}.
In the formula, E (X) is the mean of sample X,
We acquired effective data for corrosion defect length, width, depth, and clock orientation (circumferential distribution) using the above-described Pearson correlation coefficient approach. Distribution plots were made for corrosion defect length, width, depth, and clock direction in order to show the primary distribution range of corrosion defect sizes and orientations in a specific pipeline type. The distribution patterns of the previously described characteristic variables were ascertained by performing curve fitting on them, as seen in Figs. 1–4.
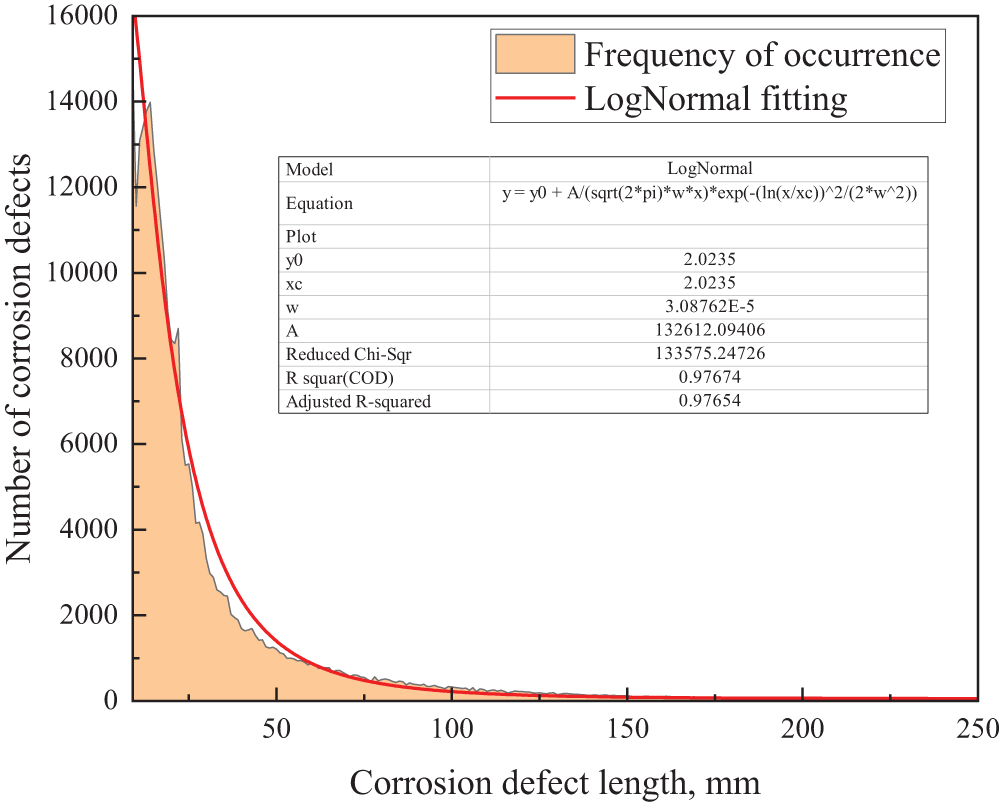
Figure 1: Distribution of length and size of corrosion defects and fitting curve
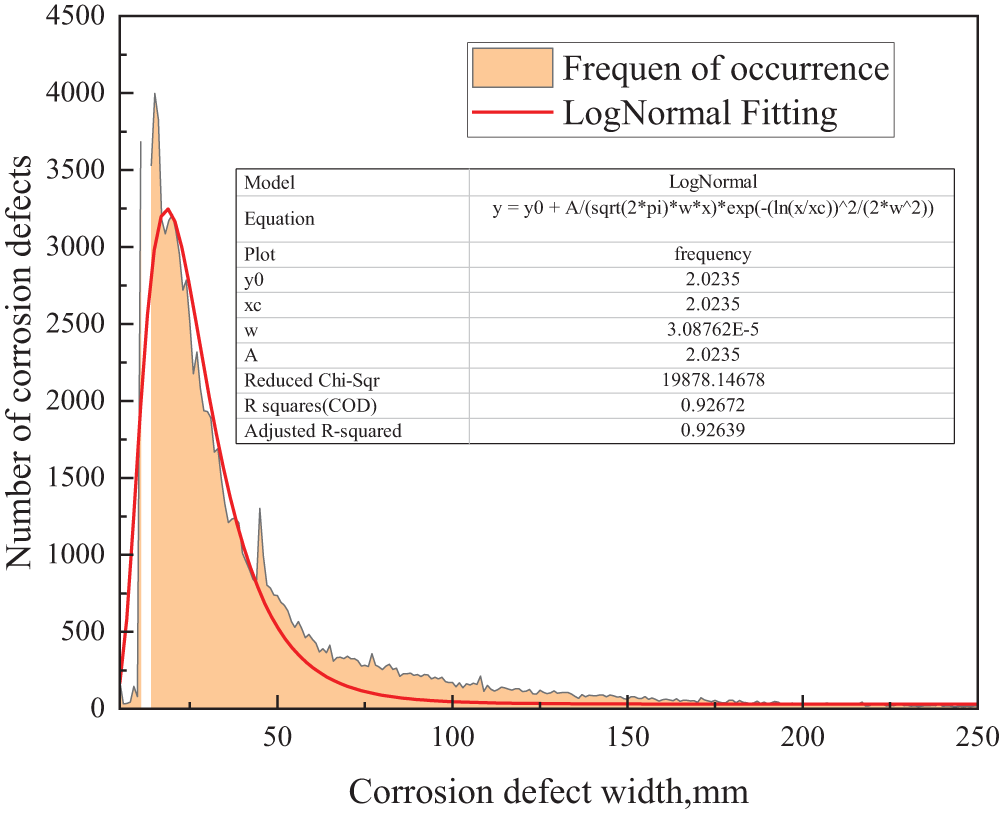
Figure 2: Distribution of width and size of corrosion defects and fitting curve
Figure 3: Distribution of depth and size of corrosion defects and fitting curve
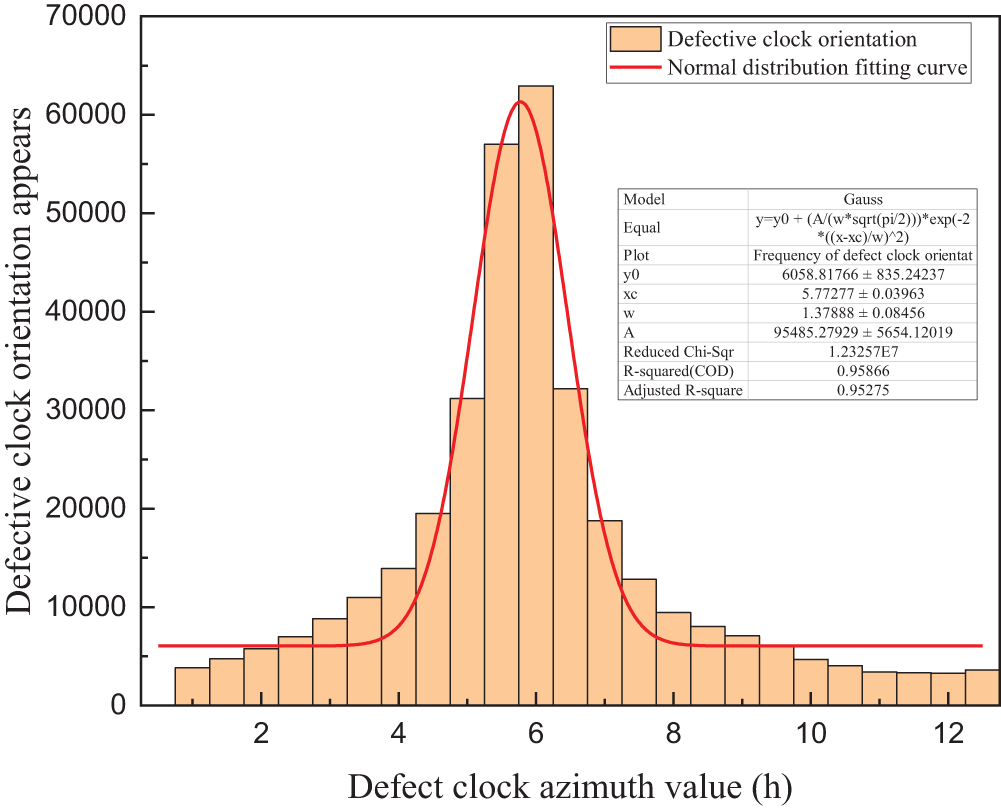
Figure 4: Distribution and fitting curve of corrosion defect clock orientation
The length size of corrosion flaws is shown to follow a logarithmic normal distribution law in Fig. 1, and Eq. (2) illustrates its distribution function.
In the formula, y is the frequency of occurrence of the length of the corrosion defect, and x is the length of the corrosion defect (mm).
Eq. (3) illustrates the distribution function of the breadth size of corrosion flaws, which is demonstrated to follow a logarithmic normal distribution law in Fig. 2.
In the formula, y is the frequency of occurrence of the width of the corrosion defect, and x is the length of the corrosion defect (mm).
Eq. (4) illustrates the distribution function of the peak depth of corrosion defects, which is shown to follow a logarithmic normal distribution law in Fig. 3.
In the formula, y represents the frequency of occurrence of the peak depth proportion of corrosion defects, and x represents the proportion of peak depth.
Fig. 4 shows that the distribution of corrosion faults in the pipeline’s circumferential direction follows a normal distribution law. Eq. (5) illustrates this distribution function.
In the formula, y represents the frequency of occurrence of corrosion defects in the clock direction, x represents the clock value, and h (decimal hours).
The distribution patterns of corrosion defect length, width, peak depth ratio, and clock orientation variables in a particular pipeline type are methodically shown in Figs. 1–4. The distribution functions for these random variables are given by Eqs. (2)–(5). This establishes a vital basis for the simulation platform’s corrosion fault design and the quantitative evaluation of pipeline corrosion damage.
2.3 Simulation of Elbow Corrosion Defects
Simulations were performed under gas-solid (dry gas) and gas-liquid-solid (wet gas) circumstances for elbows of different specifications, including 65, 80, 100, 125, and 200 mm, in order to elucidate the corrosion properties of elbows. Inside the elbows, the distribution patterns and morphology of erosion wear were modeled. The following design of elbow corrosion sites on the platform was based on the correctness of the simulation results, which were confirmed using real survey data on elbow defect features.
2.3.1 Gas-Solid Erosion Simulation
(1) Gas-solid two-phase erosion simulation of elbows with varying pipe diameters
The wear rate (mg/g) of the front and rear straight pipe sections and elbows (65, 80, 100, 125, and 200 mm) that were eroded by natural gas and a large number of solid particles was investigated in this section. The erosion wear rate for different pipe sizes is shown in Fig. 5. The elbow, riser, and horizontal pipe were the medium flow directions.
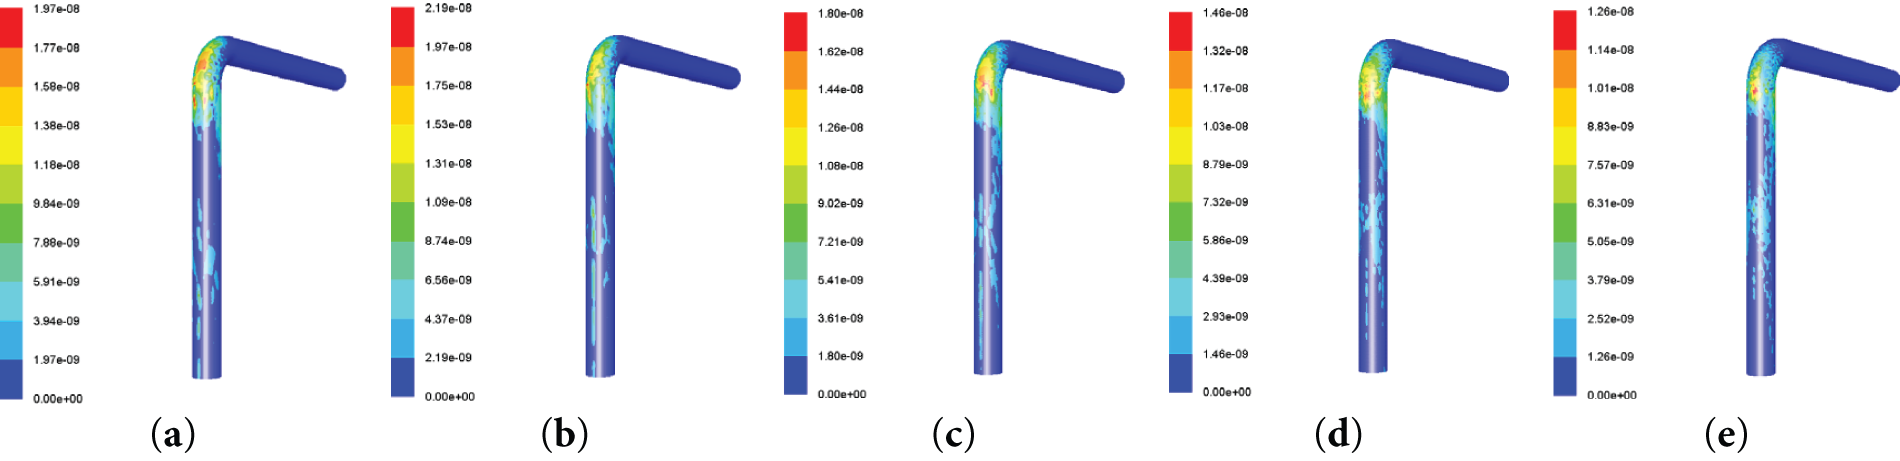
Figure 5: Cloud map of erosion and wear of elbows of different specifications. (a) 65 mm, (b) 80 mm, (c) 100 mm, (d) 125 mm, (e) 200 mm
The distribution features of wear areas on elbows can be found by simulating the wear rates of elbows with varying diameters as well as the upstream and downstream straight pipe sections under the erosion of gas-solid two-phase flow:
(1) The straight pipe sections upstream showed no wear, whereas the elbow’s outside wall next to the exit showed maximum wear. The elbow’s downstream straight pipe sections showed sporadic wear spots.
(2) The wear areas on the elbow’s outer wall were roughly equally distributed along the axis, frequently taking the form of bands or strips, and their direction followed the direction of flow.
(2) Gas-solid two-phase elbow erosion simulation under various transit and gathering pressures
Investigations were conducted into the problem of 90-degree elbow erosion and wear failure in pipes. A corresponding model was developed using CFD (Computational Fluid Dynamics) simulation software based on the actual working conditions on site in order to study the erosion and wear law of solid particles impacting the wall of the elbow when transporting gas-solid two-phase flow media in pipelines, as well as the wear rate (mg/g) under various gathering and transportation pressures (1.0, 3.0, 7.0, and 9.0 MPa). The simulation’s results are shown in Fig. 6.
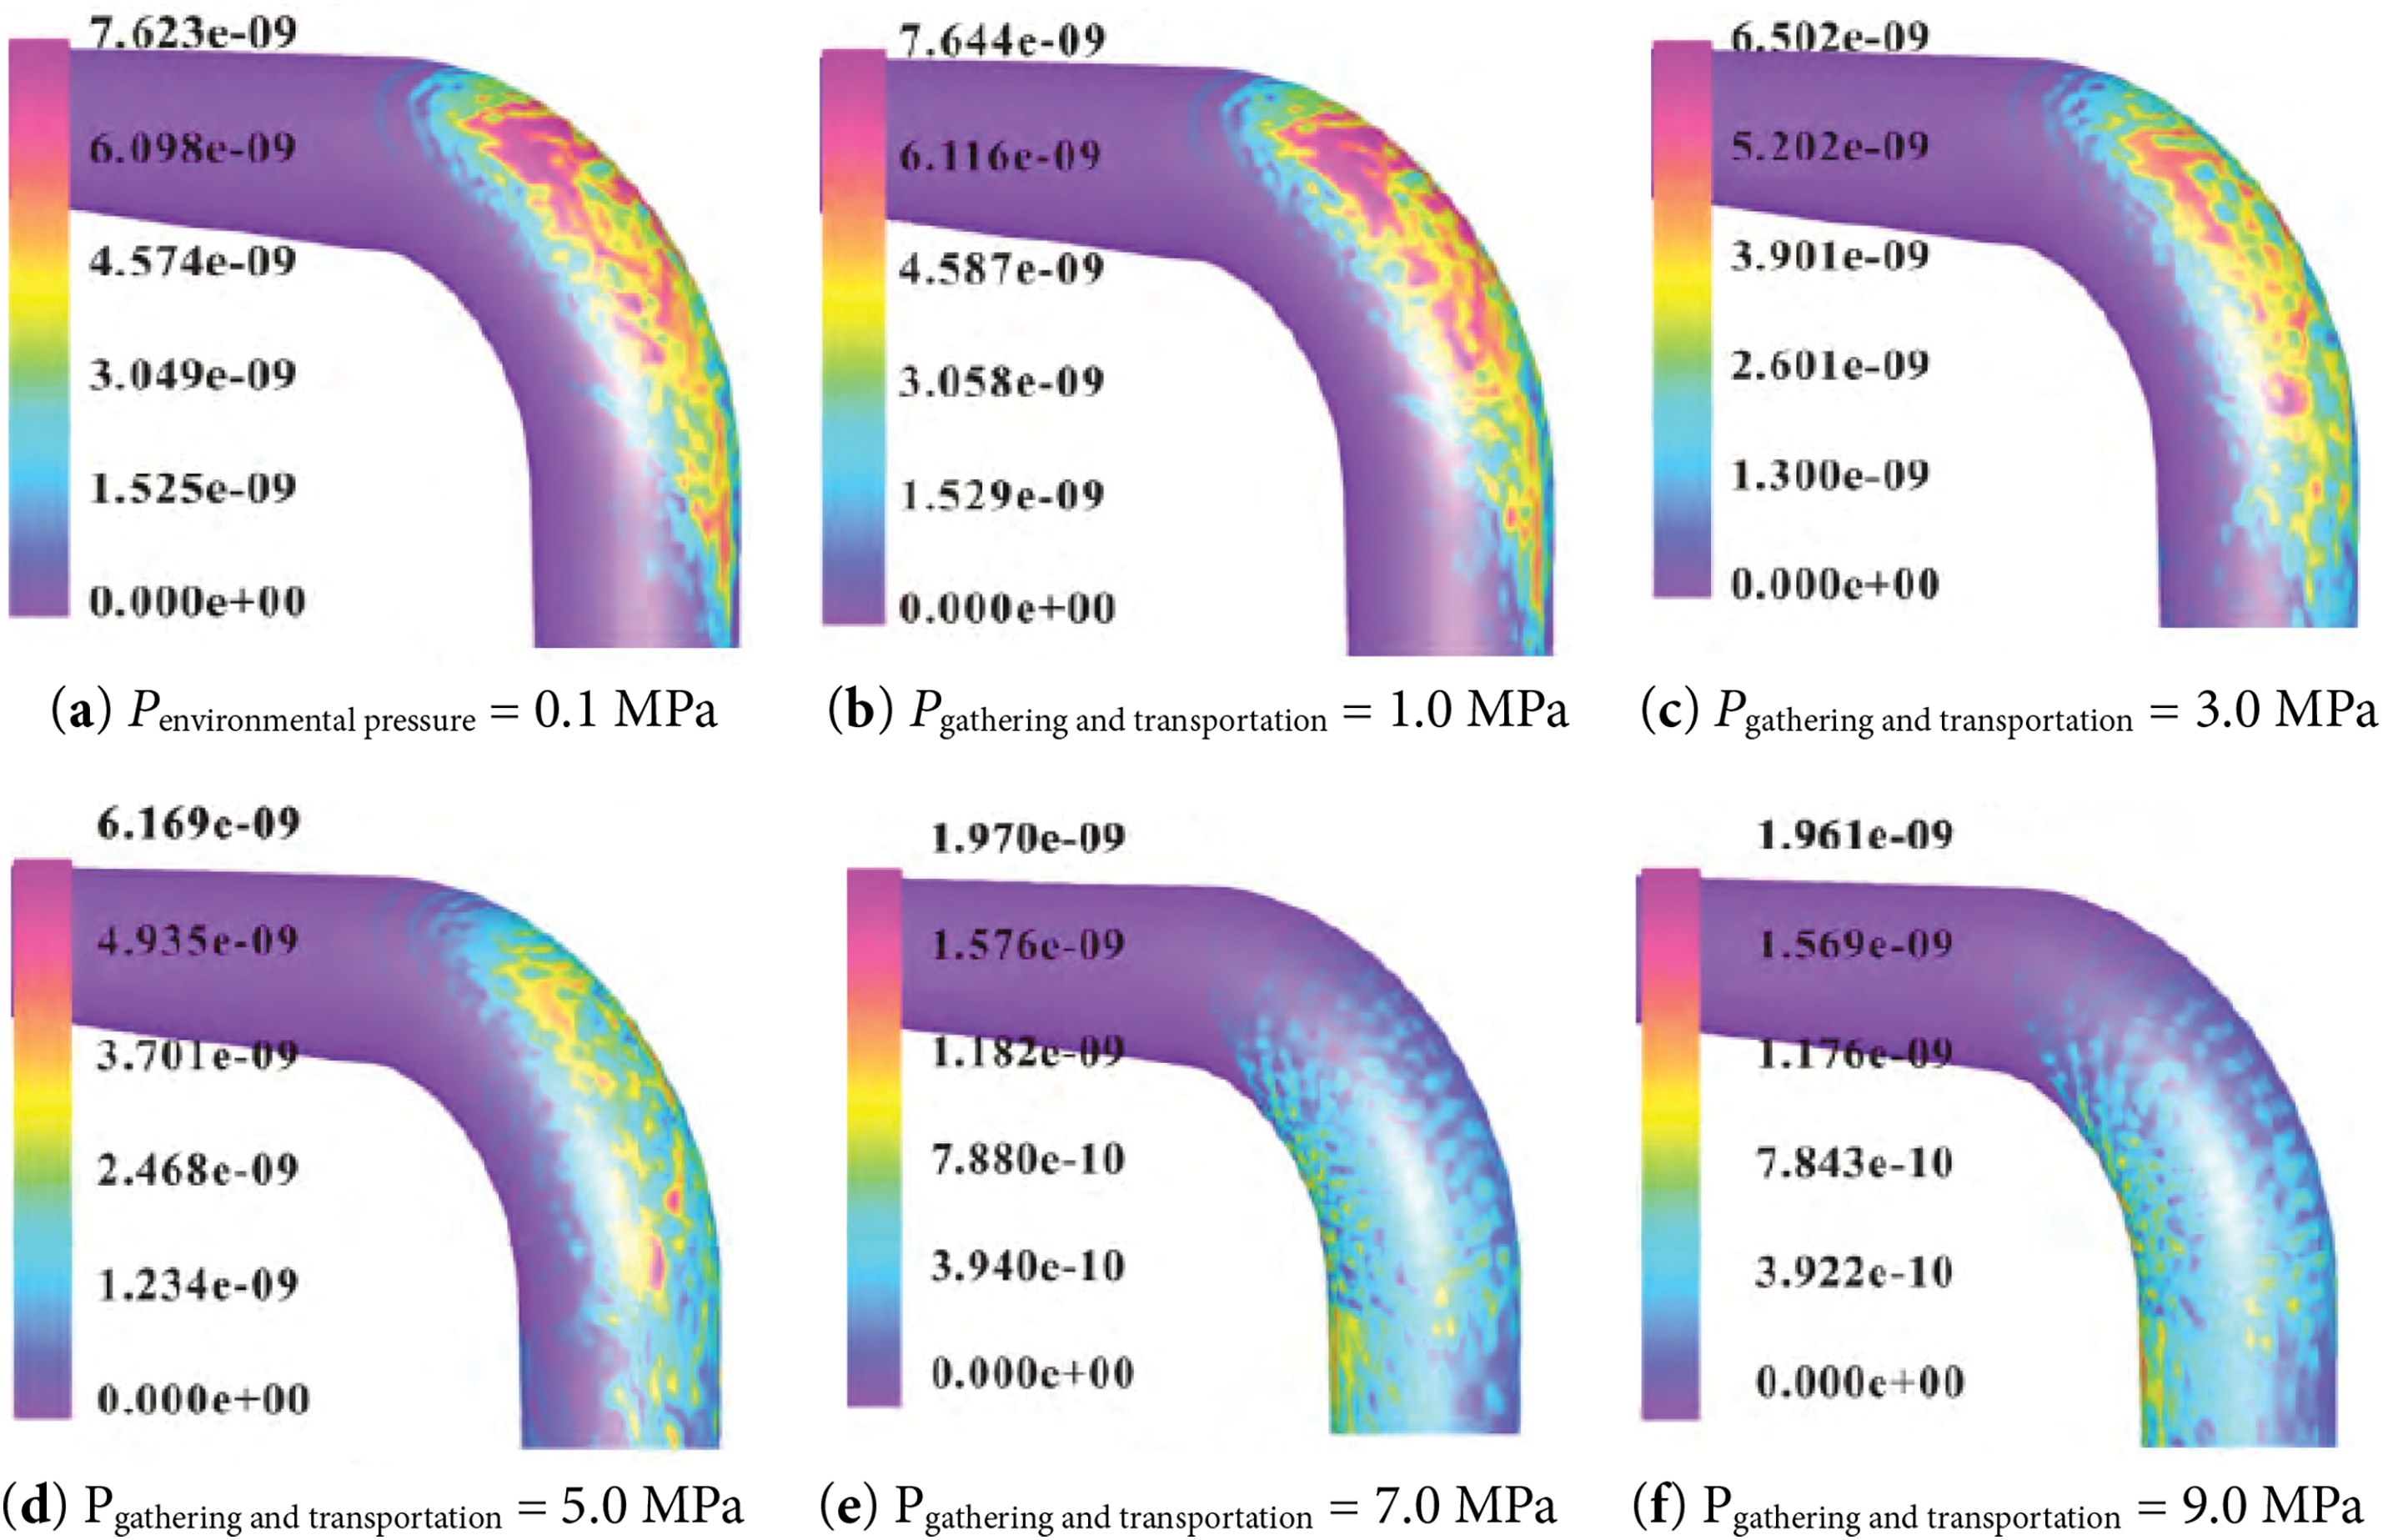
Figure 6: Cloud map of erosion rate under different gathering and transportation pressures
The erosion wear properties of gas-solid two-phase flow in elbows under various pressures (1.0, 3.0, 7.0, and 9.0 MPa) were also investigated using a computer model. The findings demonstrated that the maximum wear rate had moved to the elbow’s outlet when the pressure increased to 5.0 MPa. The elbow’s wear area changed significantly as the pressure increased to 7.0 MPa or higher. Severe erosion was seen on the inner side of the elbow toward the middle and rear, and erosion wear was observed close to the weld seam on the inner side of the elbow outlet, even leading to perforation.
2.3.2 Gas-Liquid-Solid Multiphase Erosion Simulation
To examine the wear characteristics, a simulation of gas-liquid-solid multiphase flow erosion was carried out in liquid water settings (2.75% to 21.39% water content). It was clear from the results that multiphase media with a reduced water content led to more severe erosion wear on the elbows, with the outer wall of the elbow outlet showing the most severe wear areas.
3 Corrosion Defect Characteristics Clustering Analysis
To offer a reference basis for the design of artificial defect sizes and distribution on the simulation platform, it is required to investigate the typical characteristics of various pipeline corrosion defect types after identifying the distribution patterns of corrosion defects. Both the similarities and differences between information within the same category of pipeline problems can be seen in the analytical findings of the K-means clustering technique. In order to investigate the typical values of a large number of corrosion defect data, the K-means clustering model is used in the next section.
3.1 Standardization Processing
To guarantee the data mining process’s correctness and speed of convergence, as well as to prevent the impact of disparate dimensions and orders of magnitude, the clustering samples must be standardized prior to performing K-means clustering analysis. The sample objects chosen are corrosion defects with the same material and conveying medium conditions, as classified in Table 1. This includes information on the defects’ peak depth, length, width, and clock orientation. The mean and standard deviation of the original sample data are utilized to standardize the initial clustering samples using the Zscore normalization approach. The following is the formula for standardizing the Zscore of the sample sequence X: {x1, x2, …, xn}:
In the formula, μ is the expected value of corrosion defect size or orientation data,
In order to create K clusters, the K-means clustering algorithm first chooses K samples from the sample dataset as starting cluster centers. It next determines the distance between the remaining samples and the original cluster centers and allocates each sample to the cluster center with the smallest distance. After that, the algorithm continues the previous steps until the cluster center locations remain constant, updating each cluster’s centers as the new cluster centers [17]. Here is the precise procedure:
(1) Based on the quantity of feature extraction requirements, calculate the expected number of classifications K. Then, from the initial cluster samples, choose K initial cluster centers C1
(2) In order to create K clusters, determine the Euclidean distance between each defect sample (xi) and the cluster center (CK). Then, assign the sample to the closest cluster center (CK). This is how D(xi, CK) is calculated:
In the formula, xi is the i-th corrosion defect sample object.
(3) Compute the sum of squared errors E between neighboring cluster iterations and update each cluster’s centers
In the formula,
(4) To acquire K clusters and their center values, repeat steps (1) through (3) until the sum of squared error E converges, which means that the new cluster centers remain unchanged from the previous iteration.
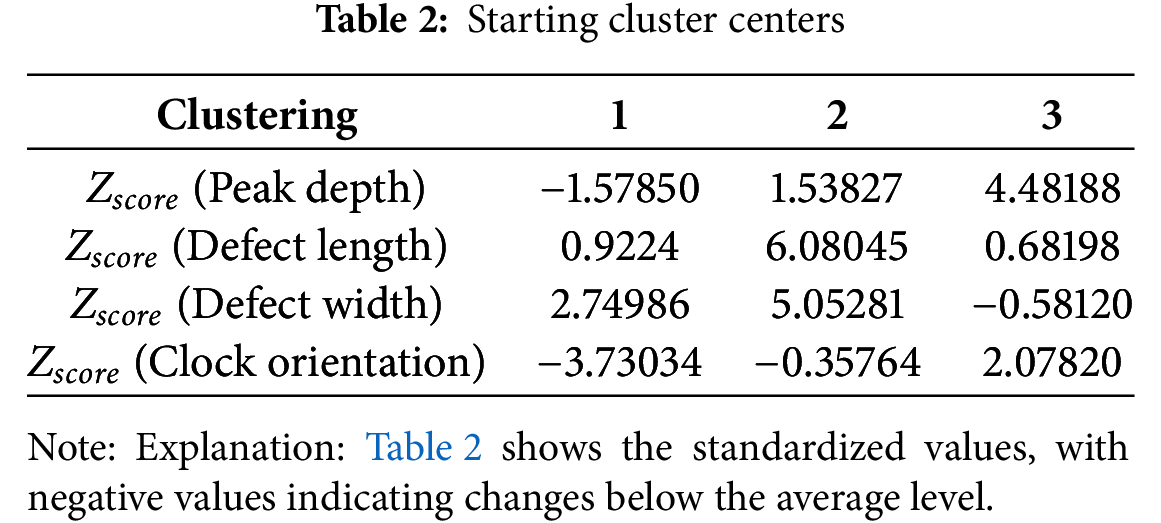
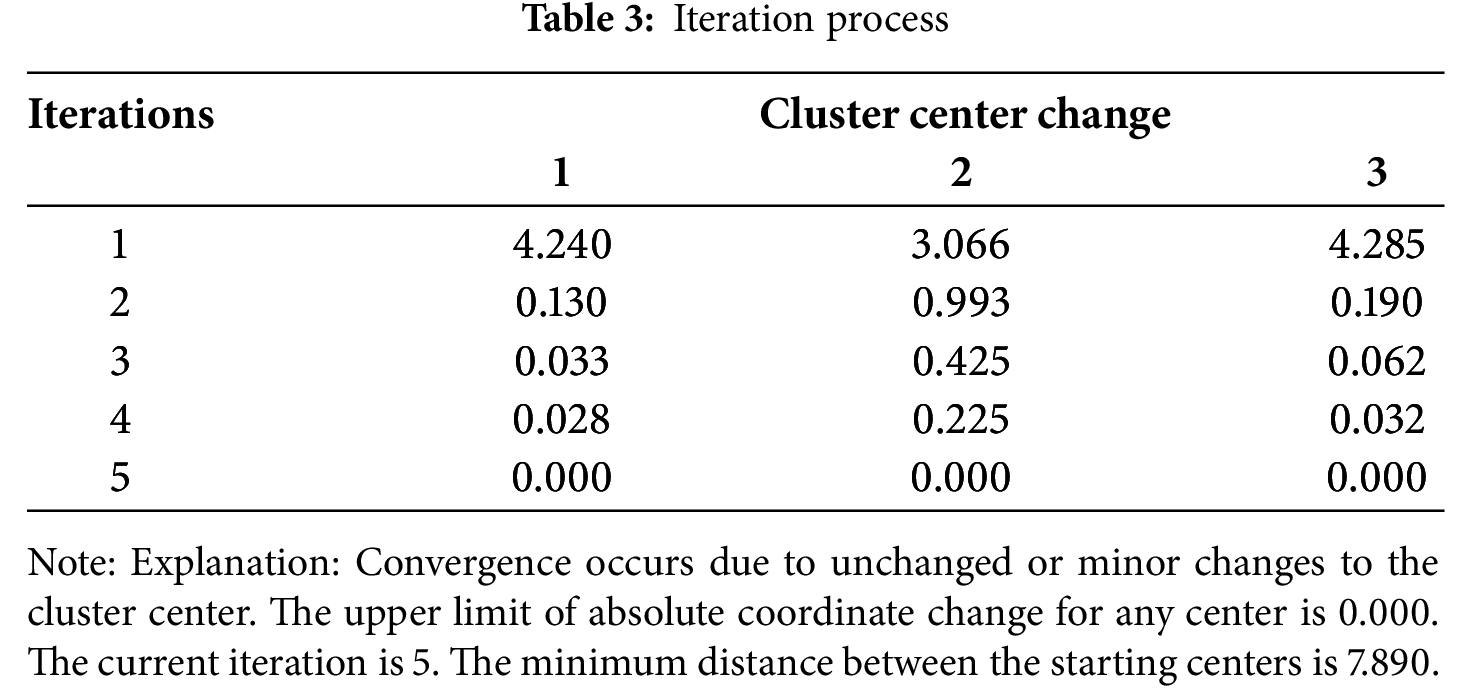
We will use corrosion data from a 20# steel natural gas pipeline to demonstrate the clustering analysis modeling technique in order to make it easier to analyze and predict corrosion faults in the future. For the peak depth, we first set the number of clusters to three classes. Each feature’s category will be provided by saving the clustered samples. Table 2 displays the first cluster centers for the clustering study. As seen in Table 3, the clustering procedure is finished after five iterations, at which point the iteration comes to a conclusion.
3.3 Validation of Feature Values
The frequency of morphology and size of corrosion defects in real pipelines was statistically examined to confirm if the typical values of corrosion defect sizes derived using the clustering analysis method are representative. In the graph, different colors are used to represent different size groups, with solid red lines denoting usual values.
Volumetric and fracture faults are the two main categories of corrosion problems found in 20# steel pipelines. Table 4 displays the classification results of the K-means clustering method’s typical corrosion defect characteristics inside such pipes.
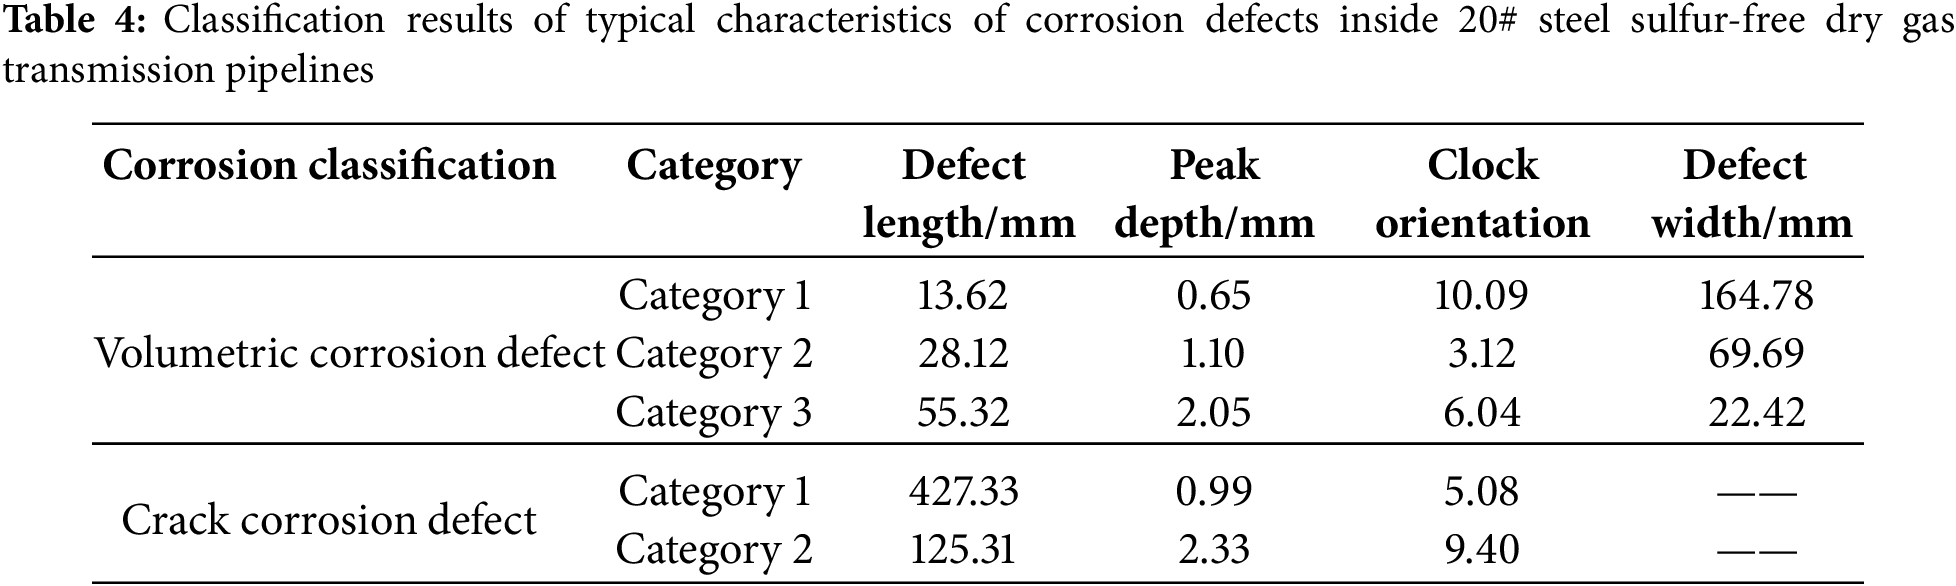
Using the length dimension frequency distribution graph (Fig. 7a) as an example, the yellow area in Fig. 7 represents the Class I distribution of length dimensions for volumetric defects. The K-means clustering technique yielded a typical value of 13.62 mm for this class. According to the K-means clustering algorithm, the cluster center for Class I length dimensions is 13.62 mm, which also represents the weighted average taking frequency into account. This corresponds to where the typical value is located on the graph. Consequently, the average level of length dimensions in this region can be reflected in the typical values that the K-means clustering method produces. The standard values for length dimensions in Classes II and III are based on the same idea and are not further explained. Likewise, the same reasoning can be used to confirm the typical values for the width and depth of corrosion flaws in Fig. 5.
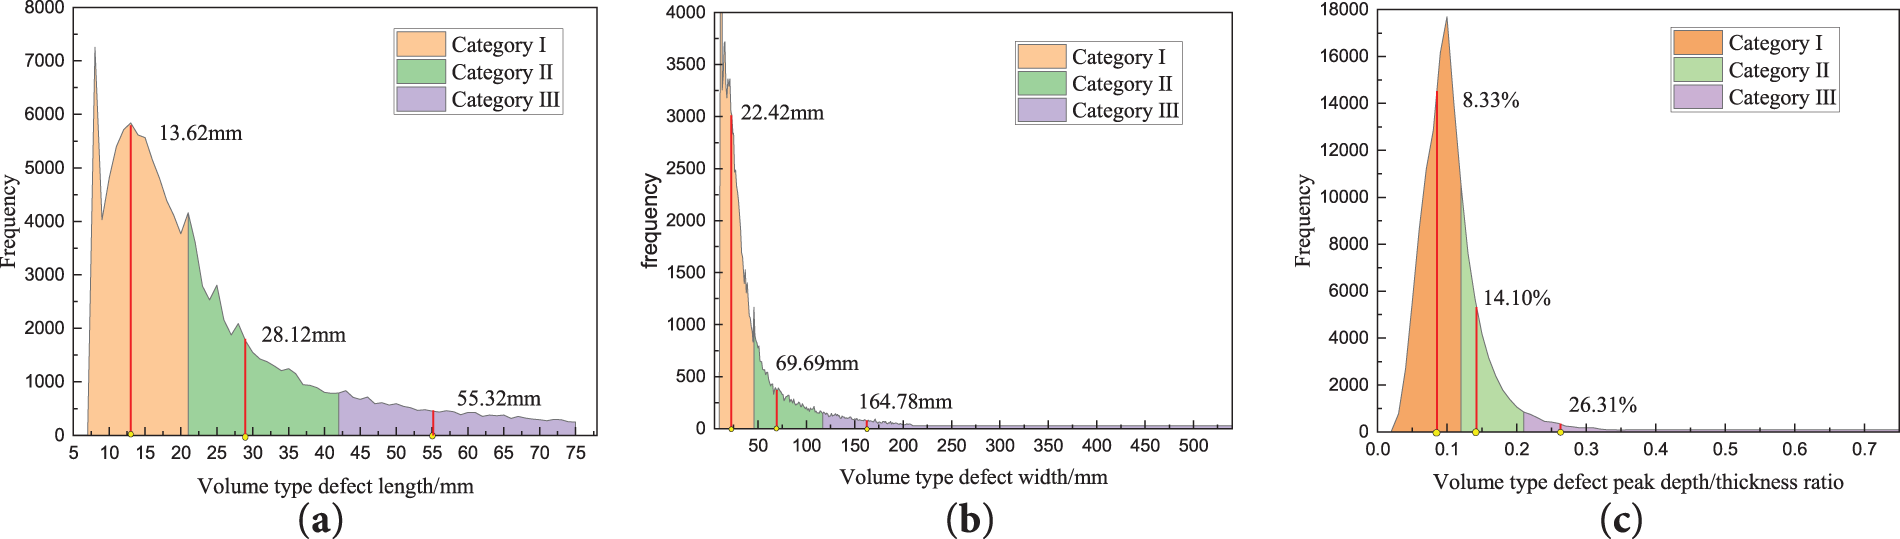
Figure 7: Frequency distribution and typical characteristic values of (a) length, (b) width, and (c) depth of volumetric defects
4 Design Plan for Simulation Platform
4.1 Pipeline Specifications and Materials
It is crucial to take into account the statistical outcomes of field pipeline specifications as well as whether the sample pipe diameters satisfy certain pressure rating requirements and the assessment requirements of detection technology when establishing the specifications of sample pipes for the simulation platform. As a result, the five pipe diameter parameters chosen for this investigation are Φ89, Φ108, Φ159, Φ219, and Φ273.
When building alternative wall thicknesses under the same pipe diameter, the dimensional changes are negligible due to operational pipeline gas pressure levels. When designing defect depths, the sample pipe wall thicknesses are found to be 5, 6, 7, 8, 9, 10, and 15 mm in order to account for variations in peak depth flaws.
Five frequently utilized materials—20#, L245NB, L245NCS, L360QS, and L360NCS—are chosen by the modeling platform based on a statistical analysis of operating pipeline materials.
560 faults are designed for five different types of pipe materials based on the findings of the clustering study of corrosion defect features in pipelines.
(1) Geometric parameters of defects: The geometric parameters (length, width, depth), clock position, defect morphology, projection shape, etc., of each defect are determined based on statistical analysis, distribution characteristics, current detection technology, and processing requirements. The minimum size is designed to be 0.1 mm. Clock positions are the main use for typical values.
(2) Defect location selection: As shown in Fig. 8, in order to mimic the distribution of flaws in straight and bend pipe sections, it is assumed that the outside wall close to the bend outlet is where the most severe defect occurrence occurs in bend pipes. The order of vulnerability to corrosion flaws for straight pipe sections is end > front > middle. Therefore, these areas are the main distribution positions for defect design in sample pipes.
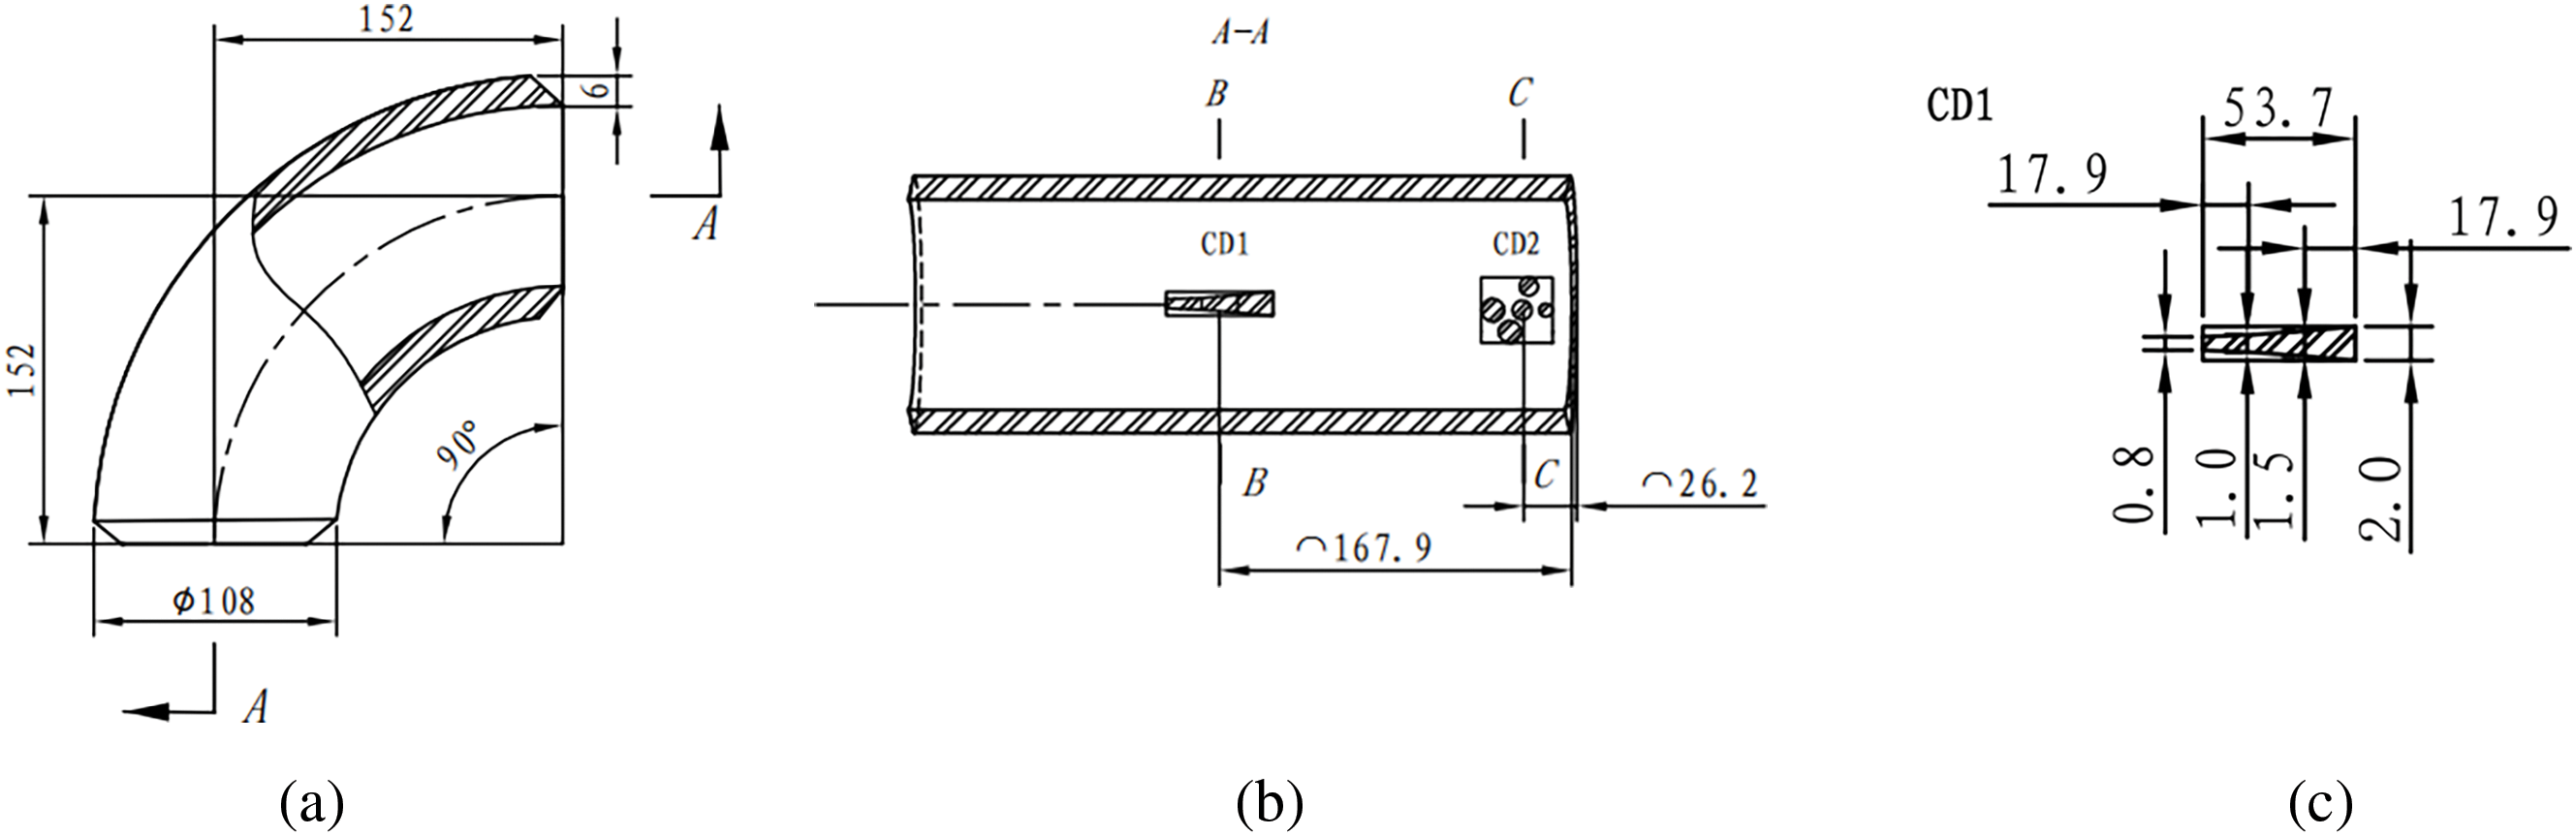
Figure 8: Schematic diagram of volumetric defects on the outer side of the elbow design (unit: mm). (a) Main body diagram of elbow; (b) A-A cross-section view; (c) Design details of defect CD1
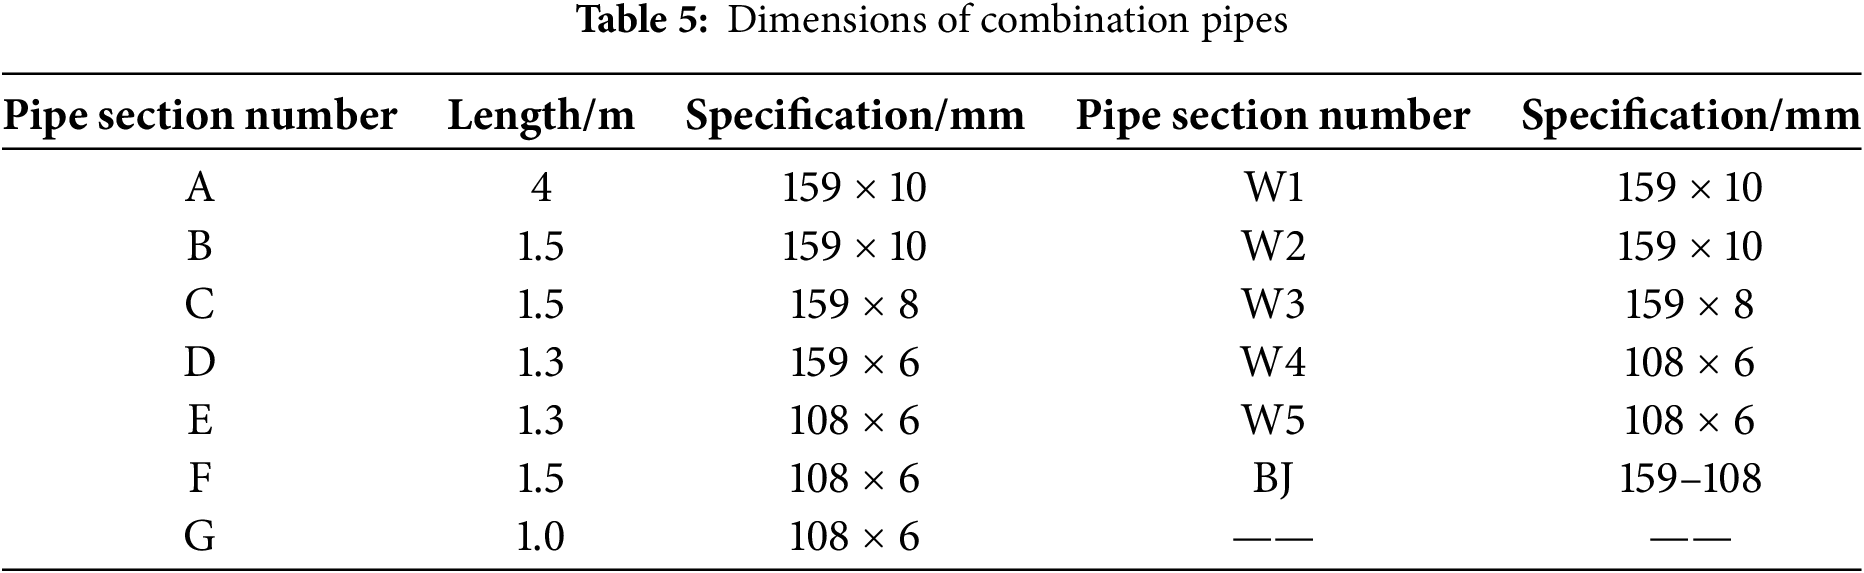
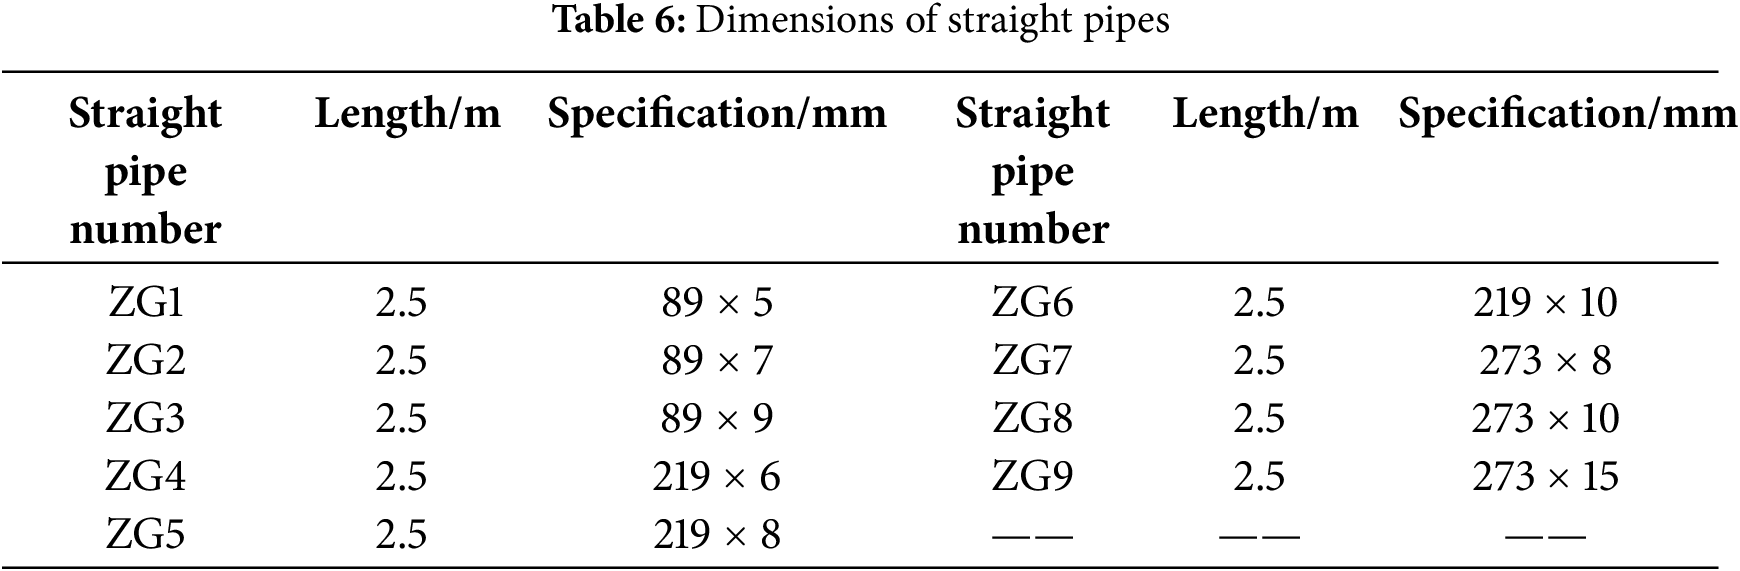
The simulation platform creates distributed straight pipe sections and composite pipelines to replicate diverse pipeline morphologies in a range of service contexts, thereby more accurately simulating the genuine morphology of gas transmission pipelines in service environments. To replicate underground pipelines, above-ground pipelines, inlet pipelines, outlet pipelines, etc., the composite pipe is made up of horizontal pipes, vertical pipes, elbows, reducers, flanges, etc., as seen in Fig. 9. The simulation platform’s sample pipes are made up of nine scattered, 2.5 m straight pipes and composite pipes that are 4 m long, 1.5 m wide, and 1.5 m high. Tables 5 and 6 display the suggested diameters for each pipe segment and its constituent parts based on the previously described statistical findings.
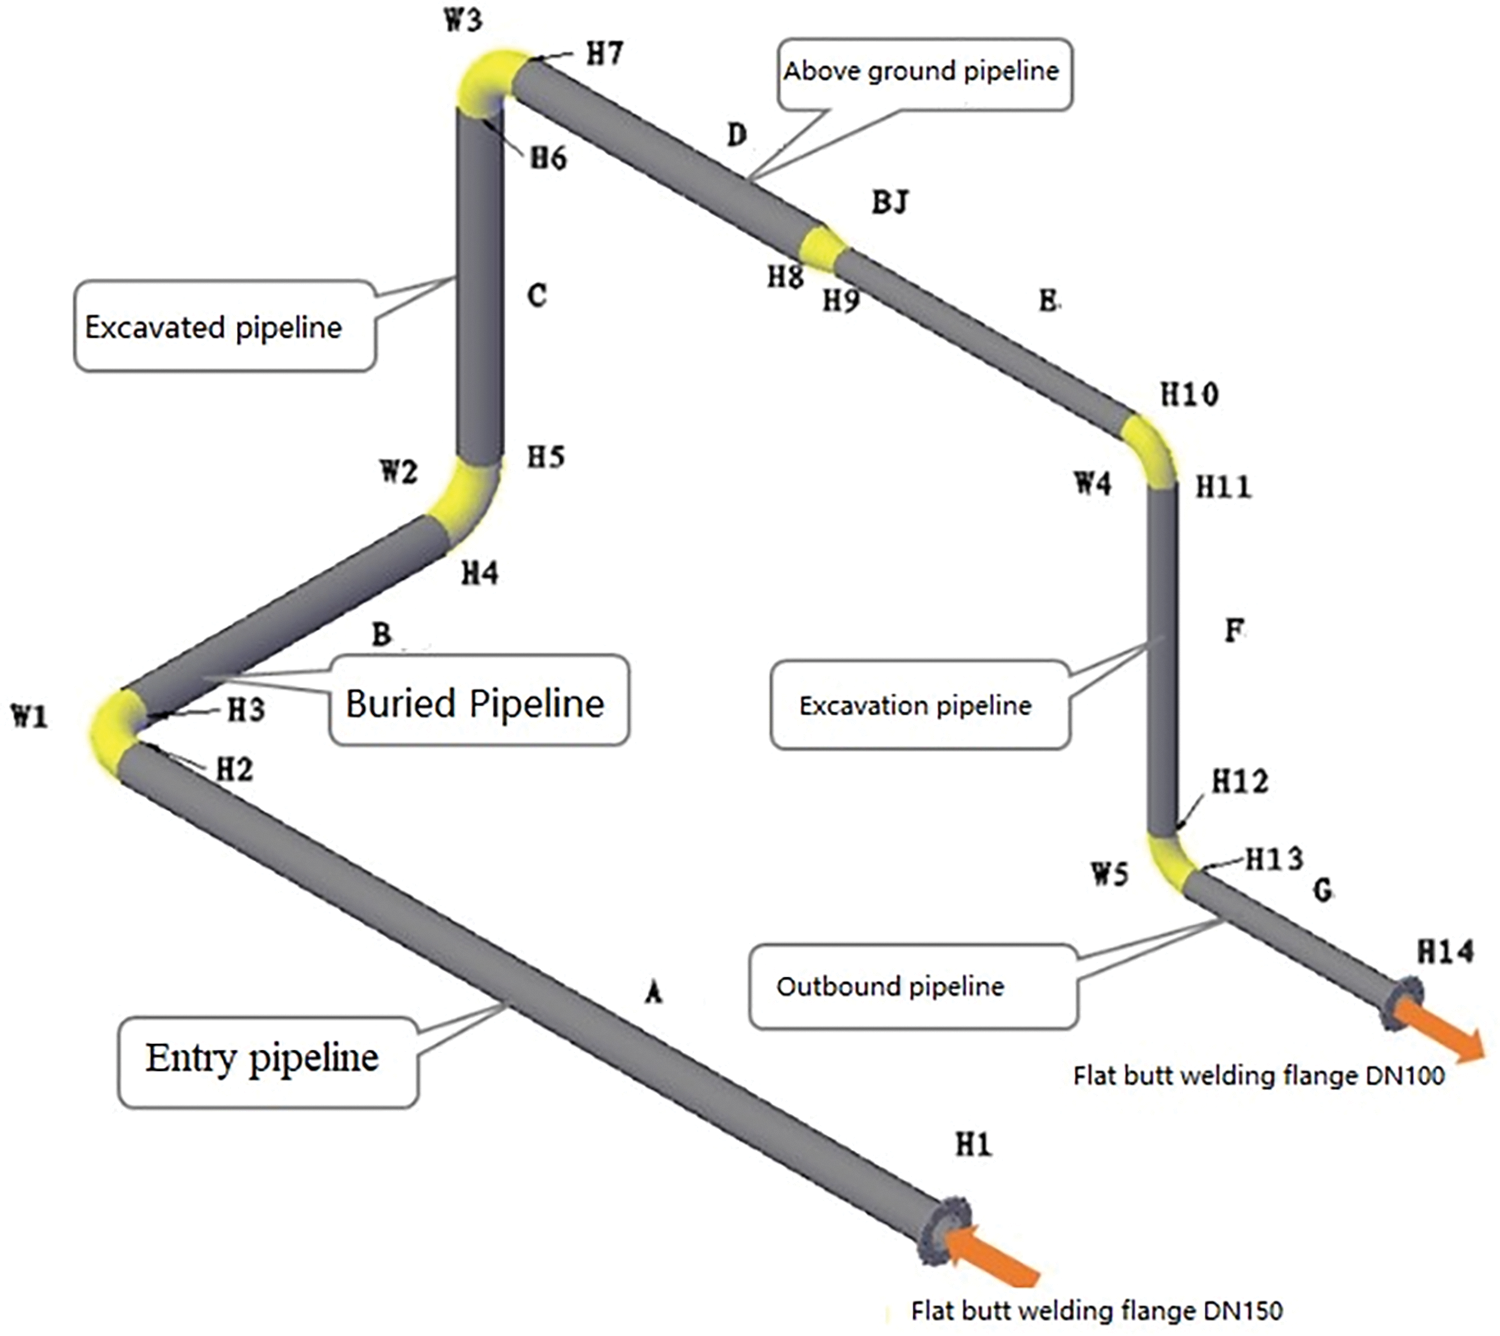
Figure 9: Design diagram of corrosion defect simulation platform (composite pipe)
Using a standard internal corrosion defect modeling platform, a technical verification and assessment work was carried out to further elucidate the efficacy and applicability range of in-service NDT technologies for actual internal corrosion defects. A thorough assessment of the applicability bounds of detection technologies was carried out by compiling the technical principles, defect characteristics, testing needs, and operational conditions. This resulted in the formation of a complete integrity testing technology process with core technology.
In several oilfields, including Southwest Oilfield, Tarim Oilfield, Daqing Oilfield, and Changqing Oilfield, more than 2700 km of collection pipelines and 14 sets of oil and gas processing facilities were tested between 2019 and 2021. We found around 20,000 sets of internal corrosion faults. Comparing the data revealed that the accuracy of quantitative data for defect sizes improved by 22% and the detection rate of problems in the same pipeline increased by 31% over the previous period.
Our approach takes into account a greater number of variables than conventional finite-element modeling techniques, such as variations in temperature, pressure, and material deterioration over time. These elements are frequently overlooked in traditional studies while being essential for precisely forecasting pipeline breakdowns. Our study illustrates how these extra factors enhance the model’s forecast accuracy and dependability.
A big data analysis-based platform for simulating internal corrosion defects in natural gas pipelines was proposed in response to the dearth of a trustworthy evaluation platform for NDT technologies and the difficulty of confirming the efficacy of various detection technologies for actual internal corrosion defects. This study addresses important issues in pipeline monitoring and maintenance by providing a novel methodology for evaluating the structural integrity of steel gas pipelines. The suggested method offers notable benefits over conventional techniques and improves flaw identification accuracy. In order to enable preventive maintenance techniques, future work will concentrate on integrating this methodology with real-time monitoring systems. The size and distribution characteristics of internal corrosion defects in natural gas pipelines, as well as the morphology and distribution characteristics of erosion and wear inside bends, were discovered through statistical analysis of a significant amount of data on pipeline internal corrosion defects and bend simulation. The typical sizes and distribution features of corrosion flaws in natural gas pipelines were recovered using the K-means clustering algorithm. To assess and confirm the suitability and efficacy of in-service detection technologies, a typical internal corrosion defect simulation platform was developed based on this and actual defect morphology. Comparative analysis was then carried out on-site. The following are the primary conclusions:
(1) In natural gas pipelines, internal corrosion flaws have a log-normal distribution for length and width, a normal distribution for clock position, and a Freundlich EX function distribution for peak depth.
(2) Under various pipeline material and transport medium conditions, the K-means clustering algorithm may easily and rapidly obtain typical characteristics of internal corrosion flaws. The resulting typical size and circumferential distribution features are representative and can satisfy the design requirements of the corrosion defect modeling platform, particularly when classifying corrosion defects in natural gas pipelines into three groups.
(3) A thorough selection concept for internal corrosion defect detection technologies was formed by verifying the boundary conditions and application range of different NDT technologies.
(4) The findings of field detection demonstrated a 31% improvement in defect detection rate and a 22% increase in quantitative data accuracy for defect sizes.
Although this study offers a fresh strategy for managing pipeline integrity, more effort is required to incorporate the suggested approach with real-time monitoring technologies. Future studies will concentrate on creating a completely automated system that can monitor pipeline conditions continually and anticipate breakdowns before they happen. Future research will also examine how environmental elements, like seasonal temperature fluctuations and material aging, affect pipeline health.
Acknowledgement: The authors gratefully acknowledge support for this work from the “13th Five-Year Plan” National Science and Technology Major Project “Demonstration Project for the Development of Large Carbonate Gas Fields in the Sichuan Basin” and the China National Petroleum Corporation Science and Technology Project “Research on the Safety Assessment System for the Whole Life Cycle of Gas Storage in Oil and Gas Reservoir Type”.
Funding Statement: The “13th Five-Year Plan” National Science and Technology Major Project, 2016ZX05052, Changchao Qi. The China National Petroleum Corporation Science and Technology Project, 2021DJ6505, Changchao Qi.
Author Contributions: Changchao Qi: Conceptualisation, Investigation, Formal analysis, Project administration, Writing—original draft. Lingdi Fu: Investigation, Resources, Writing—review & editing. MingWen and Hao Qian: Supervision, Resources, Writing—review & editing. Shuai Zhao: Conceptualisation, Supervision, Resources, Project administration, Writing—review & editing. All authors reviewed the results and approved the final version of the manuscript.
Availability of Data and Materials: All data generated or analyzed during this study are included in this published article.
Ethics Approval: Not applicable.
Conflicts of Interest: The authors declare no conflicts of interest to report regarding the present study.
Abbreviations
| Symbol List | |
| σ | Stress |
| Strain | |
| E | Elastic modulus |
| Coefficient of thermal expansion | |
| Abbreviations | |
| FEM | Finite Element Method |
| MFL | Magnetic Flux Leakage |
| NDT | Non-Destructive Testing |
References
1. Zhang K, Zhu LX, He Z, Li K, Liu C. Failure analysis of X52 gas pipeline corrosion. Corros Prot. 2020;41(4):73–8. [Google Scholar]
2. Shang BJ, Li CJ, Hu ML. Corrosion prediction of artificial gas pipeline based on dual-fluid model. J Southwest Pet Univ. 2018;40(6):152–60. [Google Scholar]
3. Ma TX, Gou WT, Tang Y, Chang XP, Tang L. Study on constitutive relationship and failure criteria of X52 pipeline steel. J Southwest Pet Univ. 2014;36(4):162–8. [Google Scholar]
4. Liu P, Li YX, Yang H, Wang WC, Liu CW, Zhang Y, et al. Quantitative evaluation method of consequence of leakage accident derived from gas pipeline. Oil Gas Storage Transp. 2021;40(6):664–72. [Google Scholar]
5. Zhang X, Shuai J. Distribution law of pipeline corrosion defects based on internal inspection data. Oil Gas Storage Transp. 2018;37(9):980–5. [Google Scholar]
6. Liao KX, Leng JH, He TJ, Liu X, Peng H. A method for corrosion defect detection of buried pipeline. Corros Prot. 2021;42(2):52–5, 69. [Google Scholar]
7. Wu ZP, Chen ZH, Dai LS, Hu YB, Bi WX. Development status and thinking of oil and gas pipeline corrosion detection technology. Oil Gas Storage Transp. 2020;39(8):851–60. [Google Scholar]
8. Wu GH, Xiong HJ. Current situation and research progress of radiographic testing technology in China. Chin J Sci Instrum. 2016;37(8):1683–95. [Google Scholar]
9. Shen GT, Wu XJ, Wang BX, Hu B. Development of an electromagnetic detection instrument for corrosion of large steel structure steel plates based on variable frequency domain. J Mech Eng. 2021;57(6):1–9. [Google Scholar]
10. Jiang LL, Li LJ, Su BH, Wang ZT, Zhang YJ. Application of acoustic emission technology in corrosion detection of tank bottom plate. Corros Prot. 2021;42(2):56–9,77. [Google Scholar]
11. Zhang ZP, Huang K, Wang X, Liu YJ. Research on corrosion detection of buried pipeline based on weak magnetic effect. Mater Prot. 2020;53(10):107–11. [Google Scholar]
12. Zhang D, Gui J, Zhou ZH. Overview of ultrasonic phased array full-focus non-destructive testing technology. Acoust Technol. 2018;37(4):320–5. [Google Scholar]
13. Ren TJ, Jin HL, Xu F, Chen YR, Liu BT, Zhou Y. Eddy current detection method for double-layer column defects of weak magnetic oil pipes in high-sulfur gas fields. J Sens Technol. 2020;33(12):1698–706. [Google Scholar]
14. Afanasyev AV, Mel’Nikov AA, Konovalov SV. The analysis of the influence of various factors on the development of stress corrosion defects in the main gas pipeline walls in the conditions of the European part of the Russian Federation. Int J Corros. 2015;1(73):308–13. doi:10.15587/1729-4061.2015.37802. [Google Scholar] [CrossRef]
15. Zhang DL, Yang LY, Tan ZW, Xing SH, Bai SY, Wei EZ, et al. Corrosion behavior of X65 steel at different depths of pitting defects under local flow conditions. Exp Therm Fluid Sci. 2021;14(1):110333. doi:10.1016/j.expthermflusci.2020.110333. [Google Scholar] [CrossRef]
16. Wang FF. Research and application of improved k-means clustering algorithm [master’s thesis]. Lanzhou, China: Lanzhou Jiaotong University; 2017. [Google Scholar]
17. Nurlan Z, Ulzhan I, Alpysbay A, Svetlana B, Arman M. Finite-element modeling of the temperature effect on extended avalanche damage of gas main pipelines. Materials. 2024;17(9):1963. doi:10.3390/ma17091963. [Google Scholar] [PubMed] [CrossRef]
18. Li HB, Wei FY, Zhang JL, Liu ZW, Huang J, Fang YY. Algorithm for selecting k-means initial clustering centers based on the structure coefficient. Comput Digit Eng. 2023;51(5):993–6,1107. [Google Scholar]
19. Nurlan Z, Ulzhan I, Marco BU, Konstantin A, Maryna C, Aigerim Y. Novel methodologies for preventing crack propagation in steel gas pipelines considering the temperature effect. Struct Durab Health Monit. 2025;19(1):1–23. doi:10.32604/sdhm.2024.053391. [Google Scholar] [CrossRef]
Cite This Article
 Copyright © 2025 The Author(s). Published by Tech Science Press.
This work is licensed under a Creative Commons Attribution 4.0 International License , which permits unrestricted use, distribution, and reproduction in any medium, provided the original work is properly cited.
 Downloads
 Citation Tools