
 Submit a Paper
 Propose a Special lssue
 Open Access
ARTICLE
Flexural Performance of UHPC-Reinforced Concrete T-Beams: Experimental and Numerical Investigations
1 Guangzhou Guangjian Construction Engineering Testing Center Co., Ltd., Guangzhou, 510405, China
2 School of Civil and Transportation Engineering, Guangdong University of Technology, Guangzhou, 510006, China
* Corresponding Author: Shaohua He. Email:
(This article belongs to the Special Issue: Innovative and Sustainable Materials for Reinforced Concrete Structures)
Structural Durability & Health Monitoring 2025, 19(5), 1167-1181. https://doi.org/10.32604/sdhm.2025.064450
Received 16 February 2025; Accepted 21 April 2025; Issue published 05 September 2025
 View Full Text
 Download PDF
Abstract
This study investigates the flexural performance of ultra-high performance concrete (UHPC) in reinforced concrete T-beams, focusing on the effects of interfacial treatments. Three concrete T-beam specimens were fabricated and tested: a control beam (RC-T), a UHPC-reinforced beam with a chiseled interface (UN-C-50F), and a UHPC-reinforced beam featuring both a chiseled interface and anchored steel rebars (UN-CS-50F). The test results indicated that both chiseling and the incorporation of anchored rebars effectively created a synergistic combination between the concrete T-beam and the UHPC reinforcement layer, with the UN-CS-50F exhibiting the highest flexural resistance. The cracking load and ultimate load of UN-CS-50F were 221.5% and 40.8%, respectively, higher than those of the RC-T. Finite element (FE) models were developed to provide further insights into the behavior of the UHPC-reinforced T-beams, showing a maximum deviation of just 8% when validated against experimental data. A parametric analysis varied the height, thickness, and material strength of the UHPC reinforcement layer based on the validated FE model, revealing that increasing the UHPC layer thickness from 30 to 50 mm improved the ultimate resistance by 20% while reducing the UHPC reinforcement height from 440 to 300 mm led to a 10% decrease in bending resistance. The interfacial anchoring rebars significantly reduced crack propagation and enhanced stress redistribution, highlighting the importance of strengthening interfacial bonds and optimizing geometric parameters of UHPC for improved T-beam performance. These findings offer valuable insights for the design and retrofitting of UHPC-reinforced bridge girders.Keywords
Concrete T-beams are widely used in civil and infrastructure construction due to their structural efficiency and simplicity [1,2]. However, with prolonged service life and increased traffic loads, many T-beam structures face significant challenges, such as concrete carbonation, crack propagation, and reinforcement corrosion, compromising their structural integrity and serviceability [3,4]. Recently, ultra-high performance concrete (UHPC) has gained attention in the research community for its remarkable mechanical properties, including high strength and toughness [5–7], leading to proposals for its application in reinforcing deficient concrete T-beams.
Numerous studies have explored the effectiveness of UHPC-reinforced T-beams. For example, Long et al. [8] experimentally assessed the contribution of the UHPC layer to the flexural behavior of impaired T-beams. Their findings revealed that increasing the UHPC thickness significantly improved the structure’s cracking and ultimate resistance. Qiu et al. [9] investigated the flexural behavior of UHPC low-profile T-beams reinforced with a combination of steel fibers and steel bars. It is reported that a higher reinforcement ratio increased the beam’s load-bearing capacity and flexural stiffness. Khodayari et al. [10] also examined the effects of reinforcement ratio and prestressing on UHPC-reinforced T-beams. Their results showed that both prestressing and UHPC significantly enhanced the ultimate resistance of the T-beam structure.
Despite the above findings, recent concerns have been raised about potential delamination between the UHPC and existing concrete [11,12]. Several studies have investigated the bond performance at the UHPC-NC interface. Wang et al. [13] studied UHPC-NC bonding performance using various surface treatments in shear tests. It is reported that grooved treatments and rebar anchoring improved ductility and bond strength between the UHPC and NC (normal concrete). Tong et al. [14] experimentally confirmed that roughening treatments at the interface significantly enhanced bond strength in UHPC-NC composite beams. These studies highlight the effectiveness of substrate roughening and rebar anchoring in improving the bond performance between UHPC and NC. However, previous studies mainly concentrated on the impacts of UHPC layer thickness, fiber content, and reinforcement position on the UHPC-reinforced T-beams, limited attention has been given to the effects of different interfacial treatments on the flexural properties of the reinforced structure.
This study aims to fill the research gap by investigating the flexural performance of UHPC-reinforced T-beams with various interface treatments. Three concrete T-beams were carefully fabricated and subjected to failure testing, with detailed analyses of their failure modes, load-displacement relationships, and key bending properties. Additionally, finite element (FE) models of the UHPC-reinforced T-beams were developed and calibrated, followed by parametric analyses to assess the influence of UHPC layer thickness and height on the beam’s flexural behavior. The insights gained from this research serve as a valuable reference for designing and optimizing UHPC-reinforced T-beams.
2.1 Specimen Design and Fabrication
The geometric dimensions of the T-beam model examined were derived from an actual bridge in China, scaled down at a ratio of 1:2.5. The bridge features a supported T-beam structure with a constant sectional depth of 1300 mm, while the thickness of the web measures 200 mm at the mid-span and 300 mm at the supports, with the top flange maintaining a uniform thickness of 150 mm. Fig. 1 shows the configuration of the T-beam specimen, which has a total length of 3000 mm and a height of 520 mm, with the top flange measuring 640 mm in width and 60 mm in thickness. The web measures 440 mm in height and 120 mm in width. Two distinct surface treatment methodologies were employed at the interface between the UHPC and NC: the surface of the NC beam was roughened by chipping to expose the coarse aggregates on the bonding surface to a depth of approximately 4 mm, with any loose debris removed afterwards, and holes were drilled into the NC to a depth of 50 mm for inserting reinforcing bars with a diameter of 8 mm. After cleaning out the dust inside the holes, epoxy structural adhesive was slowly injected, filling the holes to about two-thirds of their capacity, and the reinforcing bars were gradually rotated into the holes, causing a slight overflow of adhesive to ensure that there was no air bubbles between the bars and the adhesive.
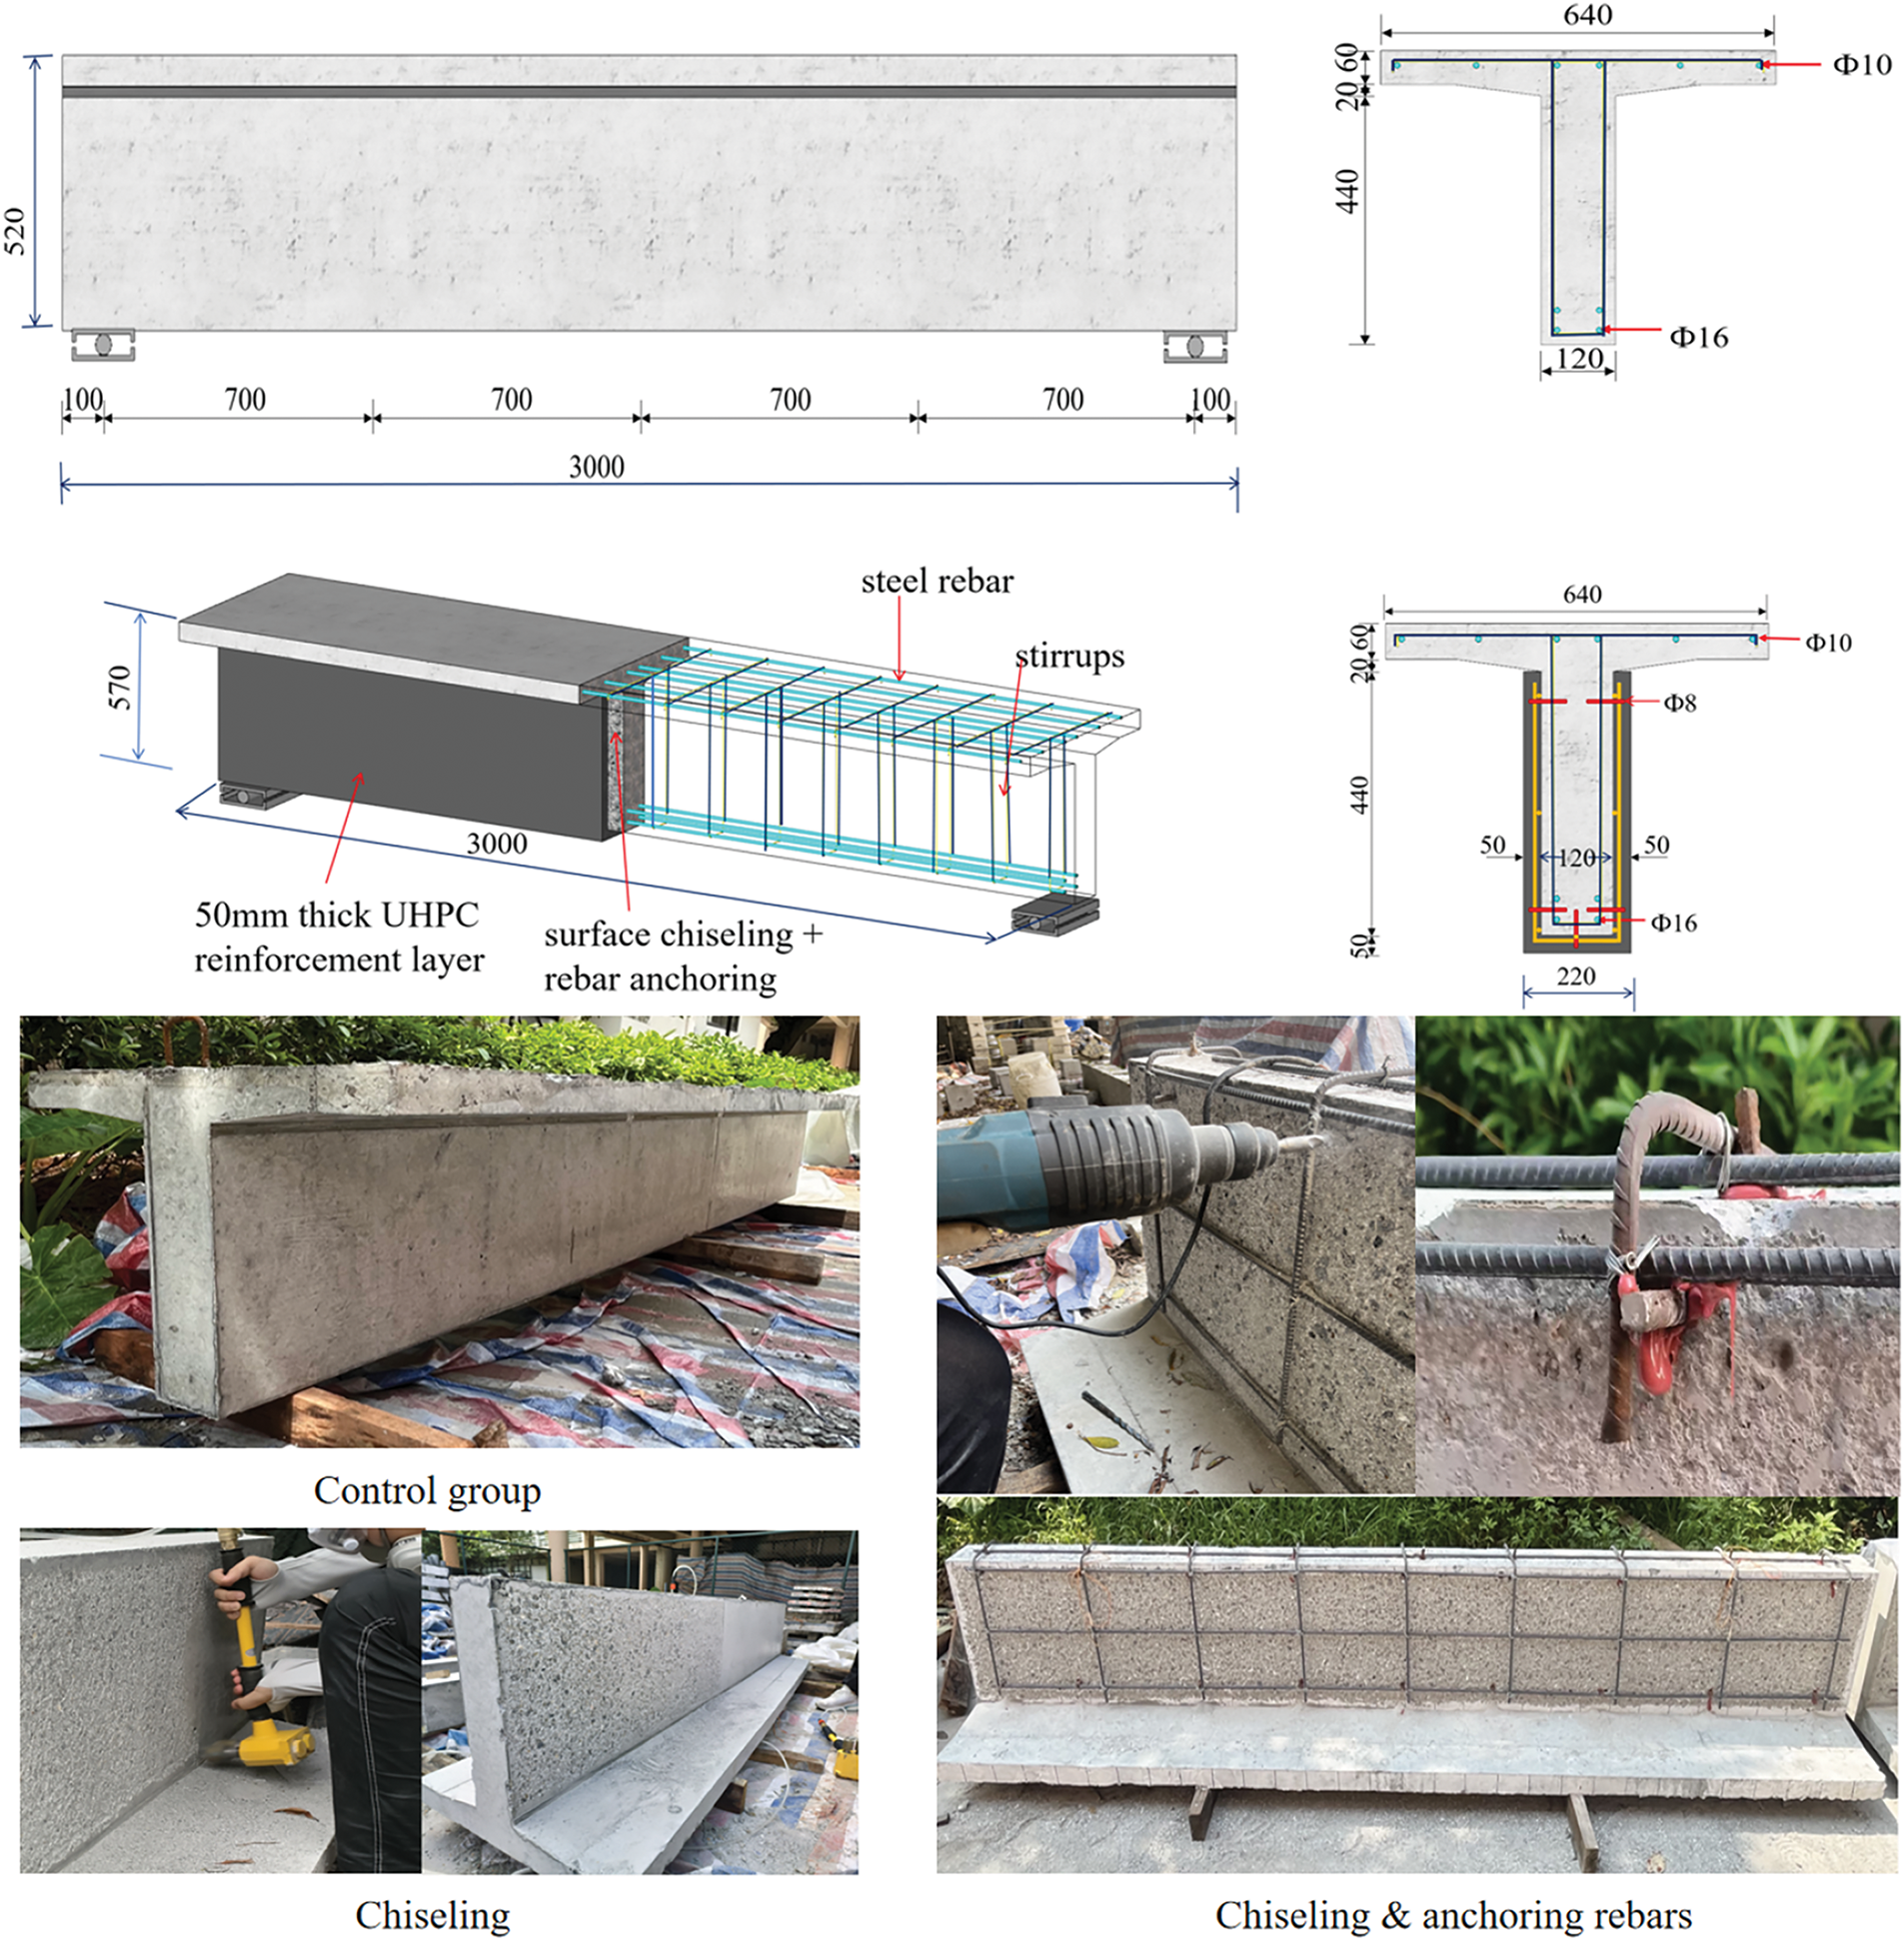
Figure 1: Configuration of T-beam specimens with interface treatment details (Unit: mm)
The design parameters of the UHPC-reinforced T-beams are summarized in Table 1. The specimen nomenclature is defined as follows: “RC-T” denotes the unreinforced T-beam (benchmark specimen), “UN” refers to the UHPC-reinforced T-beam, “CS” signifies interfacial treatment combining surface chiseling and rebar anchoring, “C” represents surface chiseling alone, “F” indicates height reinforcement, and “50” corresponds to a UHPC layer thickness of 50 mm. For instance, UN-CS-50F describes a UHPC-reinforced T-beam with a 50 mm thick UHPC layer, employing full-section reinforcement and interfacial chiseling with embedded rebar anchoring.
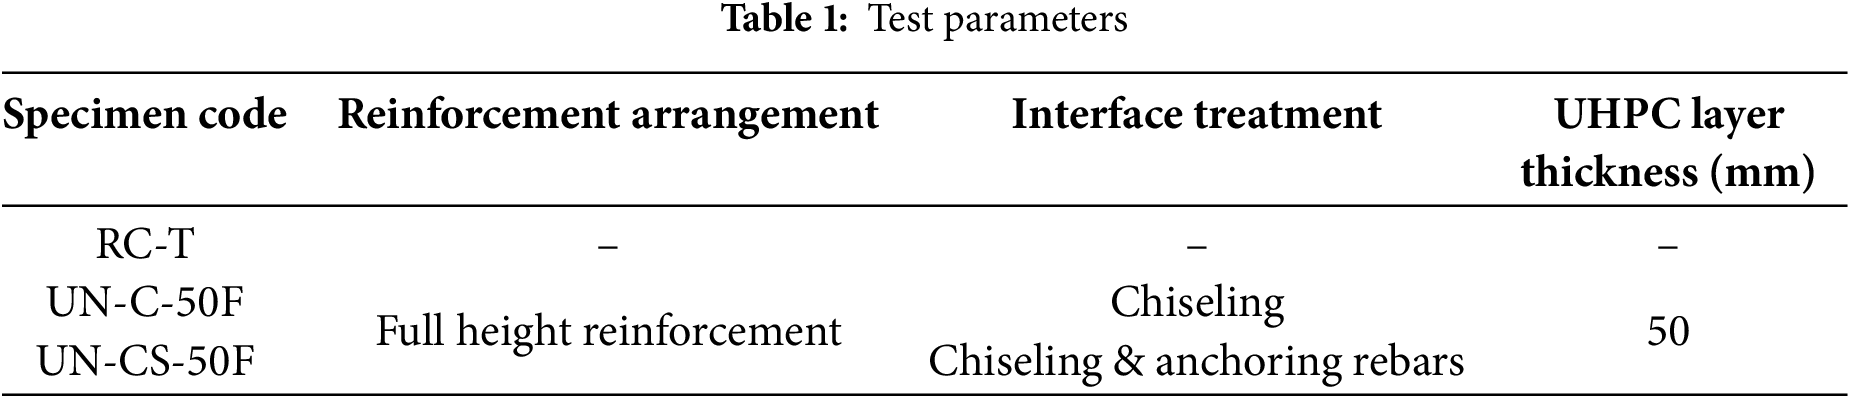
Fig. 2 illustrates the fabrication process of the specimen, which includes the construction of formwork, binding of reinforcements, casting and curing of concrete, surface treatment of RC (reinforce concrete), and the pouring of UHPC. The formwork was constructed using 30 mm thick wooden planks, and longitudinal rebar was placed in the top slab, with all bars tied together to form a cohesive cage with stirrups. NC was then cast and covered with a film to ensure moist curing for 28 days. The surface treatment of the RC beam involved chiseling to a depth of 4 mm to expose the aggregates, drilling to a depth of 50 mm for 8 mm rebar, and injecting epoxy resin anchor adhesive to guarantee bubble-free bonding. Finally, the T-beam was inverted for UHPC casting, with the formwork removed after 7 days of watering while still covered with film, followed by an additional curing period of 28 days.
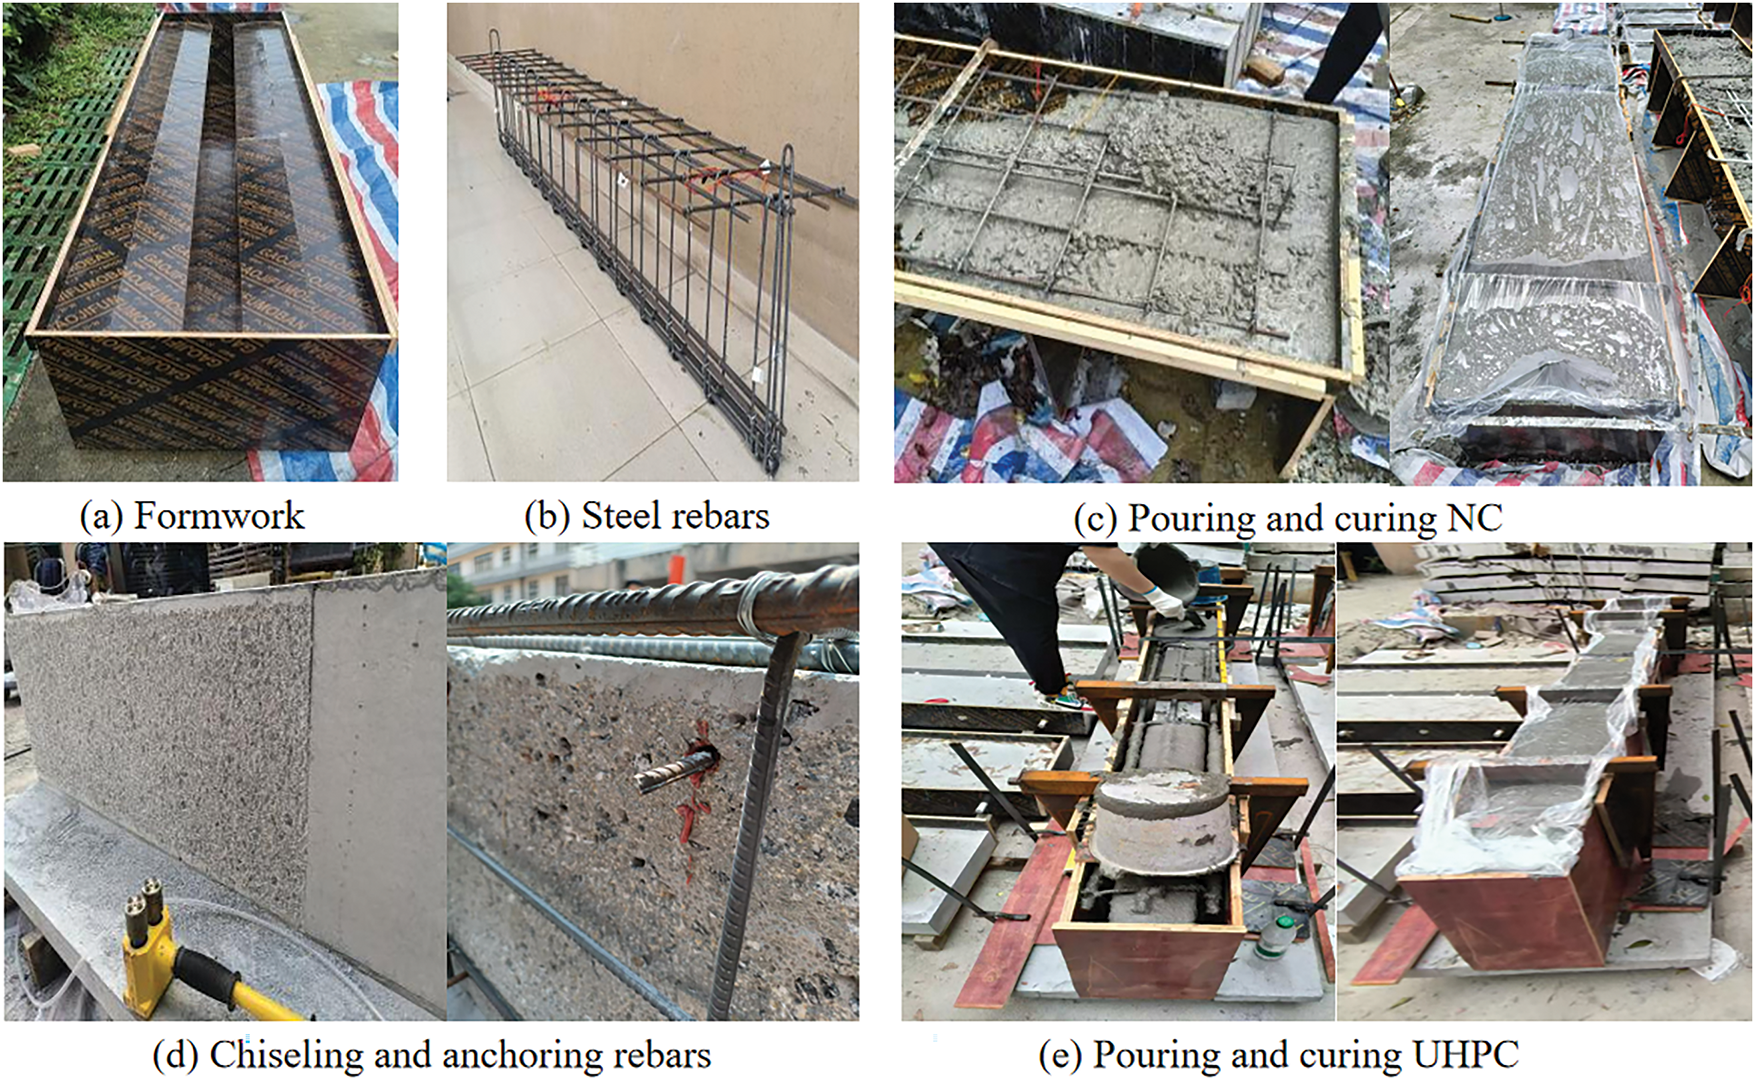
Figure 2: Fabrication of test specimens
The NC used was C55, while the UHPC was identified as U120. The properties of the concrete materials, including cubic compressive strength, prism compressive strength, and elastic modulus, were measured according to Chinese codes [15,16]. The C55 concrete exhibited a cubic compressive strength of 66 MPa, a prism compressive strength of 57 MPa, and an elastic modulus of 36.8 GPa. The UHPC had a cubic compressive strength of 129 MPa, a prism compressive strength of 111 MPa, and an elastic modulus of 39.5 GPa. The steel reinforcement bars used were classified as grade HRB400, with a yield strength of 455 MPa and an elastic modulus of 200 GPa, as determined by BS EN 10080–2005 [17].
Surface roughness is critical for the bonding properties between the UHPC and NC [18,19]. In this study, the sand-filling technique was used to quantify substrate roughness [20,21] (Fig. 3). First, four plastic plates are carefully positioned around the concrete substrate, ensuring that their upper edges align with the highest points of the surface profile. Next, standardized fine sand is evenly distributed over the target measurement area and leveled with a straightedge. Sand particles that remain in surface depressions are then collected, and their total volume is measured using graduated cylinders. Finally, the average depth of sand filling, a direct indicator of surface roughness, is calculated using the following equation:
Figure 3: Sand filling method
where, Hs represents the average depth of sand filling (mm); Vs is the volume of sand (mm3); and As represents the area of the treated concrete substrate (mm2). The test results indicate that the surface treated by chiseling in this study measures 4 mm, which produced a 97.9% higher interface shear bond strength than the smooth surface [22].
2.4 Test Setup and Instrumentation
Fig. 4 shows the experimental setup that employed a servo-controlled press to apply four-point bending loads. The T-beams were horizontally aligned on plastered bases and supported by hinges spaced 2900 mm apart. Initially, a preloading stage of 10 kN was performed to ensure accurate equipment calibration and system stability. Following this, the formal loading stage commenced, during which loads were applied incrementally in steps of 50 kN, with each increment maintained for a minimum of 1 min to observe the structural behavior. Once visible cracks appeared, the loading protocol switched to displacement control, progressing at a rate of 0.5 mm/min until ultimate failure occurred. To monitor deformation, linear variable differential transformers (LVDTs) were strategically placed at critical locations: L/4, mid-span, and 3 L/4 along the beam span.
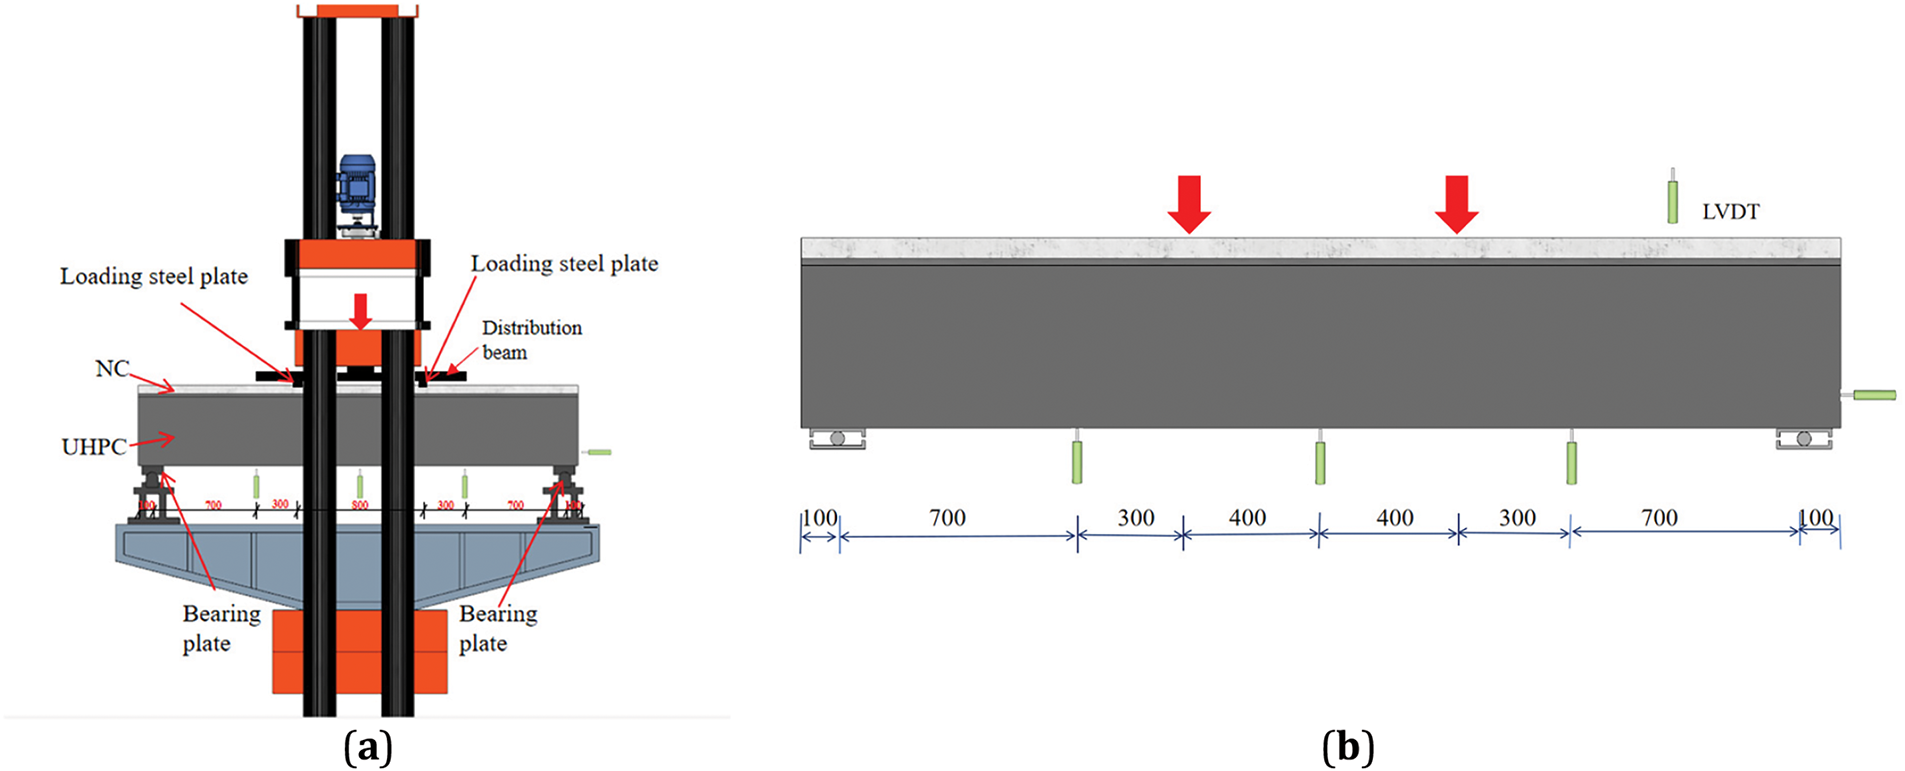
Figure 4: Arrangement of loading device and sensor: (a) Test device; (b) Displacement sensors
3 Experimental Results and Analysis
Fig. 5 presents the failure modes of the UHPC-reinforced T-beams. The benchmark beam, RC-T, displays a typical bending failure pattern characterized by numerous dense cracks in the pure bending region. In contrast, the damage patterns observed in the T-beams strengthened with UHPC differ significantly from the benchmark. As depicted in Fig. 5, the cracks in the pure bending region of UN-CS-50F and UN-C-50F are shorter and sparser compared to the cracks in RC-T. This difference is attributed to the cracking localization effect of the UHPC material, which stems from the relatively weak crack bridging provided by the short, straight steel fibers within the UHPC. Overall, the reliable bonding between the UHPC and NC demonstrates that the chiseling and chiseling-anchoring rebars interface treatment methods effectively ensure a synergistic combination of the concrete T-beam and the UHPC layer.
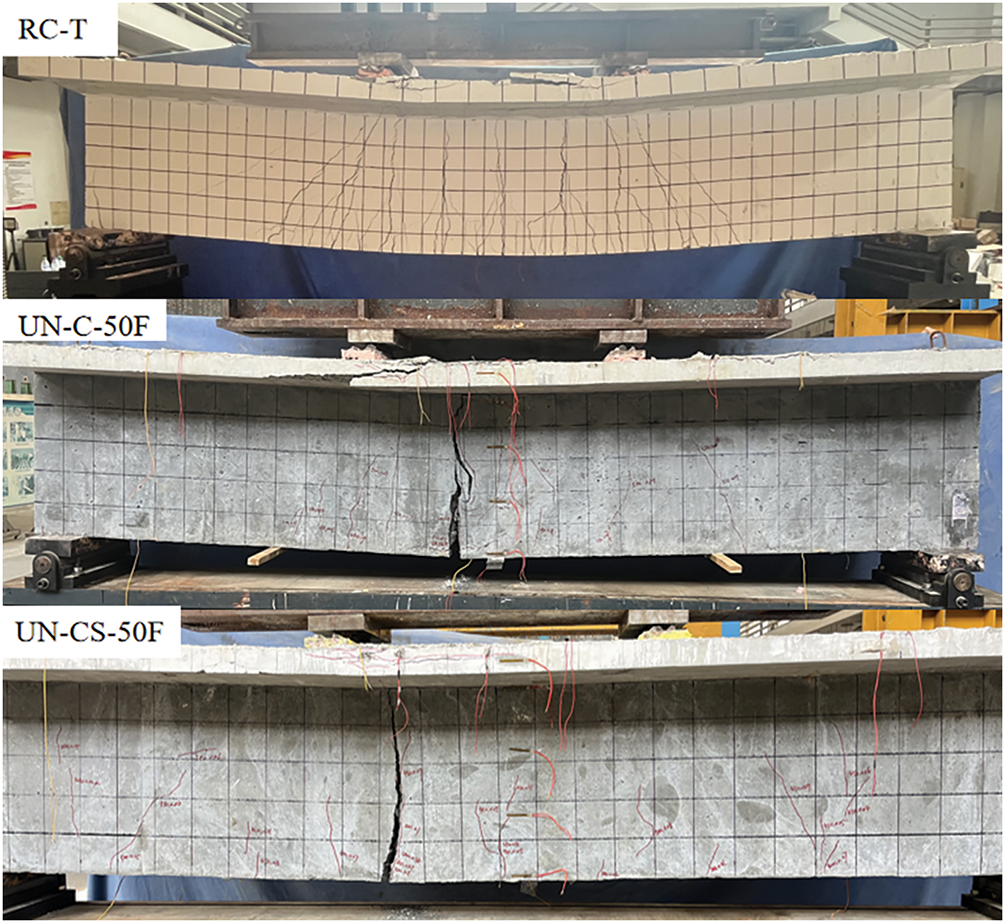
Figure 5: Failure modes
Fig. 6 shows the load-deflection curves for the mid-span section of the T-beams. The deflection of the UHPC-reinforced T-beams (UN-CS-50F and UN-C-50F) can be characterized by three distinct stages: (i) the elastic stage, where the curve rises continuously and displays a nearly linear relationship; (ii) the elastic-plastic stage, during which the slope gradually decreases while the load increases steadily until the ultimate load is reached; and (iii) the failure stage, where the curve declines after the peak load is achieved, resulting in rapid displacement growth as the load decreases. In contrast, the load-deflection curve for the unreinforced T-beam (RC-T) comprises only the elastic and failure stages, with both the elastic stiffness and the peak load significantly lower than those of the UN-CS-50F and UN-C-50F beams. This difference is attributed to the UHPC layer, which enhances the beam’s flexural stiffness, cracking load, and ultimate resistance. Although the load-displacement curves of both treatments exhibit comparable trends, the chiseled-rebar-anchored method substantially improves bearing capacity and flexural stiffness, despite minimal changes to the flexural mechanism.
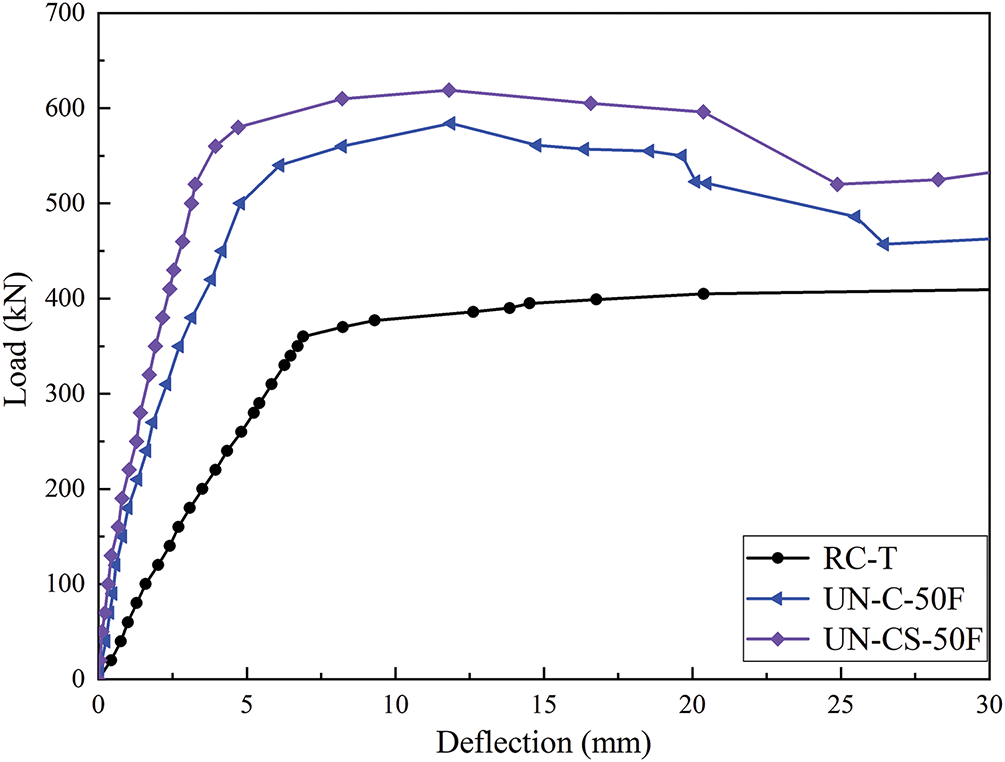
Figure 6: Load-deflection curve at mid-span point
Table 2 summarizes the mechanical properties of the T-beams. Pc, Py, and Pu represent the specimen’s cracking, yielding, and peak load, respectively. Δy and Δu indicate the mid-span displacements when the specimen reaches the yielding and peak loads, respectively. K denotes the bending stiffness, calculated as the ratio of Py to Δy.
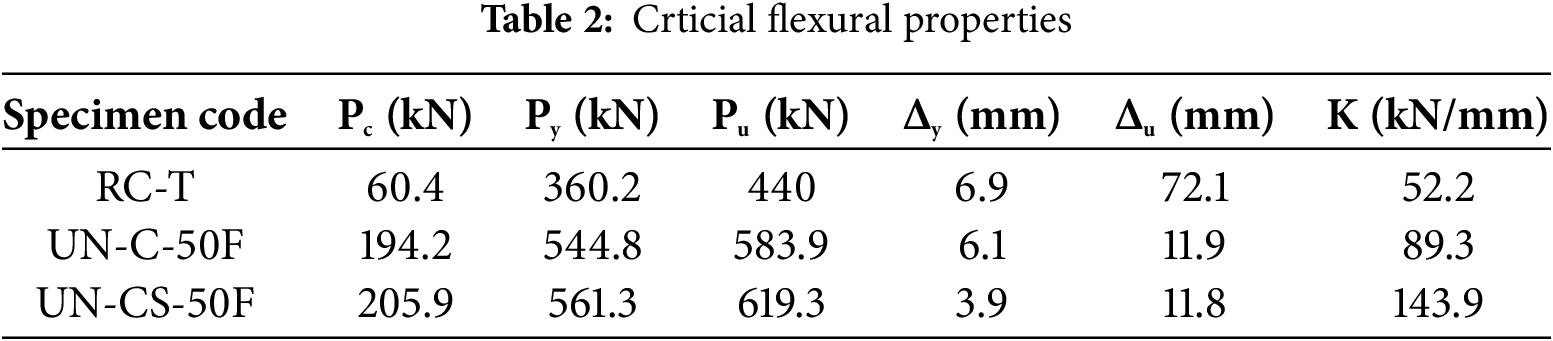
Table 2 indicates that applying UHPC layers significantly improves the flexural resistance of the T-beams. Compared to the RC-T, the yield strength (Py) increased by 51.3% for the UN-C-50F and 55.8% for the UN-CS-50F, while the peak load (Pu) improved by 32.7% and 40.8%, respectively. The bending stiffness (K) showed even greater enhancements, rising by 71% and 175.6%, respectively. The chiseling-anchoring rebar at the UHPC-NC interface also contributed to further strength improvements. When comparing UN-CS-50F to UN-C-50F, Py, Pu, and K increased by 51.3%, 32.7%, and 61.2%, respectively, demonstrating that anchoring shear rebars at the interface improves the interaction between the UHPC layer and the T-beam, thereby enhancing the overall flexural capacity.
4 Finite Element Model Establishment
4.1 Material Constitutive Models
The stress-strain relationship of the NC material was defined according to the Chinese code GB 50010-2010 [23]. A damage coefficient (d) was included in this constitutive relationship to formulate a plastic damage model. The key plastic damage parameters that characterize this model include an expansion angle of 30 degrees, a stress ratio of 1.16, an eccentricity of 0.1, an invariant stress ratio of 0.667, and a viscosity coefficient of 0.0004.
The compressive constitutive model for UHPC is based on the uniaxial compressive stress-strain curve equation proposed by Yang et al. [24], as illustrated in Eq. (2). In the equation, σc represents the cubic compressive stress, fc is the axial compressive strength, n denotes the elastic modulus ratio,
The interface between UHPC and NC utilizes the Cohesive Zone Model (CZM), and the reinforcement embedding uses the Combine39 element. The CZM is regarded as the most effective method for simulating the development of damage in adhesive joints. The constitutive relationship in the elastic stage of the CZM can be represented as follows:
The symbols σn, σs, and σt denote tensile stress, shear stress, and tearing stress, respectively, whereas δn, δs, and δt are associated with tensile strain, shear strain, and tearing strain. Similarly, Knn, Kss, and Ktt represent tensile stiffness, shear stiffness, and tearing stiffness. Kns, Knt, and Kst are assigned a value of zero, arising from the negligible thickness of the cohesive unit, which leads to the exclusion of normal deformations.
The failure initiation condition for the CZM is defined by the quadratic nominal stress criterion, as formulated in Eq. (5). Here,
Upon activation of the quadratic nominal stress criterion, the cohesive element initiates damage progression and a reduction in stiffness. The material behavior formulation during the damage development phase is defined by the following relationships:
where, D represents a value within the range of [0, 1], with 0 indicating no damage and 1 indicating complete failure. The effective displacement at the onset of damage, the effective displacement at the eventual occurrence of damage, and the maximum effective displacement obtained during the loading process are represented by
4.2 Element Selections and Mesh
The UHPC and NC members were modeled using solid elements (Solid 65), while load pads and supports were represented by Solid 45 elements. Steel rebars were modeled using Link 8 elements. The interaction between the NC and UHPC was defined using contact elements (Contact 173), while the interaction between concrete and steel rebars was handled via the coupling method. To enhance computational efficiency and accuracy, the mesh sizes were set to 20 mm × 60 mm × 50 mm and 30 mm × 60 mm × 30 mm. The detailed meshing configuration is shown in Fig. 7.
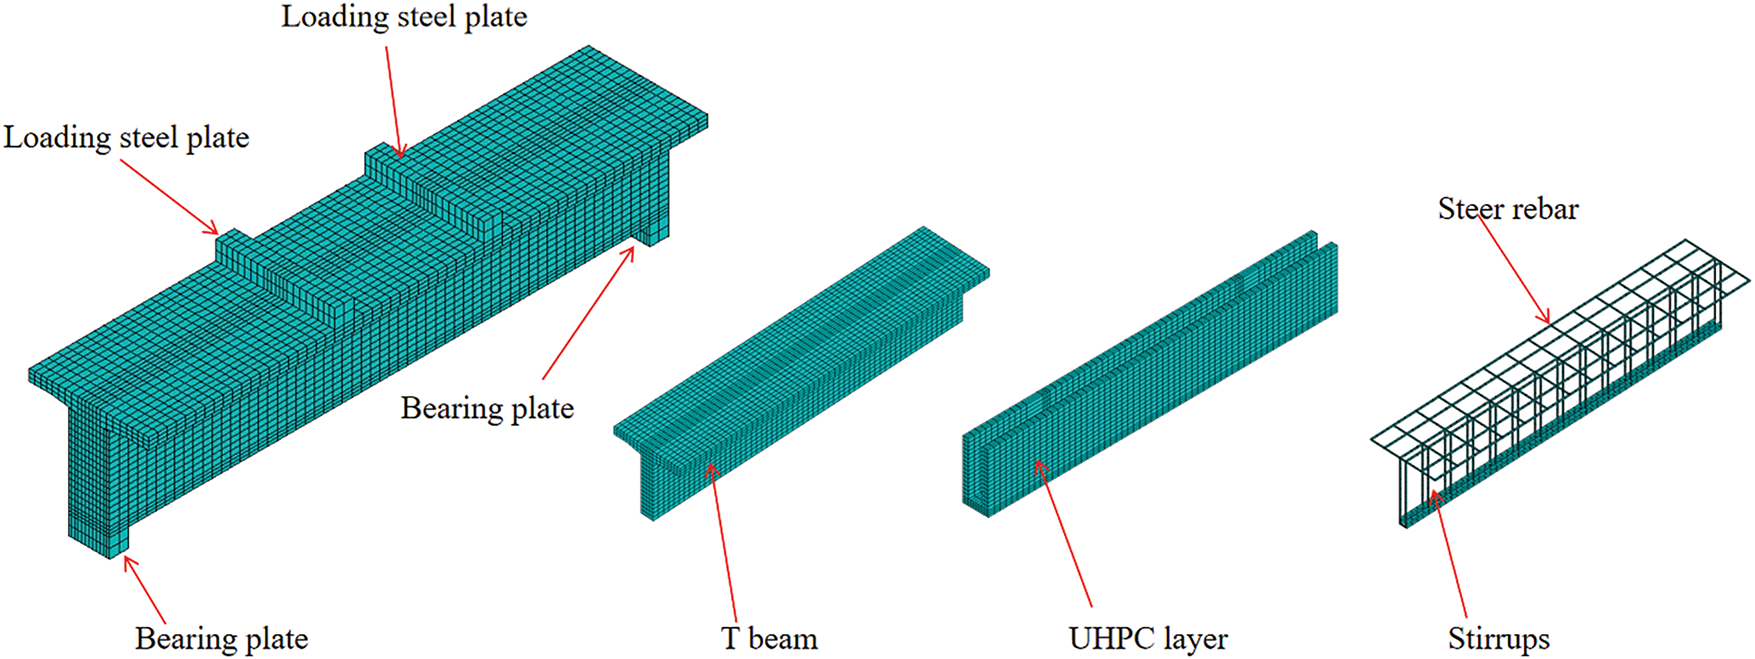
Figure 7: Finite element model mesh division
5 Discussion of Simulation Results
Fig. 8 illustrates the substantial agreement between FE predictions and experimental results for the UHPC-reinforced T-beams. The load-displacement curves from the FE model align closely with experimental data throughout all loading stages, with a maximum deviation of approximately 8% occurring near peak load and an average deviation below 5%. The discrepancy may be attributed to variations in material property assumptions. The predicted damage distribution, featuring crack initiation at the mid-span and progressive propagation toward the supports, closely aligns with experimental observations in terms of global crack topology, though the explicit representation of discrete wide cracks remains challenging due to the continuum-based formulation. Statistical validation further confirms the model’s reliability, achieving a correlation coefficient (R2) of 0.98 between simulated and experimental load values.
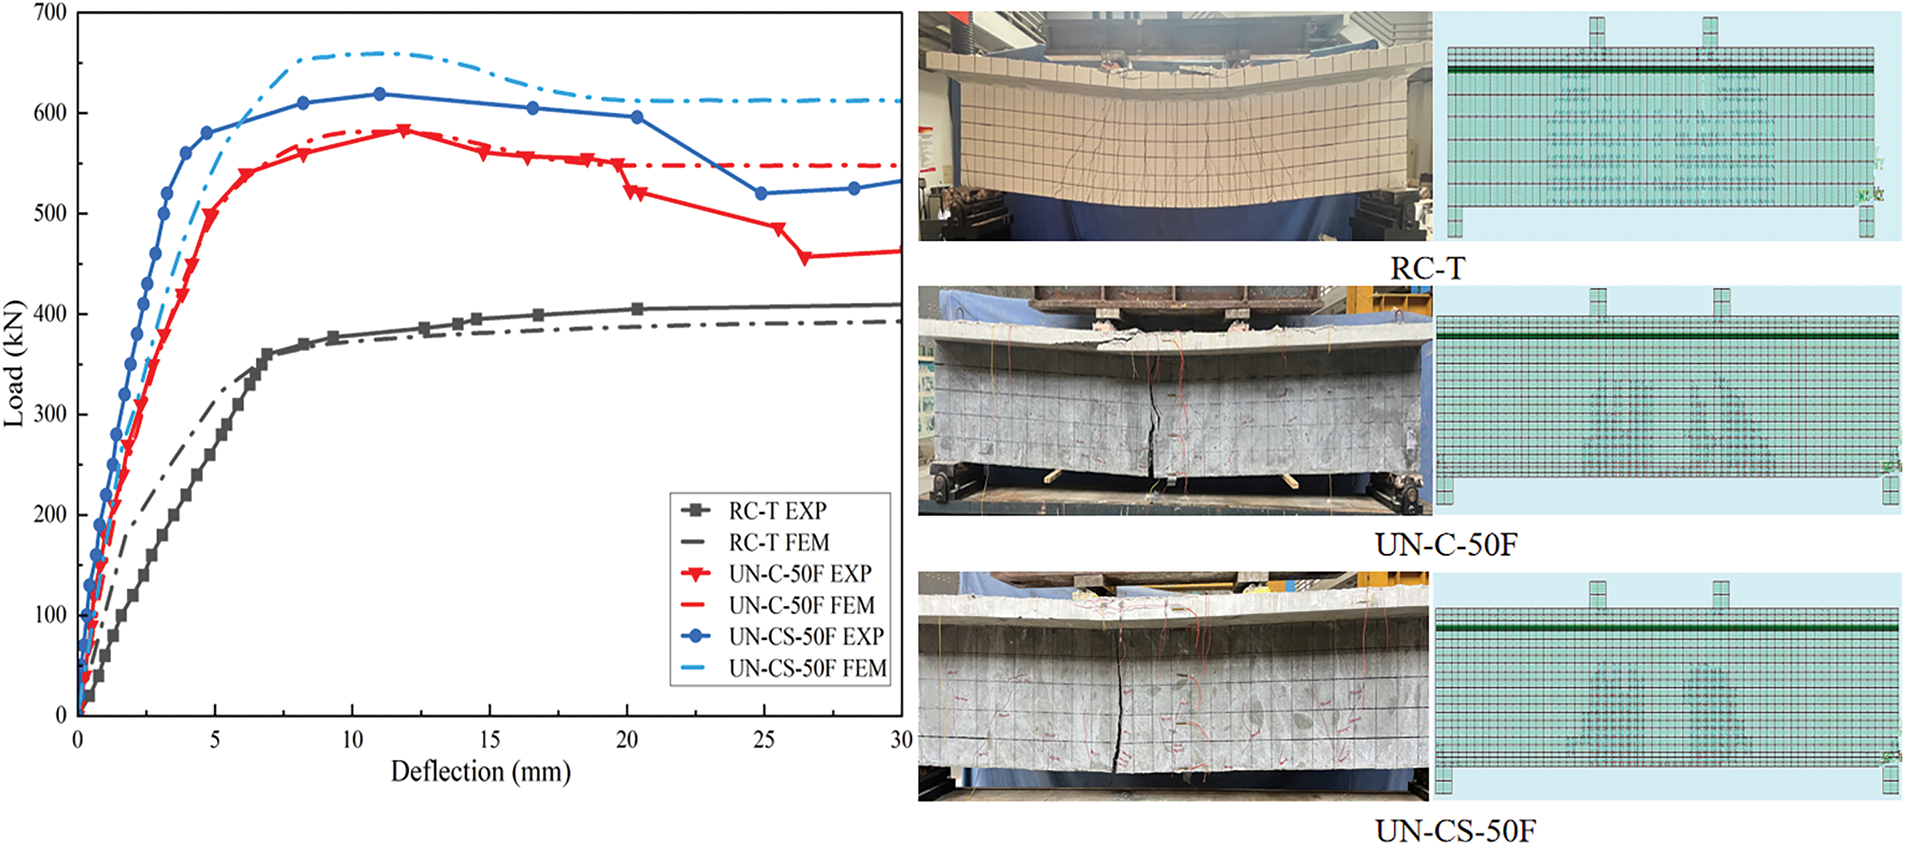
Figure 8: Verification of FE models
5.2 Parametric Analytical Models
The parametric analysis of the UHPC-reinforced T-beam structure mainly involves the factors of UHPC strength and UHPC reinforcement arrangement. The compressive strength of the UHPC employed includes 120, 140, 160, and 180 MPa. The UHPC reinforcement arrangement refers to the height and thickness of the UHPC layer attached to the beam’s web. As shown in Fig. 9, the reinforcement height of the UHPC layer includes 200, 300, 400, and 440 mm, denoted as H200, H, H400, and F, respectively. The reinforcement thickness of the UHPC layer consists of 30 and 50 mm.
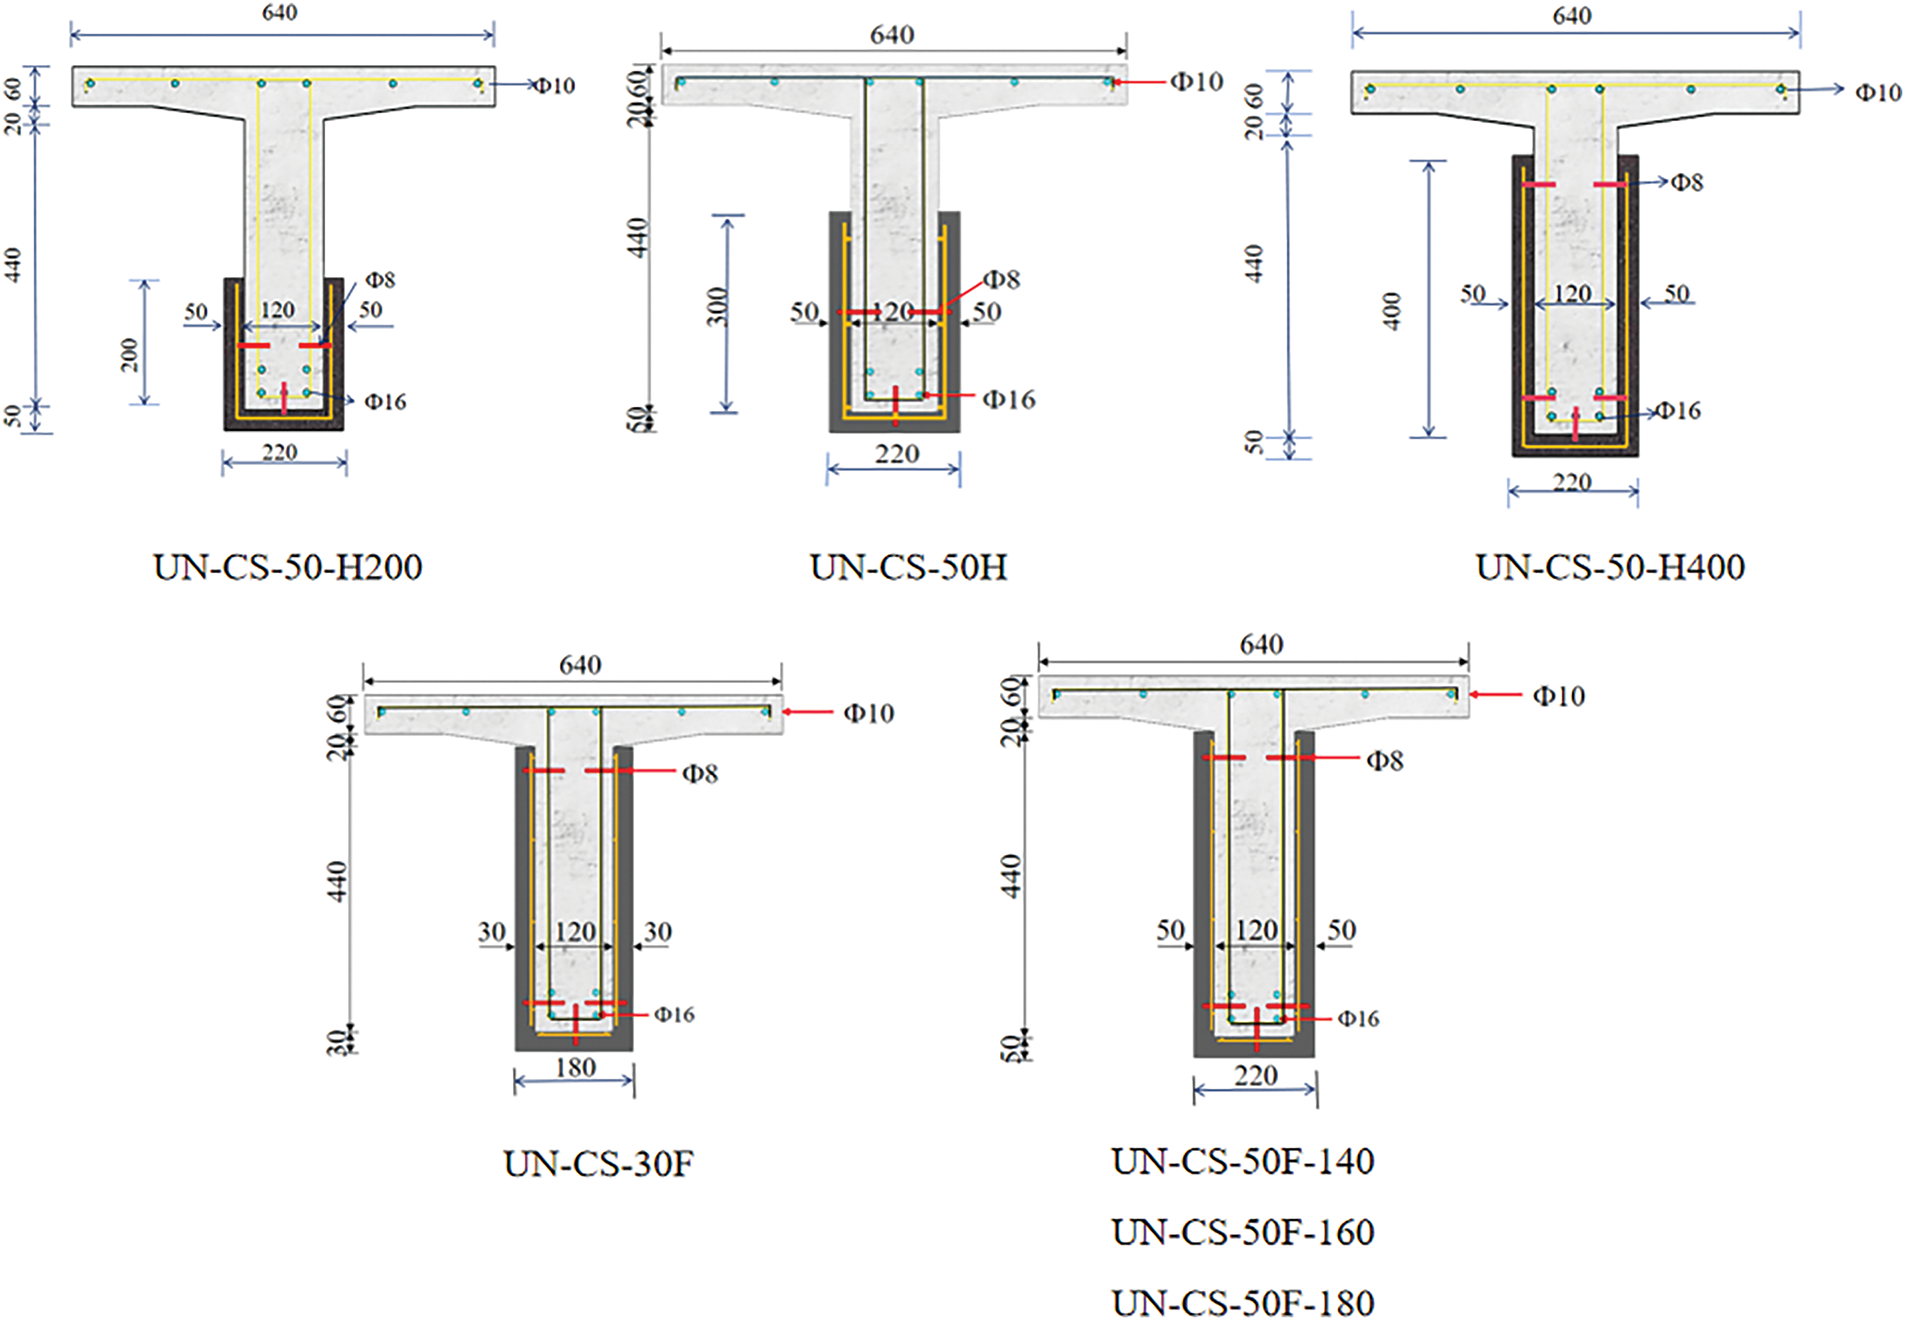
Figure 9: Parametric analysis (Unit: mm)
5.3 Influence of Critical Parameters
5.3.1 Influence of UHPC Reinforcement Layer Height
Fig. 10 presents the bending properties of UHPC-reinforced T-beams with varying reinforcement heights, underscoring their significant impacts on performance. As observed, reducing the UHPC reinforcement height from 440 to 400 mm results in a decrease in the cracking load (Pc), the yielding load (Py), and the peak load (Pu) by 7.0%, 1.5%, and 4.5%, respectively. Further lowering the height to 300 mm leads to even more substantial reductions: Pc decreases by 15%, Py declines by 3%, and Pu drops by 10%. The most pronounced degradation occurs at a reinforcement height of 200 mm, where Pc declines by 26.2%, Py decreases by 11.7%, and Pu drops by 17.6%. This can be attributed to the reduced bond area between the UHPC and the T-beam, which ultimately lessens the combined resistance of the UHPC reinforcement and the T-beam structure. Overall, the 440 mm reinforcement height achieves the best balance of structural performance with minimal degradation. However, for practical applications that prioritize material efficiency, the 400 mm height presents a viable compromise, maintaining over 93% of the peak load capacity while allowing for a reduction in material usage.
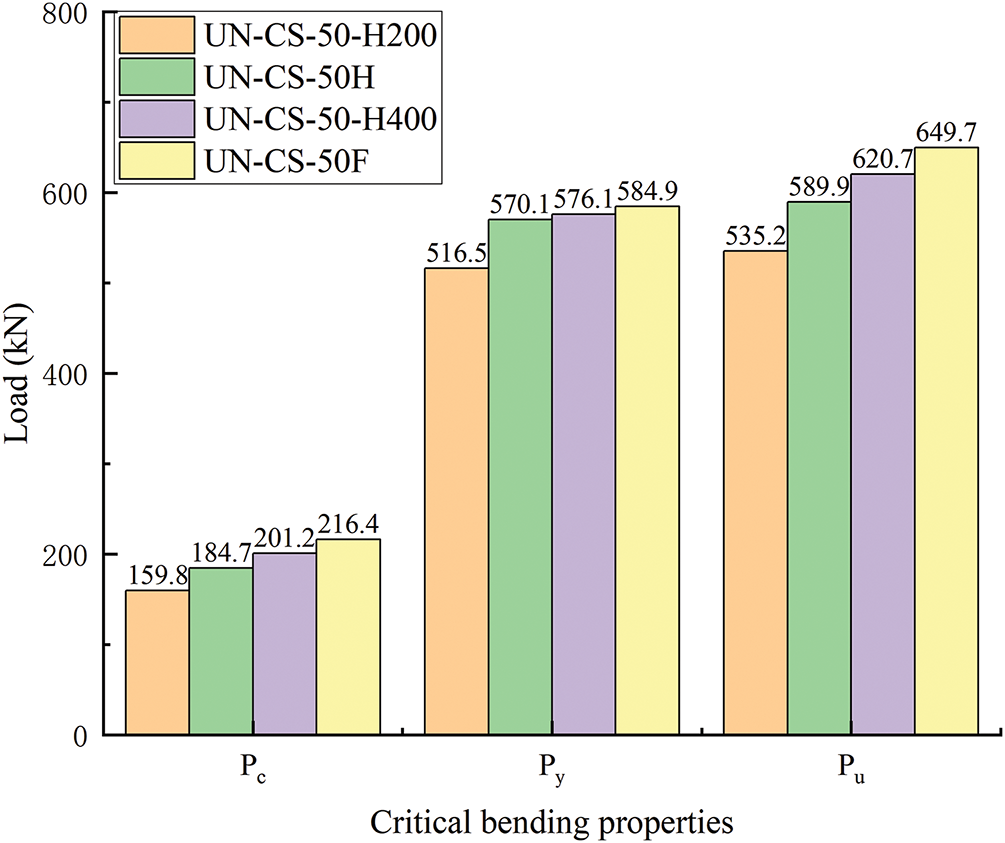
Figure 10: Influence of UHPC layer height
5.3.2 Influence of UHPC Reinforcement Thickness
Fig. 11 illustrates the effects of UHPC thickness on the flexural behavior of T-beams. A comparative analysis between the UN-CS-30F and UN-CS-50F indicates that both bending stiffness and resistance of the T-beams improve with increased UHPC thickness. Specifically, the ultimate resistance of the UHPC-reinforced T-beam was increased by 20% when the reinforcement layer thickness was elevated from 30 to 50 mm. This enhancement is primarily attributed to the increased moment of inertia of the cross-section with thicker UHPC, enabling the T-beams to endure larger bending moments. Furthermore, the increased thickness significantly strengthens the cracking resistance of the reinforced concrete T-beams, as evidenced by a 105% increase in the cracking load (Pc).
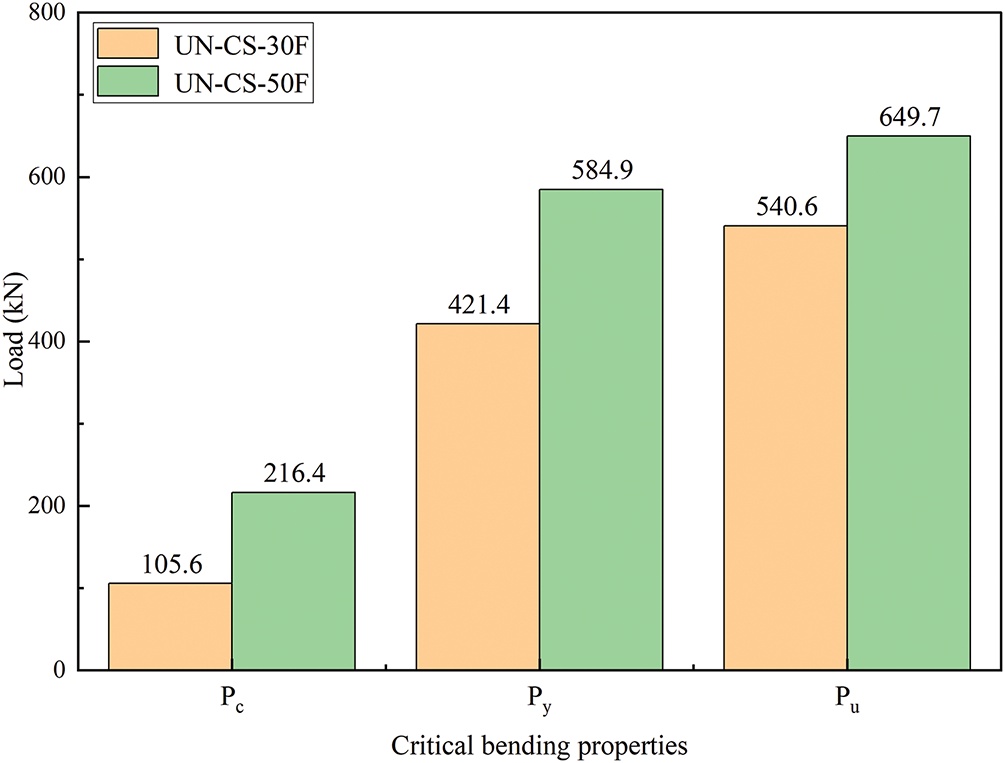
Figure 11: Influence of UHPC layer thickness
5.3.3 Influence of UHPC Strength
Fig. 12 shows the effects of UHPC strength on the reinforced T-beams. As can be seen, when the UHPC strength increases from 120 to 140 MPa, the cracking load (Pc), the yielding load (Py), and the peak load (Pu) of the reinforced T-beam is improved by 8.8%, 6.6%, and 2.8%, respectively. Further elevating the UHPC strength to 160 MPa results in more significant gains: Pc increases by 13.1%, Py by 4.4%, and Pu by 2.9%. The most pronounced improvement occurs at 180 MPa, where Pc surges by 18.1%, Py increases by 4.6%, and Pu rises by 4.0%. Cumulatively, upgrading the UHPC strength from 120 to 180 MPa achieves a 45.4% increase in Pc, 16.5% in Py, and 10.0% in Pu. These enhancements arise from the improved load redistribution capacity and cross-sectional inertia enabled by higher UHPC strength, which effectively delays crack propagation and enhances bending resistance. Based on these results, the 180 MPa strength grade provides the highest structural performance, particularly for critical applications requiring superior crack resistance and load capacity. However, for cost-sensitive projects, 160 MPa offers a balanced choice, delivering 80% of the total Pc improvement (relative to 120 MPa) with reduced material costs.
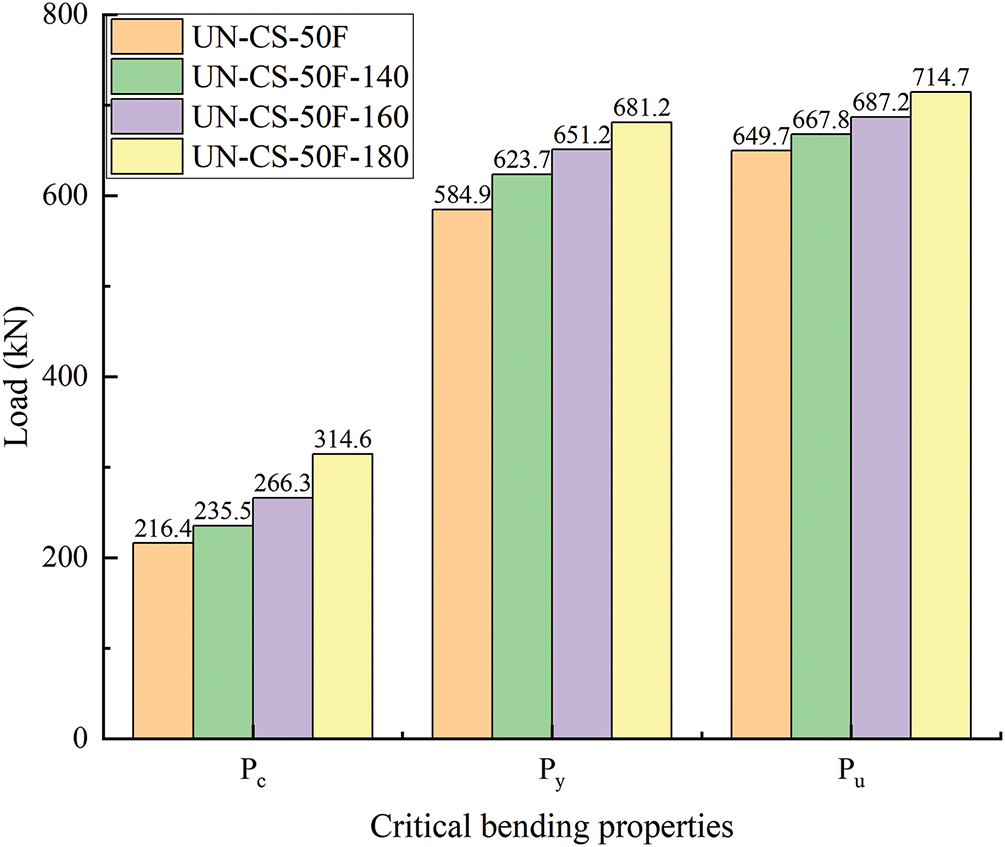
Figure 12: Influence of UHPC strength
This paper evaluates the flexural performance of concrete T-beams that are reinforced with layers of UHPC. The study utilized both experimental and numerical testing methods. Three T-beams, incorporating UHPC and NC interface treatments, were designed, fabricated, and tested. The experimental results were analyzed and used to calibrate the FE models. The following conclusions were drawn:
1. Compared to unreinforced T-beams, the UHPC-reinforced T-beam with a 50 mm-thick UHPC layer and chiseling-anchoring rebar interface treatment showed increases of 221.5% in cracking load and 32.8% in ultimate resistance, indicating that UHPC greatly enhances the bending performance of the T-beams.
2. The UHPC-reinforced T-beams with the chiseling-anchoring rebar treatment achieved a 19.5% increase in cracking load and an 8.1% increase in peak load compared to those with only the chiseled treatment.
3. Increasing the UHPC reinforcement height and UHPC strength effectively enhances bending stiffness and load-bearing capacity of the T-beam structure, with particularly notable improvements in cracking and ultimate resistances.
Acknowledgement: The authors would like to thank all the anonymous referees for their constructive comments and suggestions.
Funding Statement: The National Natural Science Foundation of China (Grant # 52278161), the Science and Technology Project of Guangzhou (Grant # 2024A04J9888), and the Guangdong Basic and Applied Basic Research Foundation (Grant # 2023A1515010535).
Author Contributions: The authors confirm contribution to the paper as follows: Writing—original draft preparation, Data curation, Conceptualization, Guangqing Xiao; Writing—original draft preparation, Investigation, Xilong Chen; Methodology, Validation, Resources, Data curation, Lihai Xu; Conceptualization, Validation, Feilong Kuang; Funding acquisition, Supervision, Visualization Preparation, Writing—review & editing, Shaohua He. All authors reviewed the results and approved the final version of the manuscript.
Availability of Data and Materials: The data that support the findings of this study are available from the corresponding author upon reasonable request.
Ethics Approval: Not applicable.
Conflicts of Interest: The authors declare no conflicts of interest to report regarding the present study.
References
1. Hemalatha K, James C, Natrayan L, Swamynadh V. Analysis of RCC T-beam and prestressed concrete box girder bridges super structure under different span conditions. Mater Today Proc. 2021;37:1507–16. doi:10.1016/j.matpr.2020.07.119. [Google Scholar] [CrossRef]
2. Men P, Di J, Qin F, Huang S, Huang Z, Peng X. Bending behaviour of reinforced concrete T-beams damaged by overheight vehicle impact strengthened with ultra-high performance concrete (UHPC). Case Stud Constr Mater. 2024;21:e03393. doi:10.1016/j.cscm.2024.e03393. [Google Scholar] [CrossRef]
3. Zhou J, Leng J, Yang J, Zhang Z, Du J, Zou Y. Experimental investigation on shear behavior of damaged and acid rain-corroded RC T-beams strengthened with ultra-high-performance concrete. Eng Struct. 2025;327:119618. doi:10.1016/j.engstruct.2025.119618. [Google Scholar] [CrossRef]
4. Xue J, Briseghella B, Huang F, Nuti C, Tabatabai H, Chen B. Review of ultra-high performance concrete and its application in bridge engineering. Constr Build Mater. 2020;260:119844. doi:10.1016/j.conbuildmat.2020.119844. [Google Scholar] [CrossRef]
5. Contento A, Aloisio A, Xue J, He J, Briseghella B. Ultra-high performance concrete beam-to-beam connections in continuous bridges: experimental full-scale tests, FE analyses and design. Eng Struct. 2024;316:118594. doi:10.1016/j.engstruct.2024.118594. [Google Scholar] [CrossRef]
6. Liu T, Charron JP. Experimental study on the shear behavior of UHPC-strengthened concrete T-beams. J Bridge Eng. 2023;28(9):04023064. doi:10.1061/jbenf2.beeng-6122. [Google Scholar] [CrossRef]
7. He S, Zhong H, Huang X, Xu Y, Mosallam AS. Experimental investigation on shear fatigue behavior of perfobond strip connectors made of high strength steel and ultra-high performance concrete. Eng Struct. 2025;322:119181. doi:10.1016/j.engstruct.2024.119181. [Google Scholar] [CrossRef]
8. Long Y, Jiang Z, Zou K, Du J, Yang J. Numerical simulation analysis of the bending performance of T-beams strengthened with ultra-high-performance concrete based on the CDP model. Buildings. 2024;14(5):1284. doi:10.3390/buildings14051284. [Google Scholar] [CrossRef]
9. Qiu M, Shao X, Wille K, Yan B, Wu J. Experimental investigation on flexural behavior of reinforced ultra high performance concrete low-profile T-beams. Int J Concr Struct Mater. 2020;14(1):5. doi:10.1186/s40069-019-0380-x. [Google Scholar] [CrossRef]
10. Khodayari A, Rehmat S, Valikhani A, Azizinamini A. Experimental study of reinforced concrete T-beam retrofitted with ultra-high-performance concrete under cyclic and ultimate flexural loading. Materials. 2023;16(24):7595. doi:10.3390/ma16247595. [Google Scholar] [PubMed] [CrossRef]
11. He S, Huang X, Huang J, Zhang Y, Wan Z, Yu Z. Shear bond performance of UHPC-to-NC interfaces with varying sizes: experimental and numerical evaluations. Buildings. 2024;14(11):3684. doi:10.3390/buildings14113684. [Google Scholar] [CrossRef]
12. Wan Z, Fang Z, Liang L, He S, Sun X. Structural performance of steel-concrete composite beams with UHPC overlays under hogging moment. Eng Struct. 2022;270:114866. doi:10.1016/j.engstruct.2022.114866. [Google Scholar] [CrossRef]
13. Wang Y, Qiao P, Sun J, Chen A, Yuan D, Wang Y. Influence of surface treatments and test methods on tensile strength of UHPC-NC interface bond. Constr Build Mater. 2024;456:139051. doi:10.1016/j.conbuildmat.2024.139051. [Google Scholar] [CrossRef]
14. Tong T, Yuan S, Wang J, Liu Z. The role of bond strength in structural behaviors of UHPC-NC composite beams: experimental investigation and finite element modeling. Compos Struct. 2021;255:112914. doi:10.1016/j.compstruct.2020.112914. [Google Scholar] [CrossRef]
15. GB/T 50081–2019. Standard for test methods of concrete physical and mechanical properties. Beijing, China: MOHURD (Ministry of Housing and Urban-Rural Development of the People’s Republic of China). China Architecture Building Press; 2019. (In Chinese). [Google Scholar]
16. GB/T 31387–2015. Reactive powder concrete. Beijing, China: AQSIQ and SAC (General Administration of Quality Supervision Inspection and Quarantine of the People’s Republic of China and Standardization Administration of the People’s Republic of China). Standards Press of China; 2015. (In Chinese). [Google Scholar]
17. BS EN 10080–2005. Steel for the reinforcement of concrete-Weldable reinforcing steel-General. London, UK: BS EN 10080 (BSI Standards Policy and Strategy Committee). British Standards Institution; 2005. [Google Scholar]
18. Júlio ENBS, Branco FAB, Silva VD. Concrete-to-concrete bond strength. Influence of the roughness of the substrate surface. Constr Build Mater. 2004;18(9):675–81. doi:10.1016/j.conbuildmat.2004.04.023. [Google Scholar] [CrossRef]
19. Gadri K, Guettala A. Evaluation of bond strength between sand concrete as new repair material and ordinary concrete substrate (the surface roughness effect). Constr Build Mater. 2017;157:1133–44. doi:10.1016/j.conbuildmat.2017.09.183. [Google Scholar] [CrossRef]
20. Feng S, Xiao H, Liu M, Zhang F, Lu M. Shear behaviour of interface between normal-strength concrete and UHPC: experiment and predictive model. Constr Build Mater. 2022;342:127919. doi:10.1016/j.conbuildmat.2022.127919. [Google Scholar] [CrossRef]
21. Feng S, Xiao H, Geng J. Bond strength between concrete substrate and repair mortar: effect of fibre stiffness and substrate surface roughness. Cem Concr Compos. 2020;114:103746. doi:10.1016/j.cemconcomp.2020.103746. [Google Scholar] [CrossRef]
22. He S, Huang X, Zhong H, Wan Z, Liu G, Xin H, et al. Experimental study on bond performance of UHPC-to-NC interfaces: constitutive model and size effect. Eng Struct. 2024;317:118681. doi:10.1016/j.engstruct.2024.118681. [Google Scholar] [CrossRef]
23. GB/50010–2010. Code for design of concrete structures. 2015 ed. Beijing, China: MOHURD (Ministry of Housing and Urban-Rural Development of the People’s Republic of ChinaChina Architecture & Building Press; 2010. (In Chinese). [Google Scholar]
24. Yang J, Fang Z. Research on stress-strain relation of ultra high performance concrete. Concrete. 2008;228(7):11–5. (In Chinese). doi:10.3969/j.issn.1002-3550.2008.07.004. [Google Scholar] [CrossRef]
25. Zhang Z, Shao XD, Li WG, Zhu P, Chen H. Axial tensile behavior test of ultra high performance concrete. China J Highw Transp. 2015;28(8):50–8. (In Chinese). doi:10.19721/j.cnki.1001-7372.2015.08.007. [Google Scholar] [CrossRef]
Cite This Article
 Copyright © 2025 The Author(s). Published by Tech Science Press.
This work is licensed under a Creative Commons Attribution 4.0 International License , which permits unrestricted use, distribution, and reproduction in any medium, provided the original work is properly cited.
 Downloads
 Citation Tools