
 Submit a Paper
 Propose a Special lssue
 Open Access
ARTICLE
Calcination Analysis of CaCO3 from Waste Oyster Shells for Partial Cement Replacement
1 Doctoral Program, School of Engineering, Post Graduate Program, Universitas Syiah Kuala, Banda Aceh, 23111, Indonesia
2 Department of Civil Engineering, Faculty of Engineering, Universitas Iskandar Muda, Banda Aceh, 23234, Indonesia
3 Department of Civil Engineering, Universitas Syiah Kuala, Banda Aceh, 23111, Indonesia
4 Center for Environmental and Natural Resources Research, Universitas Syiah Kuala, Banda Aceh, 23111, Indonesia
* Corresponding Author: Muttaqin Hasan. Email:
Structural Durability & Health Monitoring 2025, 19(5), 1089-1109. https://doi.org/10.32604/sdhm.2025.066887
Received 19 April 2025; Accepted 12 June 2025; Issue published 05 September 2025
 View Full Text
 Download PDF
Abstract
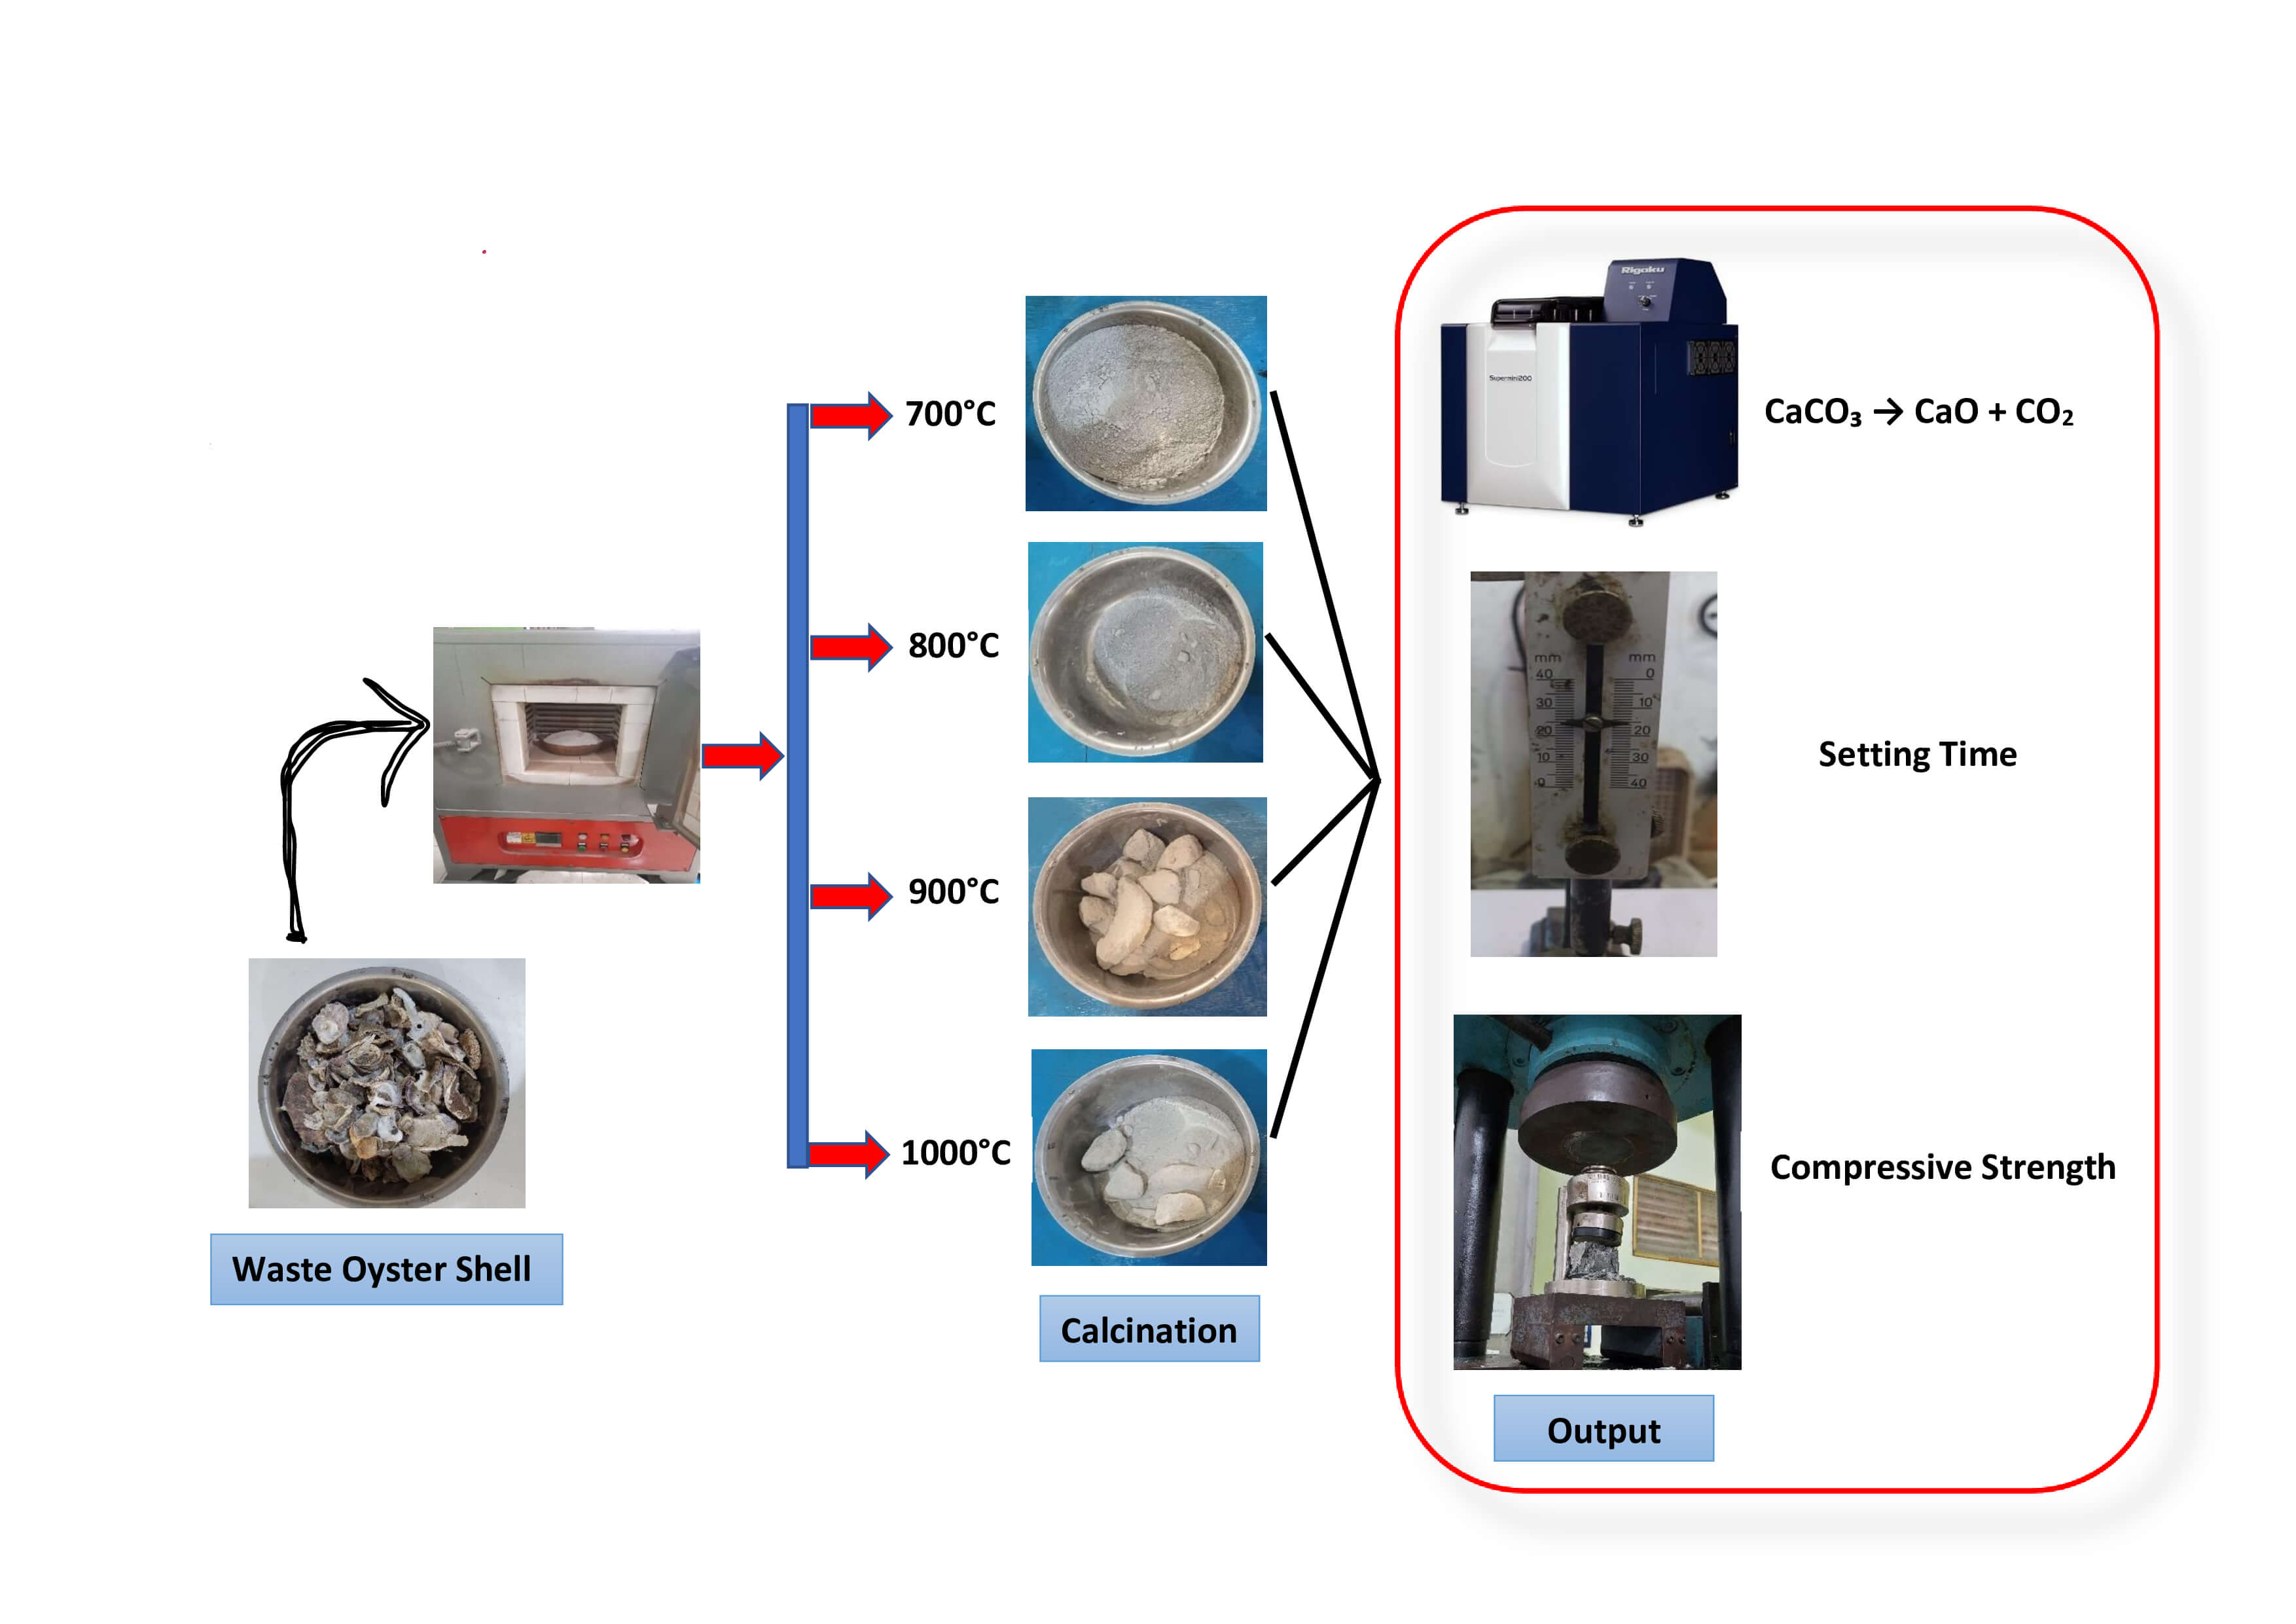
Aceh in Indonesia is rich in marine resources and abundant fishery products such as oyster. Traditionally, fishermen only harvest oysters and discard the shells, which can cause pollution and environmental contamination. Waste Oyster Shells (WOS) contain a high percentage of calcium carbonate (CaCO3) that experiences thermal decomposition at high temperature, following the reaction CaCO3 → CaO + CO2 (ΔT = 825°C). At temperature > 900°C, dead-burned lime is formed, which severely influences CaO reactivity. However, the optimum temperature for producing high CaO content is still uncertain. Therefore, this study aimed to determine the optimum calcination temperature to produce high CaO content, assess initial setting time of WOS paste, and identify the best compressive strength of paste. For the experiment, WOS was used as a partial cement replacement (with a size of 0.075 mm) in paste at a proportion of 5% and calcined at temperature of 700°C, 800°C, 900°C, and 1000°C. The specimens used were an ebonite ring (dimensions: 70 mm bottom diameter, 60 mm top diameter, and 40 mm height) and a cube (dimensions: 5 cm × 5 cm × 5 cm). The experiment was conducted following the ASTM (American Society for Testing and Materials) standards and optimum compressive strength values were analyzed using ANOVA (Analysis of Variance) and Response Surface Methodology (RSM) through the Design Expert software. The results showed that WOS calcined at 1000°C increased CaO content by approximately 57.40%. Furthermore, the initial setting time test of 5% WOS paste at 1000°C showed a more uniform binding performance compared to conventional cement paste, with an initial setting time of 75 min and a penetration depth of 15 mm. In line with the analysis, optimum compressive strength of 71.028 MPa with a desirability value of 0.986 was achieved at 5% cement replacement and calcination temperature of 786.44°C.Graphic Abstract
Keywords
Aceh Province in Indonesia is rich in marine resources and abundant fishery products such as oysters. Many types of shellfish grow in Aceh’s waters, including oysters, with a continuous increase in annual production [1]. Generally, communities living in coastal areas work as oyster fishermen who collect catches near river estuaries, and the shells are typically discarded without further use. Waste Oyster Shells (WOS) that accumulate along the shoreline can cause environmental pollution in surrounding communities [2]. When WOS is left for a long time, there is a tendency for prolonged environmental pollution. Therefore, in the future, a large cost will be required to restore the beauty of the environment [3].
Oyster is a type of shellfish that grows in seawater or river estuaries, characterized by hard shells with chalky texture [4,5]. The hard shells function as a protective covering for the oyster body. WOS contains a very high amount of calcium carbonate (CaCO3), at approximately 98.00% [6]. Other types of shellfish also contain high levels of CaCO3, including mollusks [7], cockles [8], blood cockles [9], periwinkle [10], snails [11], and green mussels [12]. Several studies have widely used seashells as a substitute for cement in concrete [13,14]. Others stated that waste materials used to replace cement are coal bottom ash [15], rubber powder [16], silica fume [17], and fly ash [18].
The CaCO content in WOS has been proven effective as a binder material in paste and concrete, specifically for partial cement replacement. Previous studies have also shown that WOS powder can be used to replace materials in concrete, including partial cement, and fine or coarse aggregate [19]. This waste serves as cement substitute materials that have water-absorbing properties, with a low absorption rate. Based on previous studies, the water absorption level of WOS ranged from 1.00% to 7.66% [3,20]. When WOS is substituted into cement, it can accelerate the binding process with other materials in paste and concrete, leading to a more homogeneous mixture and improved early-age strength [21,22].
Generally, cement paste is a component of concrete, composed of a mixture of cement and water experiencing chemical reactions to form hydration products and water-filled pores [23]. It is dimensionally unstable and is not used in construction without the addition of stabilizing agents such as aggregates [24]. Cement paste forms when water is added to the concrete mixture, functioning as binding, coating, and lubricating [25]. To assess the homogeneity of cement bonding, a setting time test is conducted according to ASTM standards [26]. Setting time is divided into two categories, namely initial and final. The initial setting time refers to the time from mixing cement and water until paste loses plasticity. Meanwhile, the final setting time is the time it takes for paste to harden completely. The initial setting time is determined when penetration reaches 25 mm and should not occur earlier than 45 min according to ASTM C150 [26].
One of the major oxides in cement is calcium oxide (CaO), which functions as a binding agent. To achieve chemical properties similar to cement, CaCO3 must first be calcined. The calcination process in WOS converts CaCO3 into CaO [27], which accounts for approximately 63% of cement composition [22]. The calcination process typically uses a temperature of 800°C [28].
Calcination is a chemical reaction process aimed at altering the chemical properties of a material through heating at specific temperature. During calcination, other chemical elements such as CO2 are removed [5]. This process is carried out by heating the material at the designated temperature using a microwave or electric furnace, with the duration adjusted according to the material [29]. High-temperature calcination can produce a large amount of lime [30]. Moreover, calcining at 1200°C leads to complete calcination but requires a long duration often referred to as “dead burnt” [31].
To examine the result of calcination, a laboratory test known as X-Ray Fluorescence (XRF) is required. XRF testing is a chemical analysis method used to determine calcination outcome, which consists of several elements expressed as percentages. This test material can be in powder or liquid form [32].
Currently, CaO content in WOS has been widely used as a partial replacement for cement, fine aggregate, or coarse aggregate in concrete. The optimal calcination temperature for producing high CaO content has not yet been clearly established. Therefore, this study aimed to determine the optimum calcination temperature to produce high CaO content, the initial setting time of WOS paste, and the best compressive strength.
Previous studies have performed calcination of WOS at a single level for 2 h using WOS as a substitute material in cement, with a particle size of 38 µm in diameter like Ordinary Portland Cement (OPC) (sieve No. 400). In this study, WOS was calcined at temperatures of 700°C, 800°C, 900°C, and 1000°C, serving as a 5% partial replacement for cement in the paste. WOS had a particle size of 75 µm (sieve No. 200), with a constant calcination duration of 2 h. This method was in line with previous studies, which reported CaO content in WOS calcined at temperatures of 700°C [33], 800°C [34], 900°C [27], and 1000°C [35]. However, there was no analysis of variation in MgO content from different WOS calcination temperature. The MgO content in WOS is crucial, due to the significant impact on the porosity and compressive strength of the paste.
For the experiment, WOS was collected from Krueng Neng, Gampong Surien, Meuraxa District, Banda Aceh City, Indonesia. XRF tests were conducted to determine the CaO content, which was used to analyze the compressive strength test of the paste. Subsequently, normal consistency and initial setting time tests were performed using a Vicat apparatus to obtain the optimum water content and setting time.
The optimum compressive strength of the paste was analyzed using ANOVA and Response Surface Methodology (RSM) through Design Expert software. RSM allows the development of a robust predictive model considering various effects, including linear, quadratic, and interaction effects between independent variables. One of the advantages of RSM is the requirement for fewer experiments compared to other methods to achieve the same level of accuracy. This allows for the determination of the ideal mixture to achieve the optimum compressive strength at a lower cost.
This study was carried out based on ASTM (American Society for Testing and Materials) standards. The conditions stated in ASTM standards included chemical characterization of cement using XRF testing [36], normal consistency testing [37], setting time testing [26], and compressive strength testing of paste [38]. The procedures conducted in this study were as follows:
2.1 Material and Equipment Preparation
Before performing chemical characterization and setting time testing of paste, the initial procedure carried out was the preparation of materials, which included,
1. Cement used is Ordinary Portland Cement (OPC) Type 1, produced by Lafarge Cement Indonesia Company.
2. The water used in this study is clean, odorless tap water obtained from the laboratory.
3. WOS was obtained from Krueng Neng, Gampong Surien, Meuraxa Subdistrict, Banda Aceh City, Indonesia. The sample was collected and brought to the laboratory for cleaning of any attached dirt using tap water. This was followed by soaking in tap water for 24 h to ensure thorough cleaning. Subsequently, the sample was placed in an oven for 24 h at a temperature of 105°C–110°C and crushed using a Los Angeles machine after drying [39]. The WOS was ground using a No. 200 sieve (0.075 mm) to produce a powder, which was used as a partial cement replacement [40]. The crushing process is shown in Fig. 1.
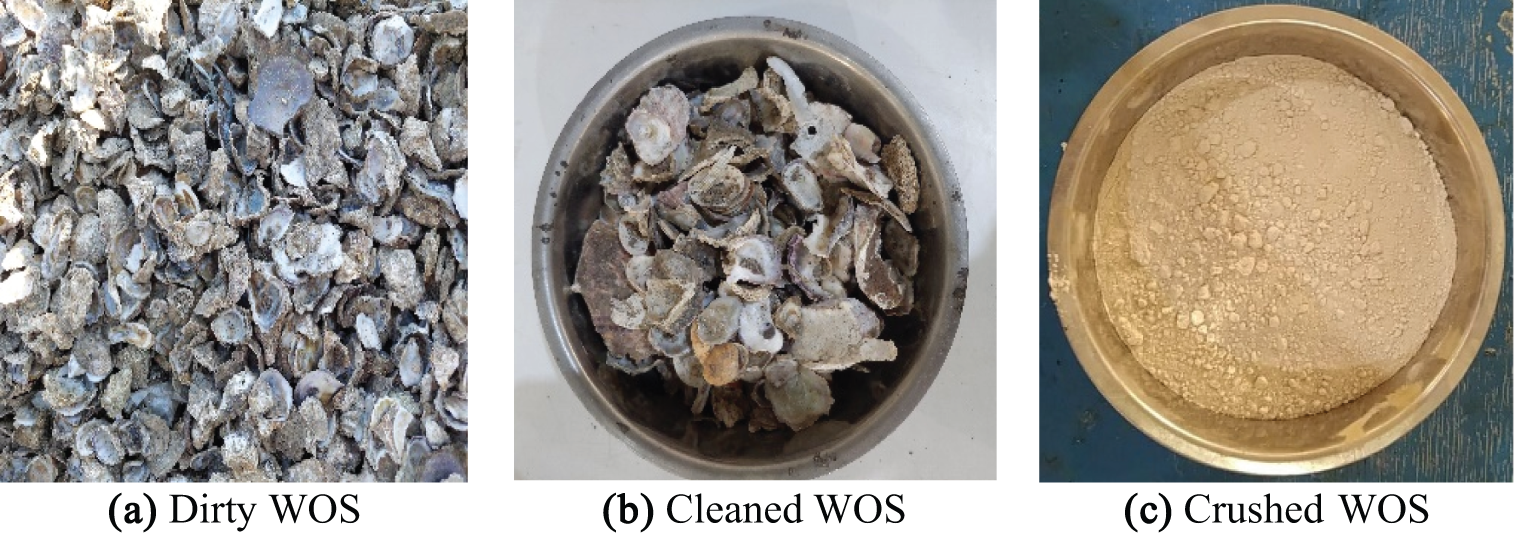
Figure 1: The WOS crushing process
The equipment used in this study complies with ASTM standards. This includes ASTM No. 200 standard sieve, containers or pans, drying oven, Los Angeles machine, a 5000-g capacity scale with 0.01-g accuracy, mixer, porcelain bowl, ebonite rings, vicat apparatus with a conical mold (70 mm bottom diameter, 60 mm top diameter, 40 mm height), glass plate, stopwatch, and other supporting tools (ruler, measuring cup, dipper, and bucket).
Calcination was conducted in a chemical laboratory to remove moisture, carbon dioxide, and other volatile components by applying controlled heating. The test was performed on waste oyster shell (WOS) material that had been previously ground and passed through an ASTM No. 200 sieve (75 µm). The calcination process was carried out in a controlled environment, where the WOS samples were placed in a heat-resistant crucible and inserted into an electric furnace. The specimens were subjected to temperatures of 700°C, 800°C, 900°C, and 1000°C, with each calcination maintained for 2 h. The furnace temperature was increased gradually until the target temperature was reached, after which the heating was maintained for 2 h and then turned off. This procedure is consistent with previous studies that also utilized a 2-h calcination period at similar temperature levels: 700°C [41], 800°C [42], 900°C [43], and 1000°C [44]. After the heating process, the WOS samples were allowed to cool naturally at room temperature for 6 h. Post-calcination, the WOS exhibited distinct physical and chemical characteristics compared to the uncalcined control. The detailed calcination process used in this study is illustrated in Fig. 2.
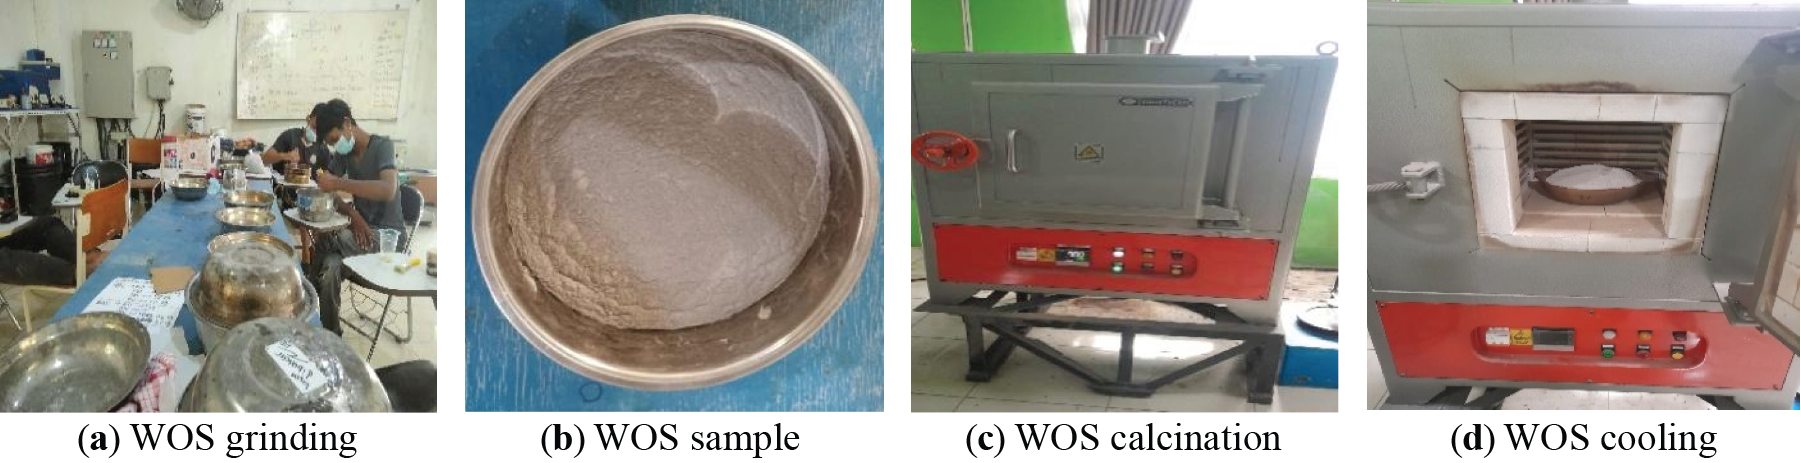
Figure 2: WOS calcination process
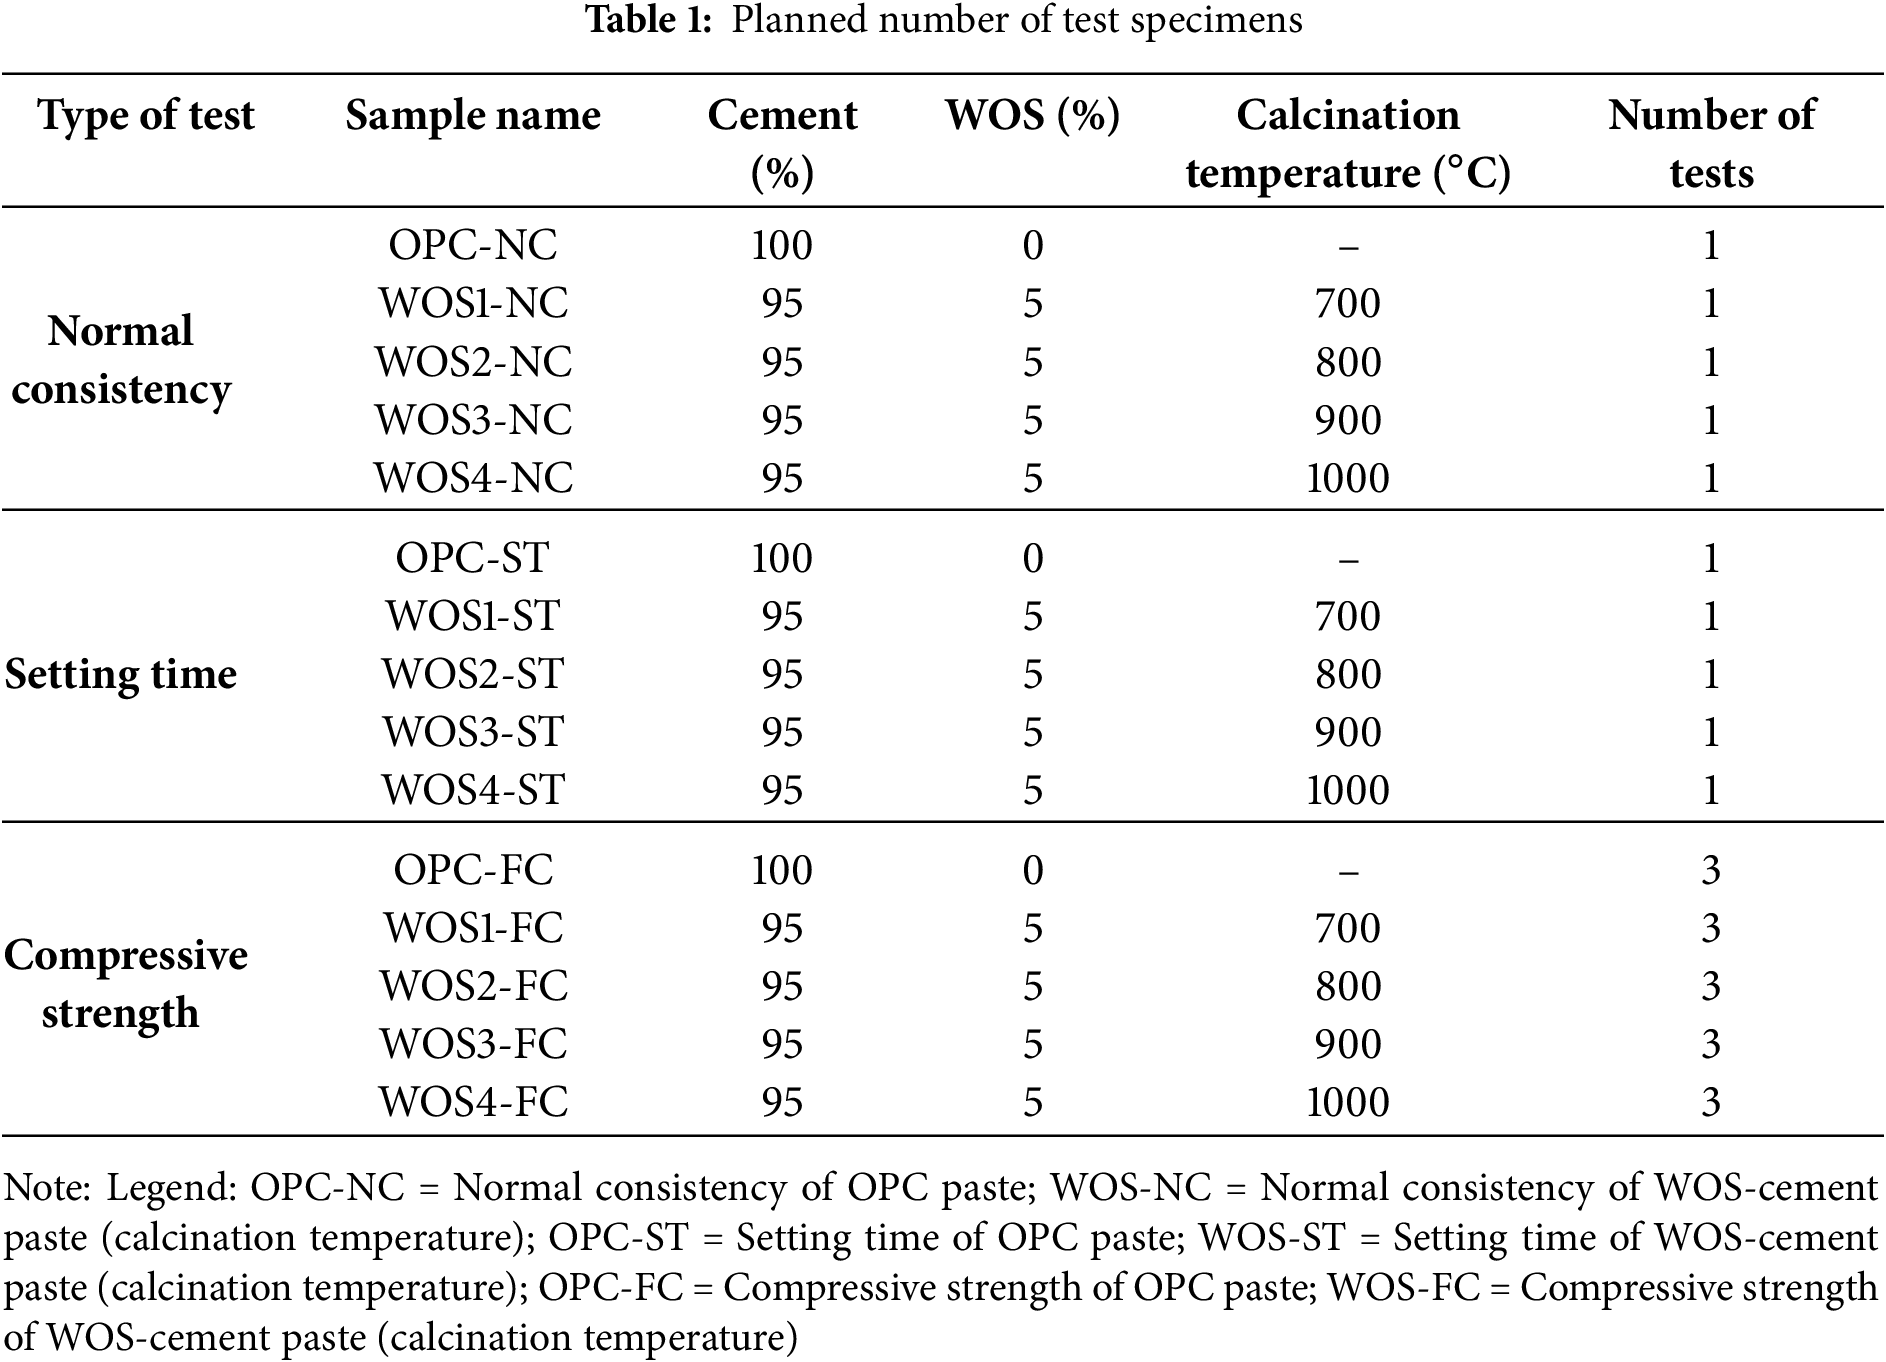
The specimen in this study was paste shaped into ebonite rings with the following dimensions, namely 70 mm bottom diameter, 60 mm top diameter, and 40 mm height. The tests conducted on specimen included normal consistency and setting time. XRF testing was performed to determine chemical content in the laboratory. Meanwhile, compressive strength testing used cube molds measuring 5 cm × 5 cm × 5 cm, as shown in Table 1.
2.4 Chemical Properties Testing
Chemical properties of OPC Type 1 and WOS were examined through XRF testing based on ASTM [36]. The test was performed on OPC Type 1 and calcined WOS samples. Solid powder samples weighing 3 g were used.
2.5 Determination of Water Content
The water content in paste was determined using the normal consistency test according to ASTM [37]. The initial step was to weigh cement, WOS, and water. After measurement, the total weight of cement and WOS was set to 400 g using a digital scale with 0.01 g precision. WOS was used to replace 5% of cement by weight and initial water content was assumed to be 25% of the combined weight of cement and WOS. After mixing the materials to form a paste, the mixture was placed in an ebonite ring mold and tested with a Vicat apparatus. When the Vicat needle penetration was below 9 mm, additional water was added until the penetration reached between 9–11 mm.
Setting time test was carried out on cement paste and WOS mixed paste, based on ASTM [26]. The procedure for testing the setting time of cement paste mixed with WOS is as follows:
a. Weigh cement, water, and WOS that is used to replace 5% of cement. Therefore, the weight of WOS is 5% of cement weight.
b. Put the weighed cement, WOS, and water into a mixer.
c. Mix the ingredients in the mixer until a homogeneous paste is formed, for approximately 3 min.
d. Shape paste into a ball using both hands.
e. Toss paste ball back and forth between hands at a distance of 15 cm, six times.
f. Place paste ball into the ebonite ring and place it on the Vicat apparatus.
g. Release the Vicat needle at the first 15-min interval and record the penetration depth.
h. Release the Vicat needle again after another 15 min and record the penetration depth, ensuring the measurement point is +5 mm and +10 mm from the edge of the ebonite ring.
i. Observe the initial setting time of cement paste, which occurs when the penetration depth reaches 25 mm. A graph of the initial setting should be made. The data recorded include the penetration time in minutes and the depth in millimeters [45].
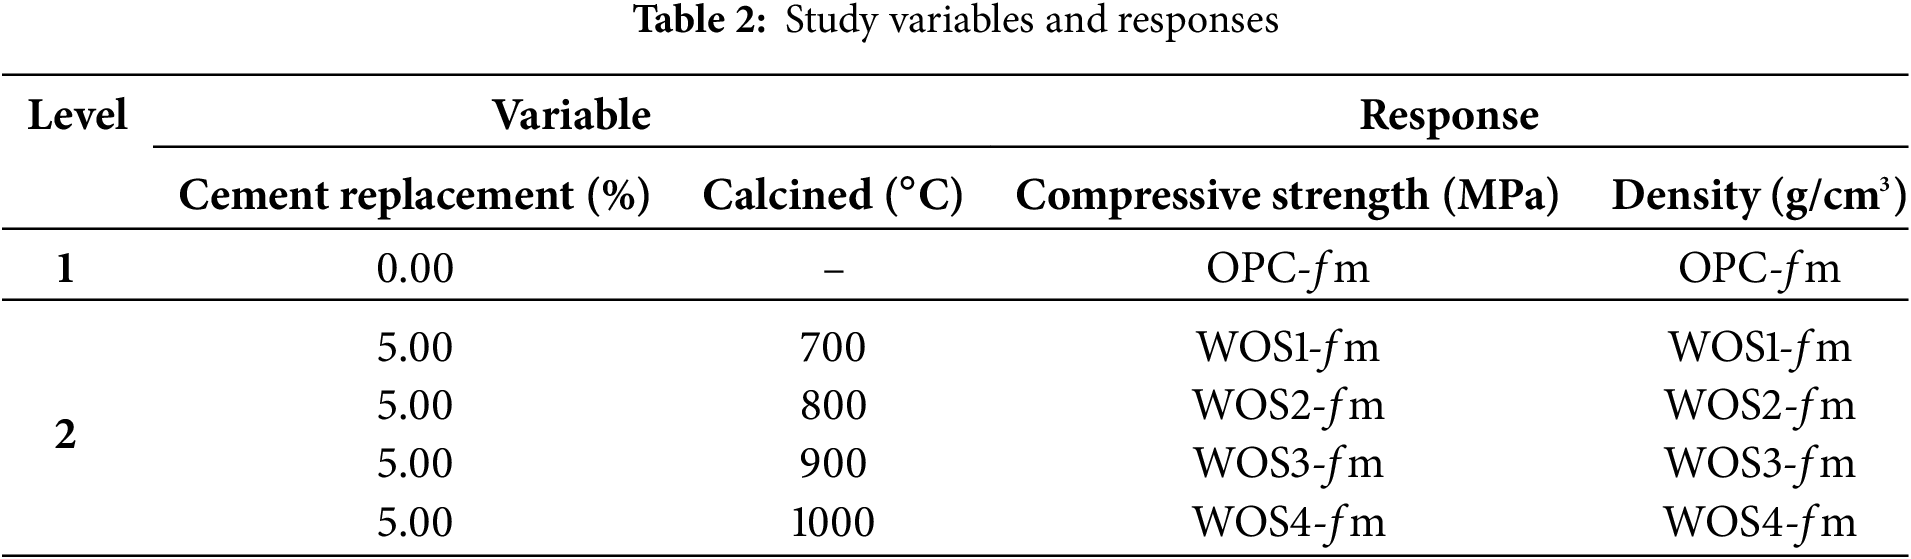
In this study, paste mix design was determined based on the water content obtained from the normal consistency test. The variables used to produce paste were cement replacement and calcination temperature, with the responses being compressive strength and density. Furthermore, paste mixing was conducted in the laboratory through four trial combinations, with details shown in Table 2.
2.8 Compressive Strength Test of Paste
The compressive strength test of paste was conducted in accordance with ASTM [38]. The specimens used were cubes measuring 50 mm × 50 mm × 50 mm. This test consisted of five variations as shown in Table 1, each tested with three specimens, totaling 15 for the compressive strength test.
The homogeneous cement paste mixed with WOS was placed into cube molds and compacted according to ASTM standards. After one day of curing, specimens were submerged in clean water and cured for 28 days, followed by weighing and measurement. Subsequently, paste specimens were placed into a Universal Testing Machine for compressive testing. The compressive strength of paste was calculated using the following formula.
Legend: fm = Compressive strength of paste (MPa); P = Maximum failure load (Newton); A = Cross-sectional area of the specimen (mm2).
In this study, the compressive strength test results of paste were analyzed using the ANOVA (Analysis of Variance) statistical test, applying RSM through the Design Expert software. The variables used were cement replacement (denoted as A) and calcination (denoted as B). The responses obtained were compressive strength and bulk density of paste. A quadratic model was designed and presented in the form of contour and 3D graphs. Based on the results, a model that produces a p-value < 0.05 is considered acceptable, showing a significant effect on the increase in compressive strength.
Calcination test and chemical property analysis of WOS served as preliminary data before conducting the normal consistency, setting time, and compressive strength tests of paste. Based on the test results, the following data were obtained and analyzed:
Calcination test was carried out cleaned and oven-dried WOS samples. Heating or calcination at 700°C, 800°C, 900°C, and 1000°C led to changes in the physical properties of WOS, namely in terms of texture and color. At 900°C and 1000°C, the texture became rougher, and the color turned whitish, as shown in Fig. 3. Therefore, calcined WOS had to be ground again using a No. 200 sieve. According to previous studies, WOS used as cement substitute has varying particle sizes, namely 150 µm (sieve No. 100) [46], 75 µm (sieve No. 200) [47–49], and 38 µm (sieve No. 400) [50].
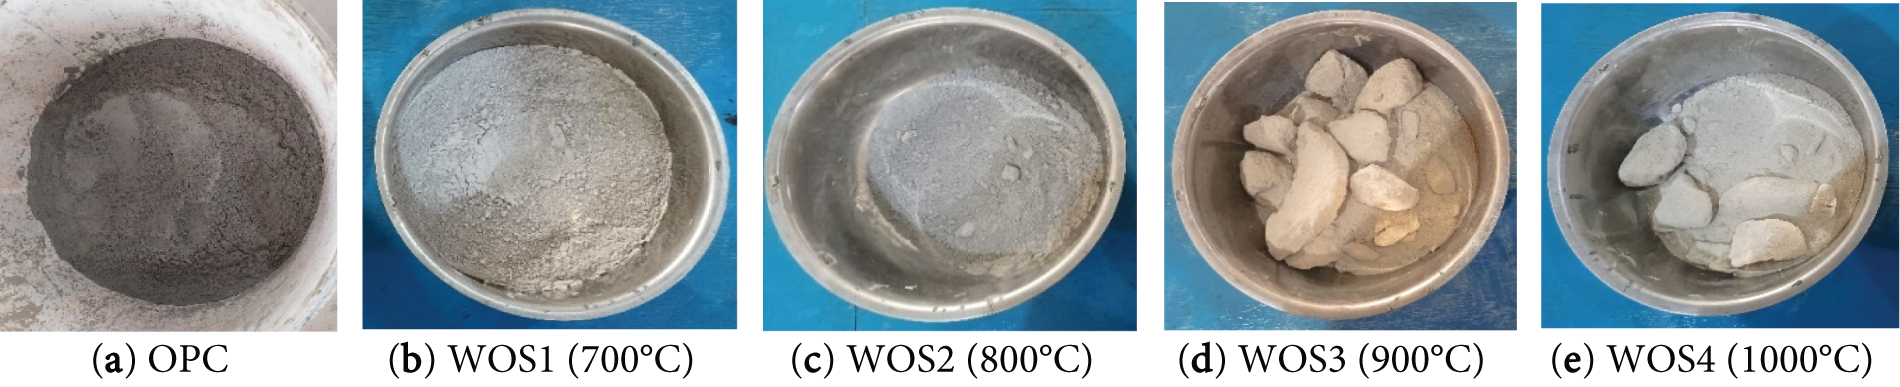
Figure 3: OPC cement and calcined WOS
Based on Fig. 3, a significant color difference can be observed between Type 1 OPC and the calcined WOS. The color of Type 1 OPC cement is dark gray, while the calcined WOS becomes more whitish. Clumping of WOS was observed after calcination at 900°C and 1000°C. This was due to the calcination temperature being too high and the duration being only 2 h. Based on previous studies, higher calcination temperature (900°C–1100°C) could lead to a faster process, which required a longer time for CaO to form [31]. Therefore, to allow proper mixing into a paste, the clumped WOS was crushed and sieved using No. 200. Higher calcination temperature also corresponds to harder WOS texture and more pronounced color change. These results correlate with previous studies, where high-temperature calcination of WOS leads to changes in both color and particle size [35]. Another study also reported that calcining WOS at high temperatures led to a rapid change in color [51].
3.2 Chemical Composition Analysis
The Rigaku instrument is used only to detect chemical composition, while the LOI (Loss of Ignition) value is obtained from TGA (Thermogravimetric Analysis) testing, which is not measured in this study. The physical properties examined were specific gravity and SSA (Specific Surface Area). The specific gravity test was conducted using the Le Chatelier flask method, in accordance with ASTM C188 standard [52]. Meanwhile, SSA testing was performed using the BET (Brunauer-Emmett-Teller) [53]. Based on the BET method, the SSA of WOS with a particle size of 75 µm was found to be 0.276 m2/g. In comparison, previous studies reported that the SSA of OPC cement was 0.352 m2/g [54], showing a lower value of WOS. Therefore, water absorption is also lower and the workability of WOS paste improves [55,56]. Table 3 shows the percentage of chemical composition and the specific gravity of OPC and WOS produced from calcination at 700°C to 1000°C.
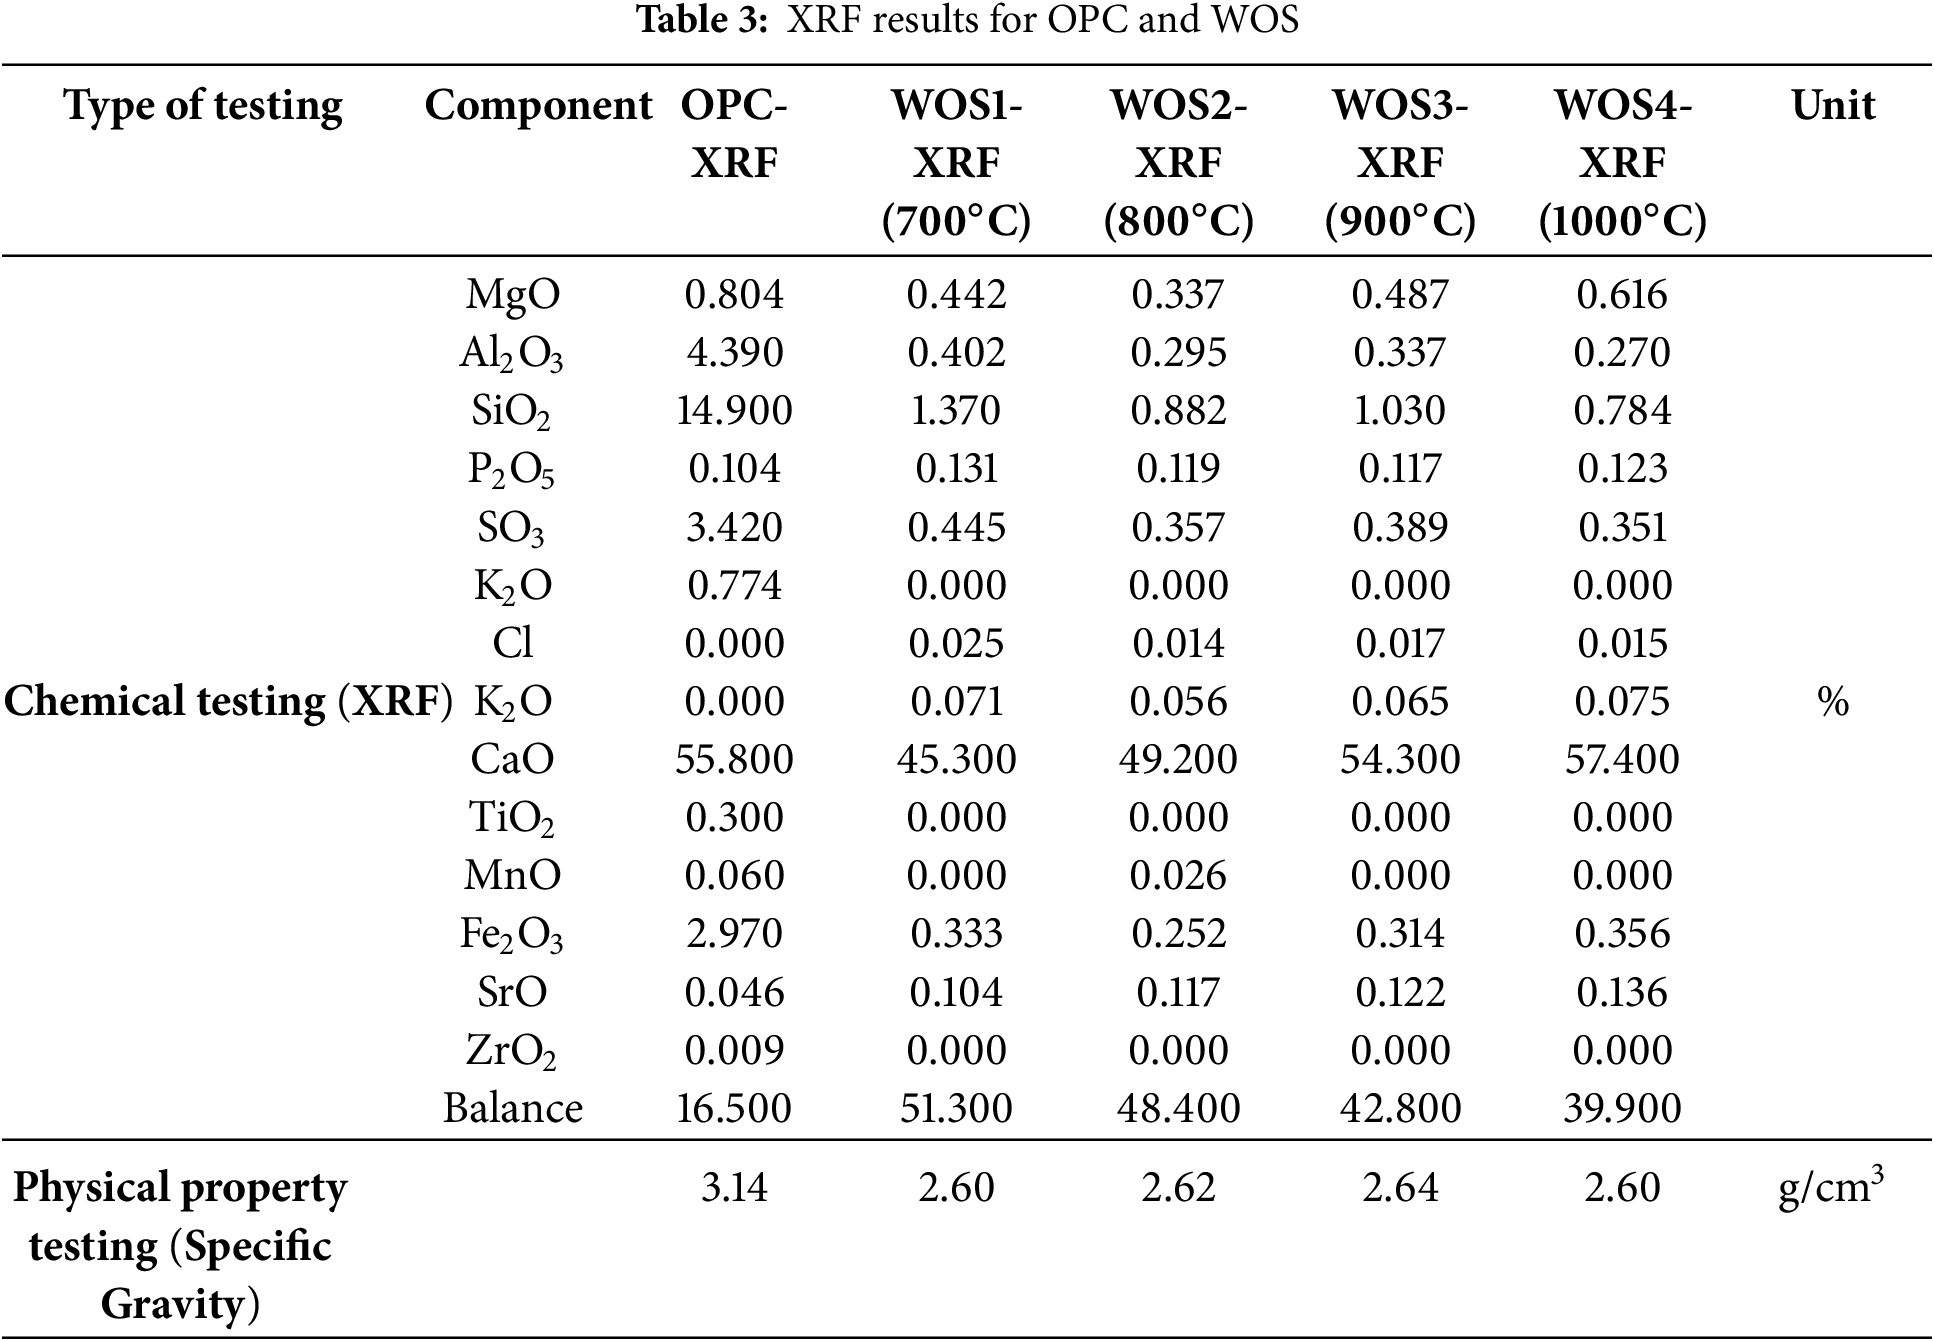
Based on Table 3, a significant difference is observed in the amount of CaO produced. The XRF test results show that the CaO content for OPC Type 1, WOS1 (700°C), WOS2 (800°C), WOS3 (900°C), and WOS4 (1000°C) were 55.8%, 45.3%, 49.2%, 54.3%, and 57.4%, respectively. This showed that higher calcination temperature led to greater production of CaO. In comparison, WOS2 produced more CaO than WOS1 and had the lowest MgO content among all samples. Previous studies also stated that calcining at 800°C could perfectly transform CaCO3 into CaO [34]. Based on the results, the CaCO3 content of uncalcined WOS was 87.56 [57], 95.32 [58], 95.99 [59], 95.99 [60], 97.11 [21], 97.20 [61], and 98.00 [6].
The specific gravity of OPC was found to be higher compared to WOS. This was because OPC particles are smaller in size compared to WOS. With smaller OPC particles, the surface area is larger and requires more water. Therefore, the volume of cement becomes smaller, which can increase the specific gravity value. Previous studies reported similar results, with OPC having a specific gravity of 3.14 g/cm3 and WOS of 2.67 g/cm3 [21].
The optimum temperature for producing CaO was 1000°C and the amount of CaO achieved was greater than OPC Type 1. Other studies have also confirmed that calcination at 1000°C yields a high CaO content [31]. XRF results show that all calcined samples had high CaO and low MgO content. According to a report, the quality of cement can be evaluated based on CaO and MgO content [62]. Another study also suggests that low MgO content leads to better homogeneity in cement paste when mixed with water [63].
3.3 Normal Consistency Test Results
The normal consistency test was carried out on Type 1 OPC and WOS-mixed paste. The results provided the percentage of water used in making paste, which was expressed as Water (W) and Derivation (D). Detailed data are presented in Table 4 below.
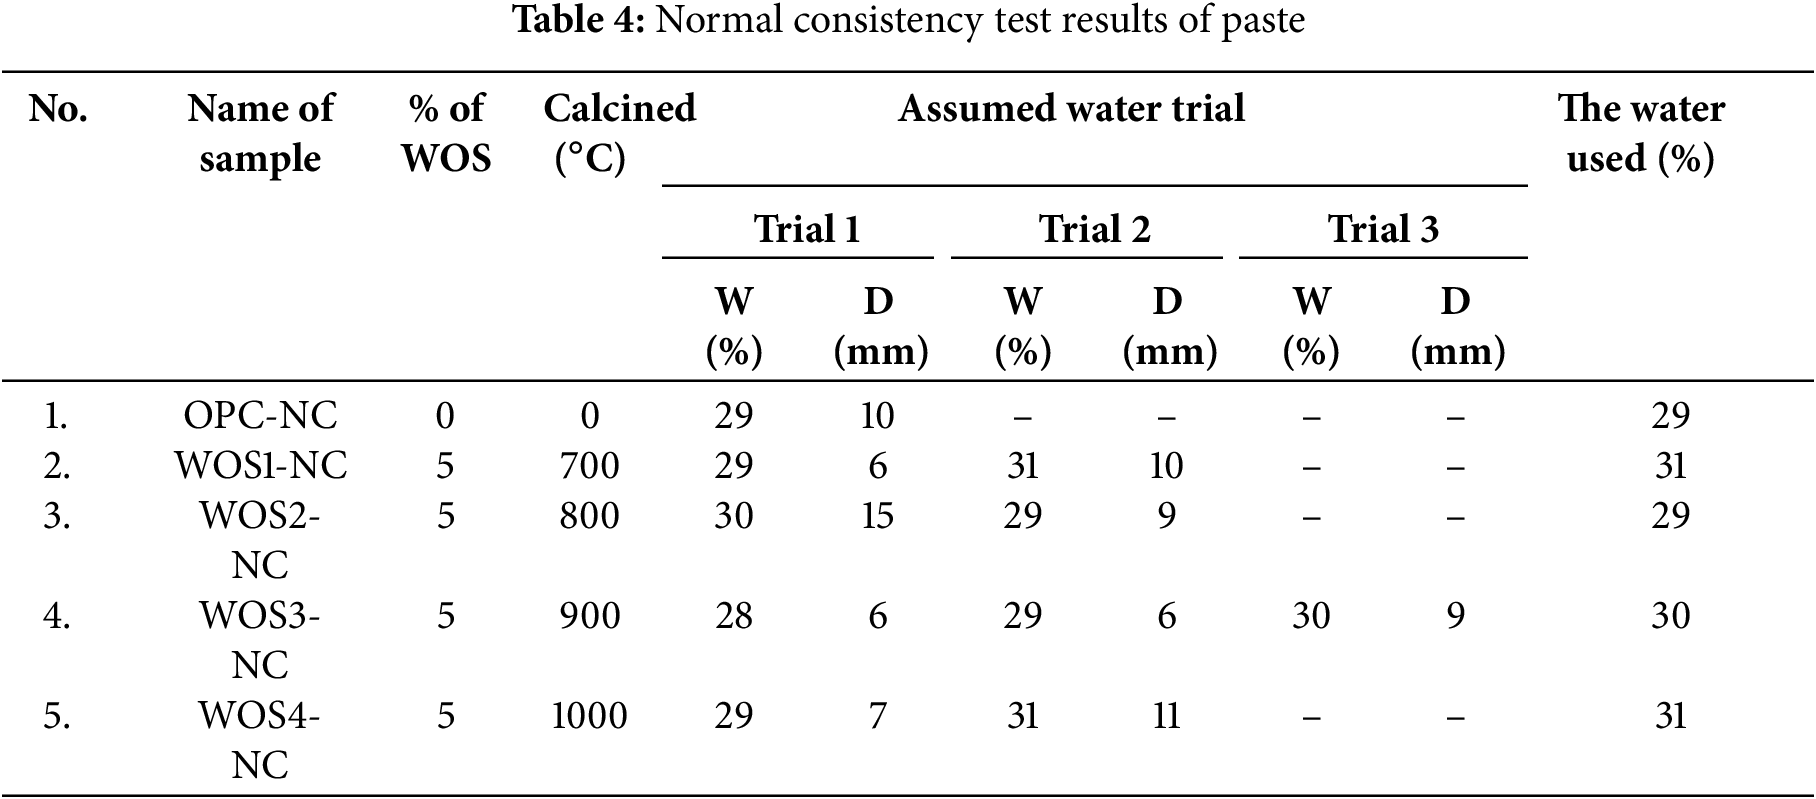
Based on Table 4, each sample experienced multiple trials to determine the appropriate water percentage for paste preparation. The amount of water used was determined based on the vicat needle penetration, with a target of 9–11 mm. Furthermore, water content obtained for each paste sample, namely OPC-NC, WOS1-NC, WOS2-NC, WOS3-NC, and WOS4-NC, was 29%, 31%, 29%, 30%, and 31%, respectively. The WOS2-NC paste showed similar physical properties to the OPC-NC control, requiring the same water percentage (29%) to initiate cement hydration. However, the vicat needle penetration of WOS2-NC was lower than OPC-NC due to reduced MgO content, which accelerated the hydration process (paste hardening). Previous studies reported that lower MgO content accelerated paste hardening, thereby reducing vicat needle penetration [64,65]. Another study found that WOS with 0.20% MgO and OPC Type 1 with 1.40% MgO caused a lower slump in WOS, accelerating paste and concrete setting [66].
The setting time test was performed immediately after determining the water content from the normal consistency. This test was conducted at 15-min intervals and measured vicat needle penetration, with results shown in Table 5.
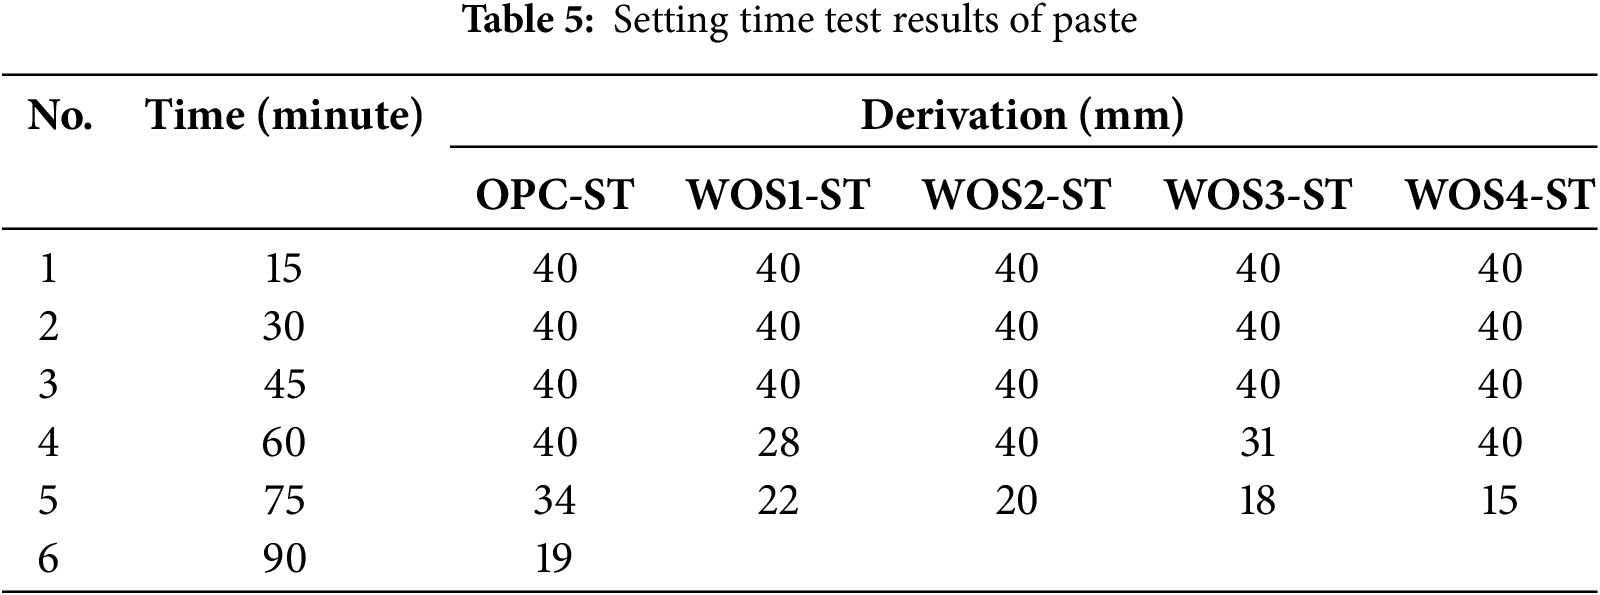
Table 5 shows that vicat penetration for all pastes is 40 mm during the first three 15-min intervals. The test was stopped once the penetration dropped below 25 mm. For the control paste (OPC-ST), the condition occurred at 90 min, while WOS was achieved at 75 min. The final results of paste setting time test are shown in Fig. 4.
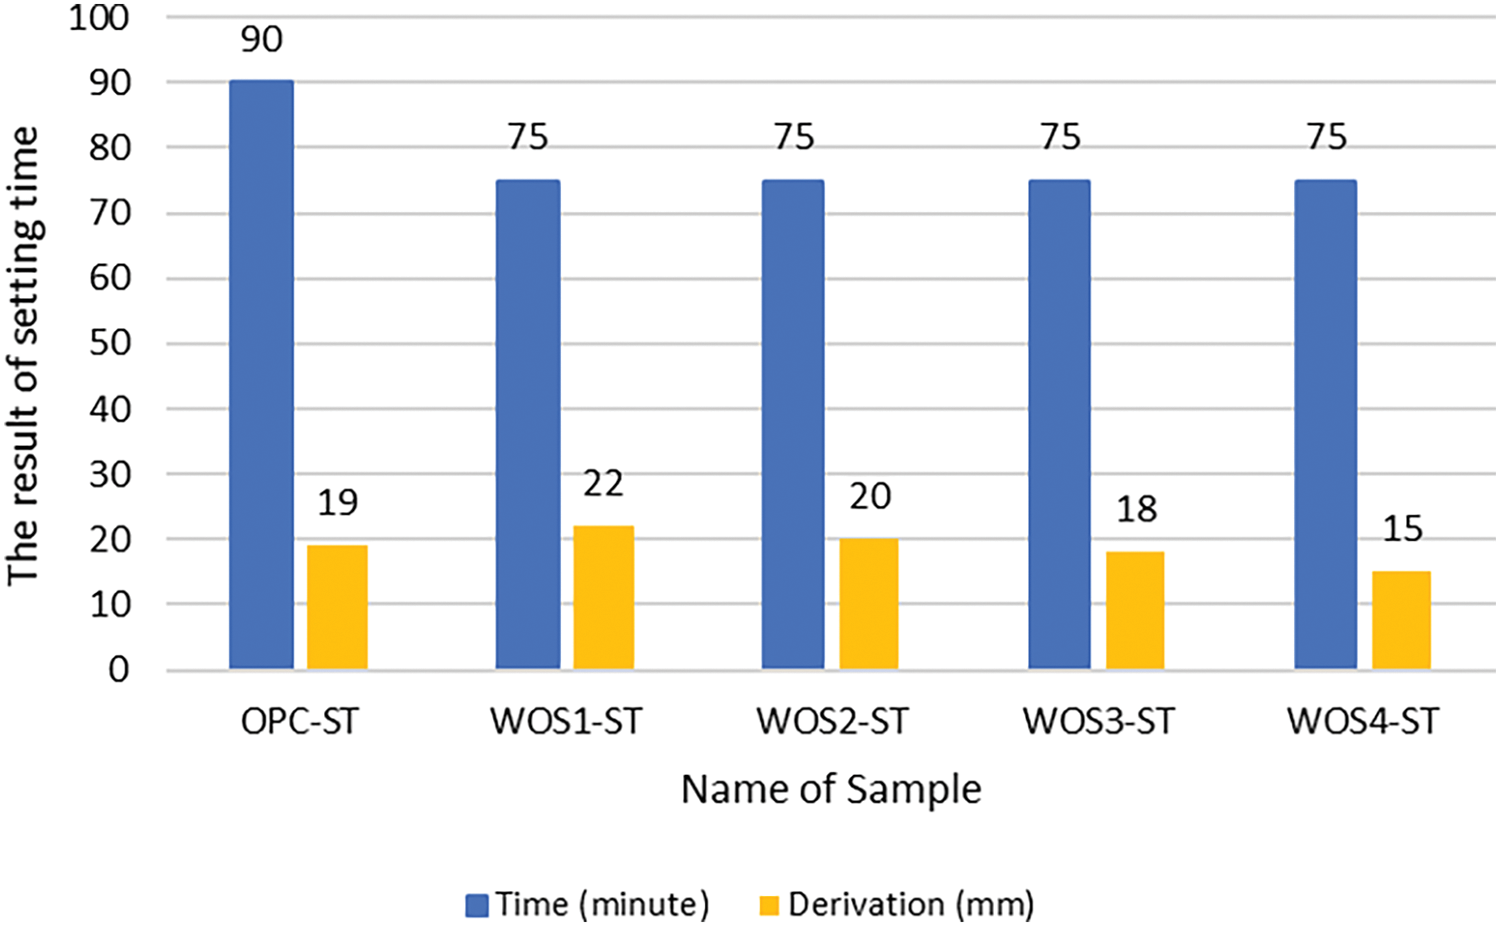
Figure 4: Setting time graph of WOS-mixed paste
Based on Fig. 4, a higher calcination temperature of WOS leads to lower vicat needle penetration in paste. The high CaO content in the 5% WOS-mixed paste reduced plasticity, leading to faster hardening compared to the OPC control paste. The results also showed that the initial setting time of the WOS-mixed paste was shorter compared to OPC cement. This was because WOS required more water than OPC cement. As a result, it has better workability and takes longer to form a rigid structure, showing that the initial setting time is extended [67]. Previous studies found that CaO addition could shorten setting time and accelerate hydration [68,69]. Other reports suggested that higher calcination temperature of WOS increased CaO content, thereby enhancing the workability performance of paste and concrete [46–48].
Paste mix design was based on water percentage obtained from the normal consistency test. Manual mixing was performed in the laboratory for cube specimens measuring 5 cm × 5 cm × 5 cm, with details shown in Table 6.
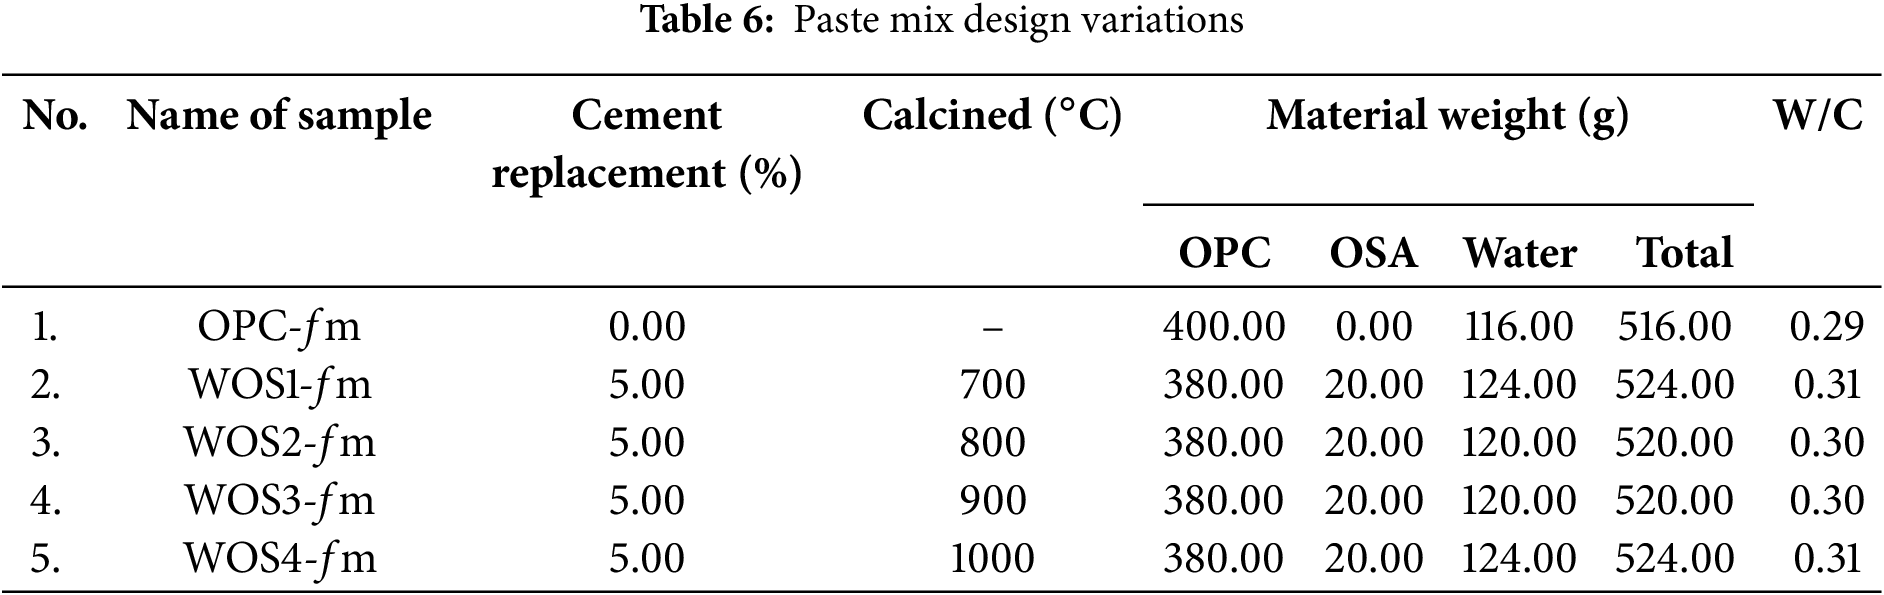
Based on Table 6, workability for each variation was significantly influenced by the amount of water added. Higher water content led to a greater W/C ratio, showing better workability and ease of mixing. The OPC-fm paste had lower workability compared to WOS paste due to high MgO content in OPC, as shown in Table 3. Similarly, previous studies stated that replacing 5% to 10% WOS with cement could dilute paste and increase the W/C ratio [70,71]. Other reports confirmed that adding WOS to cement enhances paste workability [21]. WOS substituted into cement could also dilute paste mixture, thereby increasing the water-to-cement (W/C) ratio and improving workability. As a result, paste hydration increases to reduce the intensity of C3S and C2S diffraction peaks.
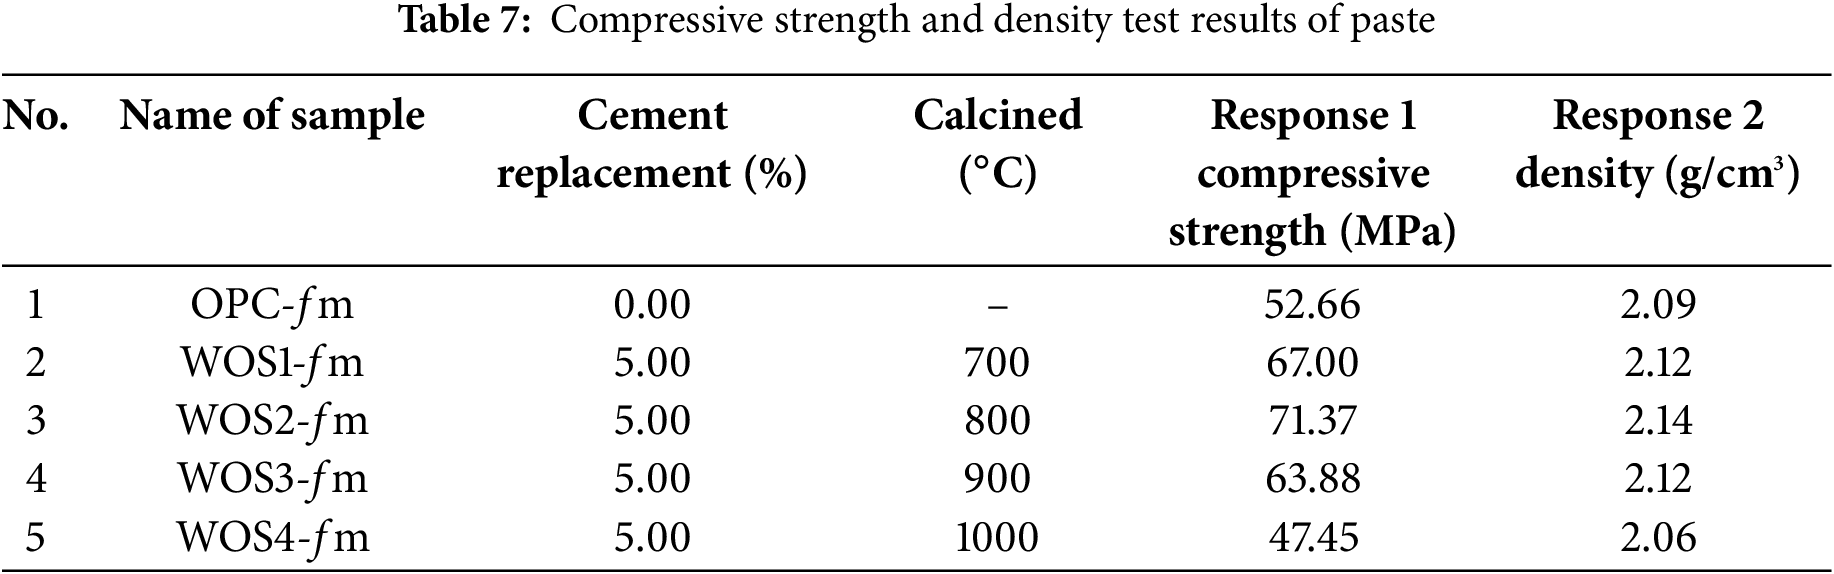
3.6.1 Results of Compressive Strength and Density Tests of Paste
Compressive strength and bulk density tests were conducted after the specimens reached 28 days of age. The specimens were immersed in a curing tank with a humidity temperature of 28°C. Previous studies reported that the curing temperature for immersed paste typically ranged around 27°C ± 2°C [5]. Table 7 shows results for hardened paste, which include compressive strength and density from 5 variations. Based on the results, the variables used in this study consisted of cement replacement and calcination, with the outputs being response 1 (compressive strength) and response 2 (density). The data were also statistically analyzed using ANOVA with the RSM through the Design Expert application, applying a quadratic model represented in contour and 3D plots.
The quadratic model was used in the ANOVA, with cement replacement variable denoted by A and calcination temperature by B. The ANOVA results for compressive strength and density are presented in Table 8.
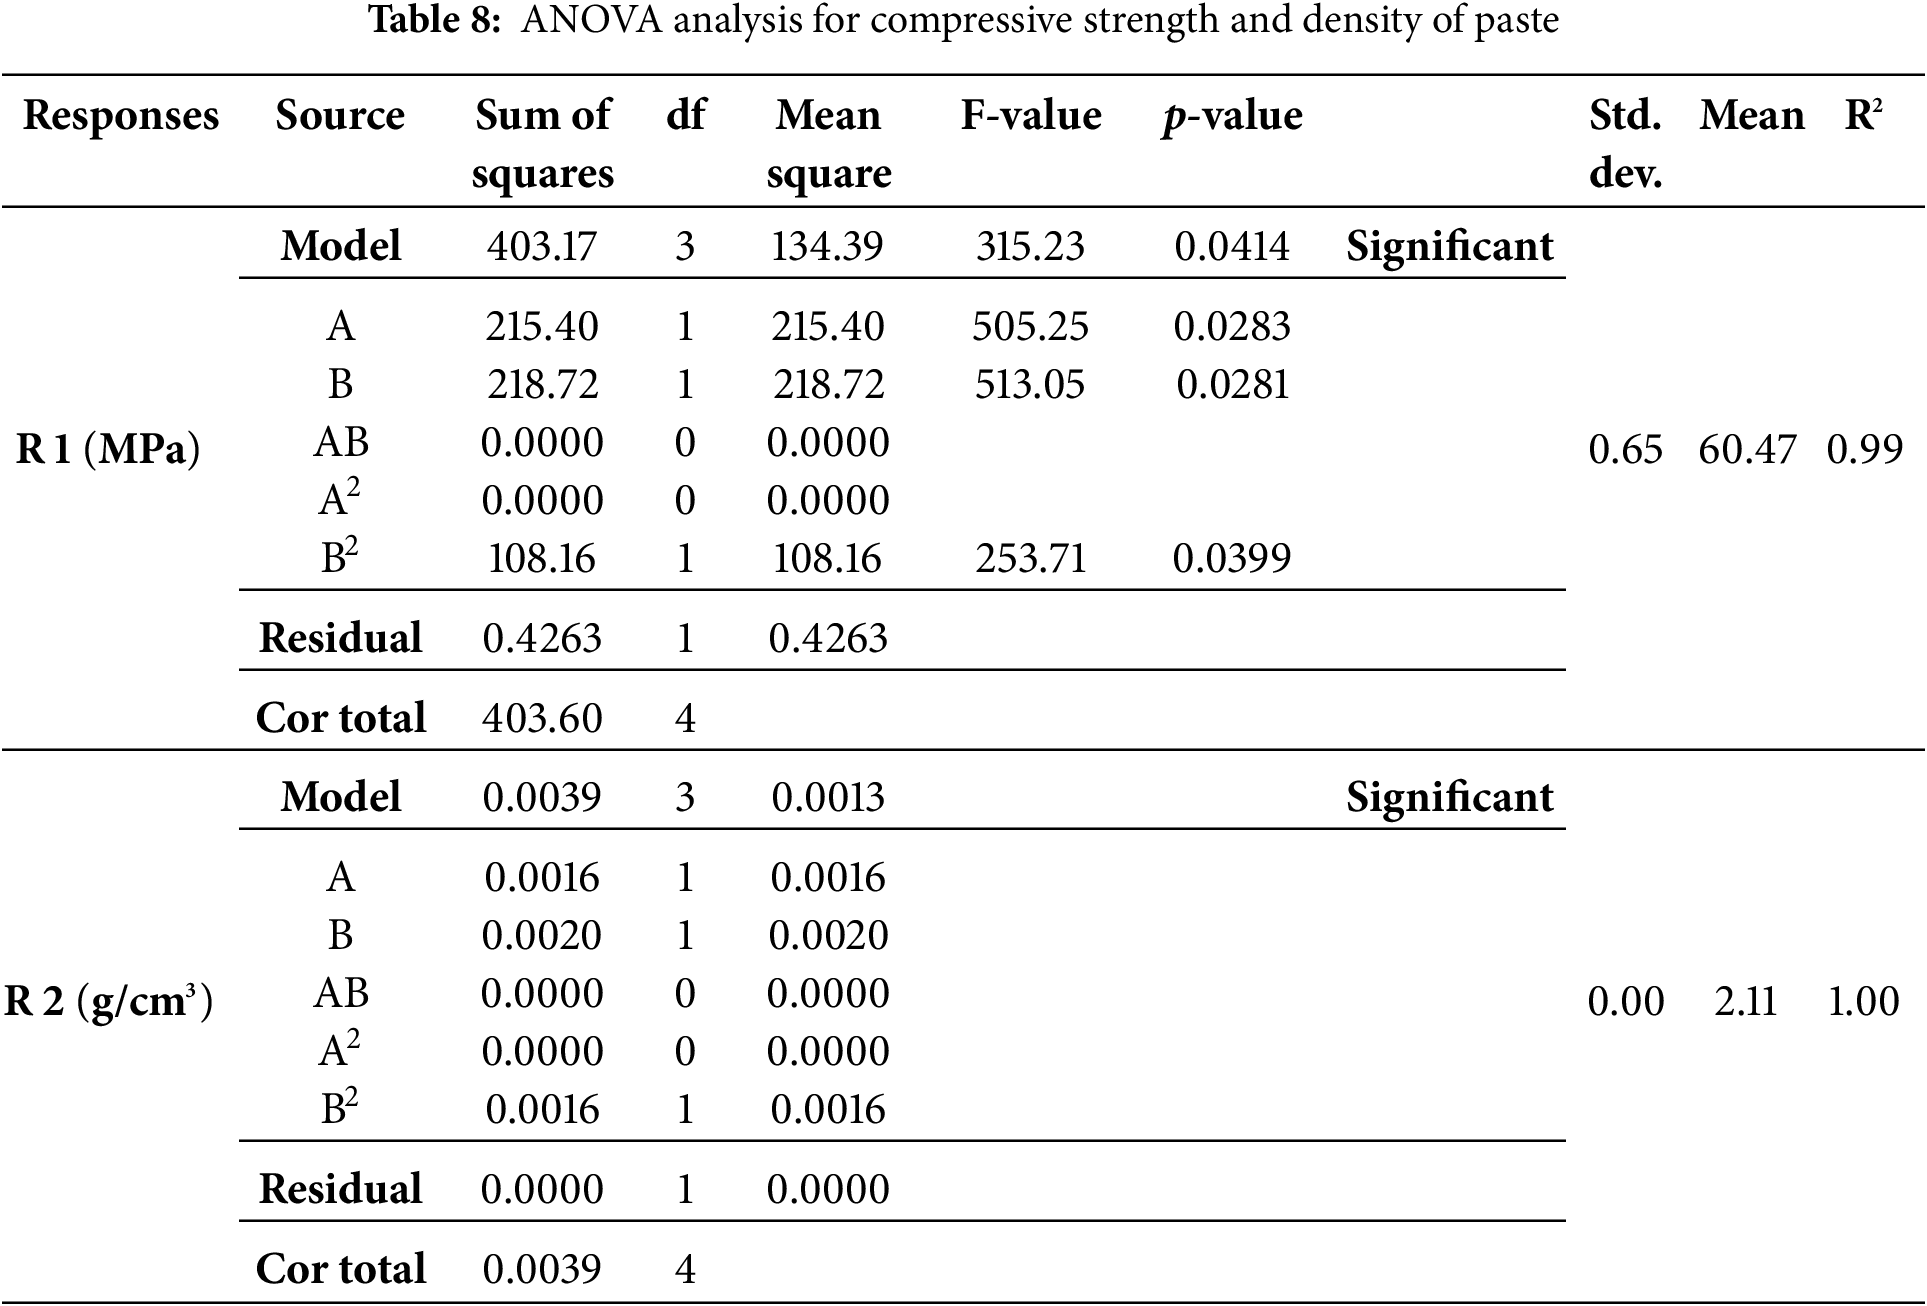
Both compressive strength and density tests produced statistically significant data (p < 0.05). The variables used in this study significantly influenced the increase in compressive strength of paste. The F-value for compressive strength was 315.23 with a p-value of 0.0414, showing a significant model. For density, although the model was significant overall, individual terms showed no substantial impact. Furthermore, the standard deviation obtained was ideal, namely <3.00. This showed that all values in the dataset were nearly identical to the mean. Previous studies have stated that a standard deviation smaller than mean showed a low level of data deviation, indicating good data quality [72].
From responses 1 and 2 in Table 7, contour and 3D surface plots were generated using Design Expert. This showed the relationships between cement replacement and calcination temperature, as presented in Figs. 5 and 6.
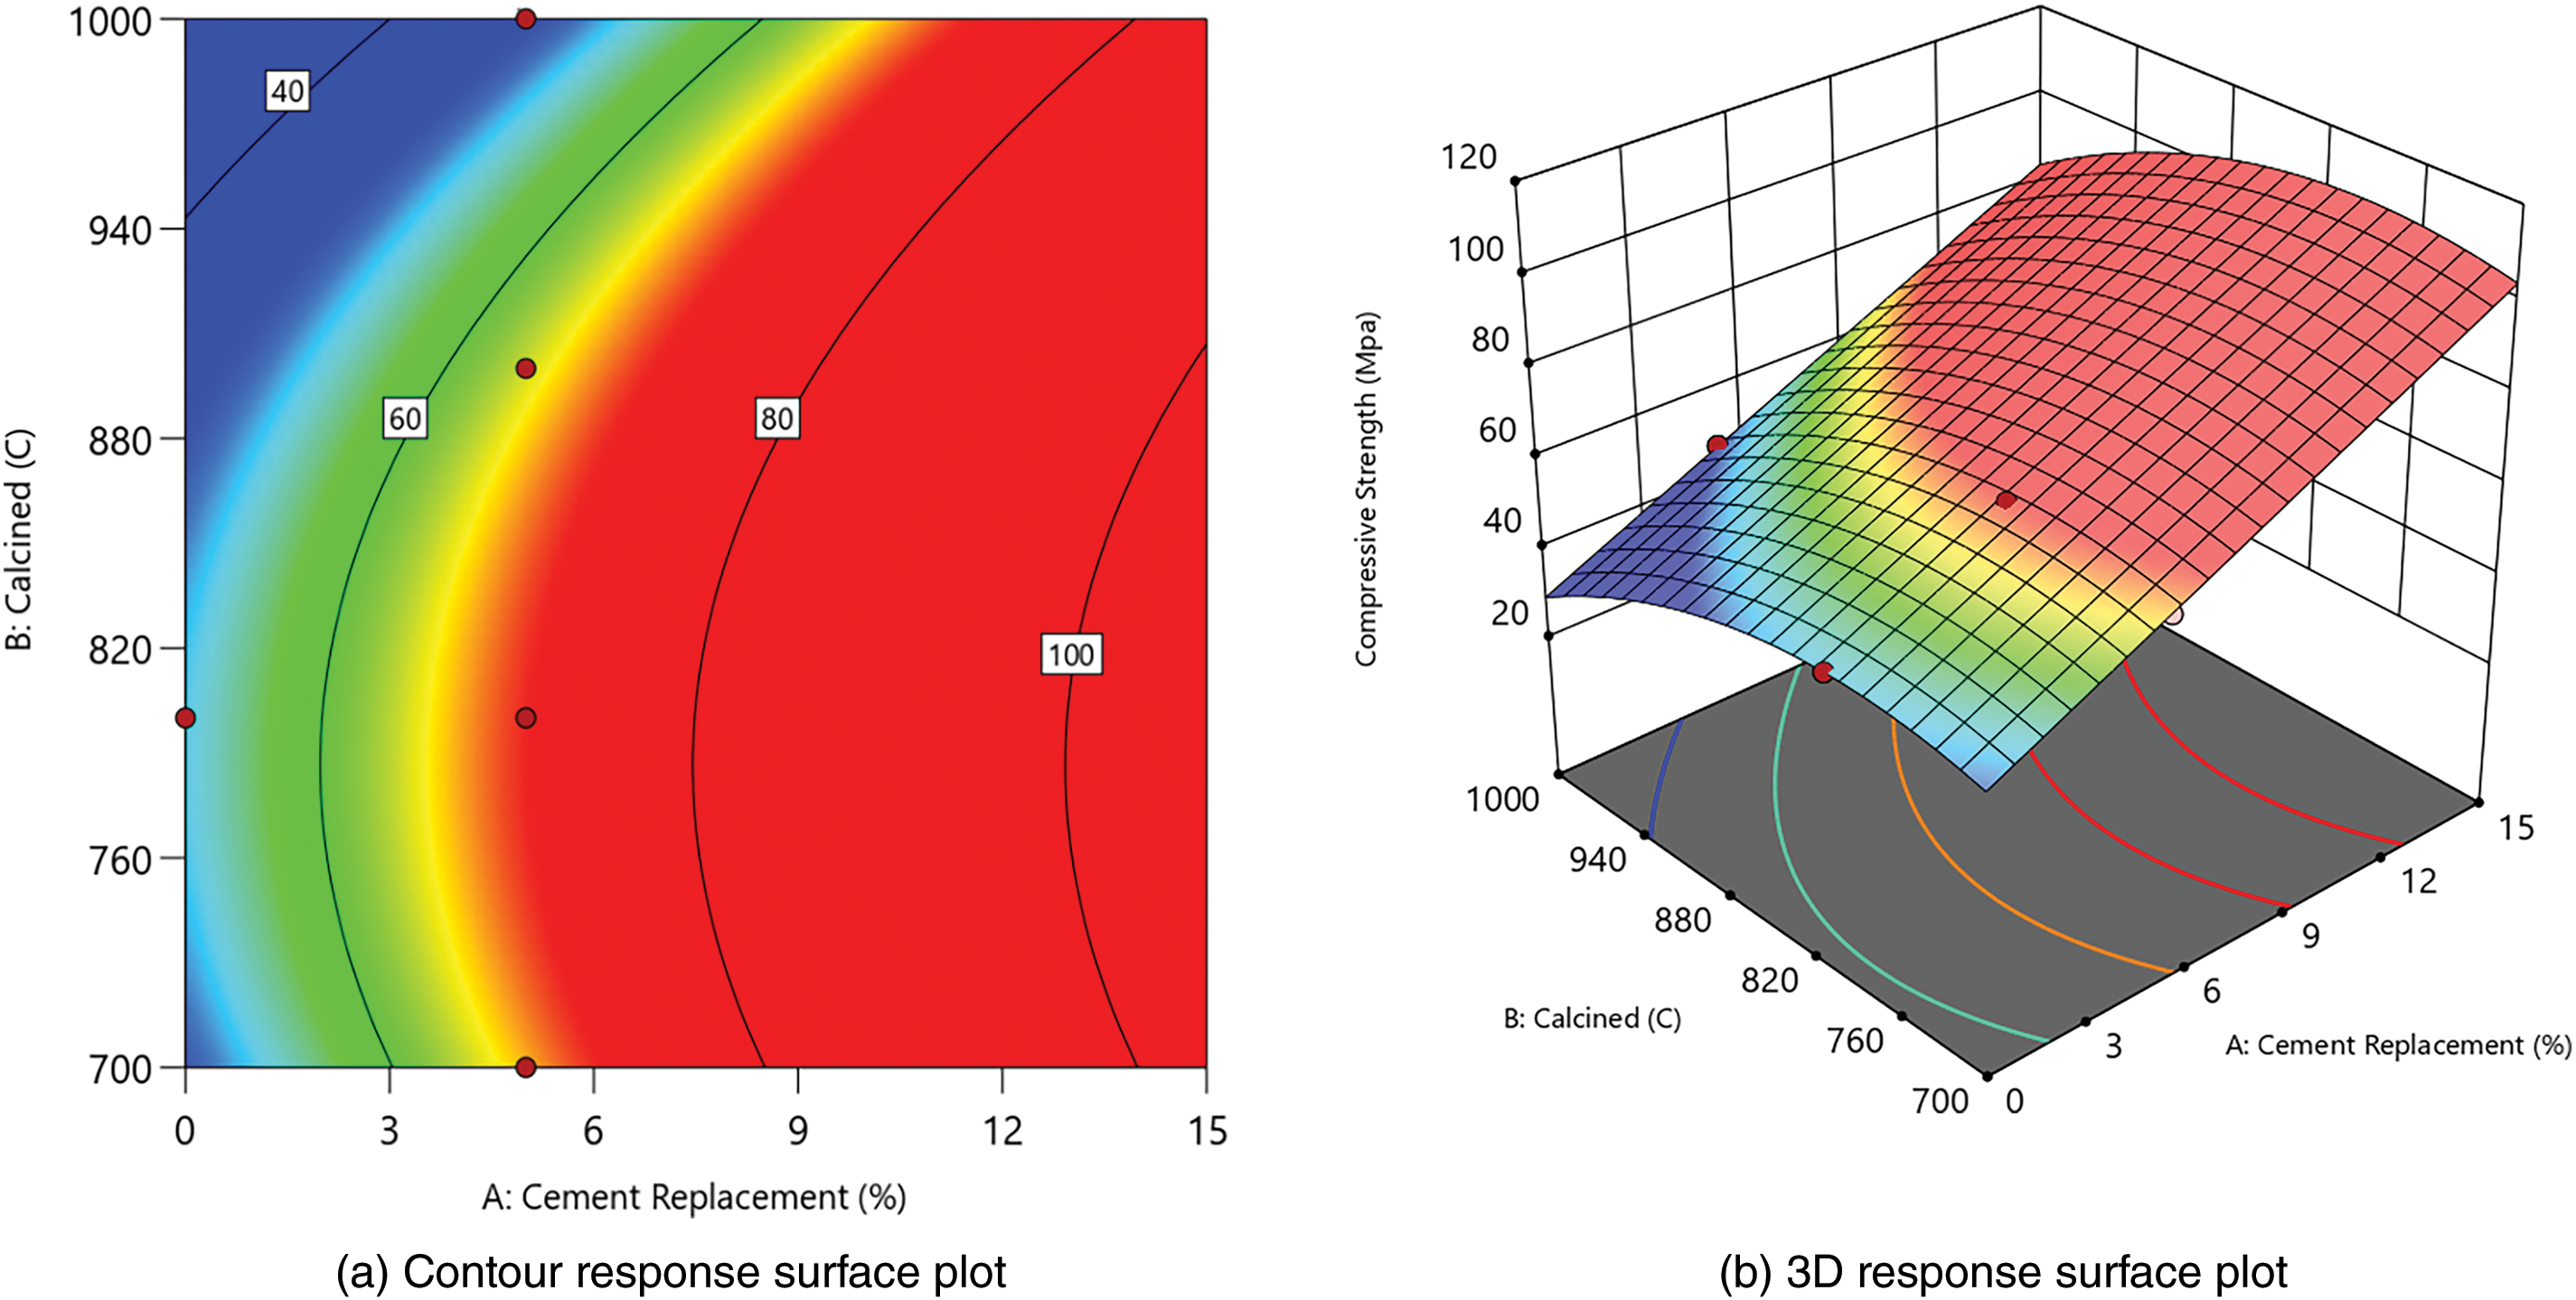
Figure 5: Contour and 3D response surface plot for compressive strength
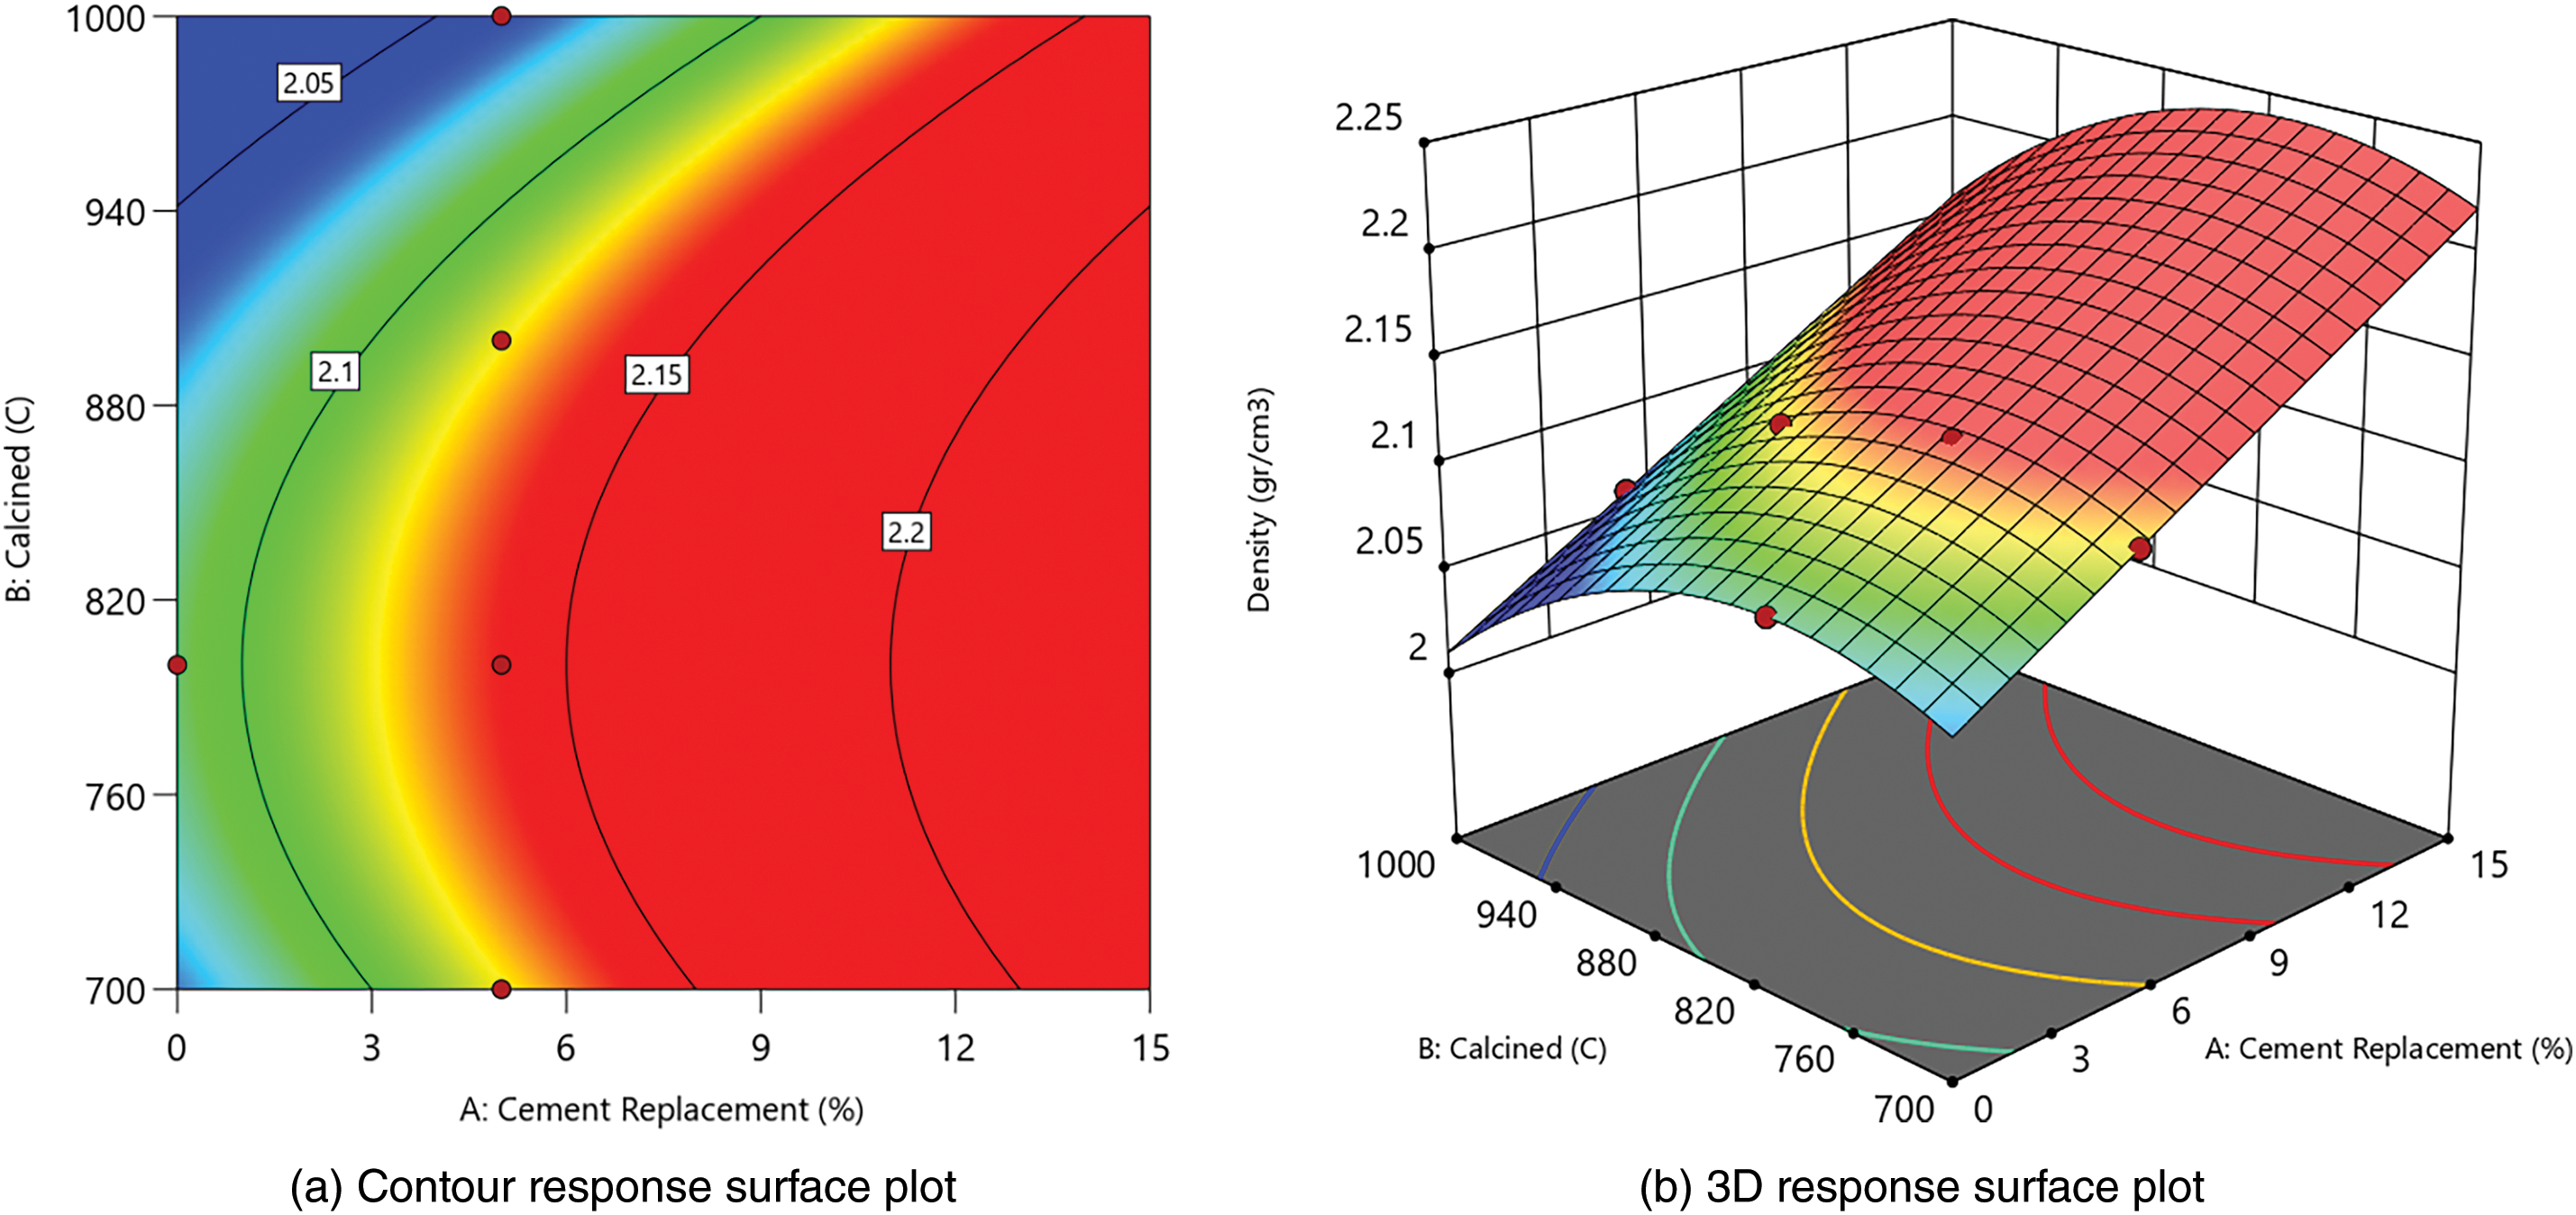
Figure 6: Contour and 3D response surface plot for density
Figs. 5 and 6 show that cement replacement and calcination temperature significantly influence the increase in compressive strength and density. When WOS replacement is increased to 15% and calcined at 700°C to 900°C, both strength and density improve. The most significant improvement occurs near 800°C with higher WOS content.
The compressive strength results in Fig. 5 show that the maximum strength for 5% WOS replacement is found in WOS2-fm at 71.37 MPa, due to low MgO content produced from calcining WOS at 800°C. Liu et al. (2012) observed that low MgO enhanced paste hardening and strength [64]. Similarly, Liao et al. (2022) found that WOS calcination at 800°C significantly increased mortar strength [27]. In line with previous studies, MgO content of 0.33 in calcined WOS could significantly enhance the compressive strength of mortar. This was due to the CaO content in WOS, which provided space for Ca(OH)2 to participate in the pozzolanic reaction. The resulting C-S-H gel fills the voids in the mortar, thereby increasing the density of the mortar structure [73]. Other studies on the use of fly ash as a substitute material in paste have shown the production of different chemical compositions compared to WOS. It was also reported that calcining fly ash at 800°C for use in cement could significantly enhance the compressive strength of paste. The reaction was attributed to the high content of SiO2, a primary chemical compound in cement production, amounting to 48.70%. Specifically, SiO2 plays a crucial role in increasing density and strength, reducing permeability, and improving resistance to corrosion [74].
In this study, the minimum compressive strength occurred in WOS4-fm at 47.45 MPa, which was lower than OPC-fm. High calcination temperature may lead to excessive CaO, which can slow hardening and reduce strength [75]. According to previous studies, excessive addition of CaO into mortar increases porosity, leading to a significant reduction in the compressive strength [76]. Another study found that when CaO was added to cement in high proportion, cement particles could not disperse properly, thereby reducing the fluidity of cement paste mixed with WOS. This suggested that paste ability to flow decreased, causing the formation of voids and a reduction in compressive strength [77]. Another study reported that when cement hydration occurred with a high CaO content, there was a decrease in the formation of C-S-H gel. Therefore, porosity increased, water absorption became higher, and the compressive strength of cement declined [46].
Fig. 6 shows a similar trend for density, where the maximum was 2.14 g/cm3 (WOS2-fm), and the minimum was 2.04 g/cm3 (WOS4-fm). All WOS-mixed paste had higher density than OPC-fm, except WOS4-fm. The results of chemical testing showed that MgO content in WOS calcined at 800°C was the lowest. This showed that hydration did not occur rapidly, preventing cracking in paste and leading to a denser paste. According to previous studies, when only a small amount of WOS was replaced with cement, the required water amount was low, leading to a lower production of Ca(OH)2. Therefore, the performance of paste improved, and the bulk density also increased [78]. High calcination causes CaCO3 to turn into CaO, resulting in weight reduction [79], while lower CaO content helps fill voids and increases density [80].
Table 8 shows the analysis of compressive strength and paste density test results using ANOVA. Based on this analysis, a mathematical model can be determined using the Design Expert application by referring to the coefficients in terms of coded factors, with details shown in Table 9.
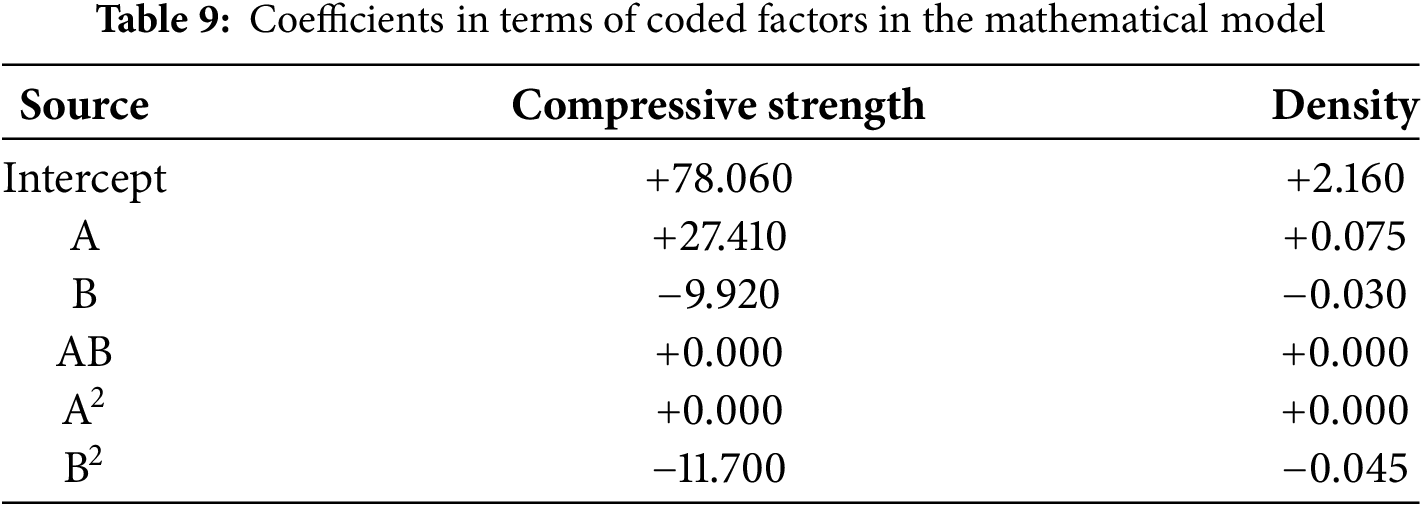
The equation in terms of coded factors can be used to make predictions about the response for given levels of each factor. By default, the high levels of factors are coded as +1 and the low levels are −1. The coded equation is useful for identifying the relative impact of factors by comparing the coefficients. Moreover, the mathematical models between the factors and responses in this study are given by Eqs. (2) and (3).
Legend: A = Cement Replacement (%); B = Calcined (°C).
3.6.3 Prediction of the Optimum Level
The optimum level was predicted by determining the criteria for the variables affecting the response. In this study, the variables used were cement replacement and calcination temperature. Cement replacement variable had two levels of 0% and 5%, while calcination variable had four levels, namely 700°C, 800°C, 900°C, and 1000°C. In RSM, the objective for cement replacement and calcination was set to in range, while the compressive strength was set to maximize and density was place at none. By using the Design Expert software and the RSM method, the optimum combination of levels was obtained as shown in Fig. 7, namely cement replacement = 5%, calcined at 786.438°C.
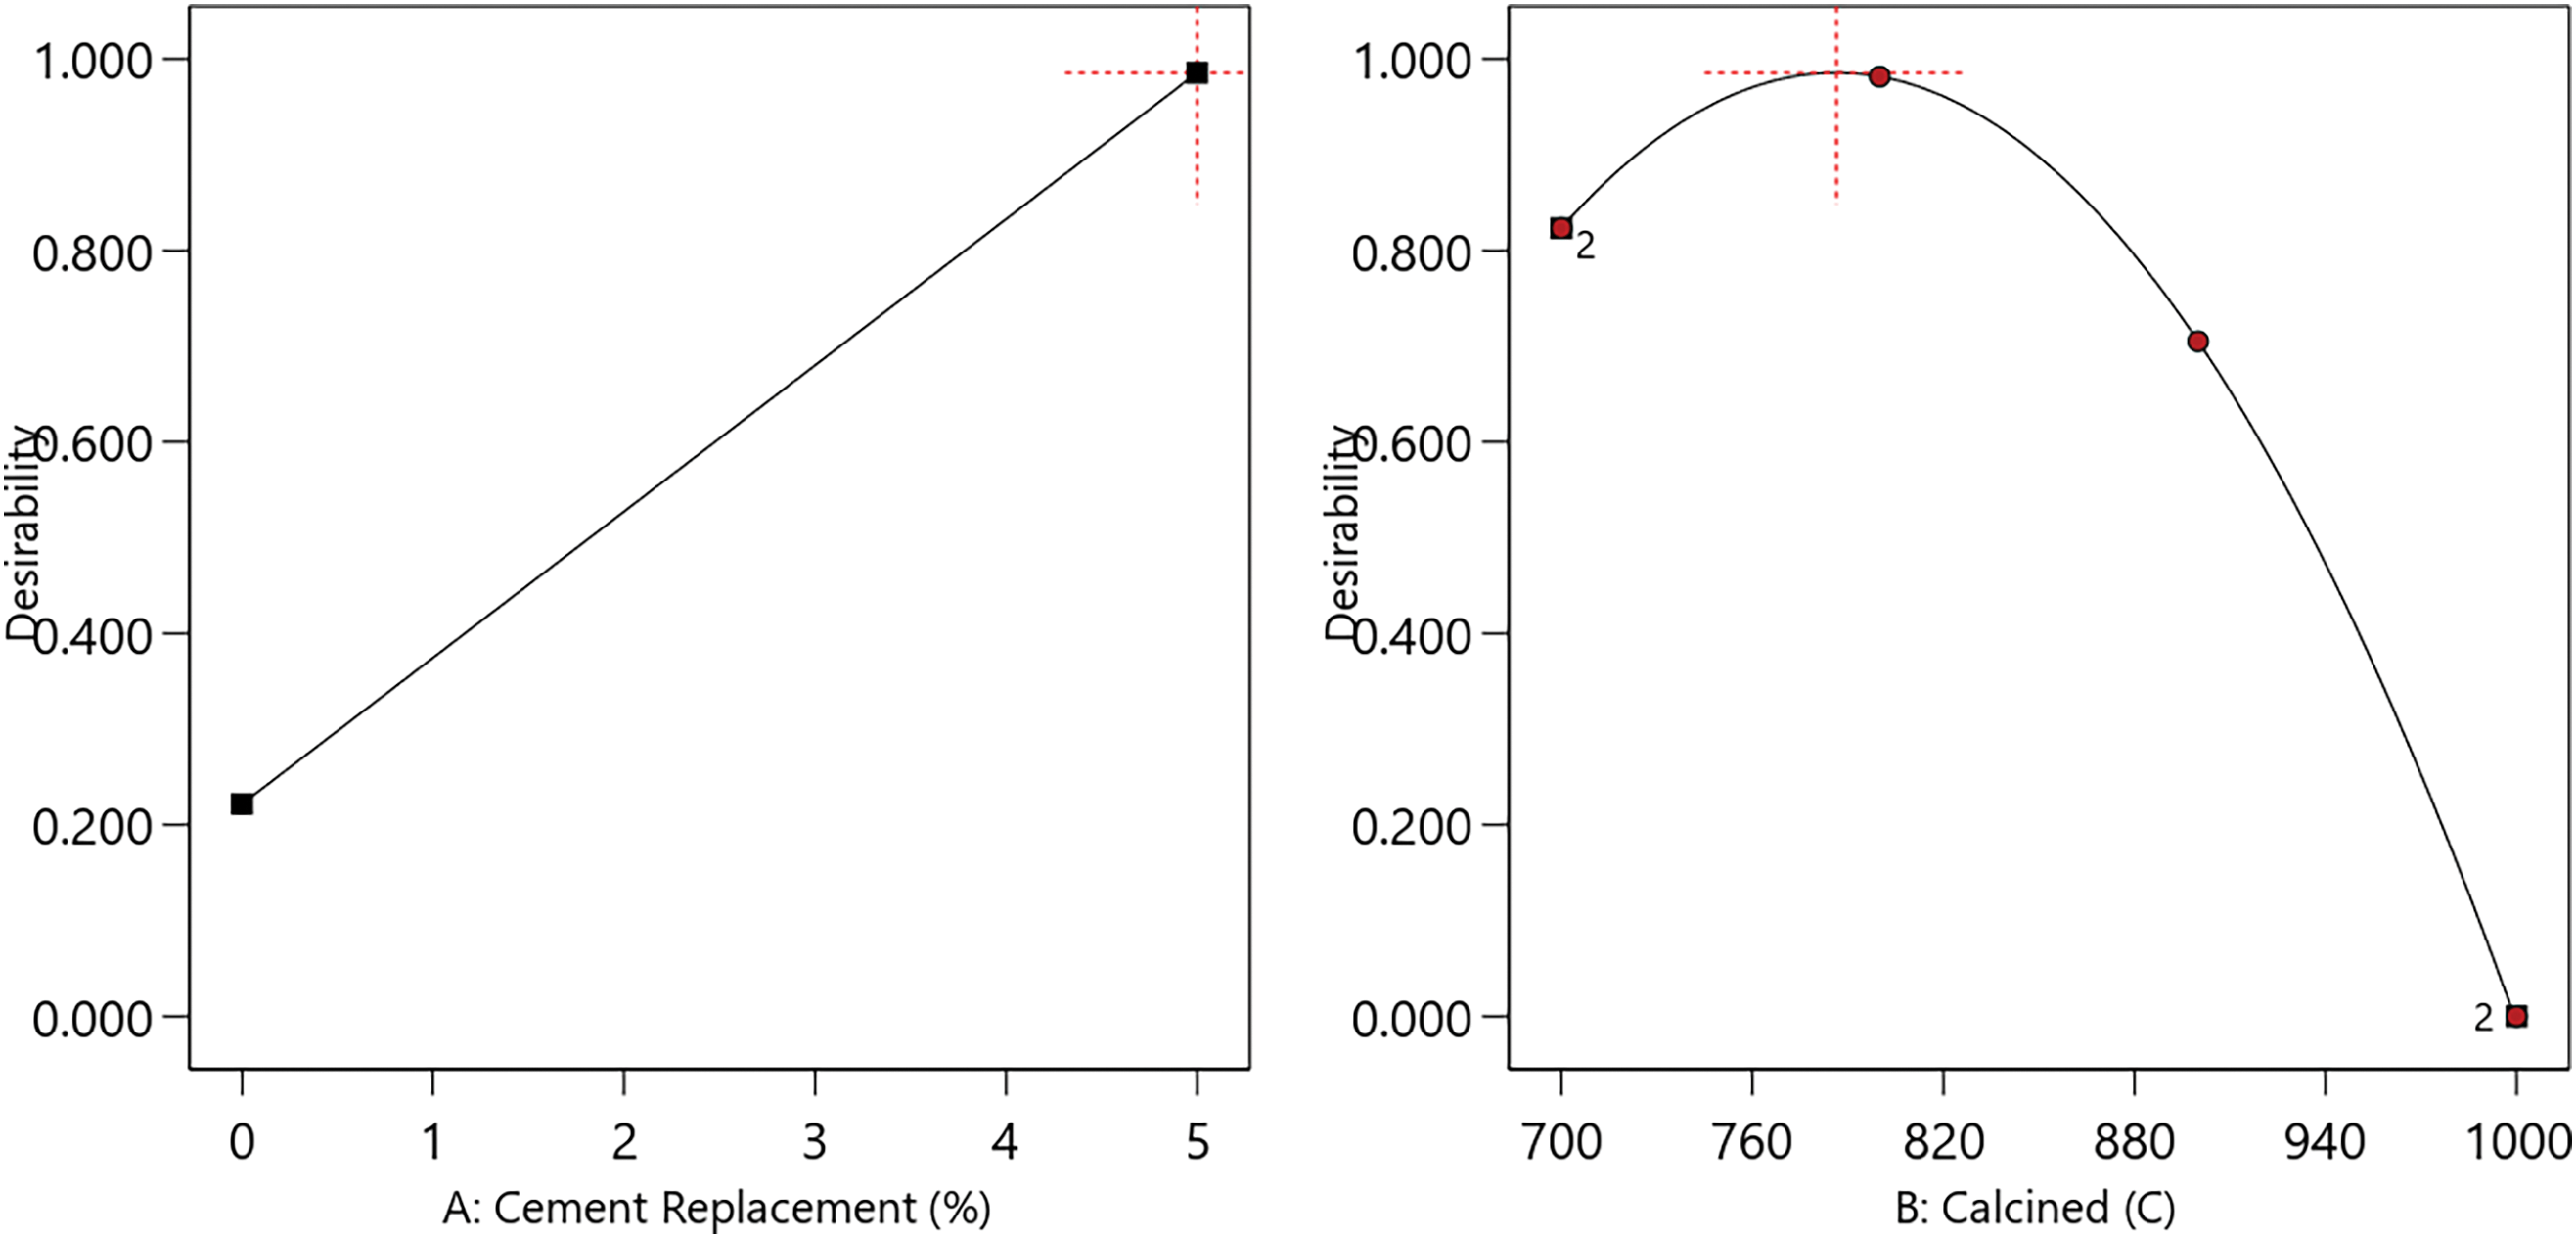
Figure 7: Effect of the optimum level on study variables
Based on Fig. 7, the optimum level of each variable was shown by a peak point with a desirability value of 1.000. It was also observed that paste strength decreased as desirability reached 0.000. The strength significantly decreases when cement replacement is below 5% and calcination exceeds 800°C. As shown in Fig. 6, the optimum response for maximum compressive strength can be determined. The optimum response can be visualized in the form of a contour plot, as shown in Fig. 8.
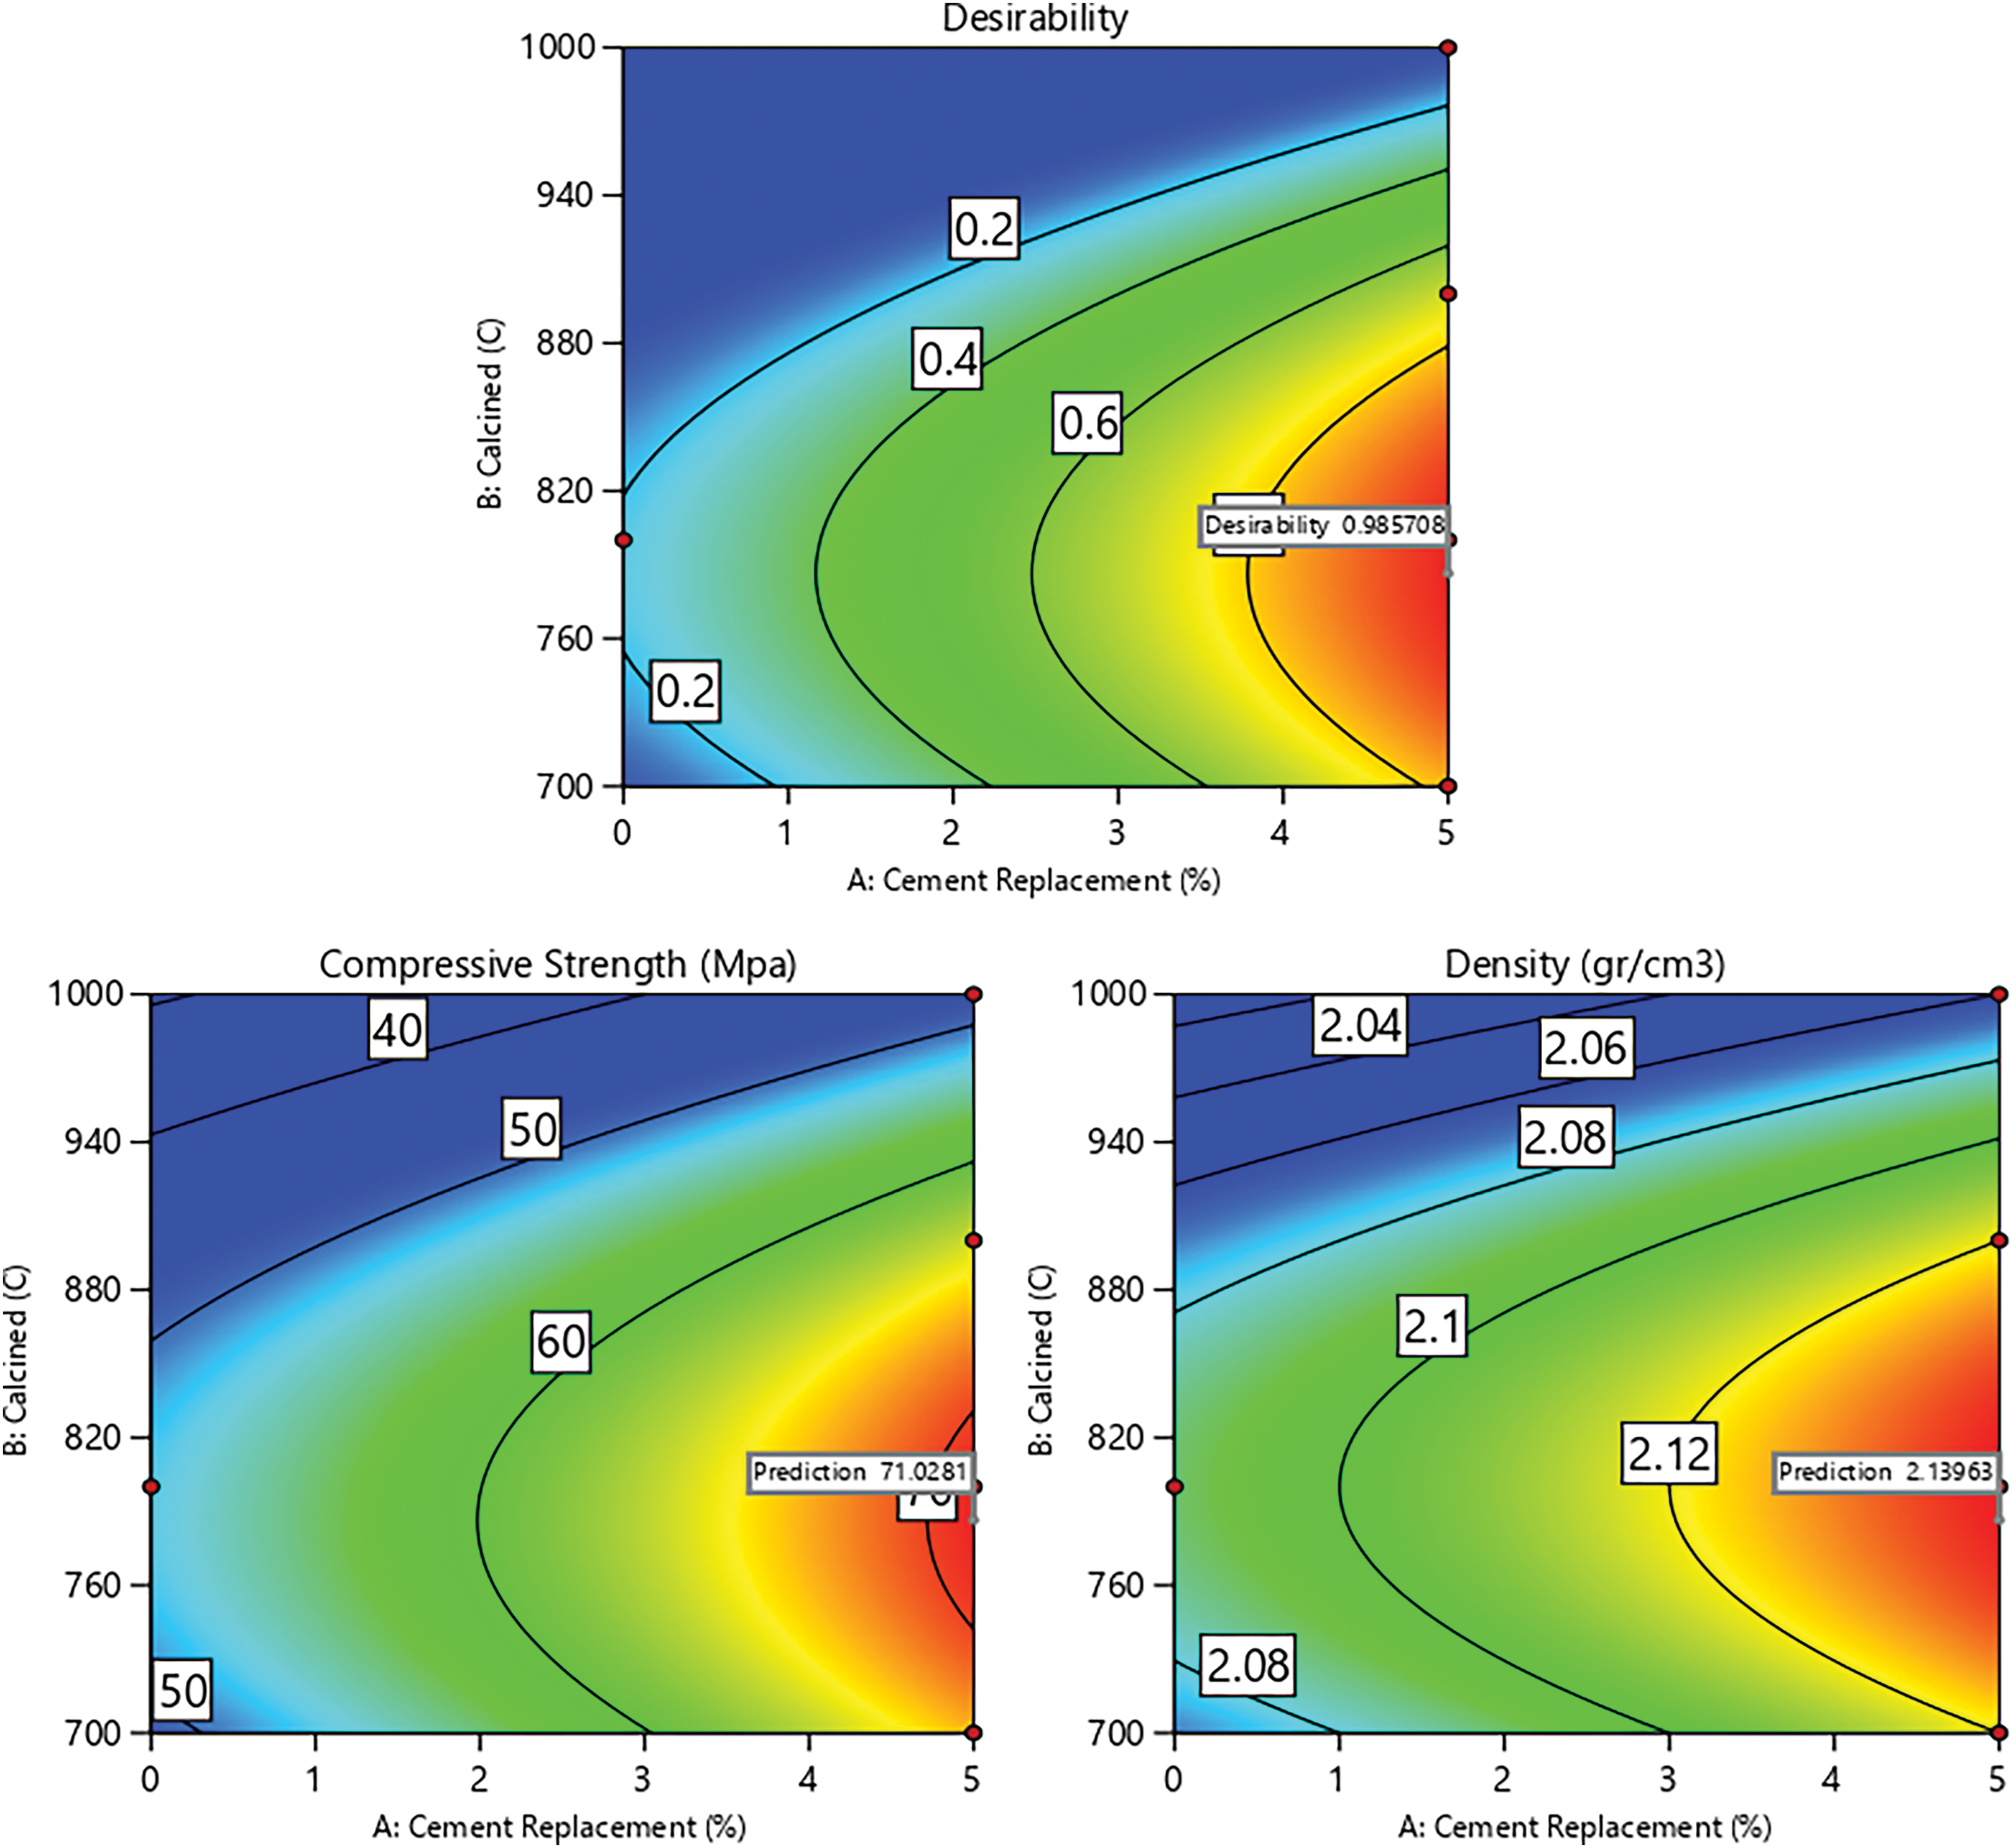
Figure 8: Contour plot for desirability and all responses
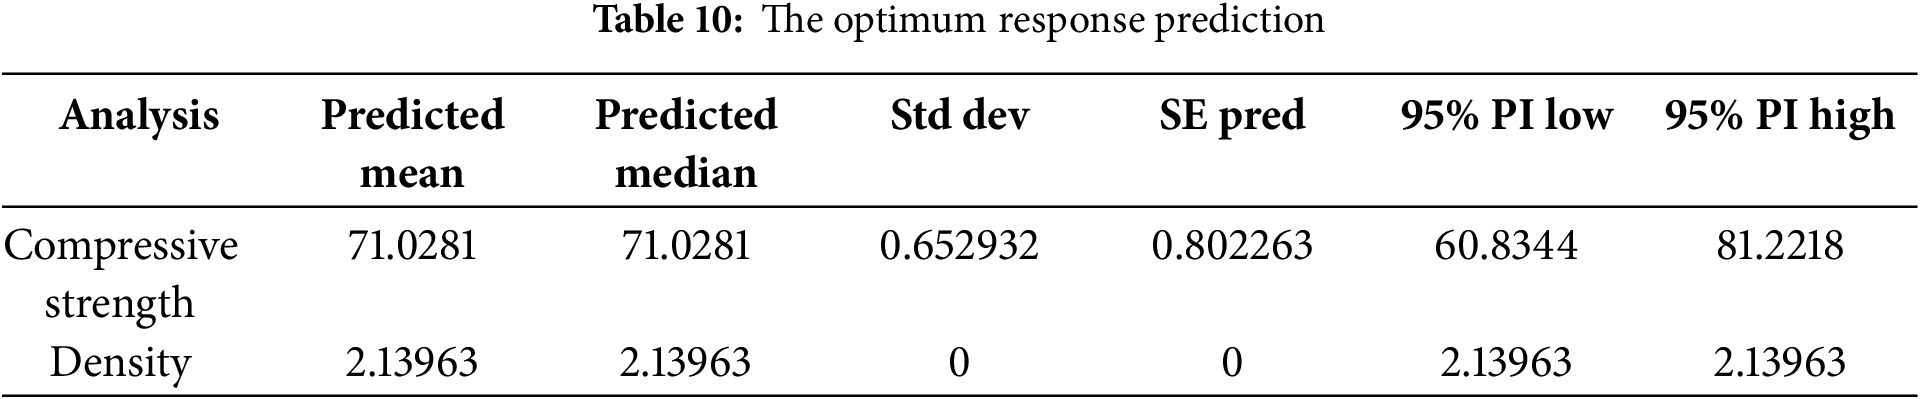
Based on Fig. 8, the desirability value reaches 0.986 when cement replacement is increased to 4% and 5%, and calcination temperature is set between 700°C and 870°C. The compressive strength of paste reaches the peak when cement replacement is increased and calcination is carried out at temperature between 750°C and 820°C. Meanwhile, the optimum paste density is achieved if cement replacement is increased to between 3% and 5% and calcination temperature ranges from 700°C to 870°C. The predicted optimum compressive strength and paste density are shown in Table 10. Therefore, with variable levels of cement replacement at 5% and calcination temperature at 786.44°C, the responses obtained are a compressive strength of 71.028 MPa and a density of 2.140 g/cm3.
In conclusion, the results showed that the optimum temperature for producing CaO was 800°C. Therefore, replacing WOS with cement at 5% and a temperature of 800°C could yield ideal chemical properties, namely high CaO and low MgO content. These chemical components showed the potential to accelerate the paste hydration process.
This study showed that replacing WOS with cement at 5% and calcination temperature of 800°C could significantly increase the compressive strength of the paste. This was due to the moderate rate of cement hydration and the formation of a perfect bond between cement, WOS, and water. The optimum level for achieving maximum compressive strength and density responses was found to be at 5% cement replacement and calcination temperature of 786.44°C.
Using WOS in paste production added value to the material, as the high CaO content made it a viable substitute for one of the main raw materials in cement manufacturing. However, the limitation of this study was the use of a relatively large WOS particle size of 75 µm. This limited the results regarding the ideal WOS particle size in terms of CaO content and compressive strength improvement of paste. Therefore, varying WOS particle sizes in future studies could help overcome the limitation. Varying calcination duration for WOS could also be considered as a subject. Further analyses such as TGA, XRD, FTIR, and SEM-EDS, including LCA and TEA assessments were also recommended to strengthen the evaluation of CaO reactivity and the impact on mechanical performance and material sustainability.
Acknowledgement: The authors are grateful to the University of Syiah Kuala and the University of Iskandar Muda for providing tools for conducting the study. Furthermore, the authors are grateful for the contributions of Rudiansyah and Tarmizi who provided assistance with the experimental work.
Funding Statement: This research received no specific grant from any funding agency in the public, commercial, or not-for-profit sectors.
Author Contributions: Bunyamin Bunyamin carried out the teoretical analysis and experimental studies, participated in the sequence alignment and drafted the manuscript. Taufiq Saidi guided the whole study and edited the writing of the article. Muttaqin Hasan participated in the experimental studies, participated in the design of the specimens and perfomed the experimental data analysis. Sugiarto Sugiarto helped to draft manuscript, participated in data processing and article editing. All authors reviewed the results and approved the final version of the manuscript.
Availability of Data and Materials: The data that support the findings of this study are available from the corresponding author upon reasonable request.
Ethics Approval: Not applicable.
Conflicts of Interest: The authors declare no conflicts of interest to report regarding the present study.
References
1. Rusydi I, Dewiyanti I, Maisuri M, Putra DF, Octavina C, Nurfadillah N, et al. Growth of oyster (Crassostrea sp.) with different stocking density in Alue Naga waters, Banda Aceh Indonesia. IOP Conf Ser Earth Environ Sci. 2021;674:12082. doi:10.1088/1755-1315/674/1/012082. [Google Scholar] [CrossRef]
2. Yang YC, Cai JE, Li C, Wang CJ, Huang CW. Utilizing recycled pumice and oyster shell waste for cost-effective treatment to mitigate pollutants and toxicity in swine wastewater. Sustain Chem One World. 2024;3:100016. doi:10.1016/j.scowo.2024.100016. [Google Scholar] [CrossRef]
3. Chen D, Zhang P, Pan T, Liao Y, Zhao H. Evaluation of the eco-friendly crushed waste oyster shell mortars containing supplementary cementitious materials. J Clean Prod. 2019;237(3):117811. doi:10.1016/j.jclepro.2019.117811. [Google Scholar] [CrossRef]
4. Ubachukwu OA, Okafor FO. Investigation of the supplementary cementitious potentials of oyster shell powder for eco-friendly and low-cost concrete. Electron J Geotech Eng. 2019;24(5):1297–306. [Google Scholar]
5. Seo JH, Park SM, Yang BJ, Jang JG. Calcined oyster shell powder as an expansive additive in cement mortar. Materials. 2019;12(8):1322. doi:10.3390/ma12081322. [Google Scholar] [PubMed] [CrossRef]
6. Naqi A, Siddique S, Kim HK, Jang JG. Examining the potential of calcined oyster shell waste as additive in high volume slag cement. Constr Build Mater. 2020;230(5):116973. doi:10.1016/j.conbuildmat.2019.116973. [Google Scholar] [CrossRef]
7. da Cardoso AS, Rabbani ERK, Delmiro TD, Mocock JFB, da Silva SPR, Filippelli G, et al. Mollusk shell waste: alternatives for reuse in construction. Int J Environ Waste Manag. 2023;31(1):61–80. doi:10.1504/ijewm.2022.10035950. [Google Scholar] [CrossRef]
8. Shakir MA, Yhaya MF, Ramli SN, Ahmad MI. Synthesis and performance characterization of green desiccant from cockle shell and marble waste. Clean Technol Environ Policy. 2024;1-21(12):1. doi:10.1007/s10098-024-03031-6. [Google Scholar] [CrossRef]
9. Thani SM, Sa’at A, Abas R, Mohamad Zainal NH, Mohd Moklas MA, Yusof LM, et al. Morphological characterization of calcium carbonate nanoparticles derived from blood cockle shells (Anadara granosa). Malaysian J Med Health Sci. 2023;19:120–5. [Google Scholar]
10. Adepitan OL, Alabi OO, Gbadeyan OJ, Deenadayalu N, Jayeola AT. Investigation into the development and utilization of snail shell biomaterials: a systematic review. Discov Mater. 2025;5(1):1–18. doi:10.1007/s43939-025-00218-6. [Google Scholar] [CrossRef]
11. Alhassan A, Aboshio A, Uche OA. Rice husk and snail shell ash as partial replacement of ordinary Portland cement in concrete—a review. Niger J Technol. 2023;42(4):425–36. doi:10.4314/njt.v42i4.2. [Google Scholar] [CrossRef]
12. Ramasubramani R, Nareshbabu A, Sudarsan JS, Nithiyanantham S. Feasibility of cockle seashell waste as an additive material to concrete as a green concrete initiative to promote sustainability. J Build Pathol Rehabil. 2022;7(1):93. doi:10.1007/s41024-022-00234-6. [Google Scholar] [CrossRef]
13. Lakhiar MT, Zhao X, Guo Y, Chen S. Investigations on the mechanical and life cycle properties of novel marine-based sustainable BFRP composites. Constr Build Mater. 2024;453:139105. doi:10.1016/j.conbuildmat.2024.139105. [Google Scholar] [CrossRef]
14. Zhang J, Guo Y, Zhuang S, Li Y. The effect of adding rice husk ash (RHA) and calcined shell powder (CSP) on the properties of cement mortar. Case Stud Constr Mater. 2025;22(1):e04426. doi:10.1016/j.cscm.2025.e04426. [Google Scholar] [CrossRef]
15. Lakhiar MT, Bai Y, Wong LS, Paul SC, Anggraini V, Kong SY. Mechanical and durability properties of epoxy mortar incorporating coal bottom ash as filler. Constr Build Mater. 2022;315(2):125677. doi:10.1016/j.conbuildmat.2021.125677. [Google Scholar] [CrossRef]
16. Lv J, Zhang Y, Huang J, Zhang Q, Ma X, Guo Y. Effects of waste rubber powder and resin content on the free shrinkage of polymer concrete. Constr Build Mater. 2023;381(11):131307. doi:10.1016/j.conbuildmat.2023.131307. [Google Scholar] [CrossRef]
17. Tak S, Gupta P, Kumar A, Sofi A, Yun CM. Effect of using silica fume as a partial replacement of cement in concrete. Mater Today Proc. 2023;4(7):104. doi:10.1016/j.matpr.2023.04.205. [Google Scholar] [CrossRef]
18. Yu Y, Gunasekara C, Elakneswaran Y, Robert D, Law DW, Setunge S. Correlating strength development with hydration characteristics for multi-blend fly ash concrete. J Build Eng. 2025;103(4):112076. doi:10.1016/j.jobe.2025.112076. [Google Scholar] [CrossRef]
19. Yang B, Han Y, Kong Z, Wang XY. Effect of waste oyster shell powder on the micro-and macroproperties and sustainable performance of cement-based materials. J Build Eng. 2024;92(11):109800. doi:10.1016/j.jobe.2024.109800. [Google Scholar] [CrossRef]
20. Aye K, Kenye K, Nainar E, Khing A, Sangtam C. Strengthening of concrete by using oyster shell and marble powder. Int J Recent Technol Eng. 2019;8(4):8048–52. doi:10.35940/ijrte.d7745.118419. [Google Scholar] [CrossRef]
21. Han Y, Lin R, Wang XY. Sustainable mixtures using waste oyster shell powder and slag instead of cement: performance and multi-objective optimization design. Constr Build Mater. 2022;348(2):128642. doi:10.1016/j.conbuildmat.2022.128642. [Google Scholar] [CrossRef]
22. Ayyappan K. Study on structural behavior of oyster shell powder in concrete. J Eng Appl Sci. 2018;13(10):8116–8. [Google Scholar]
23. Dorn T, Blask O, Stephan D. Acceleration of cement hydration—a review of the working mechanisms, effects on setting time, and compressive strength development of accelerating admixtures. Constr Build Mater. 2022;323:126554. doi:10.1016/j.conbuildmat.2022.126554. [Google Scholar] [CrossRef]
24. Li L, Liu Q, Dao V, Wu M. Dimensional change of cement paste subjected to carbonation in CO2 sequestration and utilization context: a critical review on the mechanisms. J CO2 Utilization. 2023;70(3):102444. doi:10.1016/j.jcou.2023.102444. [Google Scholar] [CrossRef]
25. Wilson W, Gonthier JN, Georget F, Scrivener KL. Insights on chemical and physical chloride binding in blended cement pastes. Cem Concr Res. 2022;156:106747. doi:10.1016/j.cemconres.2022.106747. [Google Scholar] [CrossRef]
26. ASTM C191-21. Standard test method for time of setting of hydraulic cements by vicat needle. West Conshohocken, PA, USA: ASTM International; 2021. [Google Scholar]
27. Liao Y, Wang X, Wang L, Yin Z, Da B, Chen D. Effect of waste oyster shell powder content on properties of cement-metakaolin mortar. Case Stud Constr Mater. 2022;16(8):e01088. doi:10.1016/j.cscm.2022.e01088. [Google Scholar] [CrossRef]
28. Ouafi R, Ibrahim A, Mehdaoui I, Asri M, Taleb M, Rais Z. Spectroscopic analysis of chemical compounds derived from the calcination of snail shells waste at different temperatures. Chem Afr. 2021;4(4):923–33. doi:10.1007/s42250-021-00277-1. [Google Scholar] [CrossRef]
29. Maya JC, Chejne F, Gómez CA, Bhatia SK. Effect of the CaO sintering on the calcination rate of CaCO3 under atmospheres containing CO2. AIChE J. 2018;64(10):3638–48. doi:10.1002/aic.16326. [Google Scholar] [CrossRef]
30. Mo KH, Alengaram UJ, Jumaat MZ, Lee SC, Goh WI, Yuen CW. Recycling of seashell waste in concrete: a review. Constr Build Mater. 2018;162(1):751–64. doi:10.1016/j.conbuildmat.2017.12.009. [Google Scholar] [CrossRef]
31. Lee K, You BD. Development of a low-pressure materials pre-treatment process for improved energy efficiency. Met Mater Int. 2017;23(5):1029–36. doi:10.1007/s12540-017-6924-1. [Google Scholar] [CrossRef]
32. Jeon JH, Son YH, Kim TJ, Jo SB. Engineering performances of permeable concrete blocks using oyster shell, bottom ash, and biochar. Constr Build Mater. 2024;440(1):137374. doi:10.1016/j.conbuildmat.2024.137374. [Google Scholar] [CrossRef]
33. Yarnpakdee S, Senphan T, Karnjanapratum S, Jaisan C, Wangtueai S. Structural characterization and antibacterial activity of pearl oyster (Pinctada maxima) shell as affected by calcination temperature. J Agric Food Res. 2025;19:101551. doi:10.1016/j.jafr.2024.101551. [Google Scholar] [CrossRef]
34. Huang YF, Lee YT, Chiueh PT, Lo SL. Microwave calcination of waste oyster shells for CO2 capture. Energy Proc. 2018;152:1242–7. doi:10.1016/j.egypro.2018.09.176. [Google Scholar] [CrossRef]
35. Zhang Z, Omine K, Li C, Shi S, Oye FS. Improvement effects of treating with calcined oyster shell and carbonized cow dung compost on clay with high water content. Case Stud Constr Mater. 2022;17:e01654. doi:10.1016/j.cscm.2022.e01654. [Google Scholar] [CrossRef]
36. ASTM C114-18. Standard test methods for chemical analysis of hydraulic cement. West Conshohocken, PA, USA: ASTM International; 2018. [Google Scholar]
37. ASTM C187-23. Standard test method for amount of water required for normal consistency of hydraulic cement paste. West Conshohocken, PA, USA: ASTM International; 2023. [Google Scholar]
38. ASTM C109/C109M-21. Standard test method for compressive strength of hydraulic cement mortars (Using 2-in. or Cube Specimens). West Conshohocken, PA, USA: ASTM International; 2021. [Google Scholar]
39. Bunyamin B, Mukhlis A. Utilization of oyster shells as a substitute part of cement and fine aggregate in the compressive strength of concrete. Aceh Int J Sci Technol. 2020;9(3):150–6. doi:10.13170/aijst.9.3.17761. [Google Scholar] [CrossRef]
40. Bunyamin B, Munirwan RP, Ridha M, Hendrifa N. Utilization of wood processing dust as a substitute for a part of cement in concrete. IOP Conf Ser Earth Environ Sci. 2021;1087(1):012004. doi:10.1088/1757-899X/1087/1/012004. [Google Scholar] [CrossRef]
41. Tongwanichniyom S, Pattamapitoon T, Sangvichien N, Phornphisutthimas S. Production of calcium oxide from waste oyster shells for a value-added application of antibacteria. Ecol Environ Conserv. 2021;27:539–49. [Google Scholar]
42. Li G, Xu X, Chen E, Fan J, Xiong G. Properties of cement-based bricks with oyster-shells ash. J Clean Prod. 2015;91:279–87. doi:10.1016/j.jclepro.2014.12.023. [Google Scholar] [CrossRef]
43. Moon DH, Park JW, Cheong KH, Hyun S, Koutsospyros A, Park JH, et al. Stabilization of lead and copper contaminated firing range soil using calcined oyster shells and fly ash. Environ Geochem Health. 2013;35(6):705–14. doi:10.1007/s10653-013-9528-9. [Google Scholar] [PubMed] [CrossRef]
44. Hu SL, Mo LZ, Zhang PJ. Study on the development of an oyster shell-based clarifier for enhancing sugar industry processes. Sugar Technol. 2025;27(2):328–39. doi:10.1007/s12355-024-01505-x. [Google Scholar] [CrossRef]
45. Hasan M, Saidi T, Husaini H. Properties and microstructure of composite cement paste with diatomaceous earth powder (DEP) from Aceh Besar district, Indonesia. Asia-Pac J Sci Technol. 2021;27(1):27. [Google Scholar]
46. Ubachukwu OA, Okafor FO. Towards green concrete: response of oyster shell powder-cement concrete to splitting tensile load. Niger J Technol. 2020;39(2):363–8. doi:10.4314/njt.v39i2.6. [Google Scholar] [CrossRef]
47. Ephraim ME, ThankGod O, Gbinu K. Performance of high strength concrete using oyster shell ash as partial replacement for cement. SSRG Int J Civ Eng. 2019;6(6):33–8. doi:10.14445/23488352/IJCE-V6I6P107. [Google Scholar] [CrossRef]
48. Attah IC, Etim RK, Sani JE. Response of oyster shell ash blended cement concrete in sulphuric acid environment. Civ Environ Res. 2019;11(4):62–74. doi:10.7176/CER/11-4-07. [Google Scholar] [CrossRef]
49. Garad BB, Varghese DV, Paturde EJ. Experimental investigation on partial replacement of cement by oyster shell in concrete. Int J Res Appl Sci Eng Technol. 2019;7(5):3503–8. [Google Scholar]
50. Lertwattanaruk P, Makul N, Siripattarapravat C. Utilization of ground waste seashells in cement mortars for masonry and plastering. J Environ Manage. 2012 Nov 30;111(4):133–141. doi:10.1016/j.jenvman.2012.06.032. [Google Scholar] [PubMed] [CrossRef]
51. Amin M, Kurniasih AK. Pengaruh ukuran dan waktu kalsinasi batu kapur terhadap tingkat perolehan kadar CaO. Pros Semin Nas Sains Mat Inform Dan Apl. 2019;4(1):74–82. (In Indonesian). [Google Scholar]
52. ASTM C188. Standard test method for density of hydraulic cement. West Conshohocken, PA, USA: ASTM International; 2009. [Google Scholar]
53. Arvaniti EC, Juenger MCG, Bernal SA, Duchesne J, Courard L, Leroy S, et al. Determination of particle size, surface area, and shape of supplementary cementitious materials by different techniques. Mater Struct. 2015;48(11):3687–701. doi:10.1617/s11527-014-0431-3. [Google Scholar] [CrossRef]
54. Liao Y, Fan J, Li R, Da B, Chen D, Zhang Y. Influence of the usage of waste oyster shell powder on mechanical properties and durability of mortar. Adv Powder Technol. 2022;33(3):103503. doi:10.1016/j.apt.2022.103503. [Google Scholar] [CrossRef]
55. Liu R, Fan J, Yu X, Zhu Y, Chen D. Properties of mortar containing polyvinyl alcohol pretreated waste oyster shells with various concentrations. Constr Build Mater. 2023;363(6):129879. doi:10.1016/j.conbuildmat.2022.129879. [Google Scholar] [CrossRef]
56. Nasaeng P, Wongsa A, Cheerarot R, Sata V, Chindaprasirt P. Strength enhancement of pumice-based geopolymer paste by incorporating recycled concrete and calcined oyster shell powders. Case Stud Constr Mater. 2022;17(6):e01307. doi:10.1016/j.cscm.2022.e01307. [Google Scholar] [CrossRef]
57. Abinaya S, Venkatesh SP. An effect on oyster shell powder’s mechanical properties in self compacting concrete. Int J Innov Res Sci Eng Technol. 2016;5(6):11785–9. [Google Scholar]
58. Kong J, Cong G, Ni S, Sun J, Guo C, Chen M, et al. Recycling of waste oyster shell and recycled aggregate in the porous ecological concrete used for artificial reefs. Constr Build Mater. 2022;323(4):126447. doi:10.1016/j.conbuildmat.2022.126447. [Google Scholar] [CrossRef]
59. Wang HY, Kuo WT, Lin CC, Po-Yo C. Study of the material properties of fly ash added to oyster cement mortar. Constr Build Mater. 2013;41(10):532–7. doi:10.1016/j.conbuildmat.2012.11.021. [Google Scholar] [CrossRef]
60. Yoon GL, Kim BT, Kim BO, Han SH. Chemical—mechanical characteristics of crushed oyster-shell. Waste Manag. 2003;23(9):825–34. doi:10.1016/s0956-053x(02)00159-9. [Google Scholar] [PubMed] [CrossRef]
61. Jamwal A, Kumar S, Gautam CP. Study of partial replacement of fine aggregate by oyster shell and partial replacement of cement by rice husk ash [dissertation]. Himachal Pradesh, India: Jaypee University of Information Technology; 2019. [Google Scholar]
62. Li Z, Qian J, Qin J, Hua Y, Yue Y, Tang H. Cementitious and hardening properties of magnesia (MgO) under ambient curing conditions. Cem Concr Res. 2023;170(4):107184. doi:10.1016/j.cemconres.2023.107184. [Google Scholar] [CrossRef]
63. Wang L, Chen L, Provis JL, Tsang DCW, Poon CS. Accelerated carbonation of reactive MgO and Portland cement blends under flowing CO2 gas. Cem Concr Compos. 2020;106:103489. doi:10.1016/j.cemconcomp.2019.103489. [Google Scholar] [CrossRef]
64. Liu X, Chen L, Liu A, Wang X. Effect of nano-CaCO3 on properties of cement paste. Energy Proc. 2012;16:991–6. doi:10.1016/j.egypro.2012.01.158. [Google Scholar] [CrossRef]
65. Li S, Yang J, Zhang P. Hydration and hardening properties of reactive magnesia and Portland cement composite. Constr Build Mater. 2022;327(8):126779. doi:10.1016/j.conbuildmat.2022.126779. [Google Scholar] [CrossRef]
66. Etim RK, Attah IC, Bassey OB. Assessment of periwinkle shell ash blended cement concrete in crude oil polluted environment. FUW Trends Sci Technol J. 2017;2(2):879–85. [Google Scholar]
67. Liao Y, Shi H, Zhang S, Da B, Chen D. Particle size effect of oyster shell on mortar: experimental investigation and modeling. Materials. 2021;14(22):6813. doi:10.3390/ma14226813. [Google Scholar] [PubMed] [CrossRef]
68. Wang Y, Lei L, Liu J, Ma Y, Liu Y, Xiao Z, et al. Accelerators for normal concrete: a critical review on hydration, microstructure and properties of cement-based materials. Cem Concr Compos. 2022;134(7):104762. doi:10.1016/j.cemconcomp.2022.104762. [Google Scholar] [CrossRef]
69. Nazari A, Riahi S, Riahi S, Shamekhi SF, Khademno A. Mechanical properties of cement mortar with Al2O3 nanoparticles. J Am Sci. 2010;6(4):94–7. [Google Scholar]
70. Oner A, Akyuz S. An experimental study on optimum usage of GGBS for the compressive strength of concrete. Cem Concr Compos. 2007;29(6):505–14. doi:10.1016/j.cemconcomp.2007.01.001. [Google Scholar] [CrossRef]
71. Bamigboye GO, Nworgu AT, Odetoyan AO, Kareem M, Enabulele DO, Bassey DE. Sustainable use of seashells as binder in concrete production: prospect and challenges. J Build Eng. 2021;34(7):101864. doi:10.1016/j.jobe.2020.101864. [Google Scholar] [CrossRef]
72. Livingston EH. The mean and standard deviation: what does it all mean? J Surg Res. 2004;119(2):117–23. doi:10.1016/j.jss.2004.02.008. [Google Scholar] [PubMed] [CrossRef]
73. Chen D, Pan T, Yu X, Liao Y, Zhao H. Properties of hardened mortars containing crushed waste oyster shells. Environ Eng Sci. 2019;36(9):1079–88. doi:10.1089/ees.2018.0465. [Google Scholar] [CrossRef]
74. Donatello S, Kuenzel C, Palomo A, Fernández-Jiménez A. High temperature resistance of a very high volume fly ash cement paste. Cem Concr Compos. 2014;45(12):234–42. doi:10.1016/j.cemconcomp.2013.09.010. [Google Scholar] [CrossRef]
75. Qixin W. The research of modification on the replacement of mortar to reinforce the gulangyu historical buildings [dissertation]. Xiamen, China: Xiamen University; 2020. [Google Scholar]
76. Arandigoyen M, Alvarez JI. Blended pastes of cement and lime: pore structure and capillary porosity. Appl Surf Sci. 2006;252(23):8077–85. doi:10.1016/j.apsusc.2005.10.019. [Google Scholar] [CrossRef]
77. Wang J, Liu E, Li L. Characterization on the recycling of waste seashells with Portland cement towards sustainable cementitious materials. J Clean Prod. 2019;220:235–52. doi:10.1016/j.jclepro.2019.02.122. [Google Scholar] [CrossRef]
78. Da B, Yu H, Ma H, Tan Y, Mi R, Dou X. Experimental investigation of whole stress-strain curves of coral concrete. Constr Build Mater. 2016;122:81–9. doi:10.1016/j.conbuildmat.2016.06.064. [Google Scholar] [CrossRef]
79. Chen Z, Tang Y, Mai C, Shi J, Xie Y, Hu H. Experimental study on the shear performance of brick masonry strengthened with modified oyster shell ash mortar. Case Stud Constr Mater. 2020;13(65):e00469. doi:10.1016/j.cscm.2020.e00469. [Google Scholar] [CrossRef]
80. Olivia M, Mifshella AA, Darmayanti L. Mechanical properties of seashell concrete. Procedia Eng. 2015;125:760–4. doi:10.1016/j.proeng.2015.11.127. [Google Scholar] [CrossRef]
Cite This Article
 Copyright © 2025 The Author(s). Published by Tech Science Press.
This work is licensed under a Creative Commons Attribution 4.0 International License , which permits unrestricted use, distribution, and reproduction in any medium, provided the original work is properly cited.
 Downloads
 Citation Tools