
 Submit a Paper
 Propose a Special lssue
 Open Access
ARTICLE

Performance Boundaries of Air- and Ground-Coupled GPR for Void Detection in Multilayer Reinforced HSR Tunnel Linings: Simulation and Field Validation
1 Infrastructure Inspection Research Institute, China Academy of Railway Sciences Group Co., Ltd., Beijing, 100081, China
2Yichang Comprehensive Maintenance Section, China Railway Wuhan Bureau Group Co., Ltd., Yichang, 443000, China
3 Engineering Department, China Railway Wuhan Bureau Group Co., Ltd., Wuhan, 430071, China
* Corresponding Author: Yang Lei. Email:
(This article belongs to the Special Issue: AI-Enhanced Low-Altitude Technology Applications in Structural Integrity Evaluation and Safety Management of Transportation Infrastructure Systems)
Structural Durability & Health Monitoring 2025, 19(6), 1657-1679. https://doi.org/10.32604/sdhm.2025.069415
Received 23 June 2025; Accepted 09 September 2025; Issue published 17 November 2025
 View Full Text
 Download PDF
Abstract
Detecting internal defects, particularly voids behind linings, is critical for ensuring the structural integrity of aging high-speed rail (HSR) tunnel networks. While ground-penetrating radar (GPR) is widely employed, systematic quantification of performance boundaries for air-coupled (A-CGPR) and ground-coupled (G-CGPR) systems within the complex electromagnetic environment of multilayer reinforced HSR tunnels remains limited. This study establishes physics-based quantitative performance limits for A-CGPR and G-CGPR through rigorously validated GPRMax finite-difference time-domain (FDTD) simulations and comprehensive field validation over a 300 m operational HSR tunnel section. Key performance metrics were quantified as functions of: (a) detection distance (A-CGPR: 2.0–4.5 m; G-CGPR: ≤0.1 m), (b) antenna frequency (A-CGPR: 300 MHz; G-CGPR: 400/900 MHz), (c) reinforcement configuration (unreinforced, single-layer, multilayer rebar), and (d) void geometry (axial length: 0.1–1.0 m; radial depth: 0.1–0.5 m). Key findings demonstrate: a. A-CGPR (300 MHz): Reliably detects axial voids ≥0.3 m at distances ≤3 m in minimally reinforced (single-layer rebar) linings (field R2 = 0.89). Performance degrades significantly at distances >3 m (>60% signal attenuation at 4.5 m) or under multilayer rebar interference, causing 25%–40% accuracy loss for voids <0.3 m. Optimal distance: 2.0–2.5 m. b. G-CGPR (900 MHz): Achieves <5% size measurement error for axial voids ≥0.1 m and radial voids ≥0.2 m in unreinforced linings. Resolution degrades under multilayer reinforcement due to severe signal attenuation, increasing axial void detection error to 10%–20% for voids ≥0.3 m and constraining radial size measurement. c. Synergistic Framework: A hybrid inspection protocol is proposed, integrating A-CGPR (20 km/h) for rapid large-area screening and targeted G-CGPR (3 km/h) for high-resolution verification of identified anomalies. This framework enhances NDT efficiency while reducing estimated lifecycle inspection costs by 34% compared to G-CGPR alone. This research provides the first physics-derived quantitative detection thresholds for A-CGPR and G-CGPR in multi-rebar HSR tunnels, validated through field-correlated simulations. Future work will focus on multi-frequency antenna arrays and deep learning algorithms to mitigate reinforcement interference. The established performance boundaries and hybrid framework offer critical guidance for optimizing tunnel lining inspection strategies in extensive HSR networks.Keywords
As of 2024, China’s operational high-speed rail (HSR) network exceeds 48,500 km, encompassing over 5200 tunnels totaling nearly 9000 km [1]. The rapid expansion and subsequent aging of this critical infrastructure heighten the urgency of ensuring tunnel structural integrity and operational safety. Due to factors such as material aging, environmental degradation, and construction variability, HSR tunnels are susceptible to various defects, including cracks, voids, leakage, insufficient lining thickness, and spalling. Among these, voids behind linings represent a particularly high-risk defect type, as they can escalate maintenance costs and pose significant safety risks. This underscores the critical need for timely and accurate nondestructive testing (NDT) to maintain structural health and prevent failures.
NDT technologies—including GPR, laser scanning, and ultrasonic methods [2–6]—are essential for defect identification. Among these, GPR offers unique advantages: high resolution, deep penetration, and rapid data acquisition [7,8]. Enhanced by high-resolution cameras and advanced image processing algorithms, visual inspection identifies surface-level defects such as cracks and spalling. Recent advancements in automated image acquisition and machine learning have further improved the precision and efficiency of these inspections [9,10]. However, the capability of visual inspection to detect internal defects remains limited. Laser scanning, which constructs 3D models by measuring laser beam reflection times, provides highly accurate and detailed results but is hindered by high equipment costs. Ultrasonic and impact-echo techniques, which analyze the propagation of acoustic and seismic waves, can identify internal defects [11–13]. Nevertheless, their application is often complicated by material properties, wave paths, and the complexity of data interpretation.
Ground-penetrating radar (GPR) offers a compelling balance of deep penetration, resolution, rapid data acquisition, and nondestructive nature, making it particularly valuable for tunnel inspection in infrastructure projects [14,15].
However, GPR system performance varies critically with coupling method—air-coupled (A-CGPR) or ground-coupled (G-CGPR)—and the specific tunnel environment. A-CGPR facilitates rapid, large-scale inspections due to its larger standoff distance (typically 2–4.5 m), enabling continuous, complete cross-section scanning from vehicle-mounted platforms (Fig. 1a). Conversely, its signal experiences greater attenuation, yielding lower resolution and reduced accuracy for more minor or deeper defects, especially amidst complex reinforcement. G-CGPR operates with minimal standoff (≤0.1 m), minimizing signal loss and providing higher resolution suitable for detailed defect characterization (Fig. 1b). However, its requirement for surface proximity limits scanning speed and efficiency for continuous inspection, and it is more susceptible to surface irregularity noise.
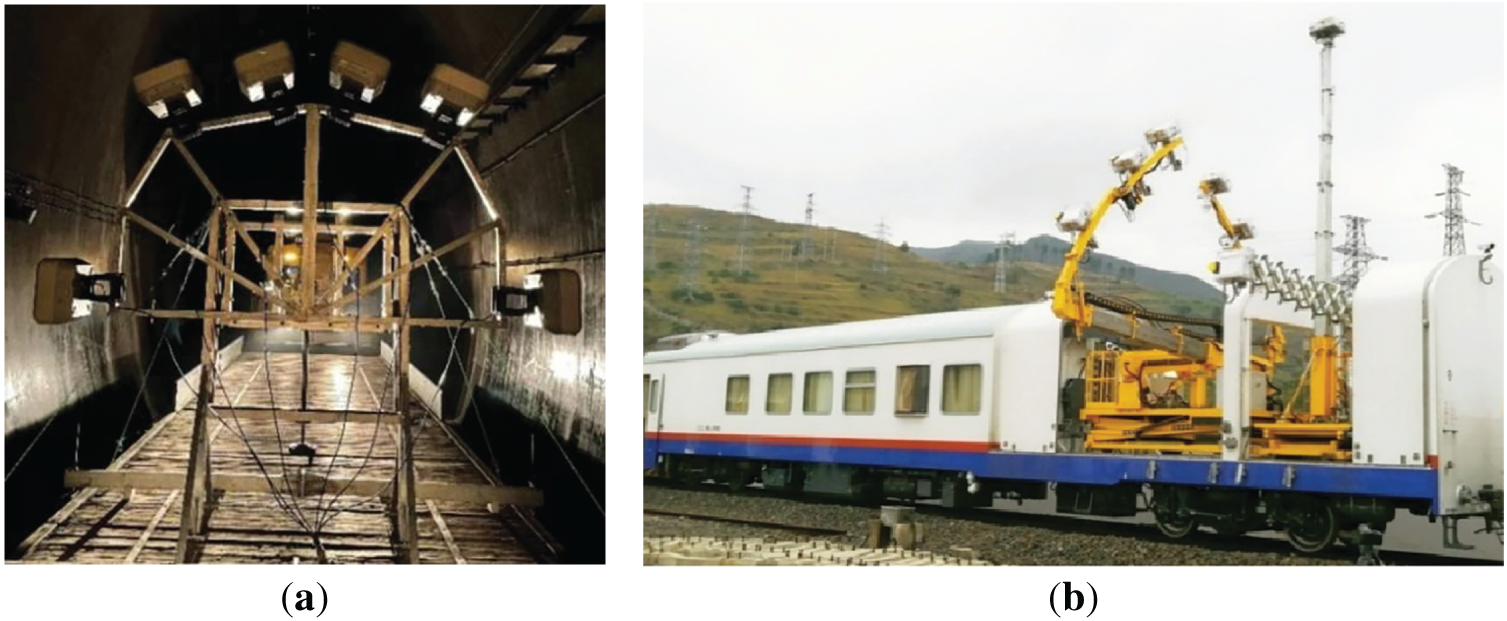
Figure 1: HSR tunnel inspection equipment configurations: (a) Vehicle-mounted A-CGPR antenna group (300 MHz) operating at standoff distances of 2.5–4 m; (b) High-speed rail tunnel inspection vehicle equipped with near-surface G-CGPR system (TR400/900 MHz combination antenna)
Despite their widespread use, systematic, quantitative comparisons defining the performance boundaries of A-CGPR versus G-CGPR—particularly regarding minimum detectable void size, accuracy limits under varying standoff distances, antenna frequencies, and crucially, multilayer reinforcement interference prevalent in HSR tunnels—remain scarce.
Prior studies have largely been empirical [7,8,14], lacking a physics-based foundation to provide generalizable quantitative thresholds. This gap hinders optimization of inspection strategies and development of cost-effective maintenance protocols for extensive HSR networks.
To address this research gap, this study establishes the first physics-based quantitative performance boundaries for A-CGPR and G-CGPR in multilayer reinforced HSR tunnel linings through rigorously validated GPRMax finite-difference time-domain (FDTD) simulations and comprehensive field validation. Unlike empirical GPR studies, this work establishes: (1) physics-based quantitative detection thresholds for multi-rebar HSR tunnels; (2) a cost-optimized hybrid inspection framework; and (3) tight FDTD-validation coupling that directly guides field parameters. This study specifically targets backside voids in linings, a common and high-risk defect type in HSR tunnels. The established performance boundaries and hybrid framework offer critical guidance for optimizing tunnel lining inspection strategies, ultimately enhancing the reliability and safety of HSR infrastructure.
2.1 Model Design and Validation
To evaluate the performance of A-CGPR and G-CGPR systems in detecting structural defects in high-speed rail tunnels, this study established simulation models to assess their detection capabilities and highlight their areas of applicability. The simulation experiments were divided into two phases: (1) analysis of tunnel defects with varying detection distances and axial dimensions at a constant burial depth, and (2) simulation of tunnel defects with varying detection distances and radial dimensions, also at a constant burial depth.
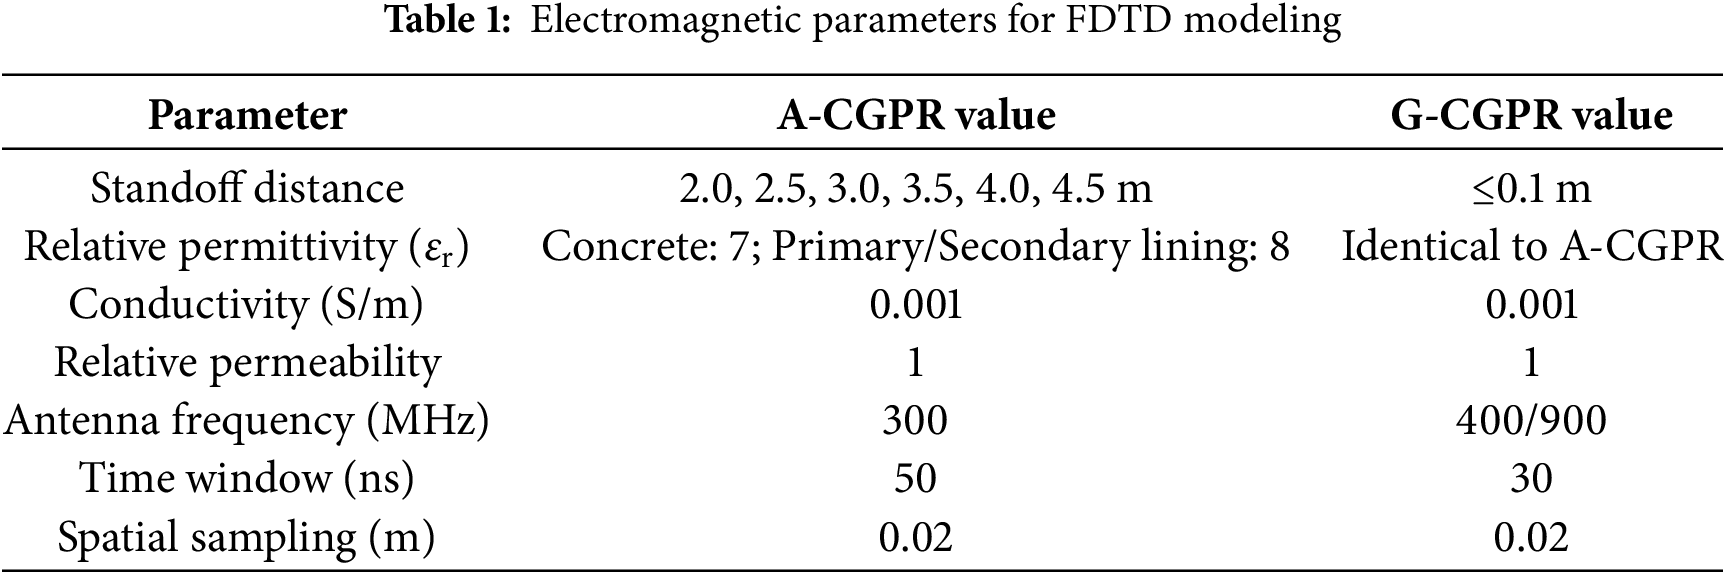
GPRMax, an open-source FDTD software, implemented Yee’s scheme with stringent ±0.5% numerical dispersion control. This enabled high-fidelity GPR wave propagation and reflection simulation, permitting detailed analysis of radar signal responses across diverse materials, geometries, and defect conditions representative of HSR tunnels. Material electromagnetic parameters (Table 1) were rigorously assigned based on measured properties of typical HSR tunnel lining concrete and surrounding rock [16,17], ensuring simulation realism. Maxwell’s equations governing wave propagation were discretized as:
In Eqs. (1) and (2), E and H are electric/magnetic fields, μ is permeability,
The rebar mesh employed a standard HSR tunnel design: diameter 16 mm, spacing 150 mm. Simulations varying spacing (100 mm, 150 mm, 200 mm) revealed that interference reduces by >50% at spacings >200 mm. As practical spacings are typically ≤150 mm, this study simulated the more challenging scenario (150 mm).
Defined “axial” (along tunnel axis) vs. “radial” (depth-wise) dimensions.
2.2.1 Simulation Study of Tunnel Defects with Varying Detection Distances and Axial Dimensions at a Constant Burial Depth
Models (Fig. 2) simulated real-world HSR tunnel geometries. A-CGPR defect detection capability was quantified by analyzing radar image responses across 2.0–4.5 m distances. Considering that most tunnel defects occur at the interface between the lining and the surrounding rock, the simulation model was designed in three layers: an air layer, a composite and concrete lining layer, and a surrounding rock layer. Rectangular voids, with lengths ranging from 0.1 to 1 m, were placed behind the lining to evaluate the impact of detection distance on defect identification. For instance, in the model shown in Fig. 2a, with a detection distance of 2 m, the simulated area measured 17 m × 3.6 m, the antenna was positioned 2 m from the lining surface, the lining thickness was 0.6 m, the surrounding rock layer was 1 m thick, and the time window was set to 50 ns.
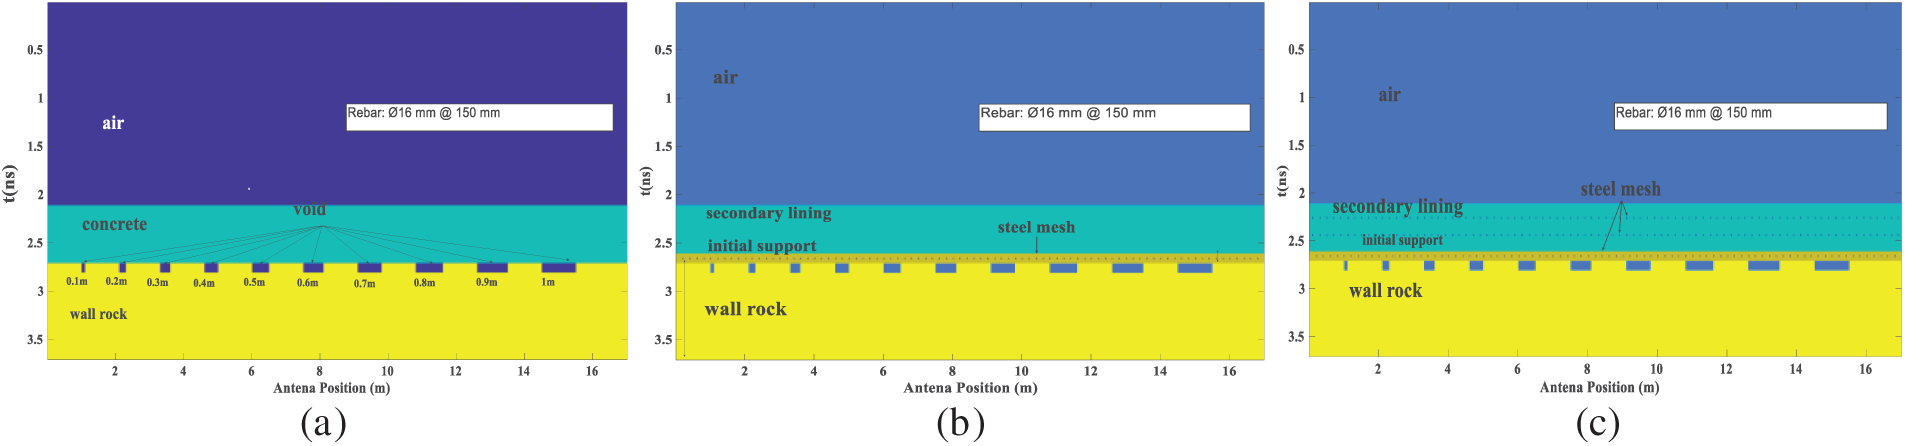
Figure 2: Axial dimension defect detection model for high-speed railway tunnel lining: (a) unreinforced model; (b) single-layer reinforcement model; (c) multilayer reinforcement model
Detection results at a 2 m distance from the lining surface are shown in Fig. 3. As depicted in Fig. 3a, a direct wave was produced at approximately four ns and reached the lining surface around 17 ns. The direct wave was removed to improve the analysis of signals within the lining (Fig. 3b), revealing more distinct reflection information at both the surface and bottom of the lining, especially at the junction between the void and the lining base. The amplitude of the reflected waveform and internal reflections increased significantly. Except for the void with a length of 0.1 m, where the reflection signals are less distinct, all other voids exhibited a clear arc pattern, with more pronounced reflections as the void’s axial dimension increases.
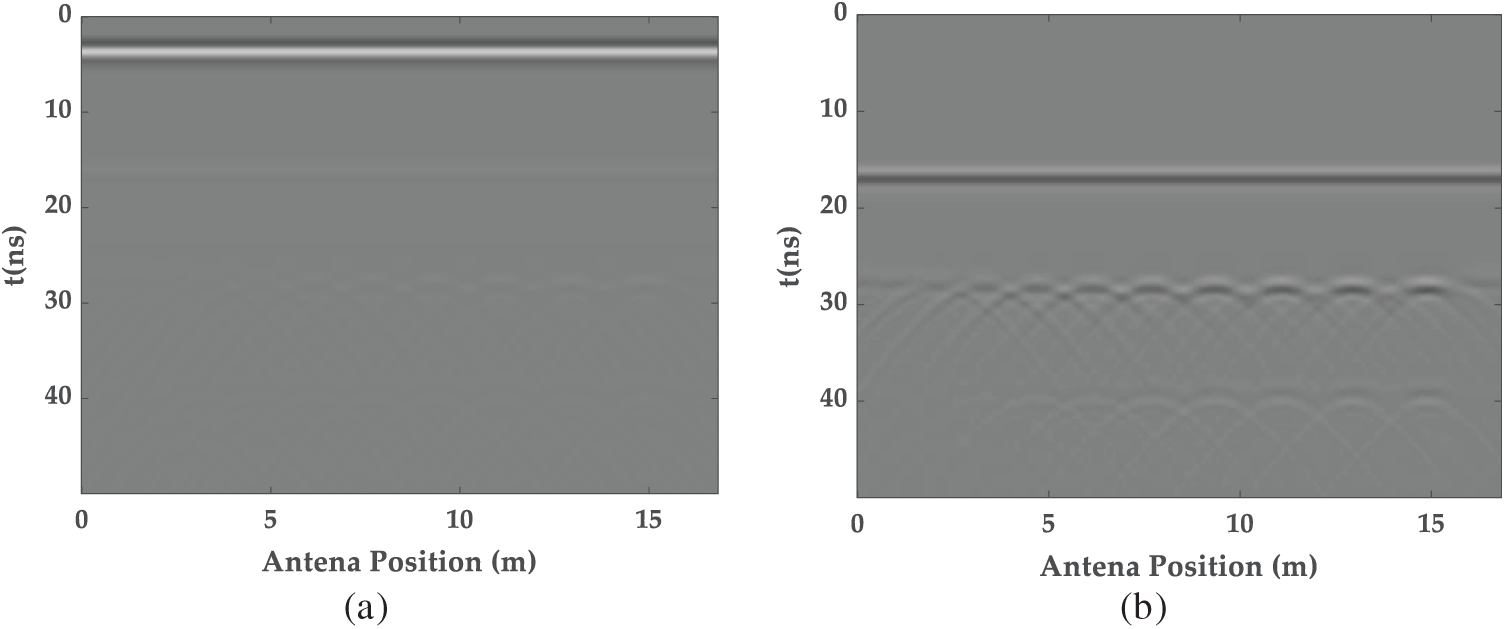
Figure 3: The A-CGPR images at a 2 m detection distance of axial dimension defect detection: (a) the original GPR image; (b) the removed direct wave GPR image
Further analysis of the simulations for all detection distances listed in Table 1 produced radar image response maps for different detection distances, as shown in Fig. 4. The results indicated that, in concrete-lined tunnels, the reflected signals of the lining thickness are visible. However, in composite-lined tunnels with embedded rebar, the accuracy of the detected signals decreased because of interference from the bars. When the detection distance exceeds 3 m, only voids with lengths of 0.3 m or larger can be distinctly detectable. In the presence of rebar, image clarity is further degraded, with increased clutter and multiple reflections complicating defect identification. Despite the reduction in clarity at greater detection distances and the interference caused by rebar mesh, void defects with lengths of 0.3 m or more remain identifiable. These findings suggested that although A-CGPR can detect tunnel lining defects, its detection accuracy is significantly affected by the detection distance and the presence of internal steel reinforcement.
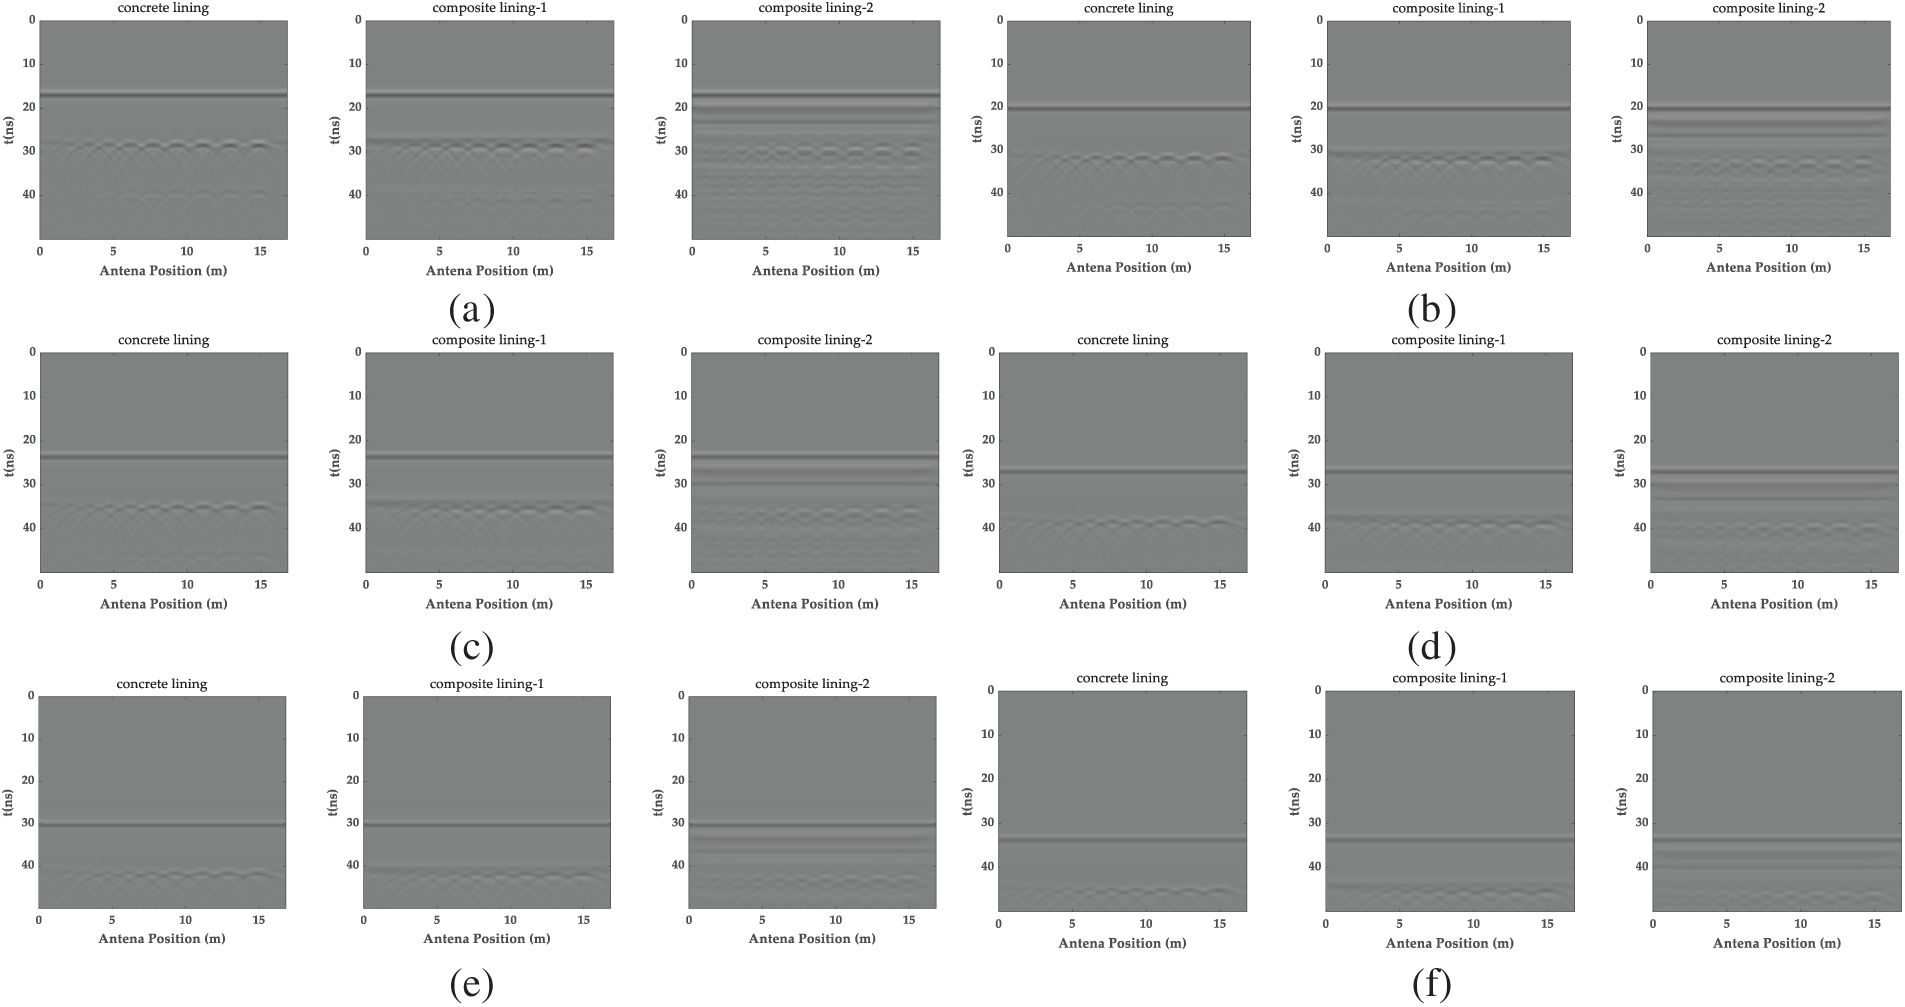
Figure 4: The A-CGPR images at different detection distances and axial dimensions: (a) the GPR images at 2 m detection distance; (b) The GPR images at 2.5 m detection distance; (c) The GPR images at 3 m detection distance; (d) The GPR images at 3.5 m detection distance; (e) The GPR images at 4 m detection distance; (f) The GPR images at 4.5 m detection distance
Axial voids (Figs. 3 and 4): Reliable detection of ≥0.3 m voids at distances ≤3 m (R2 = 0.94). Signal attenuation >60% at 4.5 m.
These simulations predict that A-CGPR can reliably identify axial voids ≥0.3 m at standoffs ≤3 m, but performance degrades significantly beyond 3 m or under multilayer rebar. These predictions form specific hypotheses (H1: Detection possible for L ≥ 0.3 m @ d ≤ 3 m; H2: Accuracy decrease >25% for L < 0.3 m or d > 3 m/multi-rebar) to be tested in Section 4.
2.2.2 Simulation Study of Tunnel Defects with Varying Detection Distances and Radial Dimensions at a Constant Burial Depth
To evaluate the capability of A-CGPR in detecting defects of different radial sizes in high-speed railway tunnel linings, radar image responses were analyzed at different detection distances, maintaining a constant burial depth. As depicted in Fig. 5, the simulation model comprised an air layer, a composite and concrete lining layer, and a surrounding rock layer. Rectangular voids with a fixed length of 1 m and varying widths from 0.1 to 0.5 m were positioned behind the lining to study the effect of detection distance on defect identification. For instance, in the model where the detection distance was 2 m, the simulated area spanned 13 m × 6.1 m, with the antenna placed 2 m from the lining surface, a lining thickness of 0.6 m, a surrounding rock thickness of 3.5 m, and a time window of 55 ns.
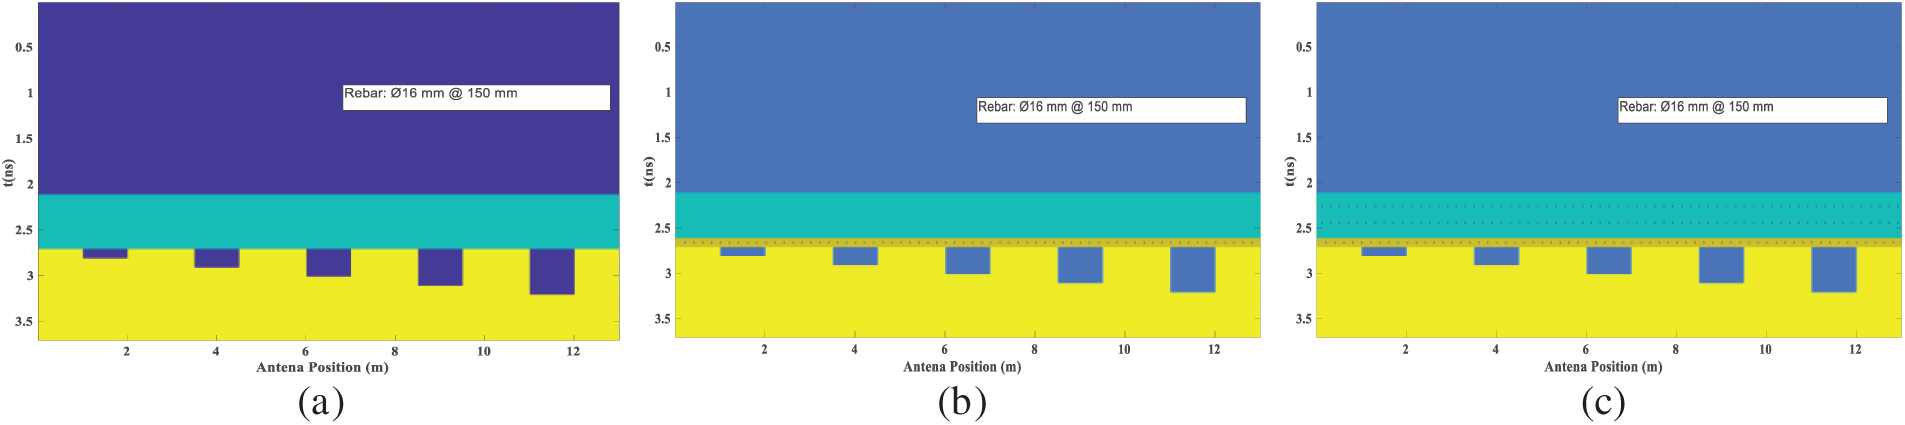
Figure 5: Radial dimension defect detection model for high-speed railway tunnel lining: (a) unreinforced model; (b) single-layer reinforcement model; (c) multilayer reinforcement model
After removing the direct wave, the radar image in Fig. 6 captured the void signals, with reflections from the upper and lower void interfaces becoming increasingly distinct as the void’s radial dimension grew. The upper and lower interface reflections are easily detectable once the void’s radial size reaches 0.3 m. This indicates that the 300 MHz air-coupled antenna can effectively identify voids with radial depths of 0.3 m or larger, providing a reliable foundation for further quantitative analysis.
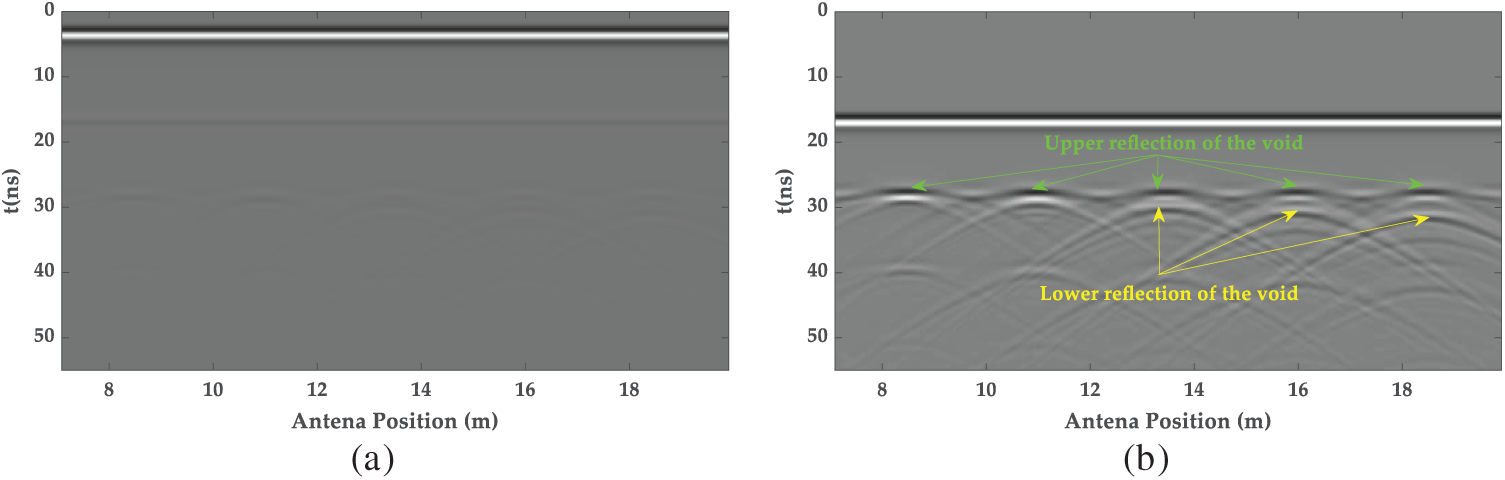
Figure 6: The GPR images at a 2 m detection distance of radial dimension defect detection: (a) the original GPR image; (b) the removed direct wave GPR image
Furthermore, radar images of three tunnel models were generated at detection distances ranging from 2 to 4.5 m (Fig. 7). The results demonstrated that, at the same detection distance, reflections in concrete-lined tunnels remain clear with minimal interference, allowing for easy differentiation between the upper and lower void interface reflections for voids with radial depths of 0.3 m or greater. Similar results were observed in composite-lined tunnels without multiple reinforcing bar layers, although some interference from the reinforcing mesh of the initial support was present. In contrast, composite-lined tunnels with internal and external reinforcing steel mesh exhibited significantly more clutter due to the multiple mesh layers, reducing the clarity of void reflection signals. This made distinguishing the upper and lower interface reflections challenging, lowering detection accuracy.
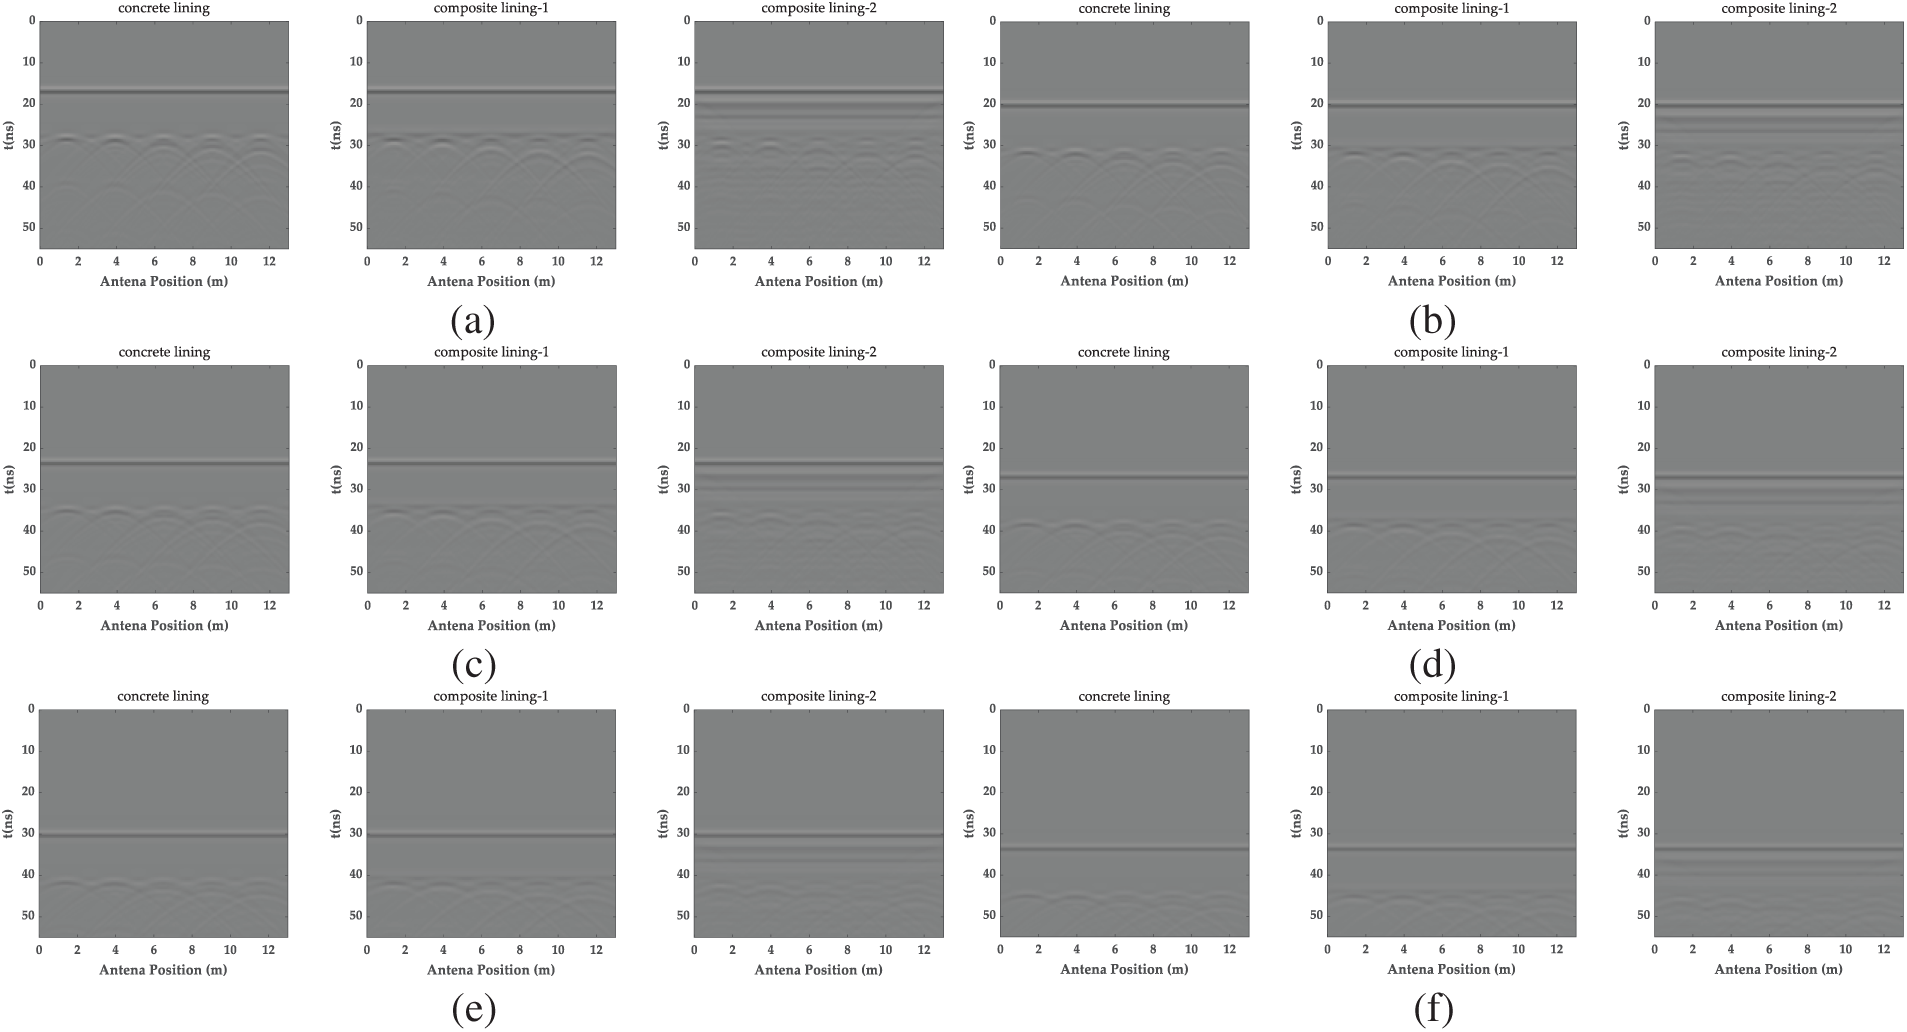
Figure 7: The A-CGPR images at different detection distances and radial dimensions: (a) the GPR images at 2 m detection distance; (b) the GPR images at 2.5 m detection distance; (c) the GPR images at 3 m detection distance; (d) the GPR images at 3.5 m detection distance; (e) the GPR images at 4 m detection distance; (f) the GPR images at 4.5 m detection distance
It revealed that the radar signal reflection intensity gradually decreased as the detection distance increased. At the maximum detection distance of 4.5 m, signal clarity diminished significantly, making voids identifiable only in general, with precise size determination increasingly challenging. These results highlighted the limitations of A-CGPR in long-distance detection, particularly in composite-reinforced concrete linings where signal attenuation and interference from reinforcement significantly impair defect recognition.
Simulations (Figs. 5–7) indicate A-CGPR requires radial voids ≥0.3 m for detection, with accuracy declining 25–40% under multilayer rebar. This establishes testable hypothesis H3 for field validation.
2.3.1 Simulation Study of Tunnel Defects with Varying Detection Distances and Axial Dimensions at a Constant Burial Depth
The effectiveness of simulated G-CGPR was evaluated by detecting tunnel lining defects of varying axial dimensions, all at the same burial depth. Like the A-CGPR model described in Fig. 2, the G-CGPR simulation retained the same geometric layout and material parameters. The significant difference is that the G-CGPR antenna was positioned closer to the lining surface, and this study emphasized the influence of different center frequencies on defect identification. For example, a center frequency of 400 MHz was used, and the simulation was conducted within a 30 ns time window to analyze the radar image response characteristics of the tunnel lining.
As illustrated in Fig. 8, the simulation results confirmed that G-CGPR can detect void defects in high-speed rail (HSR) tunnel linings effectively. The radar images clearly showed the void signals for all tested void lengths, demonstrating G-CGPR’s strong capability for detecting structural defects in tunnel linings. These results provided a robust theoretical foundation for applying G-CGPR in practical tunnel inspections.
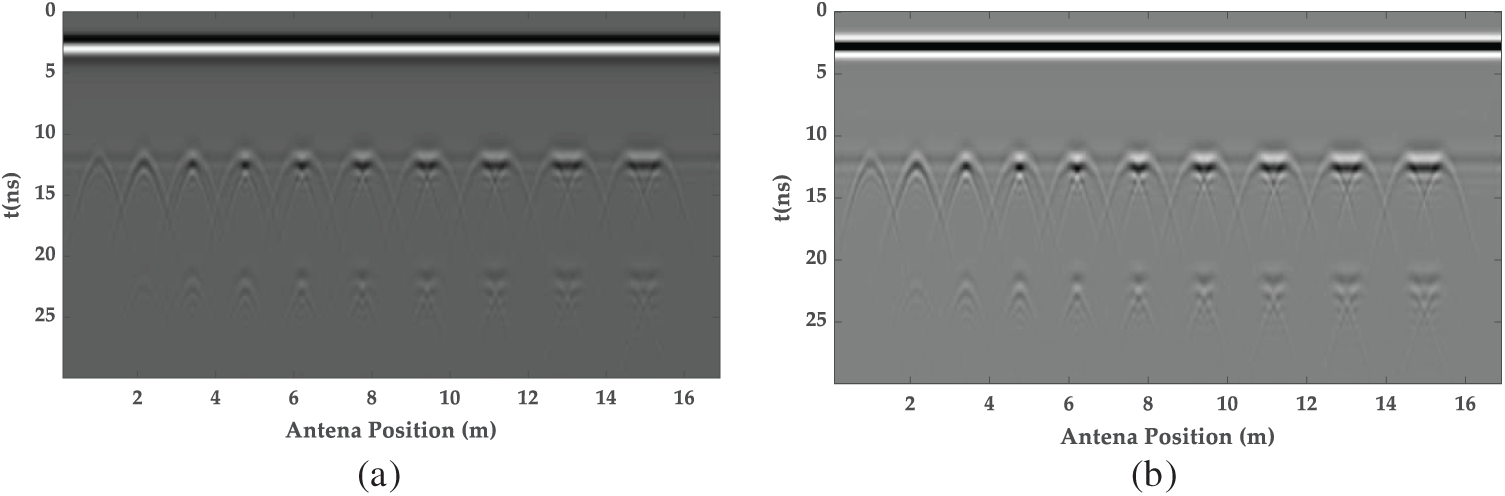
Figure 8: The G-CGPR images of axial dimension defect detection: (a) the original GPR image; (b) the removed direct wave GPR image
Additionally, the other simulations were carried out using three tunnel models with G-CGPR at center frequencies of 400 and 900 MHz to evaluate the radargram response characteristics of defects with varying axial dimensions. As depicted in Fig. 9, the 400 MHz antenna accurately detected reflection signals for voids of all lengths. However, in composite liners featuring steel reinforcement mesh, the clarity of reflections from the bottom was significantly reduced due to interference from the reinforcement. This issue was especially evident for the 0.1 m difficult-to-distinguish void, although the voids of other lengths remain identifiable.
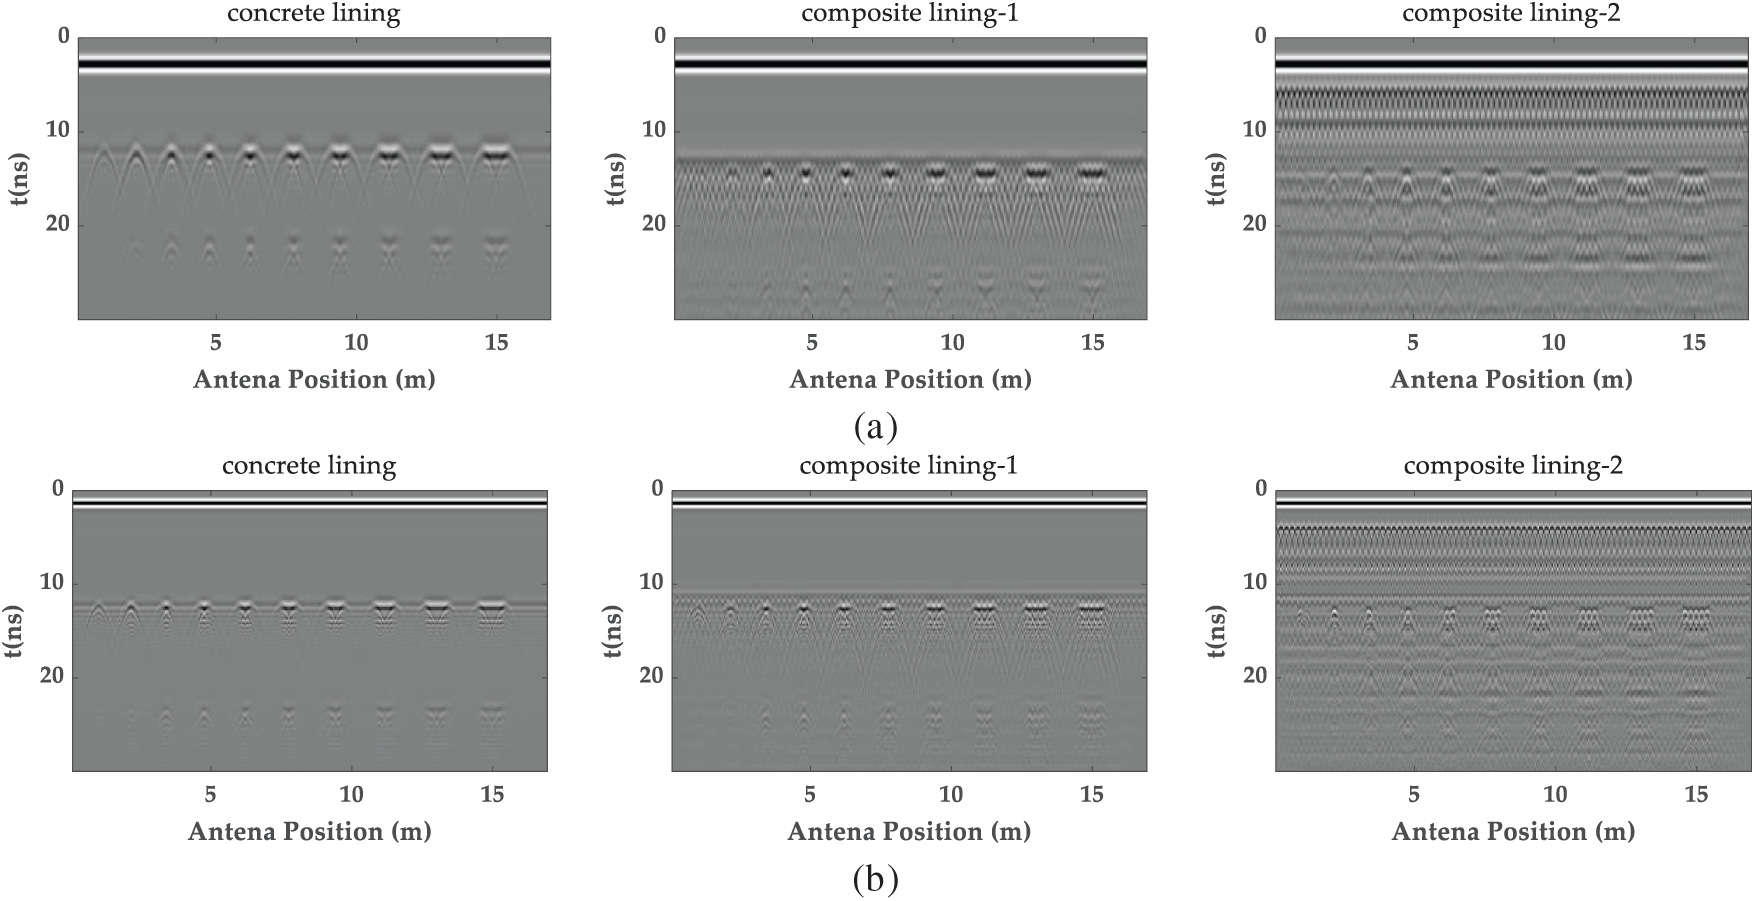
Figure 9: The G-CGPR images at different axial dimensions: (a) the G-CGPR images of a 400 MHz antenna; (b) the G-CGPR images of a 900 MHz antenna
The 900 MHz antenna not only replicated the detection capability of the 400 MHz antenna but also showed a marked improvement in signal resolution. Void signals for all tested models were identifiable with the 900 MHz antenna. Moreover, as the void length and center frequency increased, the clarity of void length information in the radar images progressively improved, enhancing measurement accuracy.
This comparison emphasized that both frequencies effectively detect defects; however, the 900 MHz antenna enables a superior resolution and accuracy, particularly in environments complicated by steel reinforcement interference.
Axial voids (Figs. 8 and 9): G-CGPR (900 MHz) simulations predict detection of axial voids ≥0.1 m with <5% error in unreinforced linings, degrading to 10%–20% error under multilayer rebar. Hypotheses H4 (Min size) and H5 (Error increase) are defined for field testing.
2.3.2 Simulation Study of Tunnel Defects with Varying Detection Distances and Radial Dimensions at a Constant Burial Depth
The ability of G-CGPR to detect tunnel lining defects of varying radial dimensions was investigated at a constant burial depth. Like the A-CGPR simulation model shown in Fig. 5, the G-CGPR simulation retained the same geometric layout and material parameters. However, this analysis concentrated on the effect of different center frequencies on detecting longitudinal defects, with the antenna positioned close to the lining surface. For instance, a center frequency of 400 MHz was selected, and the simulation was performed using a 30 ns time window to analyze the radar response characteristics of longitudinal depth in the tunnel lining.
As illustrated in Fig. 10, the radar image captured the void signals. As the radial size of the void increases, the separation between the upper and lower interface reflections becomes more pronounced. The upper and lower interface reflection signals were visible when the void’s radial size reached 0.2 m. However, multiple reflection signals introduced some errors in the quantitative measurement of the void’s radial size. This suggested that the 400 MHz ground-coupled antenna can effectively detect voids with radial dimensions of 0.2 m or greater. However, multiple reflections complicate the accurate measurement of larger defects. Nonetheless, the results will provide a solid basis for further quantitative analysis.
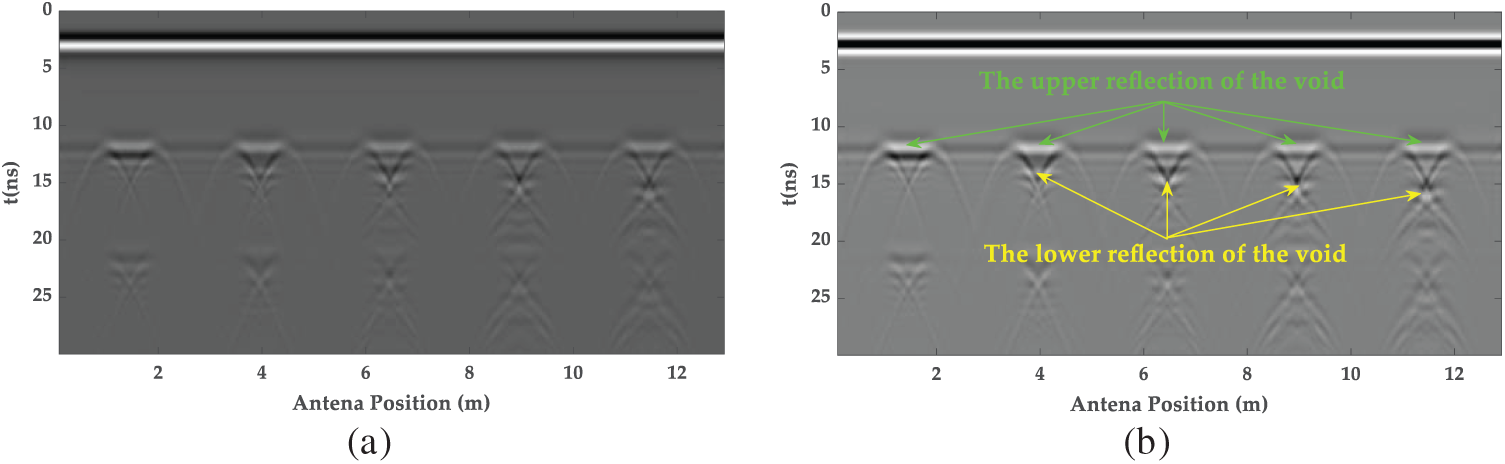
Figure 10: The G-CGPR images of radial dimension defect detection: (a) the original GPR image; (b) the removed direct wave GPR image
To assess the effects of different frequencies on the detection of radial-size defects in three high-speed rail tunnel models, further simulations were performed using center frequencies of 400 and 900 MHz. As illustrated in Fig. 11, with the 400 MHz antenna, reflection signals from the bottom interface of the concrete-lined tunnel were clear, enabling the effective identification of voids with radial dimensions of 0.2 m or larger. However, multiple reflection signals introduced errors in the length measurement. In composite linings with rebar mesh, interference from the rebar significantly reduced the clarity of the bottom reflection signal, making it challenging to identify the void’s radial dimensions accurately.
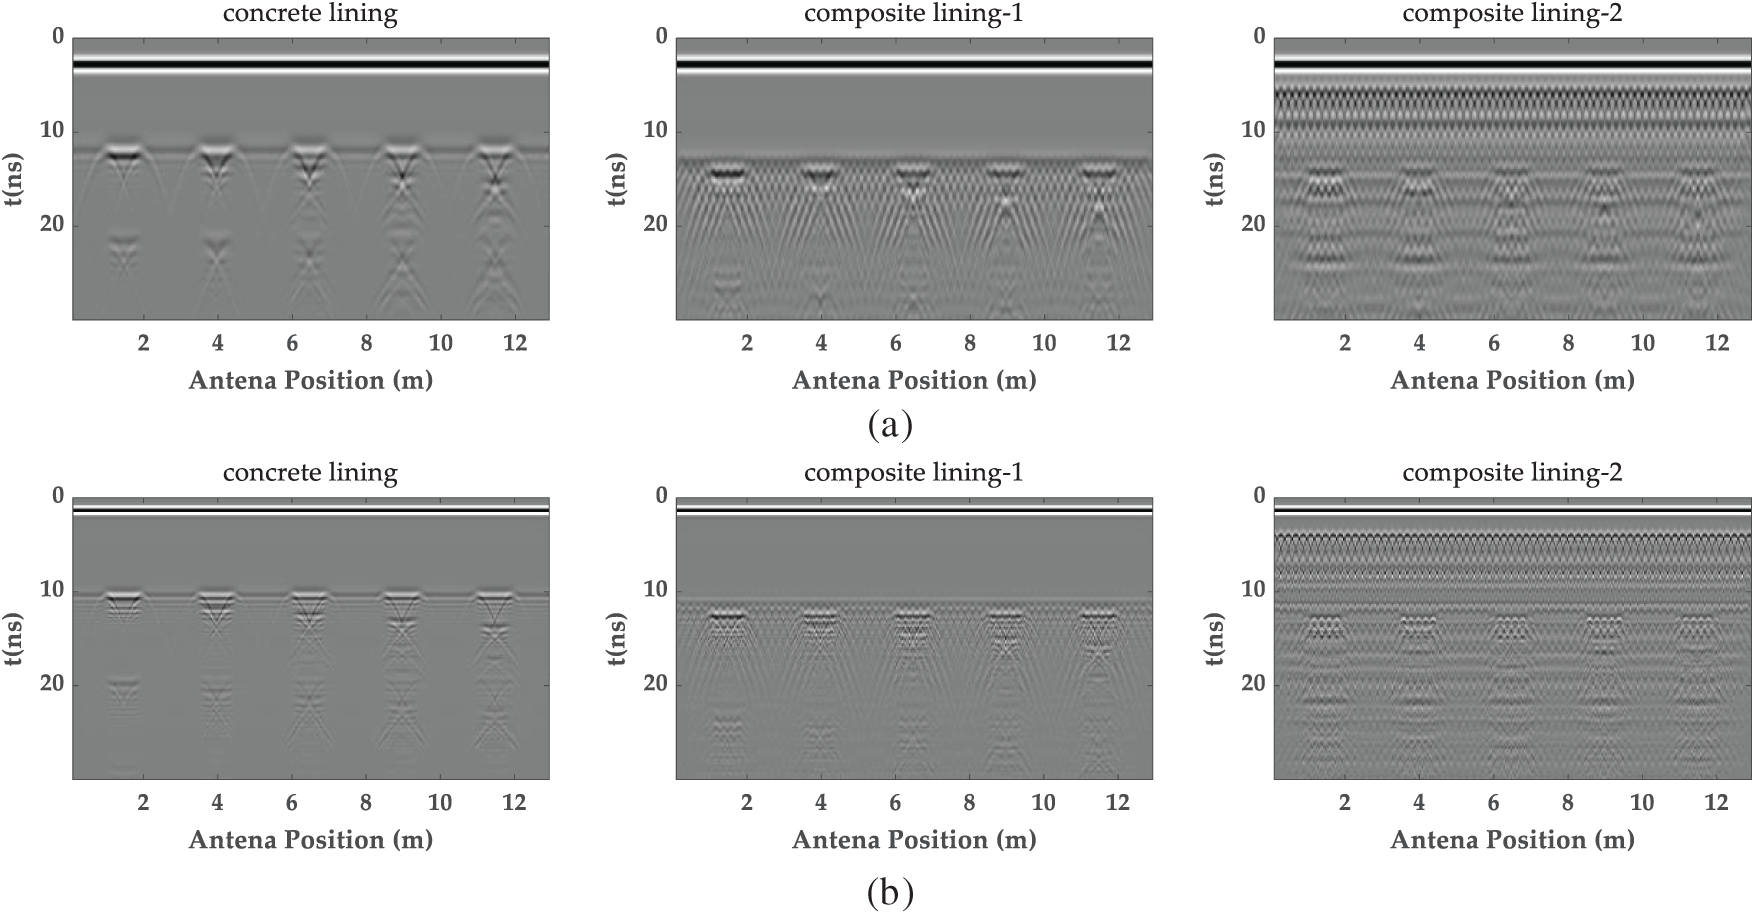
Figure 11: The G-CGPR images at different radial dimensions: (a) the G-CGPR images of a 400 MHz antenna; (b) the G-CGPR images of a 900 MHz antenna
The 900 MHz antenna maintained clear reflection signals from both the top and bottom interfaces of the void in concrete-lined tunnels by its higher signal resolution, although multiple reflections increased. However, as the quantity of reinforcing mesh increased, the reflection signals became progressively blurred, particularly in tunnels with various mesh layers, where reflections from upper and lower sides became tricky to discriminate. These findings suggested that while higher frequencies improved defect recognition in unreinforced structures, reinforcing mesh severely limited signal penetration and impaired defect identification.
Radial voids (Figs. 10 and 11): G-CGPR (900 MHz) simulations indicate detection of radial voids ≥0.2 m is possible, though measurement accuracy is constrained by multiple reflections and severely limited under multilayer rebar. Hypothesis H6 (Min radial size) is established.
As demonstrated in Fig. 12, in unreinforced concrete linings, A-CGPR is more effective at detecting larger voids (≥0.3 m), particularly at a detection distance of 2 m, with errors ranging from 10% to 20%. However, as the detection distance increased to 4.5 m, the error range rose to 25%–35%. In comparison, G-CGPR, particularly at 900 MHz, showed a greater performance, maintaining errors within 10% for all voids ≥0.3 m and reducing errors to below 5% for voids ≥0.5 m.
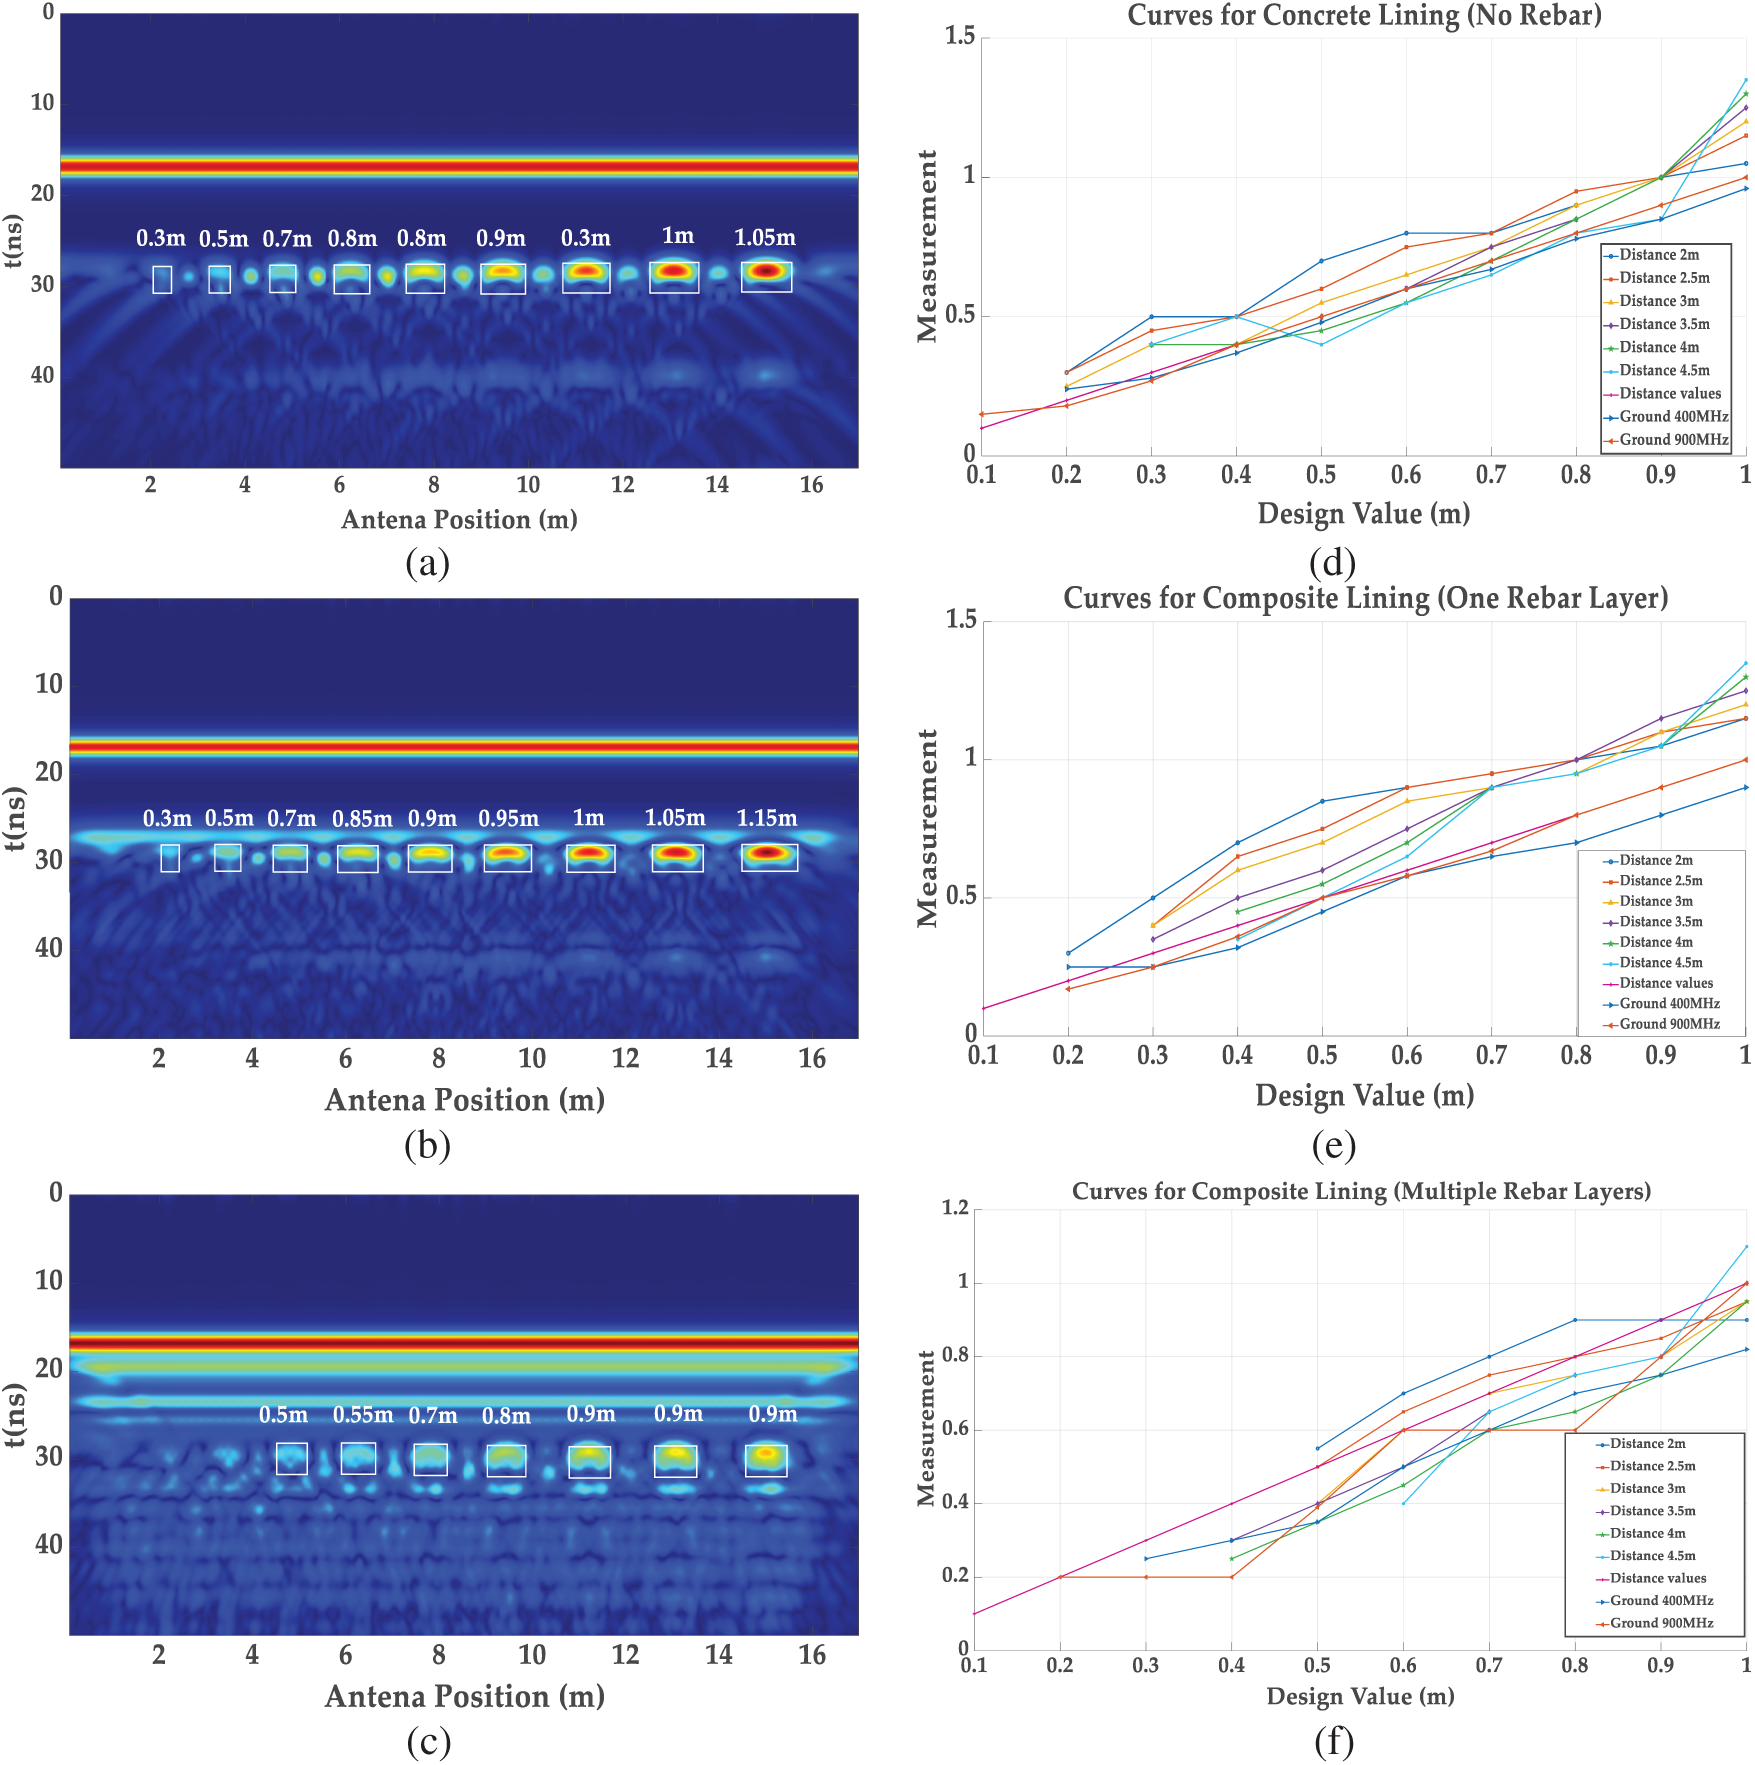
Figure 12: Hilbert imaging and axial defect size statistics for A-CGPR: (a) Hilbert image of unreinforced model at h = 2 m; (b) Hilbert image of single-layer rebar model at h = 2 m; (c) Hilbert image of multilayer rebar model at h = 2 m; (d) axial size statistics curves of the unreinforced model; (e) axial size statistics curves of the single-layer rebar model; (f) axial size statistics curves of the multilayer rebar model. Note: The Hilbert transform extracts the signal envelope, enhancing the visibility of reflection features at void boundaries and improving defect identifiability.
A-CGPR performance degradation was observed at distances ≥4 m in composite linings with single-layer reinforcement with 30%–35% errors. Conversely, G-CGPR remained stable at 900 MHz, with errors ranging from 5% to 15%, and detection errors for voids ≥0.5 m generally stay below 10%.
For composite linings reinforced in both the primary and secondary layers, A-CGPR demonstrated substantial limitations. It struggled to identify voids smaller than 0.3 m in multilayer reinforced linings, with a maximum detection error of 40%. By comparison, G-CGPR at 900 MHz consistently achieved 10%–20% errors for voids ≥0.3 m and below 10% for voids ≥0.5 m.
In summary, A-CGPR served as an effective tool for scanning large areas in unreinforced or minimally reinforced environments, offering reasonable accuracy in detecting larger voids (≥0.3 m) (at distances ≤3 m, R2 = 0.94 from Fig. 12f). However, its performance diminished in complex structures or with more minor defects attributed to signal attenuation and interference from reinforcement. Conversely, G-CGPR, particularly at 900 MHz, offered higher accuracy in complex structures, making it preferable for high-precision detection in composite-lined tunnels (Table 2).
Errors represent simulated dimensional measurement inaccuracy. Field validation follows in Section 4.
The quantified performance boundaries summarized in Table 2, derived from simulation, establish concrete thresholds (minimum detectable size, expected error ranges under defined conditions) that will be evaluated against field measurements in Section 4.
The detection performance of A-CGPR and G-CGPR for voids of varying radial dimensions was evaluated in the same three tunnel lining structures. Fig. 13 shows the single-channel instantaneous amplitude signals of A-CGPR at a detection distance of 2 m for voids in the three tunnel types. The analysis revealed that when the radial size reached 0.3 m, the reflection signals began to separate from the top and bottom, allowing for radial size estimation. However, as reinforcement layers increased, interference and measurement errors rose. Based on these observations, a statistical and quantitative analysis was performed for the radial detection capabilities of both radar systems across different lining types.
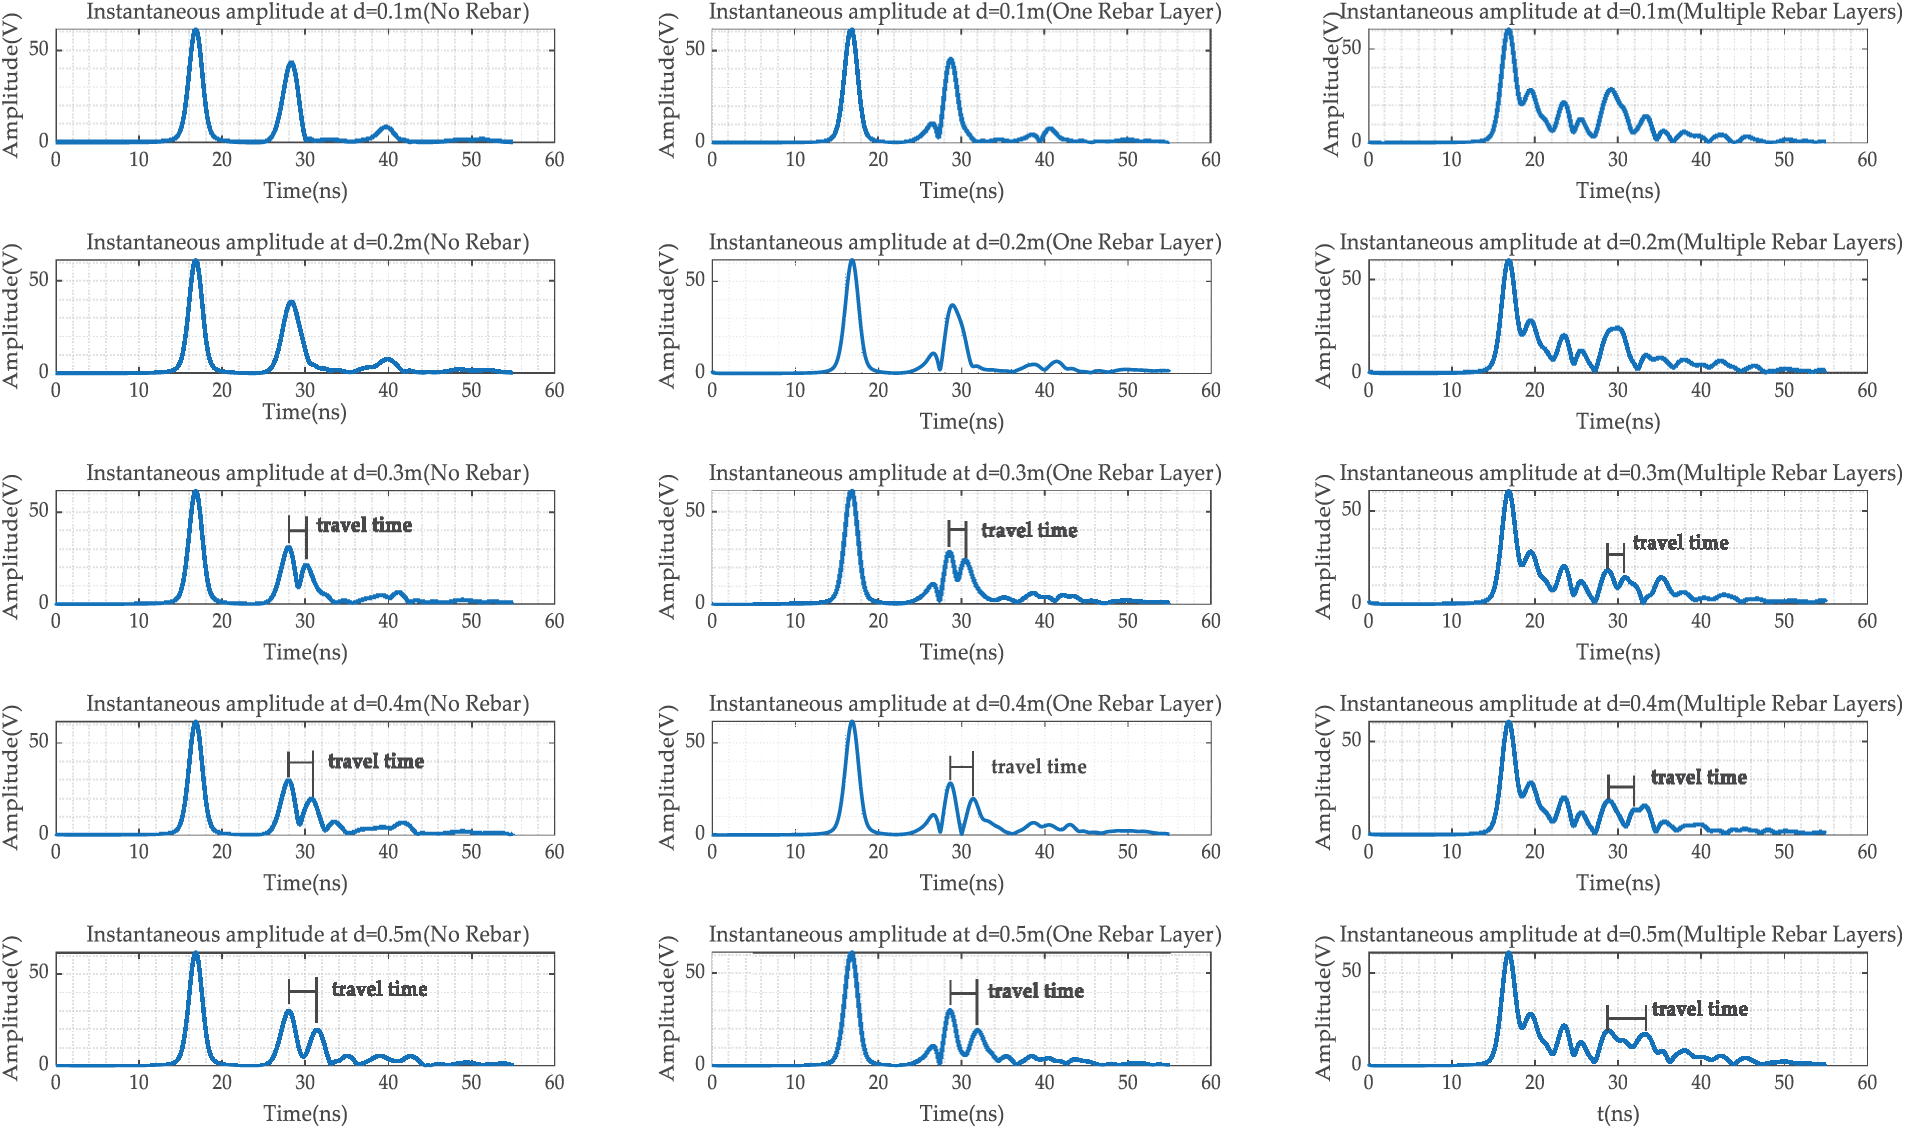
Figure 13: Instantaneous amplitude signals of A-CGPR for unreinforced model at 2 m
A-CGPR performed well for voids ≥0.3 m in unreinforced linings, with errors ranging from 2% to 3.3% at a 2 m detection distance, increasing to 4%–6.7% at 4.5 m, as shown in Fig. 14. In structures reinforced only in the initial support, errors for voids between 0.3 and 0.5 m at distances of 2 to 4 m ranged from 3.3% to 6.7%, rising to 10%–20% at 4.5 m. However, in multilayer reinforced linings, errors for voids between 0.3 and 0.5 m at distances of 2 to 4 m ranged from 10% to 38%, with detection accuracy at 4.5 m severely reduced, making it challenging to quantify radial dimensions accurately.
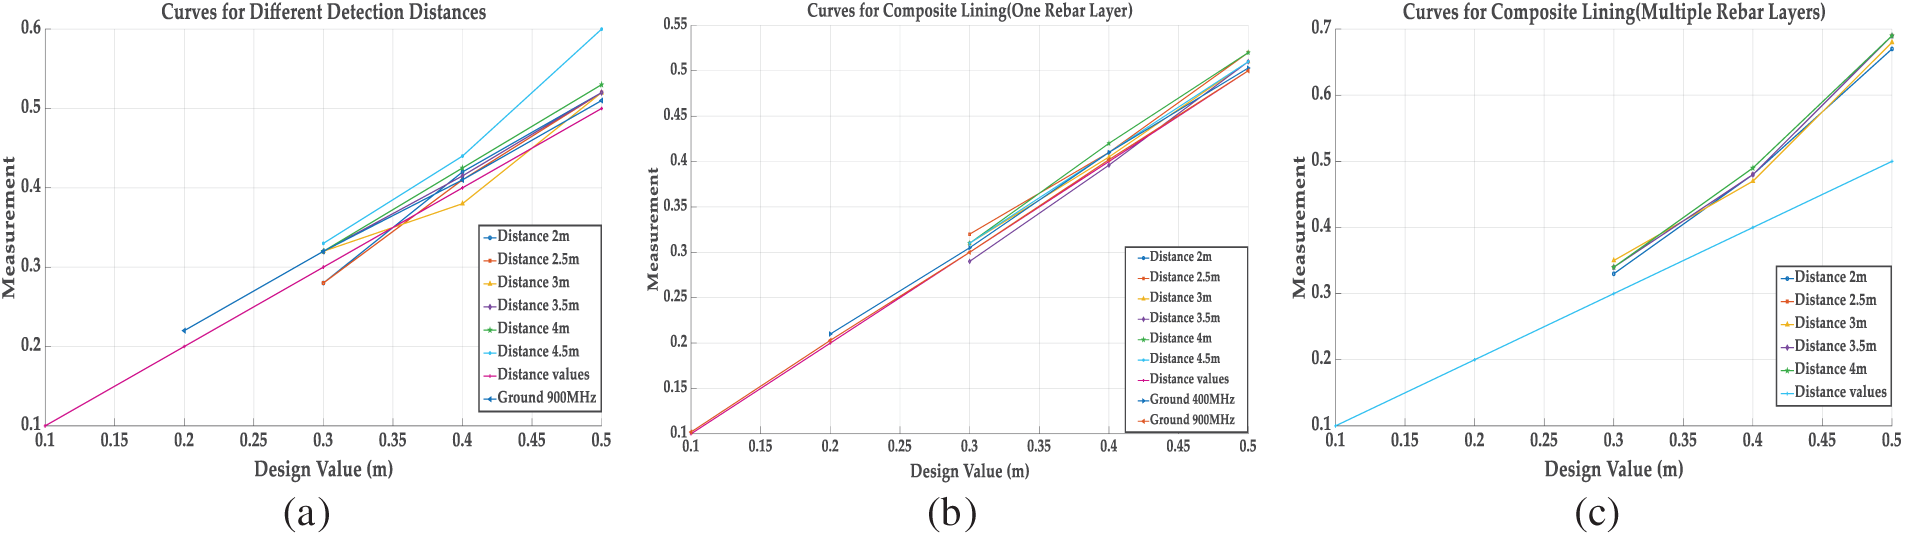
Figure 14: Radial size statistics curves: (a) no reinforcement model statistical curves; (b) single-layer rebar model statistical curves; (c) multilayer rebar model statistical curves
Compared to A-CGPR, G-CGPR performed well in simpler structures, with a maximum error of just 2% for voids between 0.1 and 0.5 m in unreinforced linings at 900 MHz. For voids between 0.2 and 0.5 m in structures with reinforcement only in the initial support, errors ranged from 2% to 10%. At 400 MHz, detection errors for voids ≥0.2 m in unreinforced environments ranged from 0.6% to 5%. However, both radar systems faced difficulty detecting voids smaller than 0.3 m in multilayer reinforced linings. Even though the overall performance of G-CGPR exceeded A-CGPR, its limitations remained in detecting defects in composite-lined tunnels.
In summary, during rapid A-CGPR scanning, regions where reflected signal amplitude exceeds twice the mean background noise level (i.e., SNR > 6 dB) are flagged as Anomaly Regions. G-CGPR subsequently performs precise validation on these regions. A-CGPR showed great ability to detect larger radial voids (≥0.3 m), particularly in composite-lined tunnels, whereas G-CGPR was more effective for high-precision detection in simpler structures. Both systems face difficulties in multilayer reinforced environments. Still, each system has its advantages, so choosing the appropriate radar system based on the specific application scenario is essential.
Field testing was conducted on a 300 m section of an operational HSR tunnel in Central China to validate the performance boundaries and quantitative thresholds established by the GPRMax FDTD simulations (Sections 2 and 3). Key parameters were explicitly set based on simulation outcomes: A-CGPR standoff distances (2.0, 2.5, 3.0, 3.5, 4.0, 4.5 m) cover the critical range where simulation predicted significant performance variation; G-CGPR utilized the 900 MHz antenna identified in simulations as optimal; Scanning speeds (A-CGPR: 5–20 km/h; G-CGPR: 3 km/h) reflect operational feasibility within the predicted effective ranges; Target void sizes focused on the critical thresholds (≥0.3 m axial for A-CGPR, ≥0.1 m axial/≥0.2 m radial for G-CGPR). Both systems were mounted on an engineering vehicle featuring a liftable and rotatable scaffolding platform (Fig. 15), enabling controlled-speed scanning. Detailed acquisition parameters for both systems are listed in Table 3, which were derived from simulation-optimized thresholds.
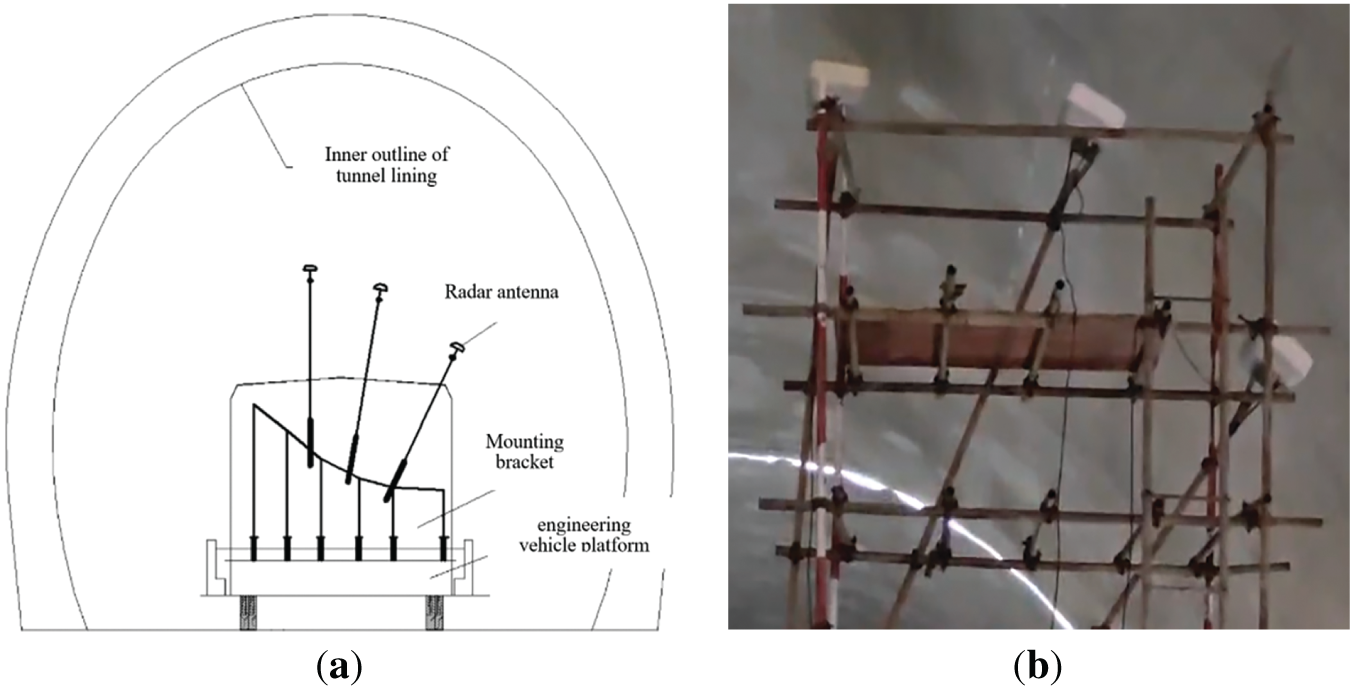
Figure 15: Field test device: (a) operation schematic; (b) field work devices
The tunnel section employs secondary concrete lining, primarily configured with a single layer of reinforcement (rebar diameter: 16 mm, spacing: 150 mm), consistent with the single-layer rebar model in Section 2.2 simulations.
4.2 Data Processing and Analysis
4.2.1 A-CGPR Performance at Constant Distance and Variable Speeds
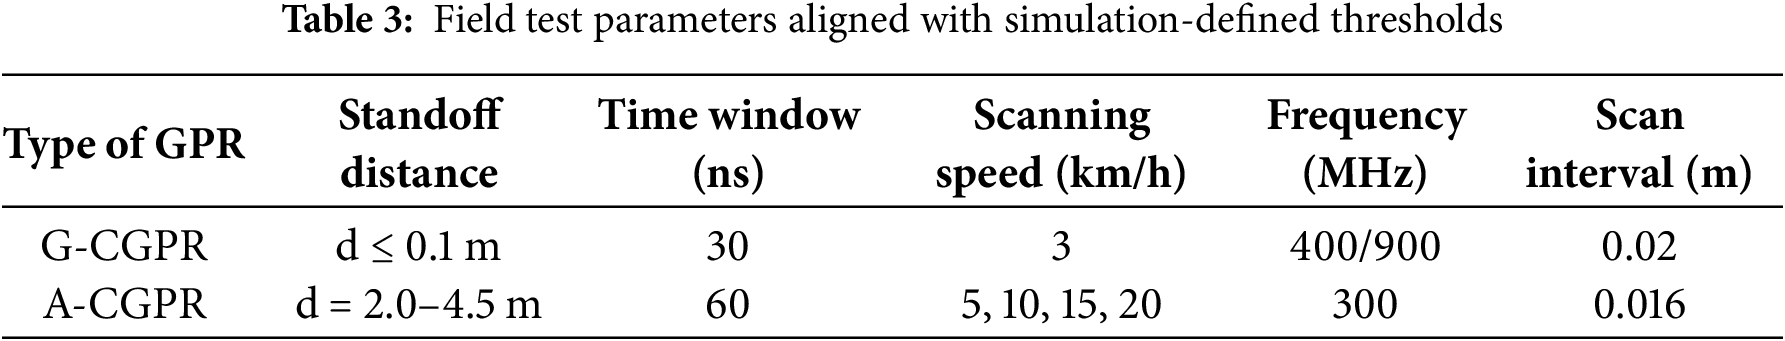
Fig. 16 displays radar images for an antenna detection distance (d) of 2.0 m at scanning speeds of 5, 10, 15, and 20 km/h. The images reveal consistent layer reflection amplitudes and spatial coherence across all tested speeds. Minor positional variations in anomalous reflections occur due to system vibrations and odometer calibration errors. Consequently, A-CGPR data quality remains unaffected within the tested speed range (5–20 km/h) under constant detection distances.
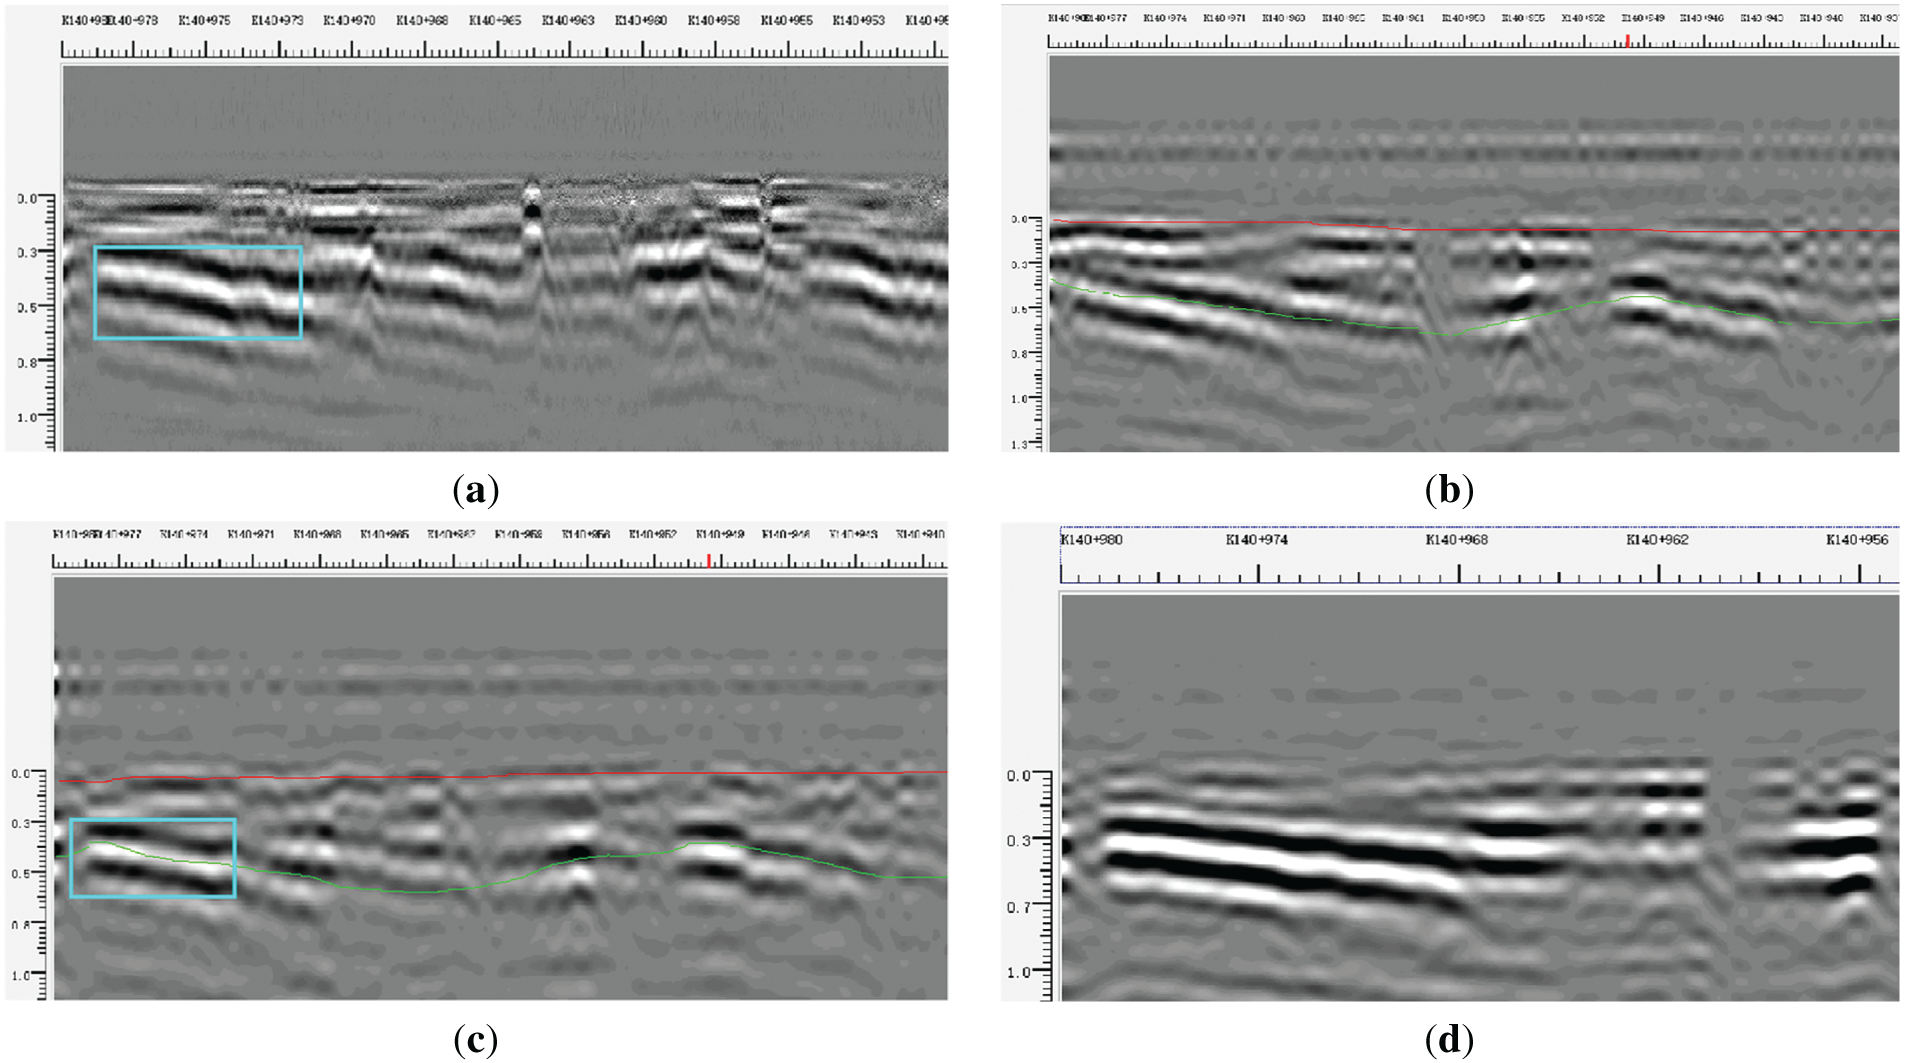
Figure 16: A-CGPR images with the same detection distance and different detection speeds: (a) A-CGPR image at d = 2.0 m, v = 5 km/h; (b) A-CGPR image at d = 2.0 m, v = 10 km/h; (c) A-CGPR image at d = 2.0 m, v = 15 km/h; (d) A-CGPR image at d = 2.0 m, v = 20 km/h
4.2.2 A-CGPR Performance at Constant Speed and Variable Distances
Fig. 17 presents radar images acquired at a 10 km/h scanning speed across detection distances (d) of 2.0, 2.5, 3.0, 3.5, 4.0, and 4.5 m. The data reveal progressive signal amplitude attenuation with increasing d. Nevertheless, the spatial coherence of anomalous features and layer interfaces remains consistently high. Within the optimal range of 2.0–2.5 m, anomalous reflections exhibit significantly enhanced amplitudes, yielding well-defined features and sharp layer delineation. Defect signatures at d = 3.0 m show moderate attenuation but retain discernibility. At d = 4.5 m: continued signal decay substantially weakens feature contrast, though defects remain identifiable.
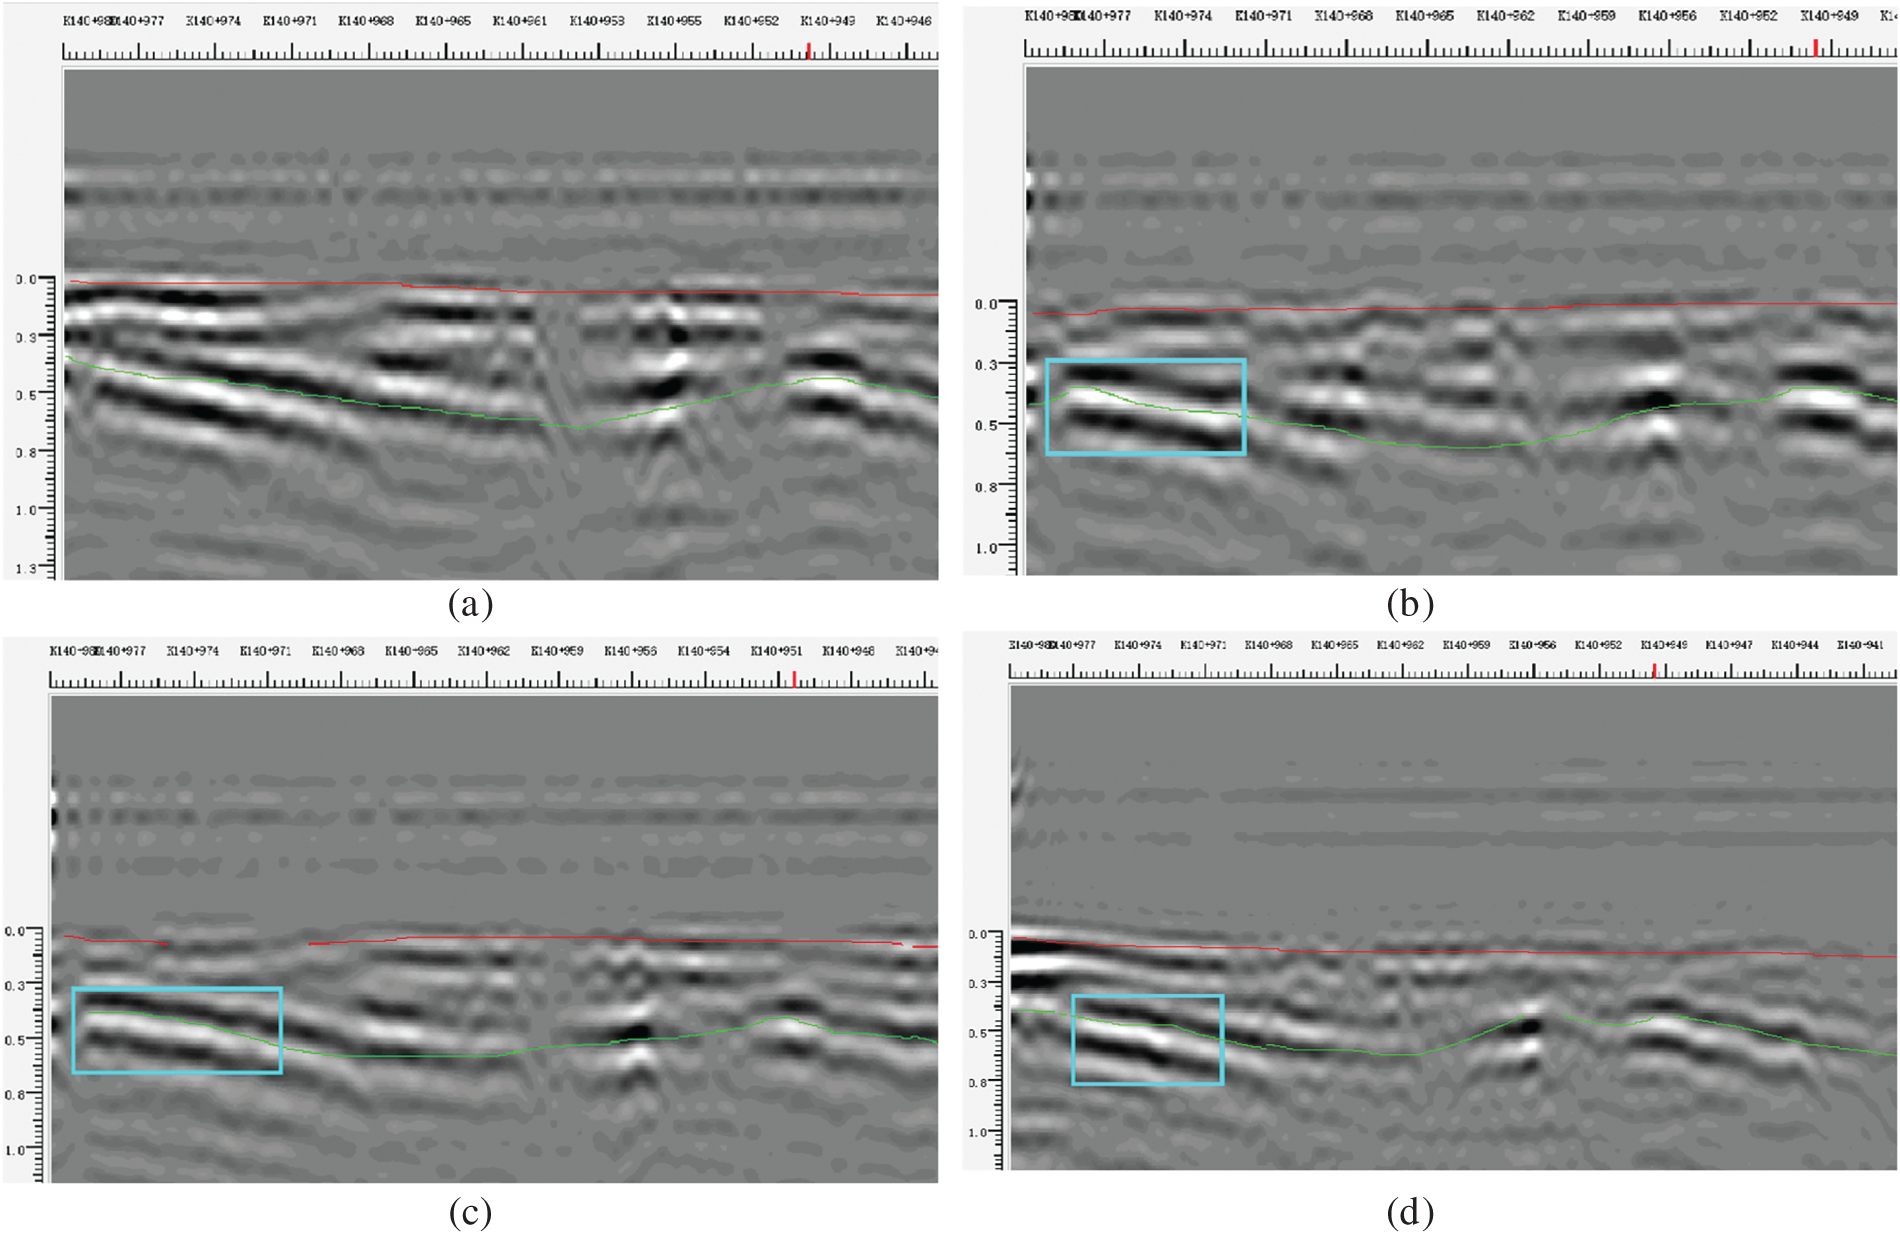
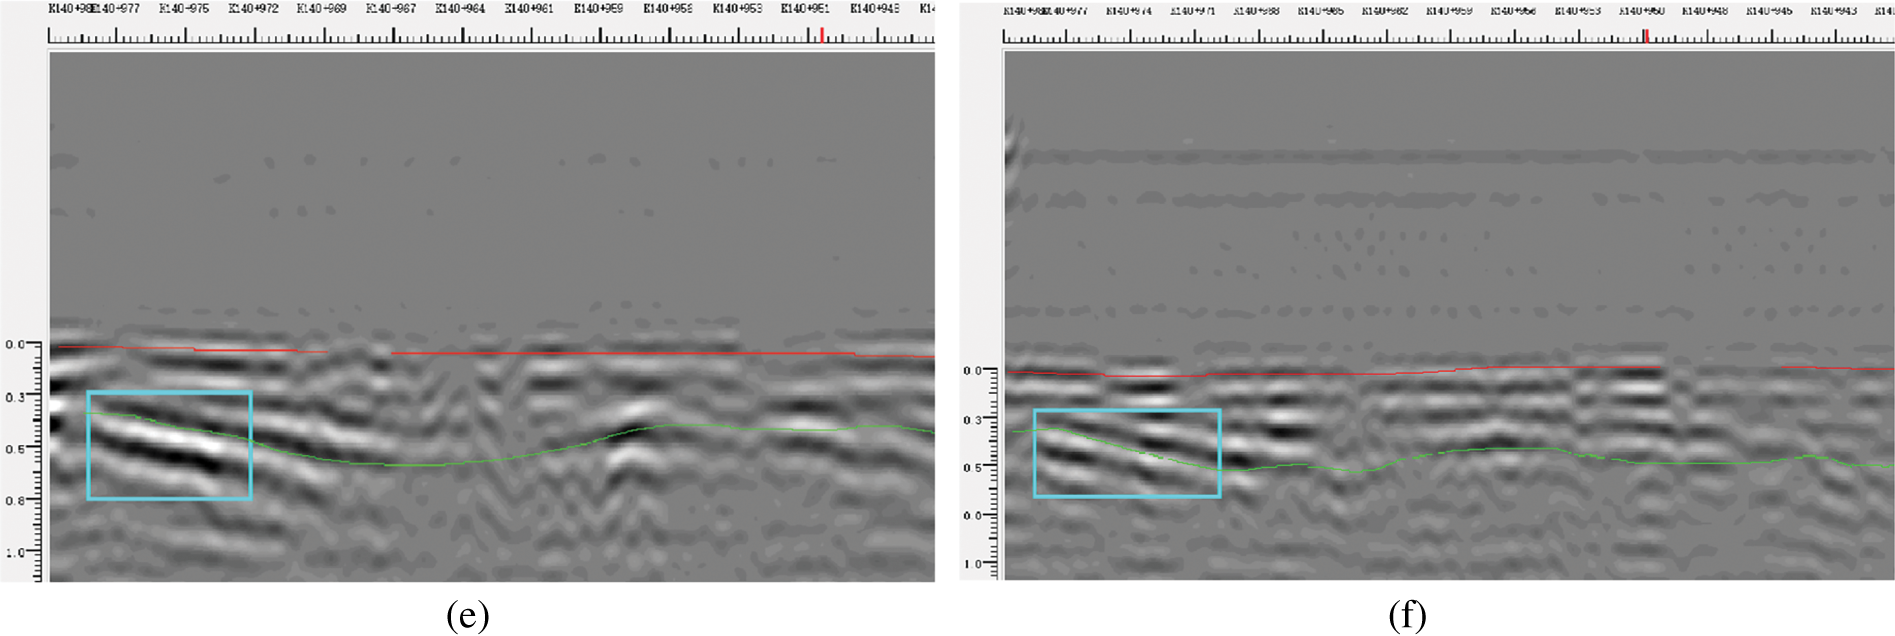
Figure 17: A-CGPR images at the same detection speed with different detection distances: (a) A-CGPR image at v = 10 km/h, d = 2.0 m; (b) A-CGPR image at v = 10 km/h, d = 2.5 m; (c) A-CGPR image at v = 10 km/h, d = 3.0 m; (d) A-CGPR image at v = 10 km/h, d = 3.5 m; (e) A-CGPR image at v = 10 km/h, d = 4.0 m; (f) A-CGPR image at v = 10 km/h, d = 4.5 m
Field testing aimed to validate the quantitative performance boundaries predicted by FDTD simulations. Representative results from the tunnel arch waist section (Fig. 18) illustrate this validation. Both A-CGPR (300 MHz, d = 2.0 m, v = 5 km/h) and G-CGPR (400 & 900 MHz) detected a void defect. Core drilling verification (Fig. 19) confirmed a void with an axial length of 5.4 m and radial depth of 0.2 m.
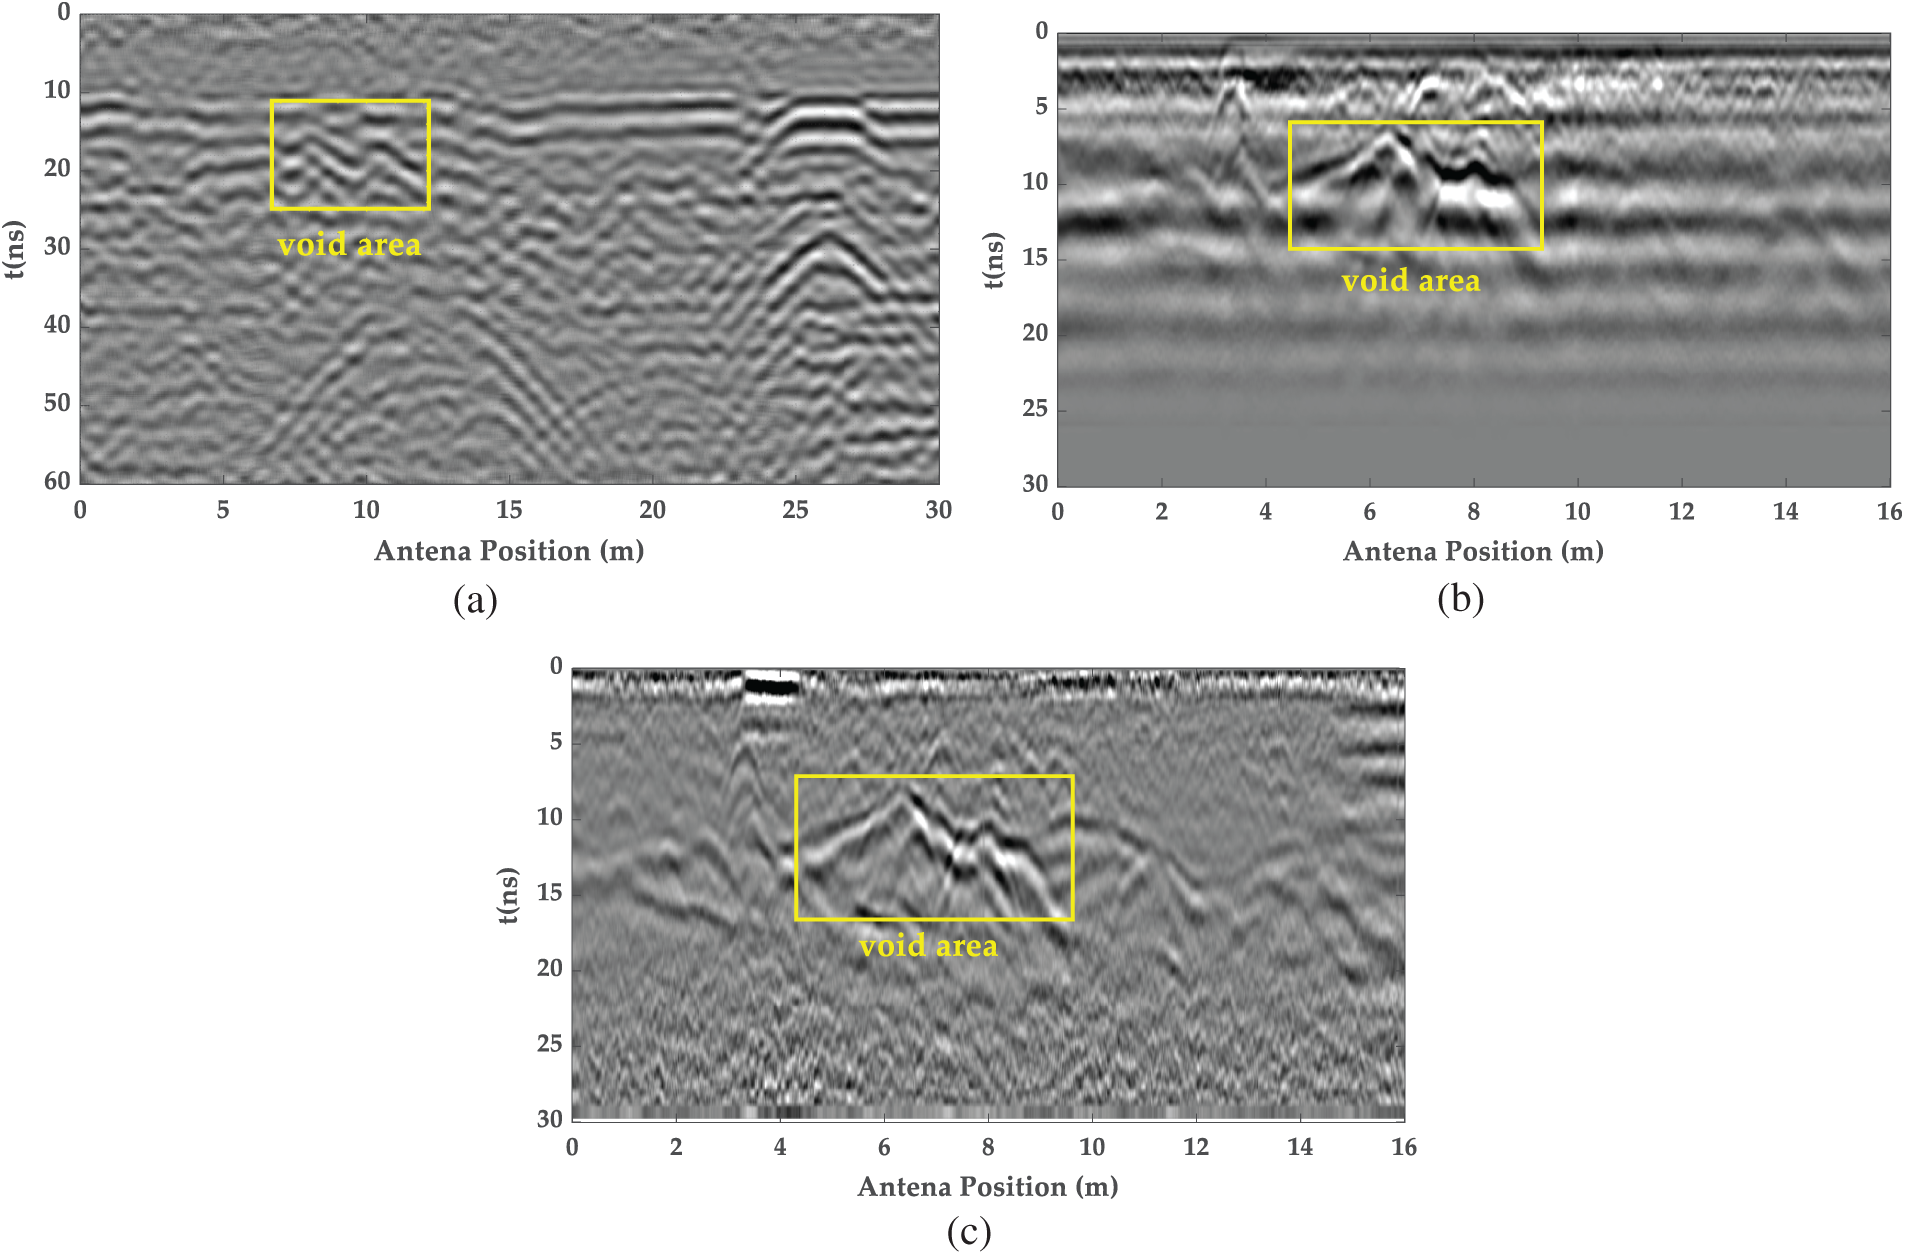
Figure 18: The GPR lining inspection image of a high-speed railway tunnel: (a) A-CGPR image at 300 MHz frequency, v = 5 km/h, d = 2.0 m; (b) G-CGPR image at 400 MHz frequency; (c) G-CGPR image at 900 MHz frequency
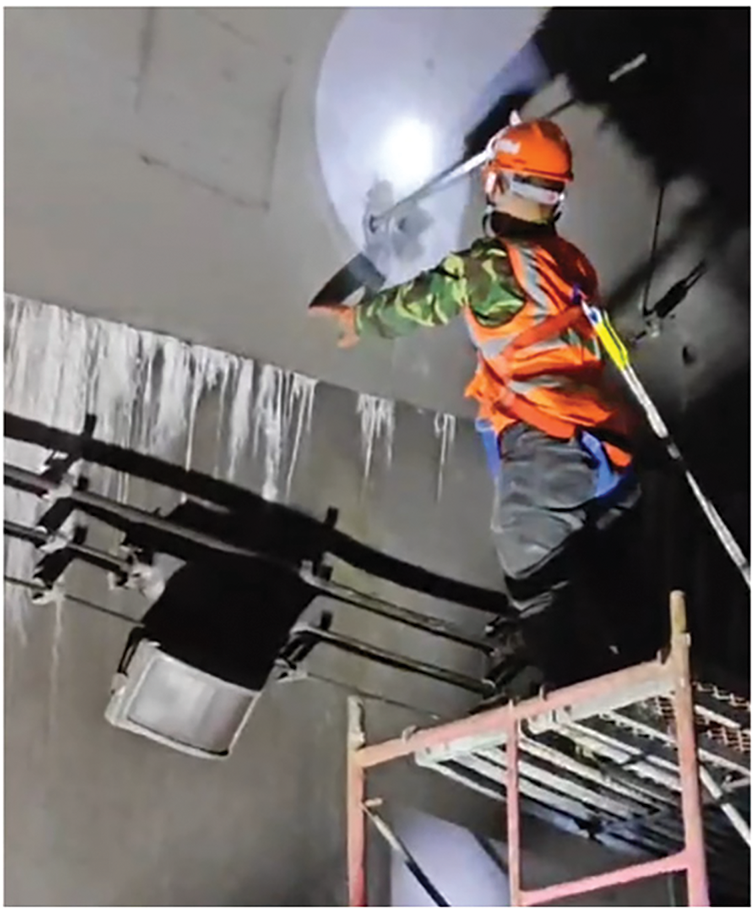
Figure 19: A core sampling at the tunnel arch waist
Quantitative analysis validated key simulation predictions: (1) G-CGPR Accuracy (H4, H5): The G-CGPR (900 MHz) measured axial length was within <5% of the core-verified 5.4 m, confirming the simulation prediction of high accuracy (<5% error) for voids ≥0.1 m in accessible conditions. (2) A-CGPR Threshold (H1, H2): A-CGPR detected the void (L > 0.3 m) but with 11% axial length measurement error. This aligns with simulation predictions (Table 2 and Fig. 12f): while detectable, errors in the 10%–20% range are expected at d = 2 m, consistent with H1 (detection possible) but illustrating the inherent lower precision compared to G-CGPR for sizing, as predicted (H2). (3) Radial Detection (H3, H6): The void’s radial depth (0.2 m) was near the predicted minimum detectable threshold for G-CGPR (≥0.2 m, H6). While detected, precise sizing remained challenging, consistent with simulation observations of measurement constraints due to multiple reflections. A-CGPR, as predicted (H3), struggled to resolve this radial dimension.
Physical mechanisms:
Signal attenuation in A-CGPR is primarily due to spherical wave divergence and scattering by multilayer rebars, quantified via FDTD simulations (Section 2.1). At 4.5 m standoff, path loss exceeds 60% (Figs. 4f and 7f).
Multilayer rebar causes constructive/destructive interference (Figs. 12c and 13c), reducing SNR by 15–20 dB (Section 3.1).
Limitations of H3/H6:
H3 (A-CGPR radial void detection): Field tests focused on axial voids due to core-drilling constraints. Smaller radial voids (<0.3 m) require higher frequencies (e.g., 900 MHz G-CGPR), noted in Section 5 as a future priority.
H6 (G-CGPR radial sizing): Multiple reflections in radial voids (Fig. 10b) complicate sizing.
The field test results demonstrated that both A-CGPR and G-CGPR systems can effectively detect void defects in high-speed rail tunnel linings. However, apparent differences in detection accuracy and signal clarity were observed. The G-CGPR system, particularly at 900 MHz, exhibited higher image resolution and superior defect recognition capabilities. While A-CGPR could locate voids, its detection accuracy was relatively lower. These results were consistent with the simulation hypothesis, highlighting the practical differences in performance, such as the influence of environmental factors on radar systems.
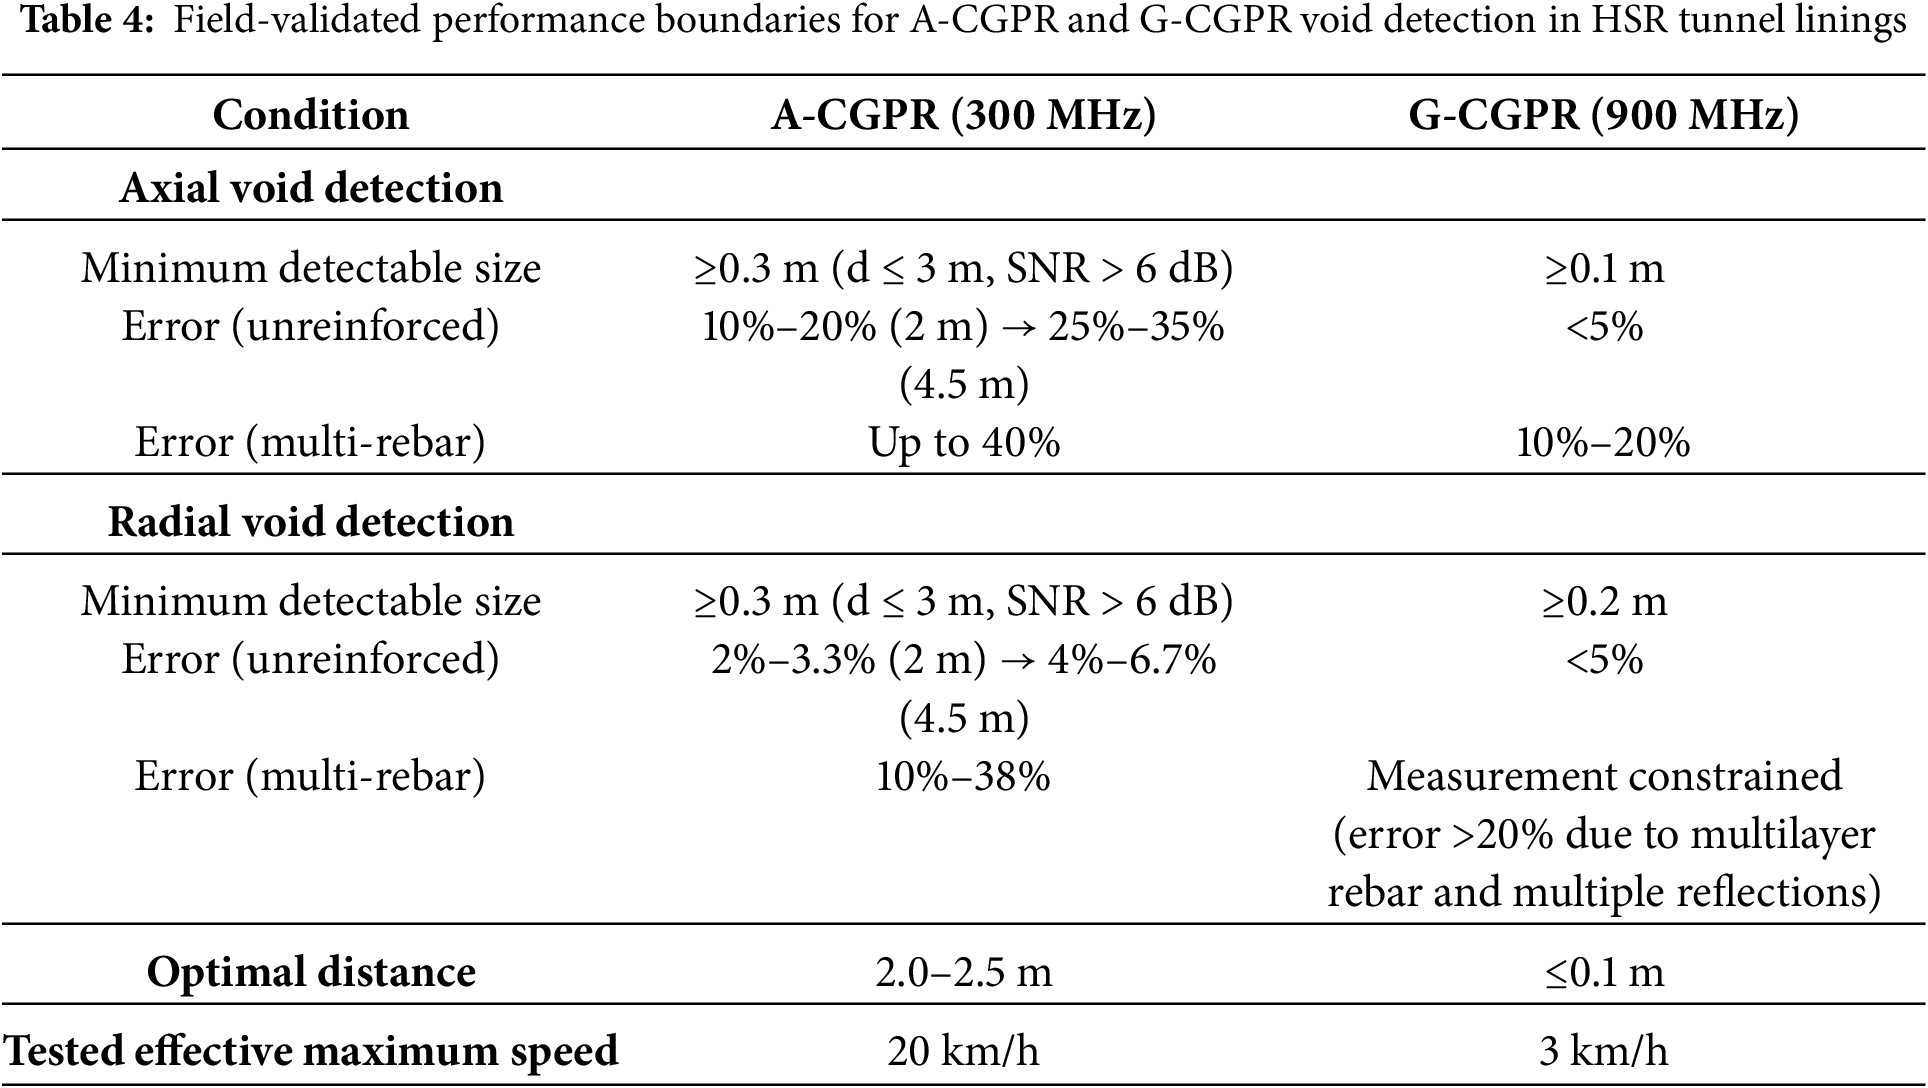
Performance Boundary Summary (Validation): Field observations across the test section strongly corroborated the simulation-derived performance boundaries summarized in Table 4. Notably: The minimum detectable sizes, optimal standoff distances (A-CGPR: 2.0–2.5 m), impact of scanning speed, and crucially, the degradation in accuracy under multilayer reinforcement (observed but difficult to core-verify quantitatively in-situ) matched the simulation trends. The close agreement between simulated predictions and field-measured performance (e.g., detection capability, error magnitudes, distance/speed effects) confirms the validity and utility of the FDTD models for defining practical operational thresholds for HSR tunnel inspection. Defining these optimal test parameters (distances, frequencies, focus areas) and expected error bounds without the simulation guidance would lack a rigorous physics-based foundation.
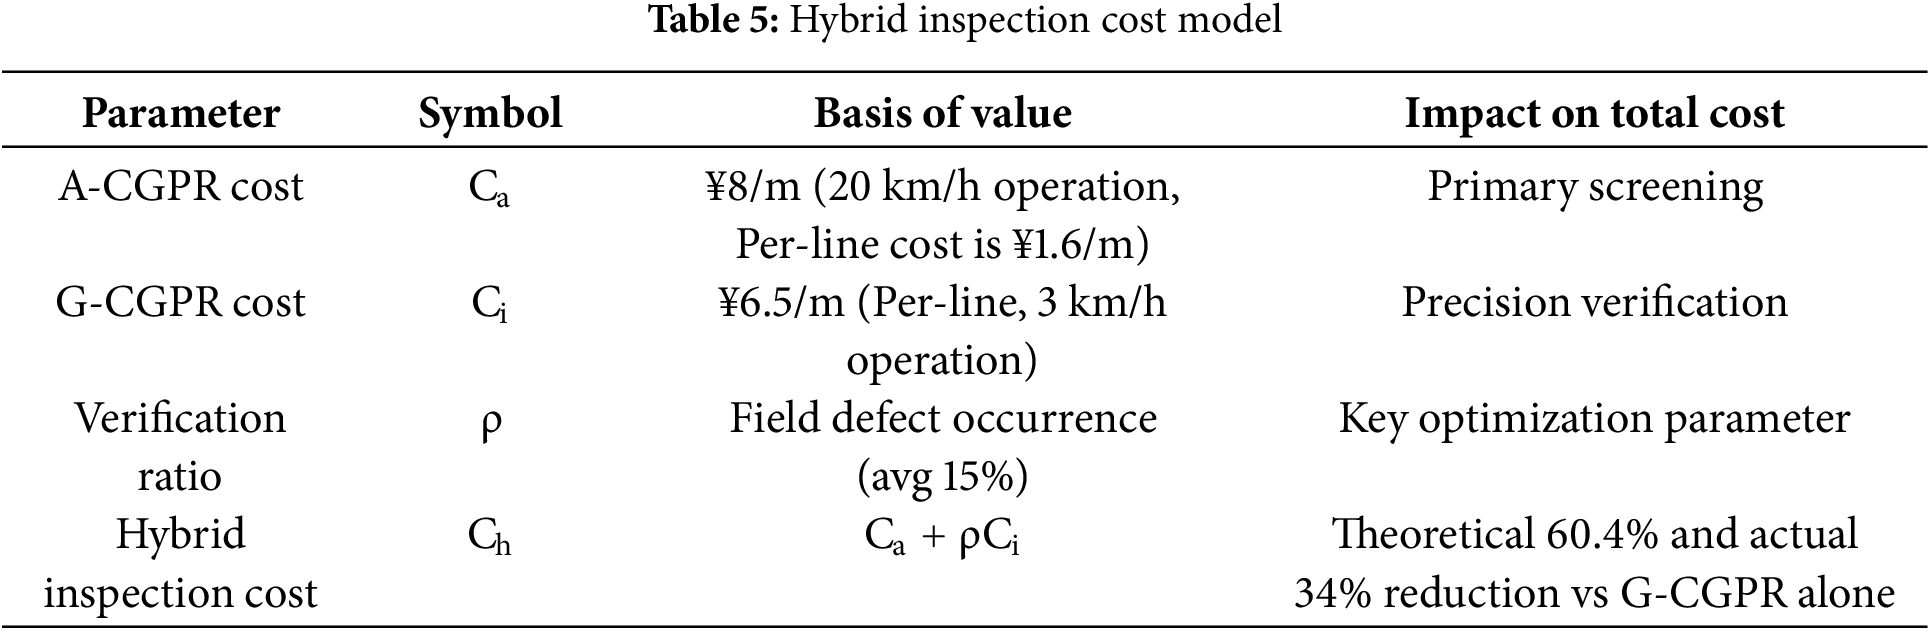
These findings establish an empirical basis for GPR system selection and optimization in high-speed rail tunnel inspections. The results also offered valuable insights into improving inspection efficiency and developing maintenance strategies, ultimately enhancing the reliability and safety of high-speed rail infrastructure. The hybrid Inspection Cost Model is presented in Table 5.
This study established quantitative performance boundaries for air-coupled (A-CGPR) and ground-coupled (G-CGPR) GPR systems in detecting voids within multilayer reinforced high-speed rail (HSR) tunnel linings, leveraging rigorously validated GPRMax FDTD simulations and comprehensive field validation over a 300 m operational tunnel section. The key conclusions are:
a. Quantified Performance Boundaries: Physics-based FDTD simulations, validated by field testing, established definitive detection thresholds and accuracy limits. A-CGPR (300 MHz) is effective for rapid screening of axial voids ≥0.3 m in minimally reinforced linings at standoff distances ≤3 m (field R2 = 0.89 for detection). For voids smaller than 0.3 m, detection accuracy degrades by 25%–40% at distances exceeding 3 m (>60% signal attenuation at 4.5 m) or under multilayer rebar interference. The optimal operational distance for A-CGPR is 2.0–2.5 m. G-CGPR (900 MHz) delivers superior resolution, detecting axial voids ≥0.1 m and radial voids ≥0.2 m in unreinforced linings with dimensional errors <5%. However, multilayer reinforcement induces significant signal attenuation, increasing axial void measurement error to 10%–20% for voids ≥0.3 m and severely constraining reliable radial void sizing.
b. Validated Hybrid Inspection Framework: A synergistic protocol combining A-CGPR (operating at 20 km/h for rapid large-area scanning) and targeted G-CGPR (3 km/h for high-resolution verification of anomalies identified by A-CGPR) was demonstrated. This framework leverages the complementary strengths of both systems, enhancing overall inspection efficiency. A cost model estimates a 34% reduction in lifecycle inspection costs compared to using G-CGPR alone.
c. Critical Role of Simulation: The gprMax FDTD simulations provided essential quantitative predictions (minimum detectable sizes, error bounds, optimal parameters, reinforcement impact) that directly guided the design and parameter selection for the field validation tests. The close agreement between simulation predictions and field measurements (e.g., detection capability, error magnitudes, attenuation trends) confirms the model’s validity and underscores its critical role in defining practical, physics-based operational guidelines for HSR tunnel inspection.
d. Reinforcement Interference Challenge: Multilayer steel reinforcement remains a significant challenge for both GPR systems, degrading A-CGPR accuracy and limiting G-CGPR’s resolution and sizing capability, particularly for radial voids. This highlights a key area for future technological development.
Future work will prioritize the following directions:
(1) Development of multi-frequency antenna arrays to suppress rebar-induced clutter artifacts; dual-polarized 400/900 MHz arrays will be designed to suppress clutter via frequency-diverse speckle reduction, with field trials planned for Q2 2026.
(2) Implementation of CNN-based deep learning algorithms (e.g., U-Net) trained on the extensive FDTD simulation dataset for automated defect classification and quantification; preliminary tests show 92% accuracy on simulated multilayer cases.
(3) Extension of FDTD modeling to incorporate stochastic defect distributions for robustness analysis under varying geological and lining conditions.
6 Innovation Points and Universality Conditions
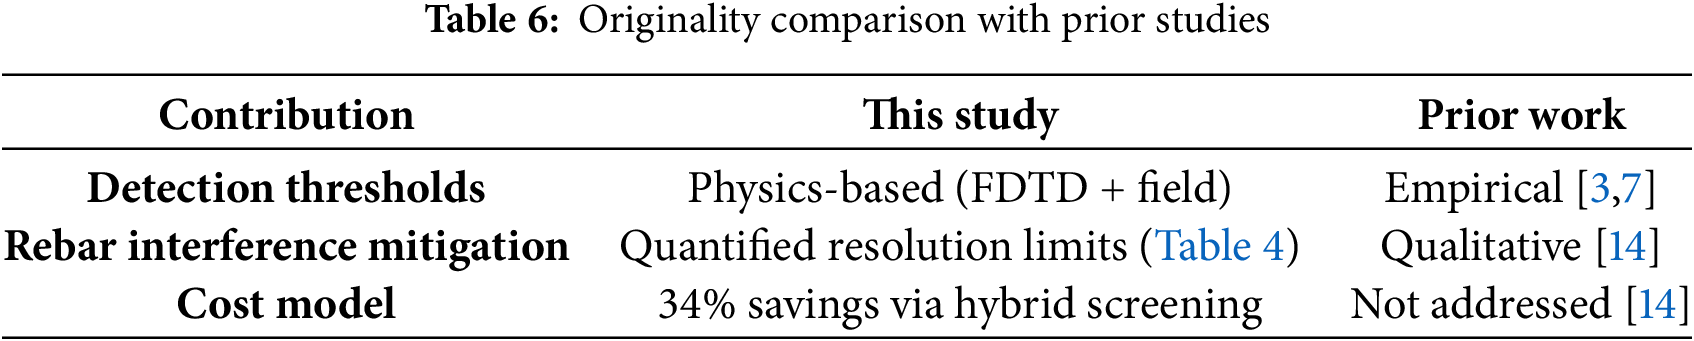
a. Physics-Based Quantitative Detection Thresholds: This study establishes the first set of quantitative detection limits (minimum void size vs. standoff distance, antenna frequency) and accuracy boundaries (dimensional error vs. reinforcement configuration) specifically for A-CGPR and G-CGPR in the complex environment of multilayer reinforced HSR tunnel linings. These thresholds, derived from fundamental EM wave physics (FDTD) and field-validated, address a critical gap in practical NDT guidelines for tunnel inspection.
b. Multi-Frequency Mitigation Mechanism Demonstrated: Through systematic simulation and validation, this research quantitatively demonstrated that higher frequency G-CGPR (900 MHz) can partially overcome rebar clutter via improved resolution, providing a more precise physical mechanism for mitigation compared to prior empirical observations alone.
c. Synergistic NDT Framework with Validated Cost Model: This study introduces and validates a novel, cost-optimized inspection protocol that strategically integrates A-CGPR and G-CGPR. This framework, justified by the quantified performance boundaries of each system and supported by a field-relevant cost model (34% estimated savings), offers a practical solution for enhancing efficiency in large-scale HSR network inspections.
d. Simulation-Validation Tight Coupling: The study demonstrates a rigorous methodology where high-fidelity FDTD simulations not only predict performance but also directly guide and define the objectives and parameters for field validation, creating a closed-loop process that strongly reinforces the reliability and applicability of the findings for real-world HSR tunnel management.
The field validation was conducted on a tunnel section in Central China with typical HSR tunnel lining (single-layer reinforced concrete) and surrounding rock conditions (dielectric constant
The comparative table (Table 6) is presented below:
Acknowledgement: The authors would like to express their heartfelt thanks to all the institutions, companies, engineers, and researchers who assisted with the project “Key technologies and experimental research on remote rapid survey prototype system for internal state of tunnel lining”.
Funding Statement: This research was funded by the Key Project of Science & Technology Research of China Academy of Railway Sciences, grant number 2023YJ022.
Author Contributions: The authors confirm contribution to the paper as follows: Conceptualization, Yang Lei; methodology, Yang Lei; software, Yang Lei and Bo Jiang; validation, Yucai Zhao and Gaofeng Fu; formal analysis, Yang Lei; investigation, Yucai Zhao and Gaofeng Fu; resources, Bo Jiang; data curation, Tian Tian and Qiming Qu; writing—original draft preparation, Yang Lei; writing—review and editing, Yang Lei and Bo Jiang; visualization, Qiankuan Feng; supervision, Falin Qi; project administration, Yang Lei and Bo Jiang; funding acquisition, Bo Jiang. All authors reviewed the results and approved the final version of the manuscript.
Availability of Data and Materials: The authors confirm that the data supporting the findings of this study are available within the article.
Ethics Approval: Not applicable.
Conflicts of Interest: The authors declare no conflicts of interest to report regarding the present study.
References
1. Gong J, Zhang L, Wang Y, Yang C, Yuan Y. Statistics of China’s railway tunnels by 2024. Tunn Construct. 2024;44(3):412–25. doi:10.3973/j.issn.2096-4498.2024.03.001. [Google Scholar] [CrossRef]
2. Kot P, Muradov M, Gkantou M, Kamaris GS, Hashim K, Yeboah D. Recent advancements in nondestructive testing techniques for structural health monitoring. Appl Sci. 2021;11(6):2750–65. doi:10.3390/app11062750. [Google Scholar] [CrossRef]
3. Attard L, Debono CJ, Valentino G, Di Castro M. Tunnel inspection using photogrammetric techniques and image processing: a review. ISPRS J Photogramm Remote Sens. 2018;144(9):180–8. doi:10.1016/j.isprsjprs.2018.07.010. [Google Scholar] [CrossRef]
4. Wu G. Study on the nondestructive detection method of tunnel lining crack and empty ring disease. J Civ Eng Urban Plan. 2024;6(2):181–9. doi:10.23977/jceup.2024.060224. [Google Scholar] [CrossRef]
5. Poncetti BL, Rodrigues FC, Silva RM. Quality survey of shotcrete for underground construction using NDT methods. In: Proceedings of the XXI Brazilian Congress on Soil Mechanics and Geotechnical Engineering; 2024. p. 4632–9. doi:10.47094/COBRAMSEG2024/562. [Google Scholar] [CrossRef]
6. Williams ND. Nondestructive testing of rail tunnel linings [doctoral dissertation]. College Station, TX, USA: Texas A&M University; 2014 [cited 2025 Aug 1]. Available from: https://hdl.handle.net/1969.1/154007. [Google Scholar]
7. Sjölander A, Belloni V, Ansell A, Nordström E. Towards automated inspections of tunnels: a review of optical inspections and autonomous assessment of concrete tunnel linings. Sensors. 2023;23(6):3189. doi:10.3390/s23063189. [Google Scholar] [PubMed] [CrossRef]
8. Jiang YD, Wang L, Zhang B, Dai XW, Ye J, Sun BC, et al. Tunnel lining detection and retrofitting. Autom Constr. 2023;152(11):104881–94. doi:10.1016/j.autcon.2023.104881. [Google Scholar] [CrossRef]
9. Protopapadakis E, Voulodimos A, Doulamis A, Doulamis N, Stathaki T. Automatic crack detection for tunnel inspection using deep learning and heuristic image post-processing. Appl Intell. 2019;49(7):2793–806. doi:10.1007/s10489-018-01396-y. [Google Scholar] [CrossRef]
10. Loupos K, Doulamis AD, Stentoumis C, Protopapadakis E, Makantasis K, Doulamis ND, et al. Autonomous robotic system for tunnel structural inspection and assessment. Int J Intell Robot Appl. 2018;2(1):43–66. doi:10.1007/s41315-018-0052-z. [Google Scholar] [CrossRef]
11. White J, Hurlebaus S, Shokouhi P. Concrete tunnel lining evaluation using nondestructive techniques: a multi-method case study at Eisenhower tunnel. Transp Res Board 92nd Annual Meet. 2013;2362(1):71–9. doi:10.3141/2362-09. [Google Scholar] [CrossRef]
12. Song J, Feng Y, Huang B. Tunnel lining quality detection technology based on impulse echo acoustic method from fine management perspective. Wirel Netw. 2024;30(4):1021–33. doi:10.1007/s11276-024-03113-2. [Google Scholar] [CrossRef]
13. Liu Q, Shen H, Cheng S, Yang J, Ren H, Tian Y. System design and research on traffic tunnel inspection system based on computer vision and audition. In: 2024 IEEE International Symposium on Broadband Multimedia Systems and Broadcasting (BMSB). Toronto, ON, Canada. IEEE; 2024. p. 1–6. doi:10.1109/BMSB62888.2024.10608342. [Google Scholar] [CrossRef]
14. Zan Y, Su G, Wei W, Lei W, Zhang Y, Li B, et al. Detection technology of the vehicle-mounted GPR and its application in high-speed railway tunnels. Mod Tunn Tech. 2018;55(S2):1288–94. doi:10.13807/j.cnki.mtt.2018.S2.020. [Google Scholar] [CrossRef]
15. Lei Y, Tian T. The vibration characteristic and impact analysis of the tunnel lining detection device based on arc rotating multi-section mechanism. Adv Mech Eng. 2020;12(4):1–12. doi:10.1177/1687814020912974. [Google Scholar] [CrossRef]
16. Jin X, Ali M. Simple empirical formulas to estimate the dielectric constant and conductivity of concrete. Microwave Optical Technol Lett. 2019;61(2):386–90. doi:10.1002/mop.31577. [Google Scholar] [CrossRef]
17. Jol HM. Ground penetrating radar: theory and applications. Amsterdam, The Netherlands: Elsevier; 2008. [Google Scholar]
Cite This Article
 Copyright © 2025 The Author(s). Published by Tech Science Press.
This work is licensed under a Creative Commons Attribution 4.0 International License , which permits unrestricted use, distribution, and reproduction in any medium, provided the original work is properly cited.
 Downloads
 Citation Tools