
 Submit a Paper
 Propose a Special lssue
 Open Access
ARTICLE

Evaluation of the Failure Impact of Jet Fire from Natural Gas Leakage on Parallel Pipelines
1 College of Petroleum and Natural Gas Engineering, Southwest Petroleum University, Chengdu, 610500, China
2 China National Petroleum Corporation Hunan Pipeline Branch, Changsha, 410000, China
* Corresponding Author: Liqiong Chen. Email:
(This article belongs to the Special Issue: Intelligent Fault Diagnosis and Health Monitoring for Pipelines)
Structural Durability & Health Monitoring 2026, 20(1), . https://doi.org/10.32604/sdhm.2025.066408
Received 08 April 2025; Accepted 19 June 2025; Issue published 08 January 2026
 View Full Text
 Download PDF
Abstract
Maintaining the structural integrity of parallel natural gas pipelines during leakage-induced jet fires remains a critical engineering challenge. Existing methods often fail to account for the complex interactions among heat transfer, material behavior, and pipeline geometry, which can lead to overly simplified and potentially unsafe assessments. To address these limitations, this study develops a multiphysics approach that integrates small-orifice leakage theory with detailed thermo-fluid-structural simulations. The proposed framework contributes to a more accurate failure analysis through three main components: (1) coupled modeling that tracks transient heat flow and stress development as fire conditions evolve; (2) risk assessment incorporating spatial layout, material property changes with temperature, and operational limits; and (3) sensitivity analysis to identify key design factors that influence structural performance under high thermal loads. Simulation results demonstrate that thermal radiation from neighboring jet fires significantly accelerates material degradation, with inter-pipeline spacing emerging as a critical determinant of structural response. Notably, increasing the spacing between pipelines reduces thermal interaction and mechanical stress transfer. As a result, systems with optimized spacing exhibit markedly lower deformation than conventional configurations. These findings provide a foundation for re-evaluating pipeline layout strategies and strengthening safety protocols, particularly in high-risk environments where fire exposure can severely compromise structural reliability. The proposed approach offers actionable guidance for engineers and policymakers seeking to enhance the resilience of pipeline infrastructure under extreme thermal conditions.Keywords
Oil and gas pipelines constitute critical infrastructure for China’s energy supply, with extensive networks constructed to meet growing demand. These conduits convey hazardous substances exhibiting significant combustion and explosion risks under leak conditions. Catastrophic precedents include the 29 May 2004 natural gas pipeline explosion in Luzhou, Sichuan (5 fatalities, 35 injuries) [1] and the 2 January 2013 crude oil pipeline rupture in Qingdao, Shandong (>100 casualties) [2]. Given China’s extensive implementation of parallel natural gas pipeline configurations, failures in such systems may trigger cascading catastrophic events.
Research on the sensitivity of flame behavior to natural gas composition has led to the development of quantitative predictive models. These models clarify how key compositional parameters govern the spatial distribution of thermal radiation, the growth of visible flame height, and the structure of buoyancy-driven flow fields [3–7]. Complementary multiphysics studies have further elucidated the thermal-structural interactions between jet fires and adjacent pipelines, establishing mechanism-based failure thresholds supported by validated simulations [8–11].
The analysis of fracture dimension effects on adjacent pipelines during fire exposure, first introduced in Mazzola’s seminal study [12], has profoundly shaped research on failure mechanisms in parallel pipeline systems. Building on this foundation, Liu developed a three-dimensional nonlinear finite element model (FEM) to simulate explosion scenarios in confined tunnels, revealing the influence of leak size and blast distance on pipeline deformation [13]. In parallel, He et al. [14] proposed a load-bearing capacity framework that incorporates fire dynamics and structural strength testing, enabling precise evaluation of thermal failure thresholds. Subsequent research has expanded upon these early finite element and structural frameworks by incorporating accident reconstructions, data-driven techniques, and advanced physics-based models. Besiktas et al. [15] reconstructed a real-world natural gas pipeline jet-fire incident using the ALOHA hazard simulation platform. Their findings demonstrated that pipeline geometry and meteorological conditions—particularly wind speed and ambient temperature—are critical determinants of thermal radiation hazard distances, with worst-case scenarios significantly enlarging exclusion zones. Mashhadimoslem et al. [16] developed a machine-learning framework combining multilayer feed-forward neural networks and radial basis function algorithms with Bayesian regularization, enabling high-fidelity predictions of flame geometry and radiant heat flux across a wide range of release and environmental conditions. Lowesmith et al. [17] advanced physics-based modeling by coupling a one-dimensional flame-integral formulation with a weighted multi-source radiation scheme and a density-weighted virtual nozzle model, accurately reproducing centerline decay and radiant flux profiles for both sonic and subsonic natural gas releases. Johnson et al. [18] analyzed a large-scale experimental dataset encompassing diverse release rates and crosswind conditions, formulating a validated conical jet model that remains a benchmark for predicting flame length, tilt angle, and external radiation in contemporary risk-assessment frameworks.
Although the failure mechanisms and contributing factors in oil and gas pipelines have been widely studied [19–22], knowledge of yield stress evolution in adjacent parallel pipelines exposed to natural gas jet fires remains notably limited. This study presents an integrated combustion-flow–pipeline interaction model based on multiphysics-coupled simulations conducted in ANSYS Fluent. The quantitative analysis evaluates failure progression and conducts sensitivity assessments of key influencing parameters. The findings provide a scientific basis for optimizing safety separation distances and enhancing operational protection strategies in high-risk pipeline infrastructure.
During catastrophic ruptures in parallel gas pipelines, high-pressure combustible gas escapes through porous soil layers before venting into the atmosphere, forming high-velocity jets that erode the overlying strata and create erosional cavities. This hydro-geomechanically coupled process dynamically redistributes loads across adjacent pipelines. CFD simulations confirm subsequent jet fires establish omnidirectional radiative flux envelopes—three-dimensional thermal fields fully encompassing parallel pipeline arrays (Fig. 1 details energy transfer physics).
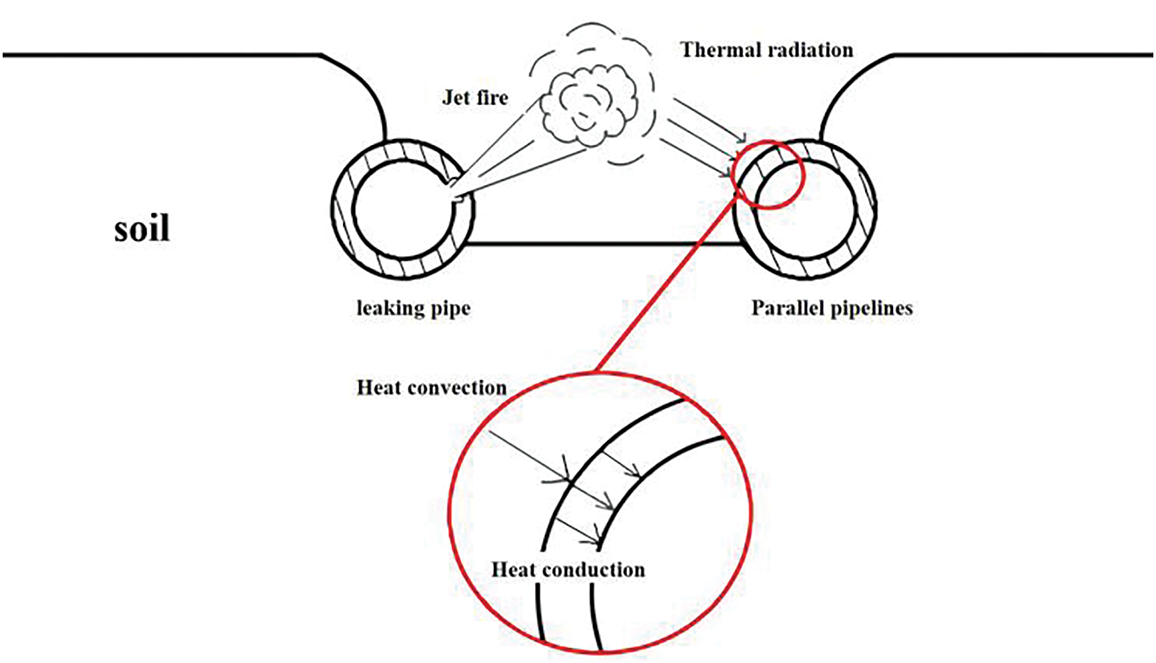
Figure 1: Schematic diagram of thermal radiation from jet fire to parallel pipeline
Pipeline leakage dynamics are fundamentally classified into three computational archetypes: small-orifice, large-orifice, and complete rupture models. The transitional threshold between small- and large-orifice regimes is conventionally demarcated by the dimensionless ratio d/D = 0.2 [23], where d denotes orifice diameter and D signifies internal pipeline diameter. Within this study’s parallel pipeline system, the small-orifice leakage paradigm constitutes the primary analytical framework. This model [24] operates under three critical postulates: (1) significant scale disparity between orifice and pipeline dimensions (d/D ≪ 1), (2) sufficiently large internal volume to maintain quasi-steady pressure conditions throughout leakage transients, and (3) negligible pressure fluctuations induced by leakage-driven perturbations. Fig. 2 schematizes the corresponding geometric configuration.
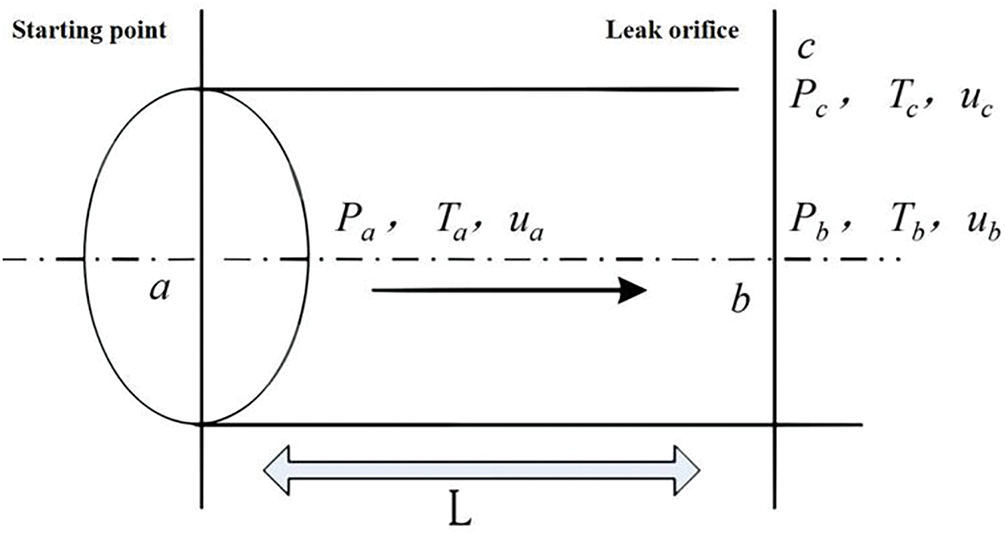
Figure 2: Schematic diagram of small hole leakage model
In Fig. 2, monitoring points a and b are positioned at the pipeline mid-span, with point c coincident with the leakage orifice. The variables P, T, and u denote pressure, temperature, and flow velocity, respectively. Given the transonic timescale of leakage development (approaching Ma = 1), the phenomenon is modeled as a de Laval nozzle configuration. Leakage velocity (uc) is derived through isentropic nozzle flow equations, where k represents the gas-specific isentropic exponent (C<sub>p</sub>/C<sub>v</sub>), a fundamental thermodynamic parameter governing choked flow behavior in compressible media.
As the pressure at point b increases and the leakage velocity attains the speed of sound (Mach number Mc = 1), the flow reaches a critical condition. Further elevation of the upstream pressure does not alter the leakage velocity, as the flow remains choked at sonic velocity. This state, termed the “critical condition,” defines the threshold where the mass flow rate achieves its maximum value for the given system parameters. The corresponding critical pressure (pcv) and critical velocity (ucv) are determined through isentropic flow equations for compressible gas dynamics.
When pressure at point b increases and leakage velocity attains sonic speed (Mac = 1), the flow reaches criticality. Subsequent upstream pressure elevation no longer augments leakage velocity due to flow choking at Mach 1. This critical condition establishes the threshold for maximum achievable mass flow rate under fixed system parameters. The corresponding critical pressure (pcv) and velocity (ucv) are derived from compressible flow isentropic relations:
where k denotes the specific heat ratio, R is the gas constant, and T0 is stagnation temperature.
The computational methodology framework is schematically depicted in Fig. 3, systematically integrating geometric modeling, meshing strategies, mathematical formulations, and numerical solution protocols. This graphical overview establishes a conceptual roadmap for the subsequent finite element analysis of jet fire dynamics in parallel pipeline systems.
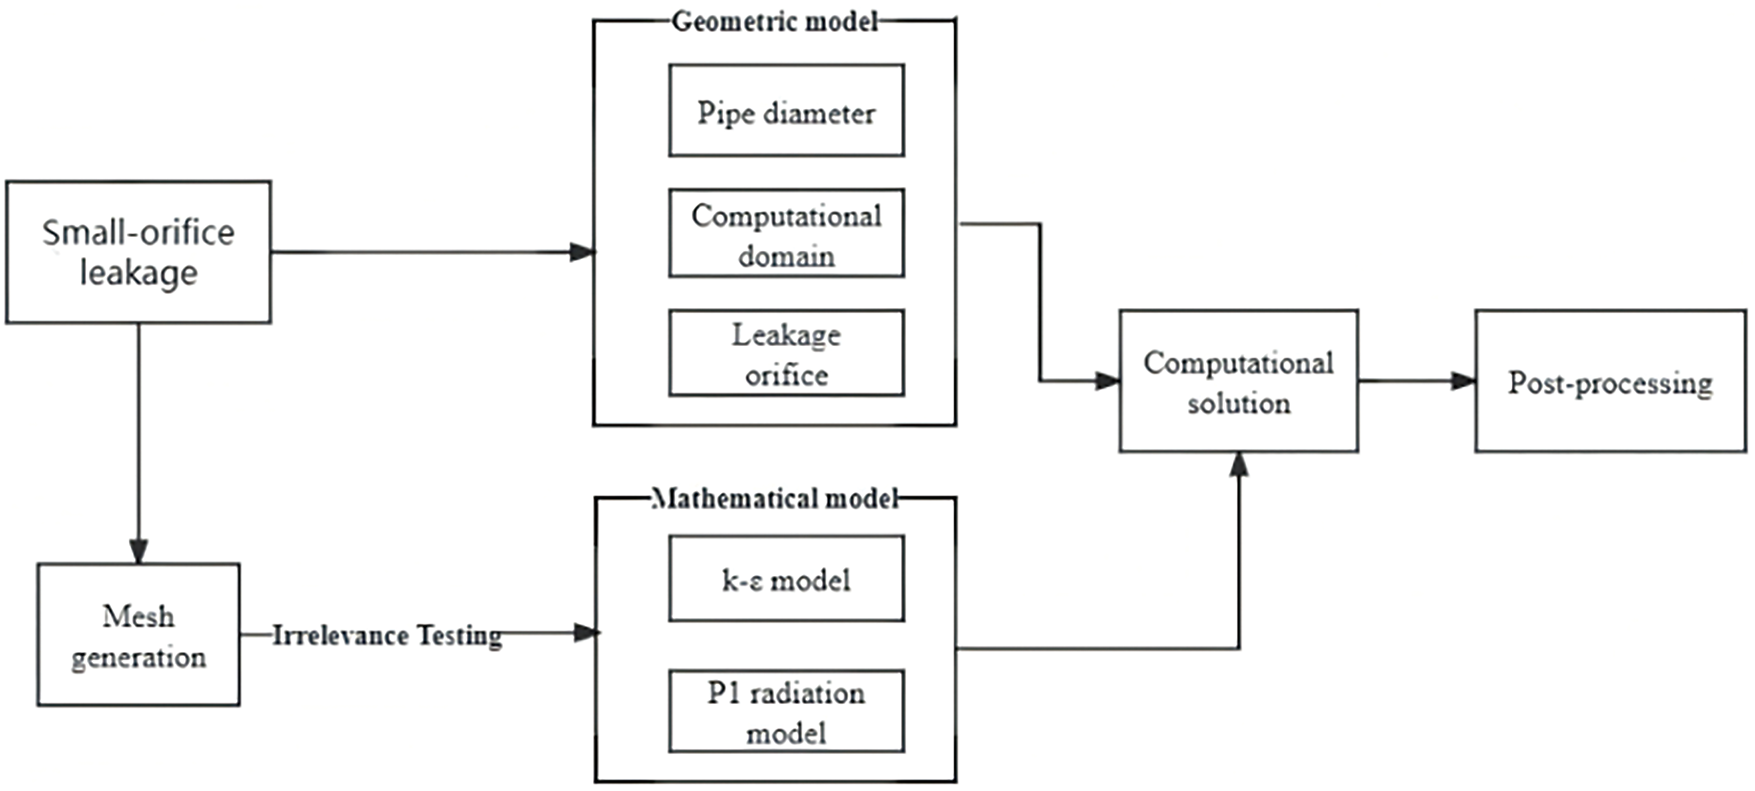
Figure 3: Finite element analysis (FEA) conceptual diagram
According to the pipeline specifications, the parallel natural gas pipelines have an outer diameter of 1016 mm and a wall thickness of 22.9 mm, operating at a pressure of 8 MPa and a temperature of 293 K. The adjacent crude oil pipeline has a diameter of 813 mm and a wall thickness of 28.6 mm, operating under the same pressure but at 300 K. Both pipelines are constructed from X70-grade steel and are buried at a depth of 1 m, with a horizontal spacing of 2 m between them.
The simulation adopts a three-dimensional domain composed of four regions: air, natural gas pipeline, leakage orifice, and crude oil pipeline. The computational domain spans 50 m in length, 20 m in width, and 20 m in height. As shown in Fig. 4a, the natural gas pipeline is positioned on the left and the crude oil pipeline on the right. A circular leakage orifice with a diameter of 50 mm is located at the midpoint (10 m) of the natural gas pipeline and is oriented horizontally (0° angle), as depicted in Fig. 4b. This configuration is derived from historical pipeline failure data.
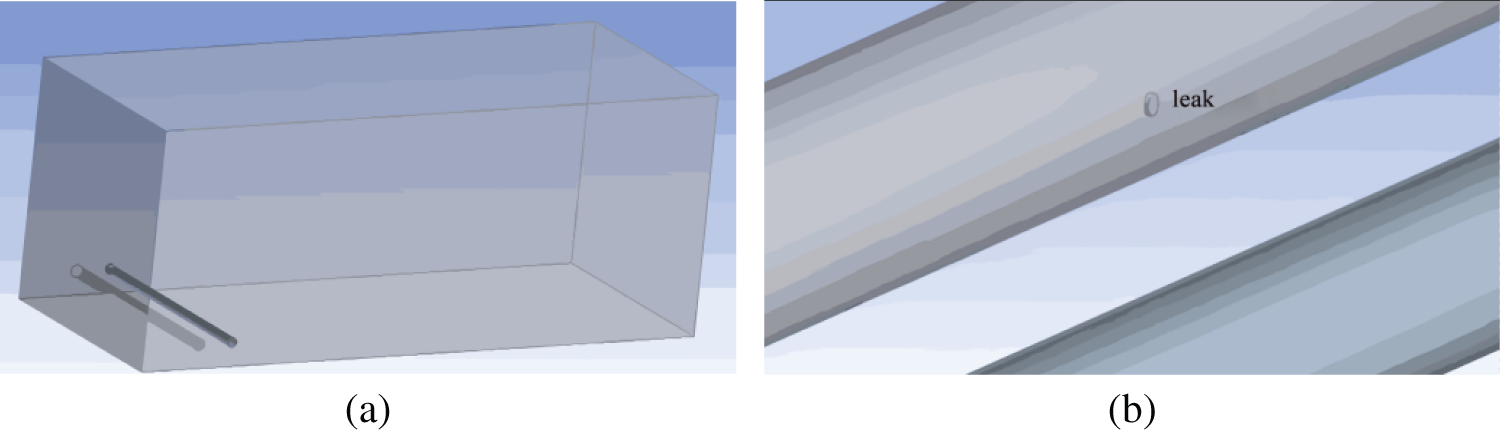
Figure 4: Natural gas pipeline modelling diagram. (a) Schematic diagram of the geometric domain. (b) Enlarged view of the natural gas pipeline leak orifice
The parallel pipeline system consists of natural gas pipelines (1016 mm outer diameter, 22.9 mm wall thickness, X70 steel) operating at 8 MPa and 293 K, and crude oil pipelines (813 mm outer diameter, 28.6 mm wall thickness, X70 steel) operating at 8 MPa and 300 K. Both pipelines are buried at a depth of 1 m with a horizontal spacing of 2 m between them.
The simulations are conducted within a three-dimensional computational domain measuring 50 m × 20 m × 20 m, comprising four coupled regions: air, natural gas pipeline, leakage orifice, and crude oil pipeline. As shown in Fig. 4a, the natural gas pipeline is positioned on the left and the crude oil pipeline on the right. A leakage orifice with a diameter of 50 mm is located at the 10 m midpoint of the natural gas pipeline and oriented perpendicular to its surface, as illustrated in Fig. 4b. This setup is based on documented historical pipeline failure cases.
High-velocity gas leakage induces steep pressure and velocity gradients near the orifice. To accurately capture these effects, local mesh refinement was applied at the leakage region, with a minimum cell size of 0.02 m. Grid independence was verified using four mesh resolutions: 0.5 million, 0.9 million, 1.29 million, and 1.8 million elements. Pressure predictions stabilized beyond 1.29 million elements, with differences remaining below 0.5%, consistent with the convergence threshold proposed by Wang et al. [25]. Fig. 5 presents the final mesh configuration: (a) an overview of the global domain, and (b) local refinement around the leakage interface.
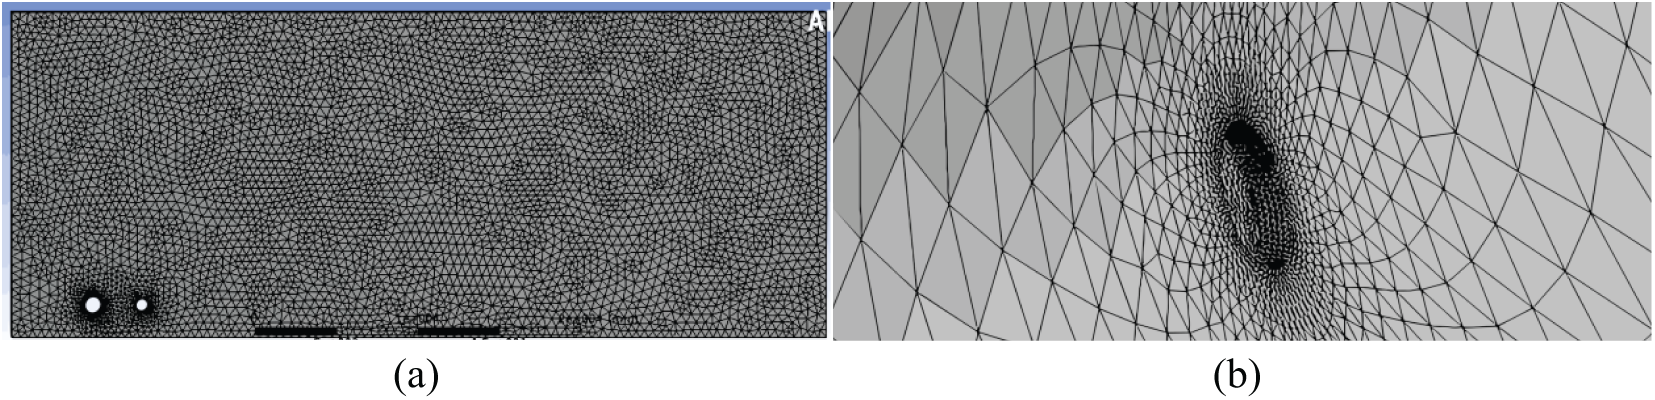
Figure 5: Grid division results. (a) Global mesh generation results. (b) Leak orifice mesh refinement results
The simulation results depend on these factors: air temperature, wind speed and direction, leak speed, leak hole size, leak direction, distance between pipelines, Table 1 shows all the simulation parameters.
ANSYS Fluent offers multiple turbulence models for complex flow simulation. The standard k-ε model prevails in combustion analysis due to its proven robustness across diverse engineering applications. Given the buoyancy-driven flow characteristics inherent in jet fire phenomena, full incorporation of buoyancy effects is essential for accurate simulation. The selection of this turbulence framework ensures consistency with the underlying governing equations derived from the k-ε formulation.
where Gk is turbulent kinetic energy production term due to mean velocity gradients, C1ε and C2ε are empirical constants, σk and σε are Turbulent Prandtl Numbers for kinetic energy and dissipation rate. For an incompressible fluid, the empirical constants are: C1ε = 1.44, C2ε = 1.92, σk = 1, σε = 1.3.
The P1 radiation model was used due to its effectiveness in combustion, heat transfer, and thermal coupling analyses [26]. Its governing equation is:
where qr represents radiative heat flux (unit: W), a denotes the material absorption coefficient, σs is the diffusion coefficient, σ is the diffusion coefficient.
The gas leakage orifice is defined as a pressure-inlet boundary condition to simulate the overpressure release mechanism. All external pipe surfaces are modeled as impermeable walls with no-slip conditions [27]. The base of the computational domain surrounding the pipeline is also assigned a wall boundary condition to enforce fluid containment. Lateral boundaries of the fluid domain are designated as pressure-outlet boundaries at ambient atmospheric pressure, with the exception of the left-side interface, which is specified as a velocity-inlet boundary to represent ambient air inflow. Within the parallel piping system, pressure boundary conditions are applied to the internal wall surfaces to account for the influence of internal pressurization on flow dynamics.
The numerical simulations show how gas pipeline leaks affect nearby c rude oil pipelines. See Figs. 6 and 7.
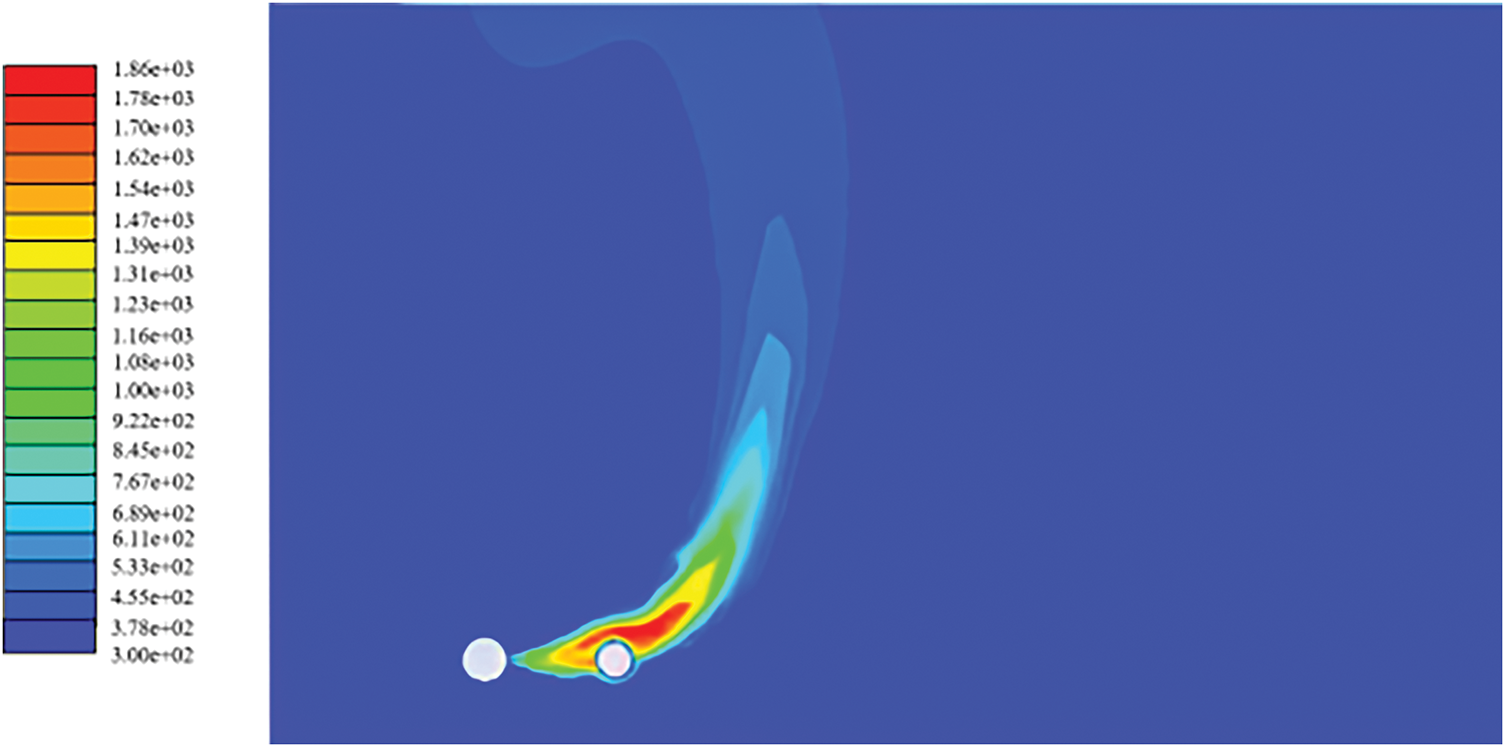
Figure 6: Cloud view of natural gas combustion temperature field at the leakage port
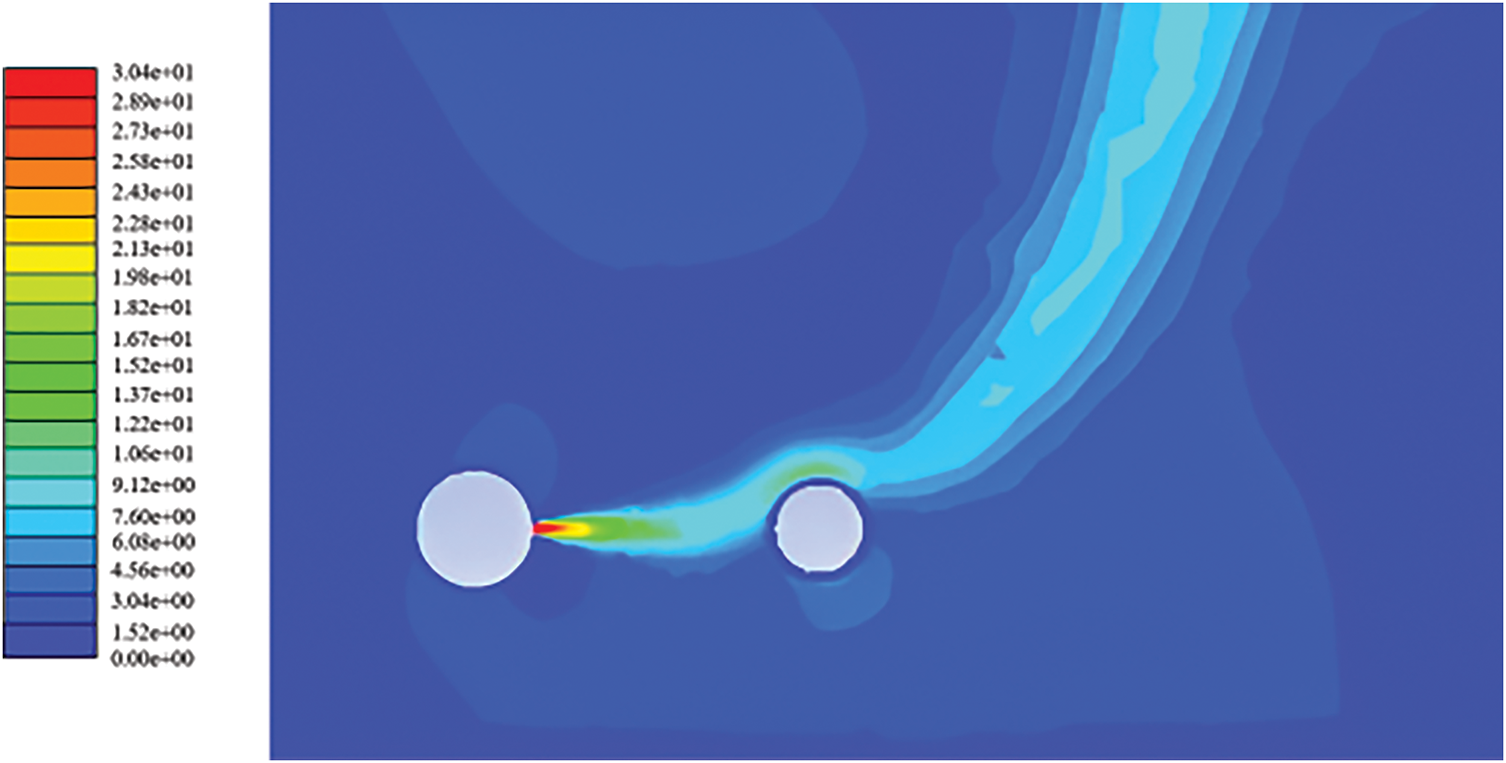
Figure 7: Cloud view of natural gas combustion velocity field at the leakage vent
Fig. 5 indicates a maximum jet fire temperature of 1860 K (1587°C). At 2 m pipeline spacing, the crude oil pipeline resides within the peak thermal region (Fig. 6), experiencing maximal radiative/convective heat flux. Conversely, temperatures remain suppressed near the leakage orifice [28] due to insufficient residence time for complete combustion—high gas velocity (304 m/s, Fig. 7) limits turbulent mixing with ambient air. Flow deceleration occurs at the oil pipeline interface, where viscous effects dominate momentum transfer. Flow separation develops upon impingement, creating accelerated upper-hemisphere streamlines and significant velocity reduction.
A quantitative analysis of thermal stress distribution in the crude oil pipeline was conducted. The resultant stress arises from four distinct mechanisms: (1) ambient atmospheric pressure acting on the external surface, (2) internal gas pressure within the parallel piping system, (3) radiative heat flux from the combustion source, and (4) transient temperature gradients induced by the fire. The computed stress distribution is illustrated in Fig. 8.
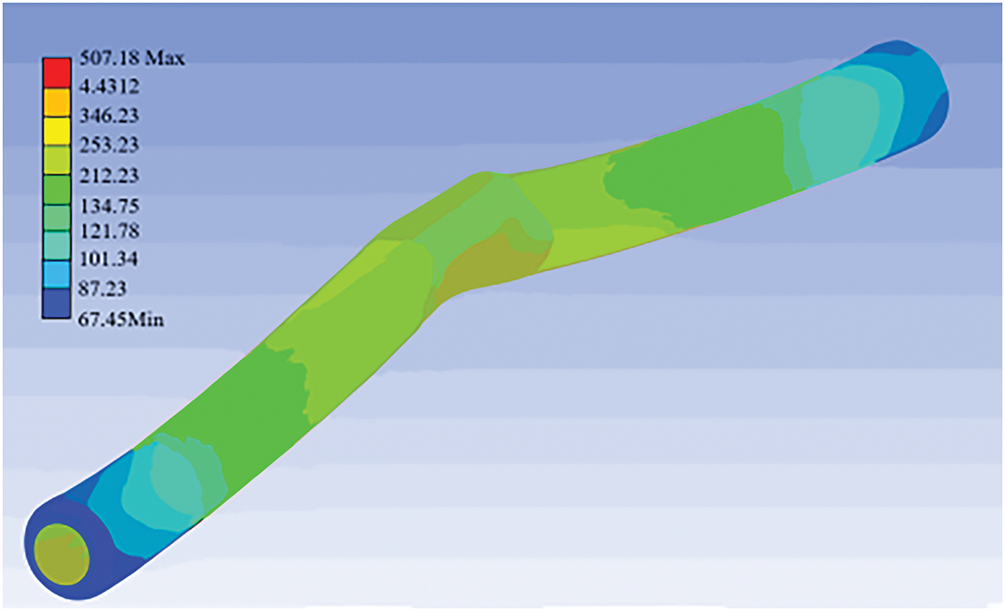
Figure 8: Pipe equivalent stress diagram
As depicted in Fig. 8, peak stress (507 MPa) localizes within the flame impingement zone. This exceeds the permissible thermal stress limit of 453 MPa derived from Eq. (10), which equates to the critical yield stress threshold for structural integrity assessment [29].
where [σ]c represents the allowable stress of pipeline material under cold conditions (Pa), [σ]h denotes the allowable stress under hot conditions (Pa), and f is the stress reduction factor determined by the total number of thermal cycles during pipeline service.
An idealized pipeline leakage scenario was modeled under controlled operating conditions. The leakage orifice was fixed in both geometry and size to eliminate the effects of variable aperture dimensions on flow behavior. In the initial analysis, the yield stress of the crude oil pipeline was determined based on standardized material properties. A subsequent parametric study quantified the influence of four key design parameters: inter-pipeline spacing, internal pressure, wall thickness, and nominal pipeline diameter.
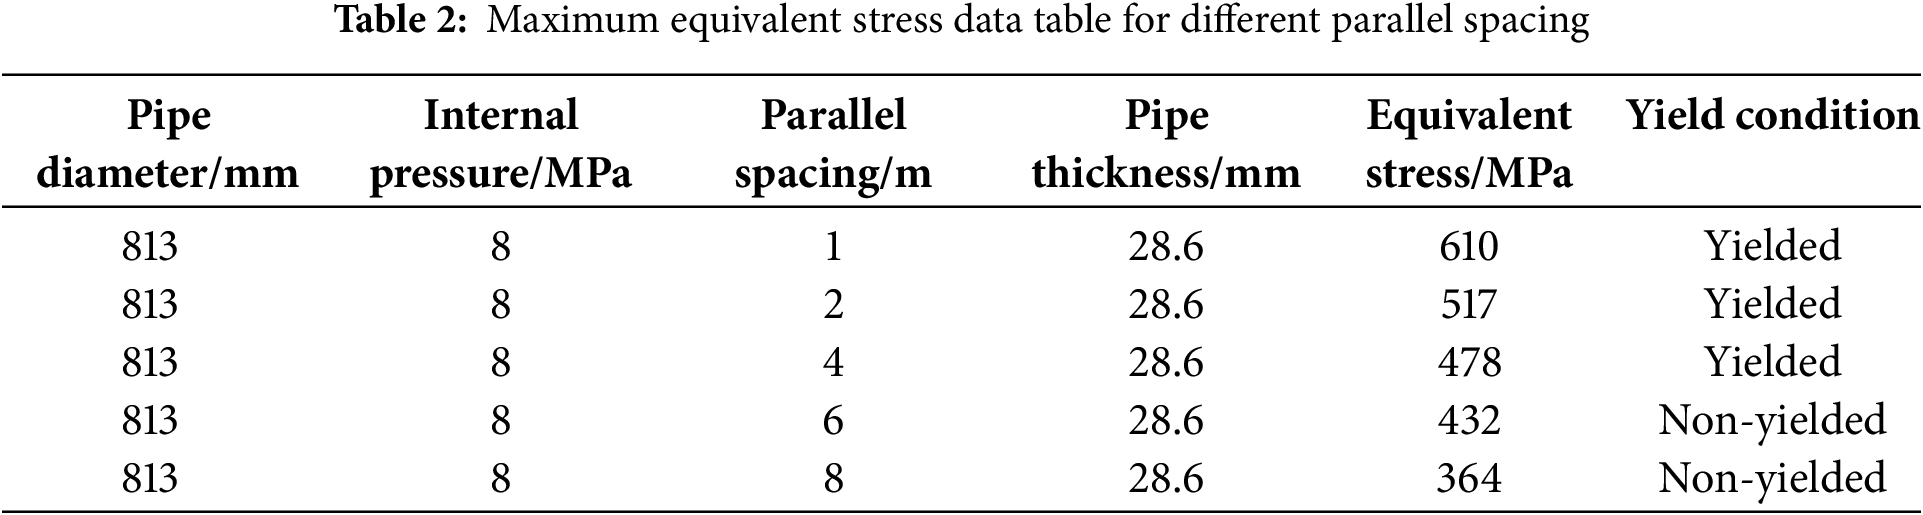
The parallel spacing was selected as the variable parameter with values of 1, 2, 4, 6, and 8 m for the simulation study of the crude oil pipeline. The equivalent thermal stress distribution of the pipeline is shown in Fig. 9.
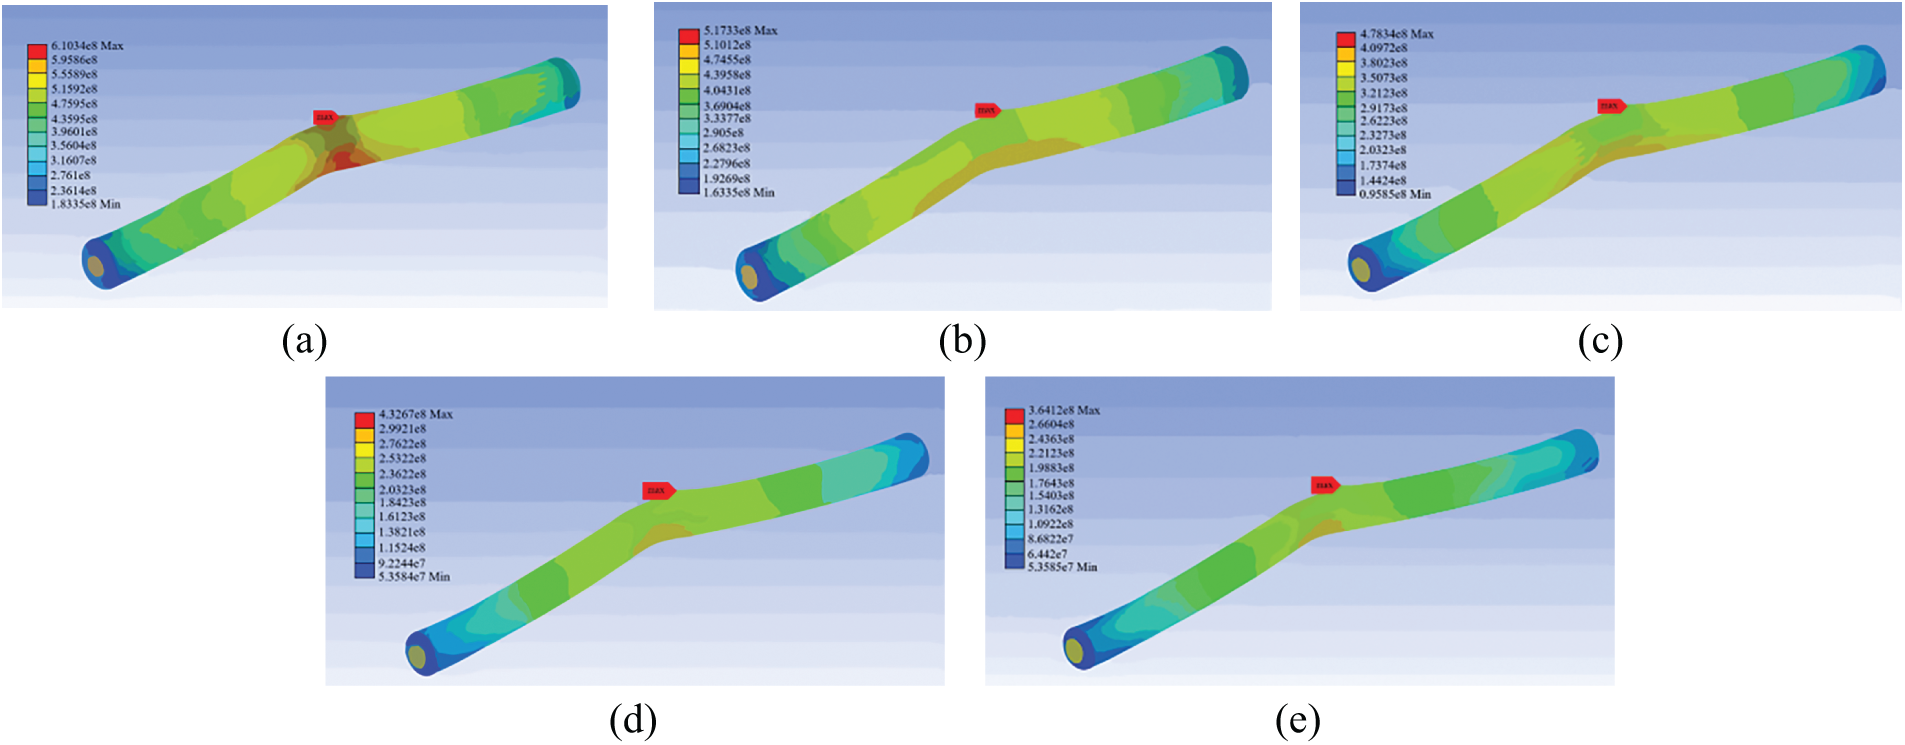
Figure 9: Maximum equivalent stress cloud of pipeline with different parallel spacing. (a) 1 m. (b) 2 m. (c) 4 m. (d) 6 m. (e) 8 m
The results indicate that increasing the spacing between parallel pipelines reduces aerodynamic obstruction to the jet flame, thereby promoting greater plume expansion and longer flame projection. Improved fuel–air mixing elevates the buoyant flame tip, shifting the thermal impact zone upward along the surface of the adjacent pipeline. As a result, the radiation-affected area and intensity are reduced, despite the peak flame temperature remaining nearly constant. The radiation intensity at the pipeline surface decreases with larger spacing, leading to lower thermal exposure. Table 2 summarizes the peak von Mises stress values under different spacing configurations.
The simulation results provide the maximum equivalent stresses on pipelines at different parallel spacing distances, with the corresponding curve plotted in Fig. 10.
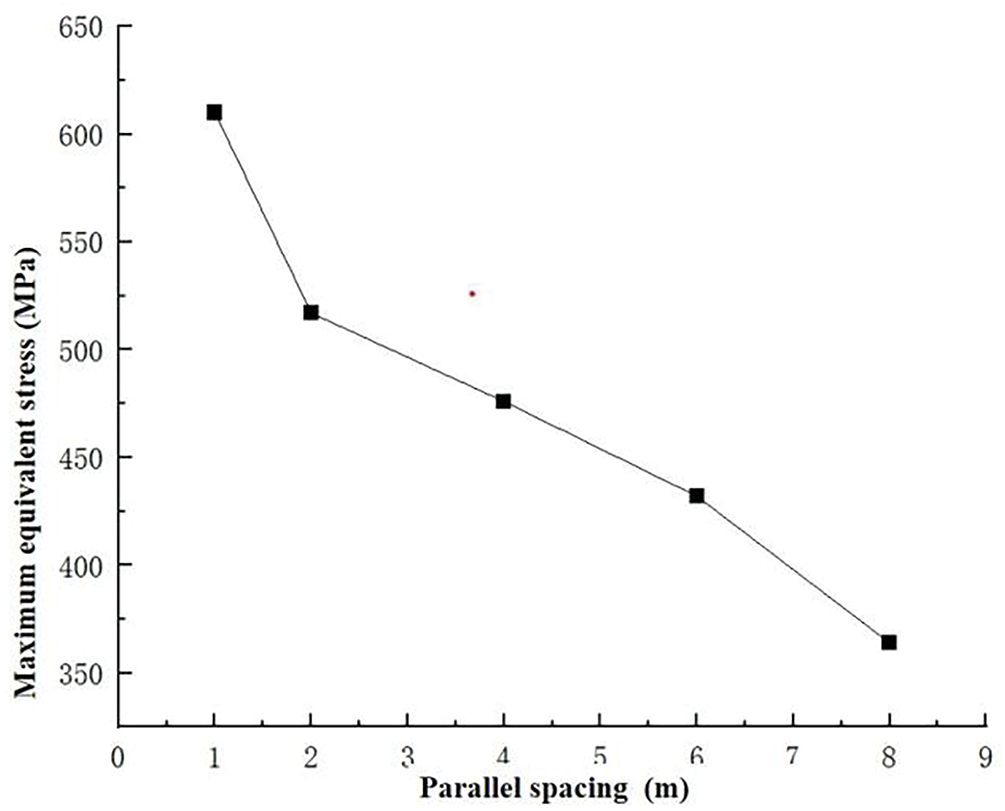
Figure 10: Maximum equivalent force diagram for different parallel spacing
The functional relationship between maximum equivalent stress and parallel spacing was derived by fitting the five datasets, expressed as follows:
where y is maximum equivalent stress in the pipeline (MPa) and x is parallel spacing (m).
The crude oil pipeline’s allowable thermal stress is 453 MPa. Based on the fitting results, when the parallel spacing reaches 4.85 m, the stress meets this yield limit.
A parametric study was conducted to investigate the influence of internal pressure on thermal stress distribution in the crude oil pipeline. Five distinct pressure levels (4, 6, 8, 10, and 12 MPa) were systematically evaluated as simulation variables. The corresponding maximum stress values induced by radiative heat exposure from the combustion source are presented in Table 3, demonstrating the pressure-dependent response of the pipeline under fire-induced thermal loading.
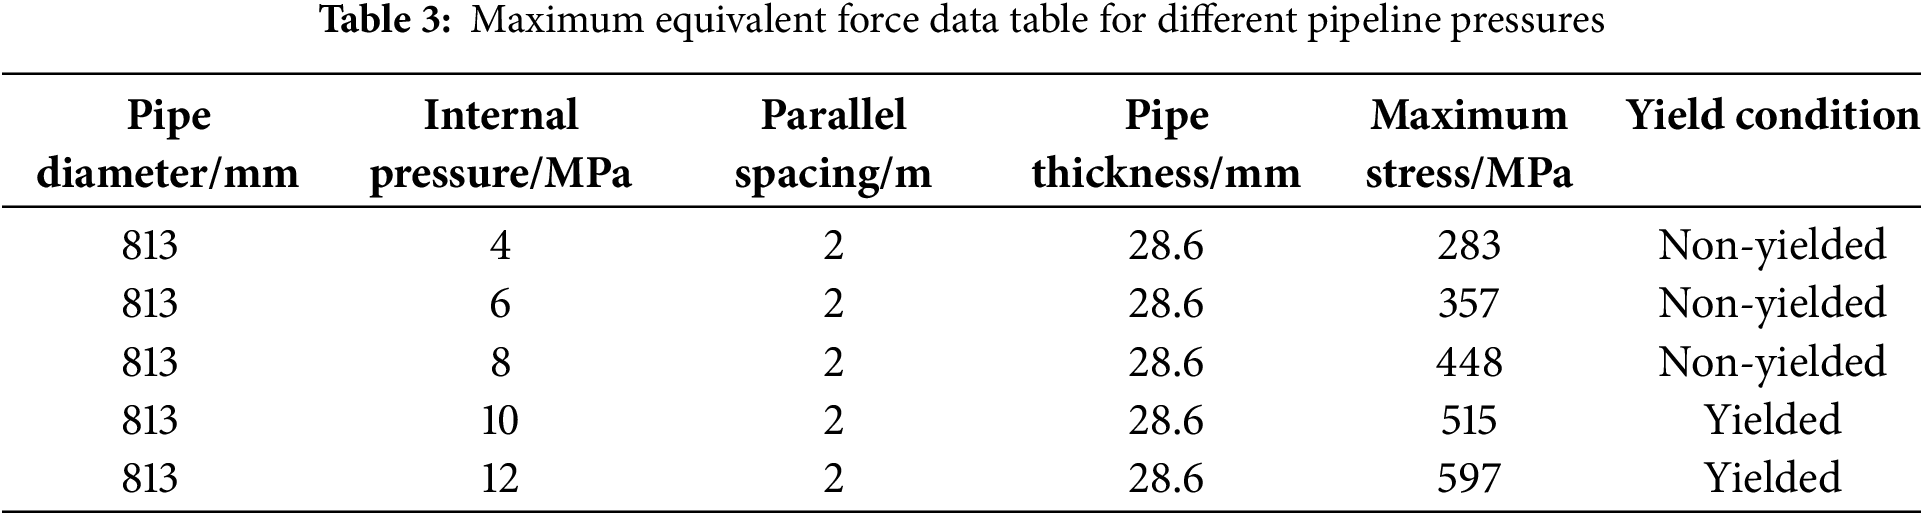
Results indicate a near-linear proportionality between crude oil pipeline pressure (4–12 MPa) and peak von Mises stress (283–597 MPa). This monotonic stress increase primarily governs elevated pressure differentials across the pipeline wall. Structural yielding initiates when internal pressure exceeds 10 MPa.
Fig. 11 shows how the pipeline’s maximum stress changed under different pressures due to fire radiation.
Figure 11: Maximum equivalent force diagram at different pipeline pressures
The functional relationship between peak equivalent stress and parallel spacing was derived through curve-fitting five discrete spacing cases, expressed as:
where y is maximum equivalent stress in the pipeline (MPa) and x is parallel spacing (m).
The calculations using the allowable stress formula and fitting equation show the maximum safe pipeline pressure is 8.28 MPa. If the parallel pipelines reach this pressure, jet fires will make the pipeline fail.
Parametric simulations assessed the impact of pipeline wall thickness on jet fire characteristics. Five thickness variants (15, 20, 25, 30, and 35 mm) were systematically evaluated. Table 4 quantifies flame propagation dynamics and thermal load distributions, highlighting the thickness-dependent high-temperature structural response under high-pressure leakage conditions.
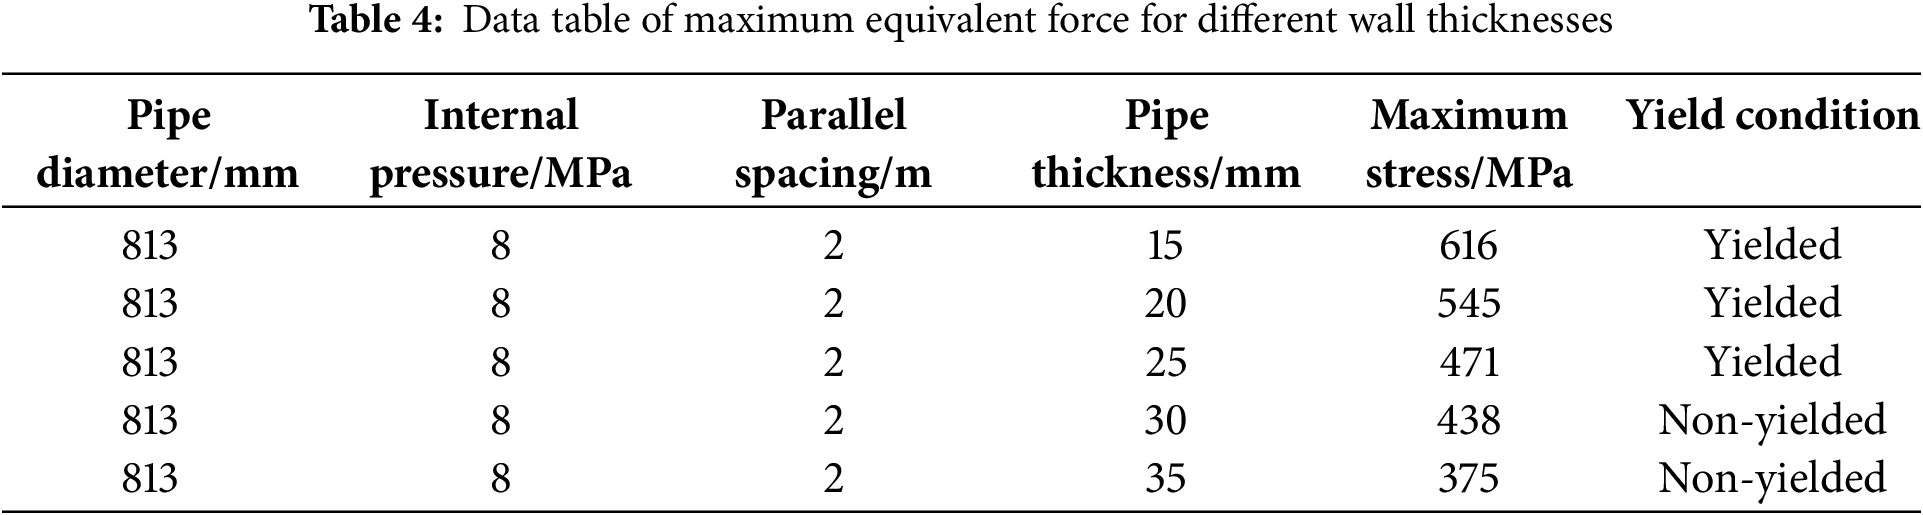
Results demonstrate a near-linear reduction in peak von Mises stress from 616 to 375 MPa as wall thickness increased from 15 to 35 mm. Enhanced thermal insulation in thicker walls accounts for this stress attenuation. Structural failure initiates when wall thickness decreases to 30 mm.
Fig. 12 illustrates the variation of peak von Mises stress as a function of wall thickness derived from computational simulations.
Figure 12: Maximum equivalent force diagram for different wall thicknesses
The functional relationship between maximum equivalent stress and parallel spacing was derived by fitting the five datasets, expressed as follows:
where y is maximum equivalent stress in the pipeline (MPa) and x is parallel spacing (m).
Computational analysis employing the allowable stress formulation and fitting equation determines 453 MPa as the permissible thermal stress threshold. The fitted relationship indicates that at 27.8 mm wall thickness, pipeline stress converges to this yield limit.
Pipeline diameter was evaluated as a key design variable, with computational simulations performed at nominal diameters of 400, 500, 600, 800, and 1000 mm. Table 5 documents the resultant peak von Mises stress values across these diameter configurations.
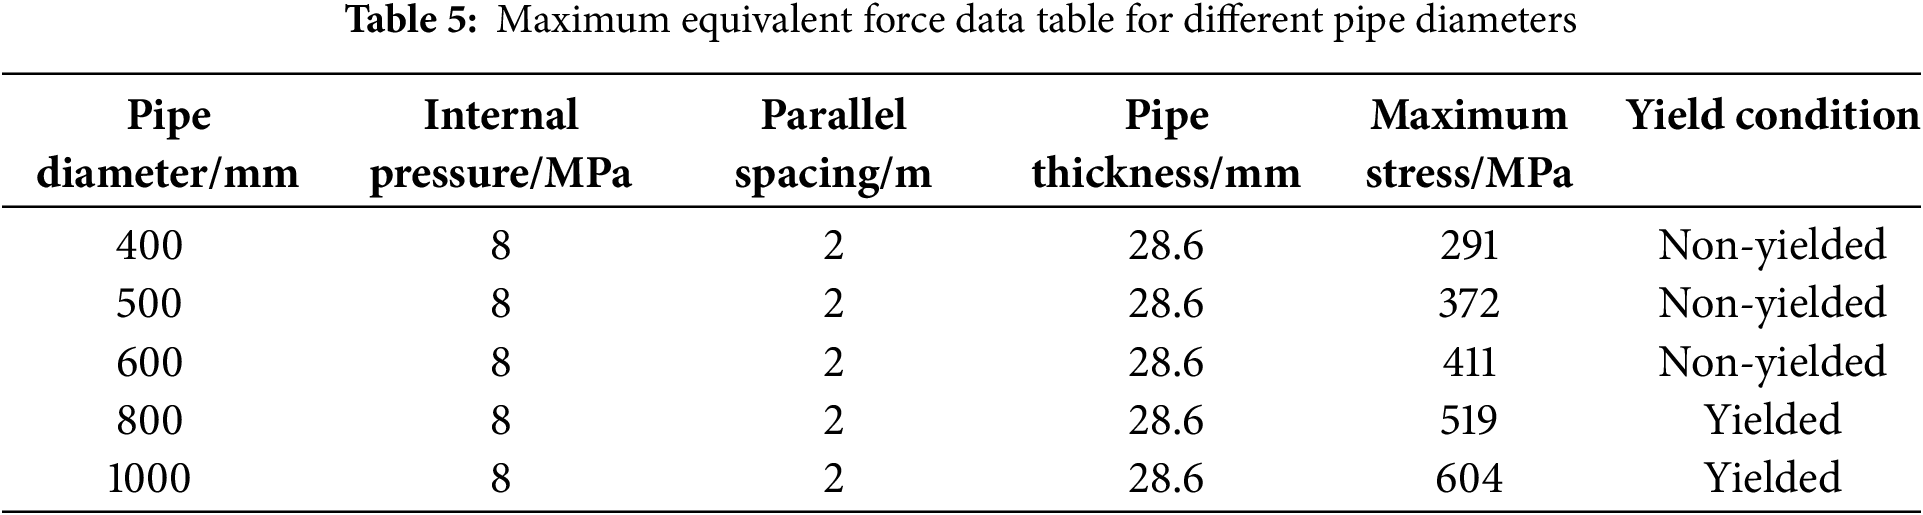
Results indicate a monotonic increase in peak von Mises stress from 291 to 604 MPa as pipe diameter escalates from 400 to 1000 mm. This stress amplification stems from greater heat-exposed surface area in larger diameters, which reduces structural stability under direct flame impingement. Structural yielding was observed at 800 mm diameter.
Fig. 13 plots the simulated peak von Mises stresses for parallel pipeline configurations across the diameter range.
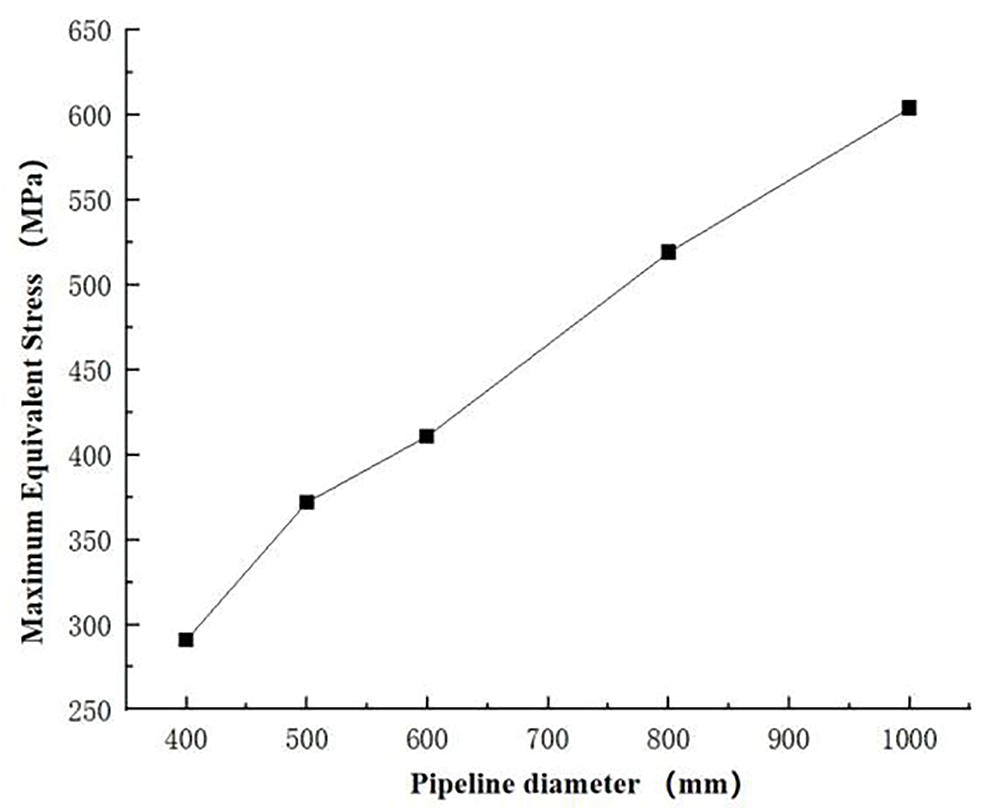
Figure 13: Maximum equivalent force diagram for different pipe diameters
To quantify the diameter-dependent stress response, a mathematical correlation was established between pipe diameter and maximum von Mises stress. The derived functional relationship takes the form:
where y is maximum equivalent stress in the pipeline (MPa) and x is parallel spacing (m).
Empirical analysis defines a critical pipe diameter threshold of 734 mm under prescribed operational conditions. High-fidelity simulations confirm this diameter as the fail-safe limit—establishing the structural integrity boundary for design-basis accident scenarios.
A systematic investigation was conducted to evaluate the influence of multiple operational parameters on parallel pipeline systems through single-factor sensitivity analysis. This methodology quantitatively assesses the variation in maximum von Mises stress of the pipeline structure under incremental variations of individual parameters [30].
where αi is the sensitivity coefficient of a particular variable, Δσ denotes the variation in peak equivalent stress of the pipeline caused by factor Δf, σ is the peak equivalent stress of the pipeline (MPa), Δf indicates the variation range of the influencing factor, f represents the nominal value of the influencing factor.
Sensitivity coefficients are defined as positive when peak von Mises stress exhibits positive correlation with a given factor, and negative when inversely correlated. The magnitude of each coefficient quantifies the relative impact magnitude on pipeline structural response.
A comprehensive parametric study imposed incremental variations (±5%, ±10%, ±15%, ±20%) on four critical factors within the finite element framework. Table 6 lists resultant sensitivity coefficients across these mechanically significant perturbations.
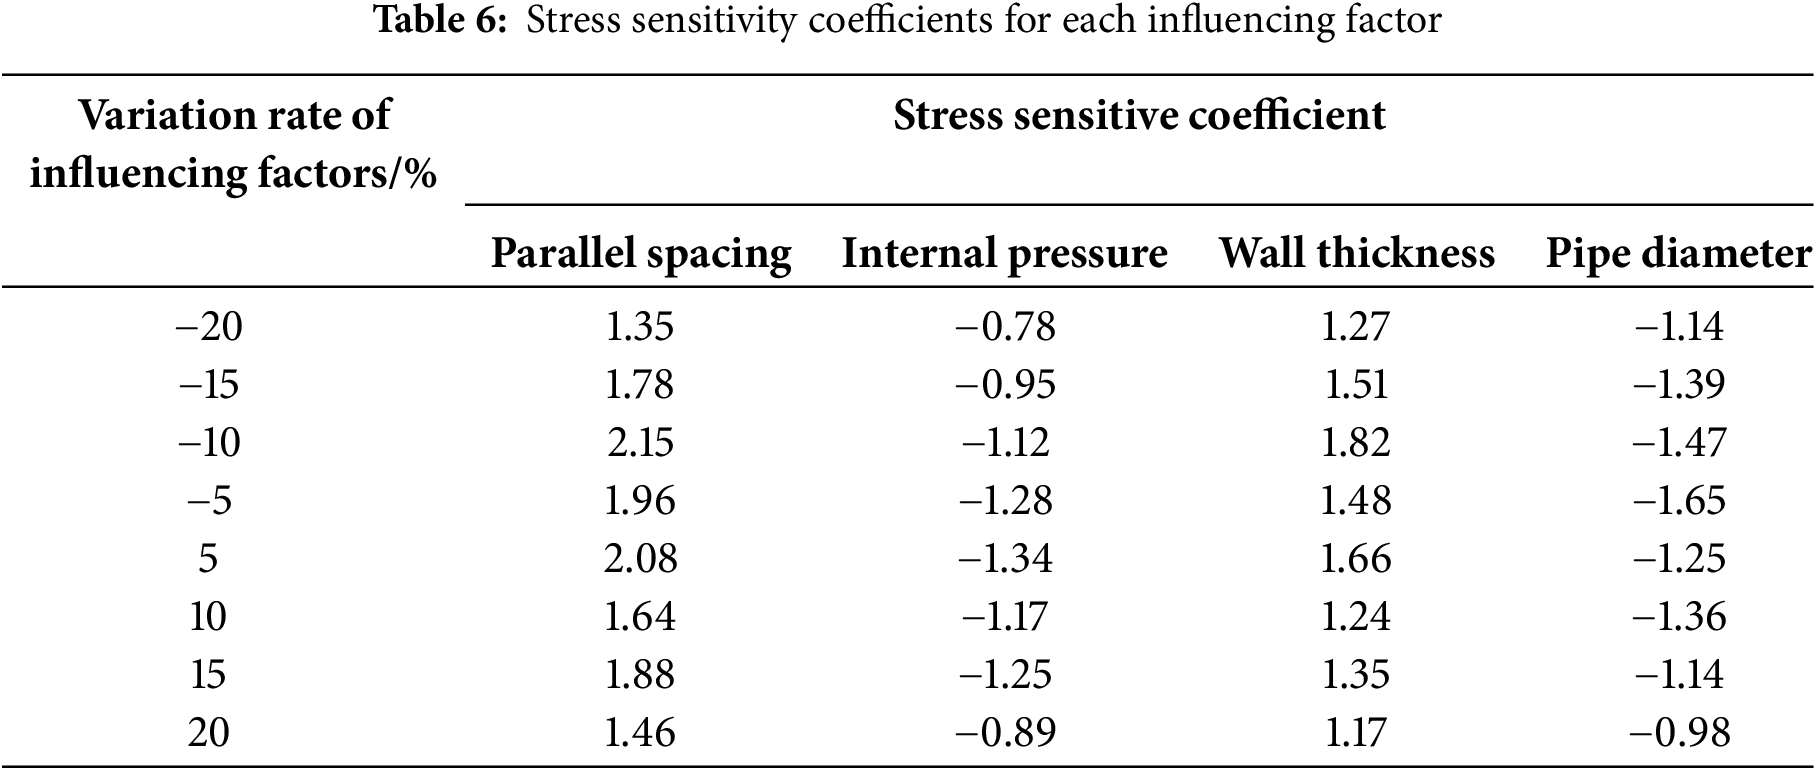
Fig. 13 shows how stress sensitivity coefficients change with different variation rates of the influencing factors.
The data in Table 6 and Fig. 14 indicate that parallel spacing and wall thickness consistently exhibit positive stress sensitivity coefficients, while pipe diameter and internal pressure show uniformly negative values. Within the 5%–20% perturbation range, these coefficients remain relatively stable and display near-symmetrical distribution patterns. Notably, parallel spacing exhibits the highest sensitivity, with a coefficient magnitude of 2.15.
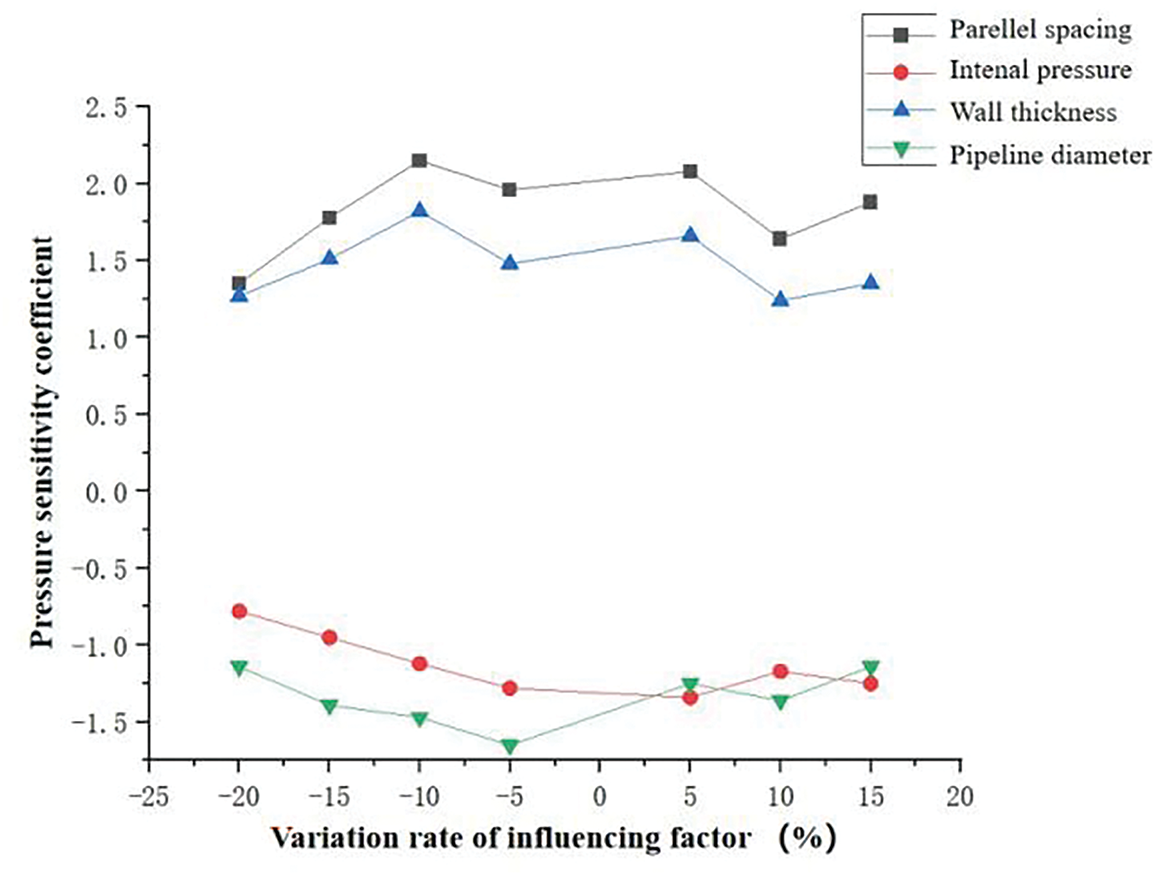
Figure 14: Stress sensitivity coefficients plotted against rate of change of influencing factors
A comparative analysis under equivalent perturbation amplitudes (5%–20%) establishes the following order of influence on the maximum von Mises stress: parallel spacing is the dominant factor, followed by wall thickness, pipe diameter, and internal pressure, which has the least effect.
A computational framework was developed by integrating small-orifice leakage theory with the thermodynamic modules of ANSYS Fluent to quantify thermal stress distributions in pipelines under yielding conditions using finite element analysis. A systematic parametric study was carried out to investigate the effects of four key design variables—inter-pipeline spacing, internal pressure, wall thickness, and nominal diameter—within defined operational ranges. Sensitivity coefficients obtained through dimensional analysis were used to evaluate the response of each parameter.
To capture the thermal loading induced by jet flames following natural gas pipeline failures, a radiation transfer–based numerical model was established. Taking into account both cold and hot allowable stress limits, the permissible thermal stress threshold for crude oil pipelines was identified as 453 MPa.
A total of 20 operational scenarios were simulated to examine the failure-critical influence of the four parameters on the structural integrity of parallel pipeline systems. The results revealed consistent stress response patterns and, through regression analysis, yielded the following yield-limit safety thresholds:
1. Minimum parallel spacing: 4.85 m
2. Minimum wall thickness: 27.8 mm
3. Maximum pipe diameter: 734 mm
4. Maximum internal pressure: 8.28 MPa
These design parameters define critical structural integrity boundaries, validated using finite element–based yield criteria. A systematic sensitivity analysis was performed on four key parameters—inter-pipeline spacing, wall thickness, nominal diameter, and internal pressure—to quantify their effects on von Mises stress in parallel pipeline systems. The hierarchical importance of these parameters, determined through regression-derived sensitivity coefficients, reveals a descending order of influence: inter-pipeline spacing (most significant), followed by wall thickness, nominal diameter, and internal pressure (least significant).
For the structural design of buried parallel pipelines, optimizing inter-pipeline spacing is identified as the most effective strategy for enhancing safety margins. Secondary design improvements include increasing wall thickness or reducing nominal diameter, while operational measures such as moderate internal pressure reduction may serve as supplementary approaches to mitigate in-service stress concentrations.
The hierarchical sensitivity analysis quantifies the relative contribution of each parameter to von Mises stress. According to the regression-derived coefficients, parameter importance decreases in the following order:
1. Inter-pipeline spacing (most influential)
2. Wall thickness
3. Nominal diameter
4. Internal pressure (least influential)
For buried pipeline design, spacing optimization provides the most effective safety enhancement. Increasing wall thickness or reducing nominal diameter offer secondary improvements, while operational controls like pressure reduction help mitigate stress concentrations during service.
Based on current findings, several key research directions merit attention:
Experimental validation through full- or reduced-scale jet fire tests, incorporating simultaneous thermal and strain monitoring, is essential. This should specifically target verification of the critical 4.85 m spacing criterion under diverse leak scenarios.
Expanding the parametric database to encompass more complex conditions—such as simultaneous multi-point leaks or the synergistic effects of thermal cycling and corrosion—is warranted.
The methodology should be enhanced to incorporate time-dependent material behaviour, notably creep and fatigue under sustained thermal loads.
Collectively, such efforts would yield more comprehensive safety guidelines for practical pipeline engineering, grounded in rigorous theoretical principles.
Acknowledgement: Not applicable.
Funding Statement: The authors received no specific funding for this study.
Author Contributions: The authors confirm contribution to the paper as follows: Conceptualization and methodology, Zezhi Wen, Kai Zhang; formal analysis, Zezhi Wen, Kai Zhang; writing—original draft preparation: Zezhi Wen; writing—review and editing, Zezhi Wen, Kai Zhang, Liqiong Chen, Zijian Xiong; project administration, Shanlin Liang. All authors reviewed the results and approved the final version of the manuscript.
Availability of Data and Materials: Data available on request from the authors.
Ethics Approval: Not applicable.
Conflicts of Interest: The authors declare no conflicts of interest to report regarding the present study.
References
1. Yang K, Lü SR, Gao JC, Hu F, Pang L. Research on the disaster-resulting mechanism of the multi-factors in addition to the urban gas pipeline leakage. J Saf Environ. 2018;18(2):576–82. (In Chinese). doi:10.13637/j.issn.1009-6094.2018.02.031. [Google Scholar] [CrossRef]
2. Zhang H. To implement the pipeline integrity management by learning from Huangdao accident. Oil Gas Storage Transp. 2014;33(11):1171–3. (In Chinese). [Google Scholar]
3. Zhang S, Cao Y, Tang J, Zou Y, Shi H, Salzano E, et al. A data-driven approach for jet fire prediction of hydrogen blended natural gas pipelines. Reliab Eng Syst Saf. 2025;256:110748. doi:10.1016/j.ress.2024.110748. [Google Scholar] [CrossRef]
4. Lyu X, He T, Liao K, Wang Y, Zhang H, Jiang X, et al. Quantitative study on thermal-mechanical failure of overhead steel pipelines under natural gas jet fire. Int J Press Vessels Pip. 2024;212:105350. doi:10.1016/j.ijpvp.2024.105350. [Google Scholar] [CrossRef]
5. Li M, Wang Z, Jiang J, Lin W, Ni L, Pan Y, et al. Numerical simulation and consequence analysis of full-scale jet fires for pipelines transporting pure hydrogen or hydrogen blended with natural gas. Fire. 2024;7(6):180. doi:10.3390/fire7060180. [Google Scholar] [CrossRef]
6. He Q, Gu M, Król A, Król M, Huang X, Tang F. Pipeline leak jet fire thermal characteristic induced by hydrogen-blended natural gas: physical modeling of temperature profile based on virtual origin theory. Int J Therm Sci. 2023;188:108220. doi:10.1016/j.ijthermalsci.2023.108220. [Google Scholar] [CrossRef]
7. Mo L, Bian J, Zhang S, Qin R, Xiao S, Jiang M, et al. Thermal response of adjacent pipelines exposed to HBNG jet fire. Int J Hydrogen Energy. 2025;113:220–30. doi:10.1016/j.ijhydene.2025.02.488. [Google Scholar] [CrossRef]
8. Lin Y, Ling X, Yu A, Liu Y, Liu D, Wang Y, et al. Modeling of hydrogen dispersion, jet fires and explosions caused by hydrogen pipeline leakage. Fire. 2024;7(1):8. doi:10.3390/fire7010008. [Google Scholar] [CrossRef]
9. Xu D, Lu L, Wang Z, Zhang L, Pan X, Jiang J. Experimental study on the influence of ignition position on the overpressure of hydrogen jet flame. ACS Omega. 2024;9(36):37869–81. doi:10.1021/acsomega.4c03651. [Google Scholar] [PubMed] [CrossRef]
10. Zhao C, Li X, Wang X, Li M, Xiao H. An experimental study of the characteristics of blended hydrogen-methane non-premixed jet flames. Process Saf Environ Prot. 2023;174:838–47. doi:10.1016/j.psep.2023.04.041. [Google Scholar] [CrossRef]
11. Fu X, Yan X, Chen S, Song C, Xiao Z, Luo H, et al. Hydrogen jet flame simulation and thermal radiation damage estimation for leakage accidents in a hydrogen refueling station. Fire. 2024;7(7):210. doi:10.3390/fire7070210. [Google Scholar] [CrossRef]
12. Mazzola A. Thermal interaction analysis in pipeline systems. J Loss Prev Process Ind. 1999;12(6):495–505. doi:10.1016/s0950-4230(99)00022-4. [Google Scholar] [CrossRef]
13. Liu W, Zhang P, Wang J, Li Y, Yang Q, Liu S. Multi-conditional dynamic response of parallel multi-pipelines in the same tunnel based on leakage and explosion conditions—a case study of China-Myanmar tunnel pipelines. Int J Press Vessels Pip. 2024;208:105145. doi:10.1016/j.ijpvp.2024.105145. [Google Scholar] [CrossRef]
14. He T, Jiang X, Wang Y, Liao J, Leng J, Chen D, et al. Experimental research on the thermal and mechanical response of flowing pipelines under the horizontal jet flame. Process Saf Environ Prot. 2024;185:36–52. doi:10.1016/j.psep.2023.11.004. [Google Scholar] [CrossRef]
15. Besiktas R, Baltaci H, Akkoyunlu BO. Simulation of the jet fire using atmospheric dispersion modeling (ALOHAa case study of natural gas pipeline in Istanbul, türkiye. Atmosphere. 2024;15(4):456. doi:10.3390/atmos15040456. [Google Scholar] [CrossRef]
16. Mashhadimoslem H, Ghaemi A, Palacios A, Almansoori A, Elkamel A. Machine learning modelling and evaluation of jet fires from natural gas processing, storage, and transport. Can J Chem Eng. 2023;101(8):4416–28. doi:10.1002/cjce.24805. [Google Scholar] [CrossRef]
17. Lowesmith BJ, Hankinson G, Acton MR, Chamberlain G. An overview of the nature of hydrocarbon jet fire hazards in the oil and gas industry and a simplified approach to assessing the hazards. Process Saf Environ Prot. 2007;85(3):207–20. doi:10.1205/psep06038. [Google Scholar] [CrossRef]
18. Johnson AD, Brightwell HM, Carsley AJ. Model for predicting the thermal radiation hazards from large-scale horizontally released natural gas jet fires. Process Saf Environ Prot. 1994;72(3):157–66. doi:10.1016/0957-5820(94)87042-5. [Google Scholar] [CrossRef]
19. Lyu S, Zhang Y, Wang W, Ma S, Huang Y. Simulation study on influence of natural gas pipeline pressure on jet fire. IOP Conf Ser: Earth Environ Sci. 2019;242:022041. doi:10.1088/1755-1315/242/2/022041. [Google Scholar] [CrossRef]
20. Li X, Sun T, Zhou N, Yun S, Yu Y, Zhang Y, et al. Numerical simulation of thermodynamic response law of chemical pipeline corridor under jet fire environment. J Loss Prev Process Ind. 2024;89:105278. doi:10.1016/j.jlp.2024.105278. [Google Scholar] [CrossRef]
21. Foroughi V, Cavini A, Palacios A, Albó K, Gueda A, Pastor E, et al. Domino effect by jet fire impingement in pipelines. Chem Eng Trans. 2019;77:931–6. doi:10.3303/CET1977156. [Google Scholar] [CrossRef]
22. Vijayan P, Sajeevan AC, Thampi GK, Palacios A. Experimental evaluation of subsonic-horizontal jet flames: impact of practical crack shapes. Fire Saf J. 2024;145:104127. doi:10.1016/j.firesaf.2024.104127. [Google Scholar] [CrossRef]
23. Feng YF, Wu M, Yan ML, Chen Y. Research progress in leakage models for gas pipelines. Contemp Chem Ind. 2011;12:1255–7. doi:10.13840/j.cnki.cn21-1457/tq.2011.12.025. [Google Scholar] [CrossRef]
24. Wu Q, Jiang P, Len SR, Guo PJ. Study on improved algorithm of leaking velocity in long-distance CNG pipe accident. China Prod Saf Sci Technol. 2012;9:38–42. [Google Scholar]
25. Sha GY, Han EH, Zhang XL, Xu YB, Liu L. Stress-strain behavior of X70 pipeline steel under stress wave loading. Chin J Mater Res. 2004;18(5):461–5. (In Chinese). [Google Scholar]
26. Deng PC, Xie XJ, Yang SQ, Zhang Y, Li Q. Numerical simulation on the thermal characteristics of liquid helium transfer lines by using different radiation models. Cryogenics Superconduct 2015;43(11):26–9. doi:10.16711/j.1001-7100.2015.11.006. [Google Scholar] [CrossRef]
27. Kong Y, Li Y, Wang S, Han H, Duan P, Yu X, et al. Experimental study on jet fire characteristics of hydrogen-blended natural gas. Int J Hydrog Energy. 2024;49:1250–60. doi:10.1016/j.ijhydene.2023.09.153. [Google Scholar] [CrossRef]
28. Li Y, Qian X, Zhang S, Sheng J, Hou L, Yuan M. Assessment of gas explosion risk in underground spaces adjacent to a gas pipeline. Tunn Undergr Space Technol. 2023;131:104785. doi:10.1016/j.tust.2022.104785. [Google Scholar] [CrossRef]
29. Zhang ZJ, Liu ZX, Zhang H, Meng SB, Shi JH, Zhao JW, et al. Spatial distribution and machine learning-based prediction model of natural gas explosion loads in a utility tunnel. Tunn Undergr Space Technol. 2023;140:105272. doi:10.1016/j.tust.2023.105272. [Google Scholar] [CrossRef]
30. Wang D, Qian X, Ji T, Jing Q, Zhang Q, Yuan M. Flammability limit and explosion energy of methane in enclosed pipeline under multi-phase conditions. Energy. 2021;217:119355. doi:10.1016/j.energy.2020.119355. [Google Scholar] [CrossRef]
Cite This Article
 Copyright © 2026 The Author(s). Published by Tech Science Press.
This work is licensed under a Creative Commons Attribution 4.0 International License , which permits unrestricted use, distribution, and reproduction in any medium, provided the original work is properly cited.
 Downloads
 Citation Tools