
 Submit a Paper
 Propose a Special lssue
 Open Access
SHORT COMMUNICATION

Seismic Optimization Method of Nuclear Power Crane Structure
School of Mechanical Engineering, Taiyuan University of Science and Technology, Taiyuan, 030024, China
* Corresponding Author: Jie Yuwen. Email:
(This article belongs to the Special Issue: Assessment, Monitoring and Optimization of Steel and Composite Structures against Seismic Events and Extreme Actions)
Structural Durability & Health Monitoring 2026, 20(1), . https://doi.org/10.32604/sdhm.2025.066572
Received 11 April 2025; Accepted 08 July 2025; Issue published 08 January 2026
 View Full Text
 Download PDF
Abstract
To address the neglect of seismic performance in conventional double-girder bridge crane optimization, this paper introduces a time-history analysis-based seismic optimization methodology for crane structures. Using a 25-t nuclear power crane as a case study, a bridge frame finite element model is established and validated through static analysis, confirming its accurate representation of the physical entity’s mechanical behavior. Furthermore, with bridge mass reduction as the objective and structural strength, stiffness, stability, and seismic mechanical performance as constraints, an optimization model is developed employing the Whale Optimization Algorithm (WOA).Keywords
The double girder overhead crane [1,2] serves as critical lifting equipment in production workshops, nuclear power facilities, and related fields. To enhance crane performance while reducing structural weight, structural optimization has become a key objective in engineering. Lin and Zhu [3] developed a lightweight design method for crane main girders using an improved rat swarm optimization algorithm, achieving a 20.72% reduction in girder weight. Dong et al. [4] proposed an optimization framework that precisely captures functional relationships between components and design parameters to realize lightweight metal structures. Li and Xing [5] employed genetic algorithms to optimize gantry crane main girders, reducing deadweight by 22.65%. Xu et al. [6] introduced a multi-objective design optimization method integrating an improved Gray Wolf Algorithm with Pattern Search. Weng et al. [7] established a robust optimization approach incorporating reliability analysis.
Xiao et al. [8] utilized an artificial hummingbird algorithm to optimize gantry crane main girder cross-sections, successfully obtaining lightweight designs that satisfy safety requirements. Jiao et al. [9] achieved main girder lightweighting for casting cranes by constructing a mathematical model based on the Whale Flock Optimization Algorithm (WFOA). Sun et al. [10] implemented particle swarm optimization for marine crane anti-sway devices, resulting in a 28.64% reduction in total structural weight post-optimization. Zhang et al. [11] accomplished lightweight designs for crane reach arms using Inspire and ANSYS (ANalytical SYStem), respectively. Lu and Wang [12] applied an improved algorithm to gantry crane main girder optimization, demonstrating a 14.84% mass reduction.
Traditional crane optimization methods primarily focus on structural lightweight design, whereas seismic considerations have received limited attention. Feau et al. [13] proposed a simplified finite element analysis model for cranes and conducted seismic analysis, utilizing a scaled-down model for experimental validation. Bismark et al. [14] performed time-history analysis of container cranes to investigate their seismic behavior. Seismic analysis constitutes the most critical element in the design verification of double girder overhead cranes intended for nuclear power applications and other critical uses.
Methods: Building upon this foundation, this paper proposes a seismic optimization framework for crane structures utilizing time-history analysis. This approach incorporates seismic resistance as optimization constraints, calculates corresponding seismic stresses through time-history analysis [15,16], and integrates soil-structure interaction (SSI) effects into the analytical system. This methodology overcomes the limitations of traditional fixed-base assumptions [17] while simultaneously satisfying strength, stiffness, and stability constraints to achieve structural lightweighting.
Furthermore, the latest concept of bridge resilience is adopted to enhance seismic design and safety performance [18,19]. Resilience emphasizes a structure’s capacity for rapid functional recovery post-disaster, which aligns with the critical requirement for nuclear power plant cranes to resume operations promptly after earthquakes to ensure nuclear safety. By implementing resilience-enhancing measures—including self-centering designs, high-performance materials, and intelligent monitoring systems—the seismic performance of cranes can be optimized. This strategy mitigates long-term seismic impacts on functionality, thereby guaranteeing rapid recovery and safe operation of nuclear power plants following extreme seismic events.
Results and Discussion: Building upon existing optimization techniques, this method achieves a further mass reduction of 2002.2 kg, thereby providing a novel optimization strategy for nuclear power crane lightweight design while demonstrating significant engineering applicability.
2 Structural Optimization and Time Course Analysis
2.1 Optimization of the Design Model
For a constant bridge span [20,21], the structural mass depends primarily on the main girder’s cross-sectional dimensions. An optimal structural design must satisfy strength, stiffness, and stability requirements, with the girder cross-section configuration illustrated in Fig. 1.
Figure 1: Design variable of main beam section
The design variables of the main girder of this double girder overhead crane are 4 in total [22], and the meanings and value ranges of each design variable are shown in Table 1.
In order to obtain the minimum mass of the main beam, that is, the minimum sum of the section areas of the main beam, the objective function of the optimization design is as follows:
(1) Strength constraints
The main beam will produce bending moment and shear force under the external load, in order to meet the strength requirements, the positive and shear stresses satisfy the conditions as:
where [σ] is Permissible stresses in steel (N/mm2), [τ] is Permissible shear stress (N/mm2), Wx is Flexural section coefficient of the mid-span section against the x-axis (mm3), Ix is Moment of inertia of the mid-span section against the x-axis (mm4), Sxi is The static moment of the partially cut section along the check point against the x-axis (mm3), d2 is Thickness of the web at the check point (mm).
(2) Static stiffness constraint
When the fully loaded trolley is located in the middle of the span of the main girder, the static deflection of the main girder is:
where ∑P is wheel pressure of the trolley, without dynamic load factor and impact factor (N), a is wheelbase of the trolley (mm), S is horizontal distance between vertical supports (mm), Ix is Moment of inertia of the main beam section on the x-axis (mm4), E is Modulus of elasticity of steel (N/mm2), [Ys] is permissible static displacement (mm).
(3) Dynamic stiffness constraint
Vertical self-oscillation frequency when the fully loaded trolley is located in the middle of the span:
where fv is crane bridge main girder structure full load self-oscillation frequency (Hz), [fv] is full load (vertical) self-oscillation frequency control values for structural systems. For overhead cranes, take (1.4–2.0) Hz when the fully loaded trolley is in the center of the span.
(4) Local stability constraints
The box girder is taken with a compressed flange plate between the two webs [23]:
The box girder compression flange outreach is taken:
where σs is yield strength of materials (N/mm2), d1 is cover thickness (mm), b0 is web width (mm), b1 is half the width of the cover (mm).
Let
1. When
2. When
3. When
4. When
(5) Seismic stress constraints: according to the nuclear power plant crane design guidelines [24] there are:
where σm is combined stresses under static and ultimate safe seismic shaking (SL-2), the values of which can be obtained from Section 2.2 Theoretical analysis and subsequent static and time-dependent analyses Fig. 2 Stress results.
Figure 2: Diagram of the combined stress curves of the mid-span nodes
2.2 Time-Dependent Analysis of Modal Superposition
Under seismic excitation, the equation of motion for n degrees of freedom is:
where M, C and K are the mass matrix, damping matrix and stiffness matrix of the structure, respectively,
If the first N order frequencies and modes of the structure are known to be wi and ψi (i = 1, 2, …, N), respectively, and the modal superposition method is used to calculate the seismic response of the structure, the displacement u of the structure can be obtained by the decomposition of the vibration pattern:
where
Let
where
The displacements and strains at each node are calculated using the modal vibration pattern and the modal response, and the modal structural stresses are:
where Fi is the nodal force vector of the i-th order mode; A is the cross sectional area.
The dynamically calculated i-th order modal coordinate
Through the above steps, the displacement response and stress response of the structure under dynamic loading can be calculated based on the time-range analysis of the modal superposition method, which provides an important basis for structural design and safety assessment.
3 Bridge Static Analysis and Time Course Analysis
3.1 Main Parameters of Double Girder Overhead Travelling Crane
Taking the nuclear power plant double girder overhead travelling crane as the research object, its main parameters are shown in Table 2

The bridge structure of this double-girder overhead crane was modeled using shell elements, with the global coordinate system defined as: Z-axis (main girder longitudinal direction), X-axis (end girder longitudinal direction), and Y-axis (vertical direction). The geometric configuration is illustrated in Fig. 3.
Figure 3: Geometric model of bridge structure
3.3 Load Application and Restraint
When the crane is spanning, the trolley and the weight hoisted are loaded in the form of concentrated force to the position where the trolley wheels are in contact with the main beam, and the simplified model of the mechanics is shown in Fig. 4.
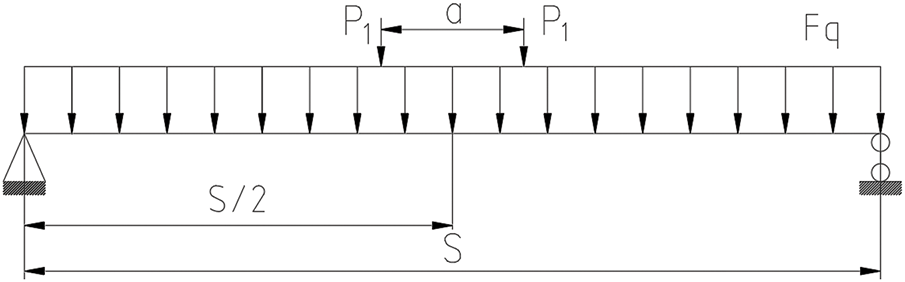
Figure 4: Load applied mechanical model
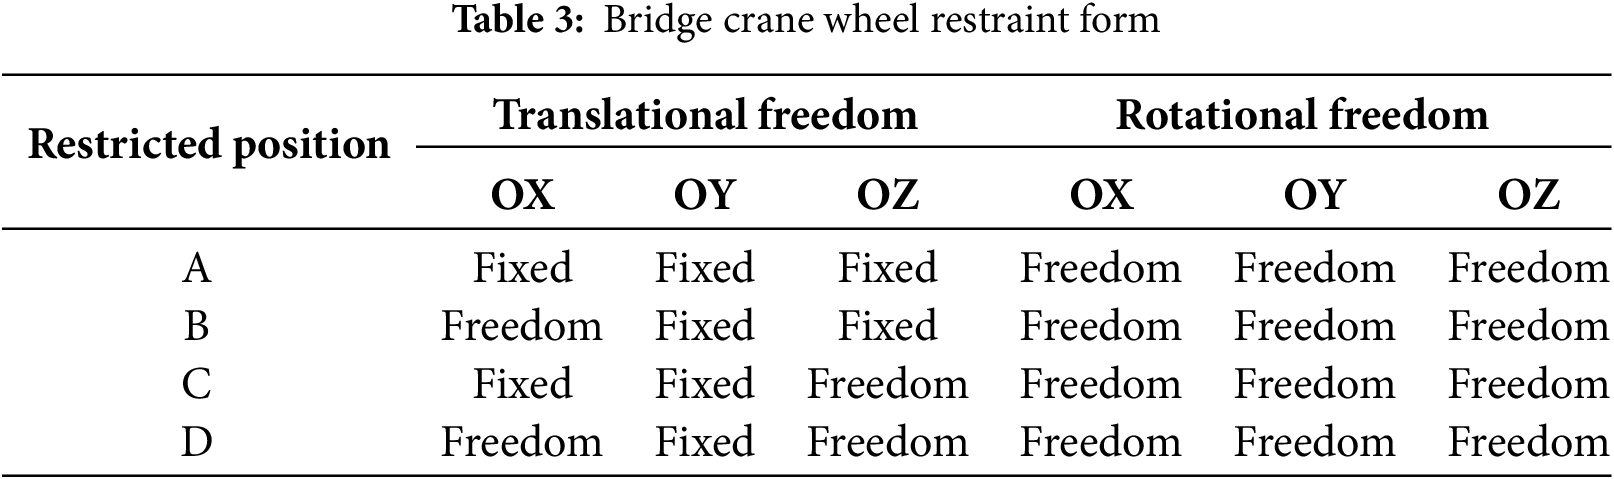
One of the big-truck wheel restraints for overhead cranes is shown in Table 3.
(1) Stiffness analysis: when the fully loaded trolley is located in the span of the main beam, the wheel pressure of the trolley ∑P = 194,935 N, the wheelbase of the trolley a = 2670 mm, the span S = 22,000 mm, the moment of inertia of the section of the main beam on the x-axis, Ix = 1.05 × 1010 mm4, and the modulus of elasticity E = 2.06 × 10¹¹ N/mm2.
From Eq. (5), the static deflection of the main beam is Y = 19.76 mm, and Y < [Ys] = S/1000 = 22 mm, so it meets the stiffness requirement.
(2) Strength analysis: bending moments generated in the span of the main beam according to the mechanical model in Fig. 4:
The bending moment Mp = 1.61 × 10⁹ N·mm was calculated.
Corresponding shear force:
The shear force Fp = 91,553 N was calculated.
Substituting the values of bending moment and shear force into Eqs. (3) and (4) yields the bending positive and shear stresses within the mid-span section as σx = 48.92 MPa and τx = 1.68 MPa.
According to the fourth strength theory, the equivalent stress at the mid-span node at this point is:
The material used in this paper is Q355D, then the allowable stress formula is:
where:
•
•
•
From Eq. (19), the permissible stress of Q355D material 255.2 MPa.
Under full-load conditions at bridge mid-span, theoretical calculations indicate a maximum main girder stress of 49 MPa. This value remains well below the allowable stress of 255.2 MPa for Q355D material, satisfying structural strength requirements. The corresponding equivalent stress distribution and displacement contours obtained through ANSYS analysis are presented in Figs. 5 and 6, respectively.
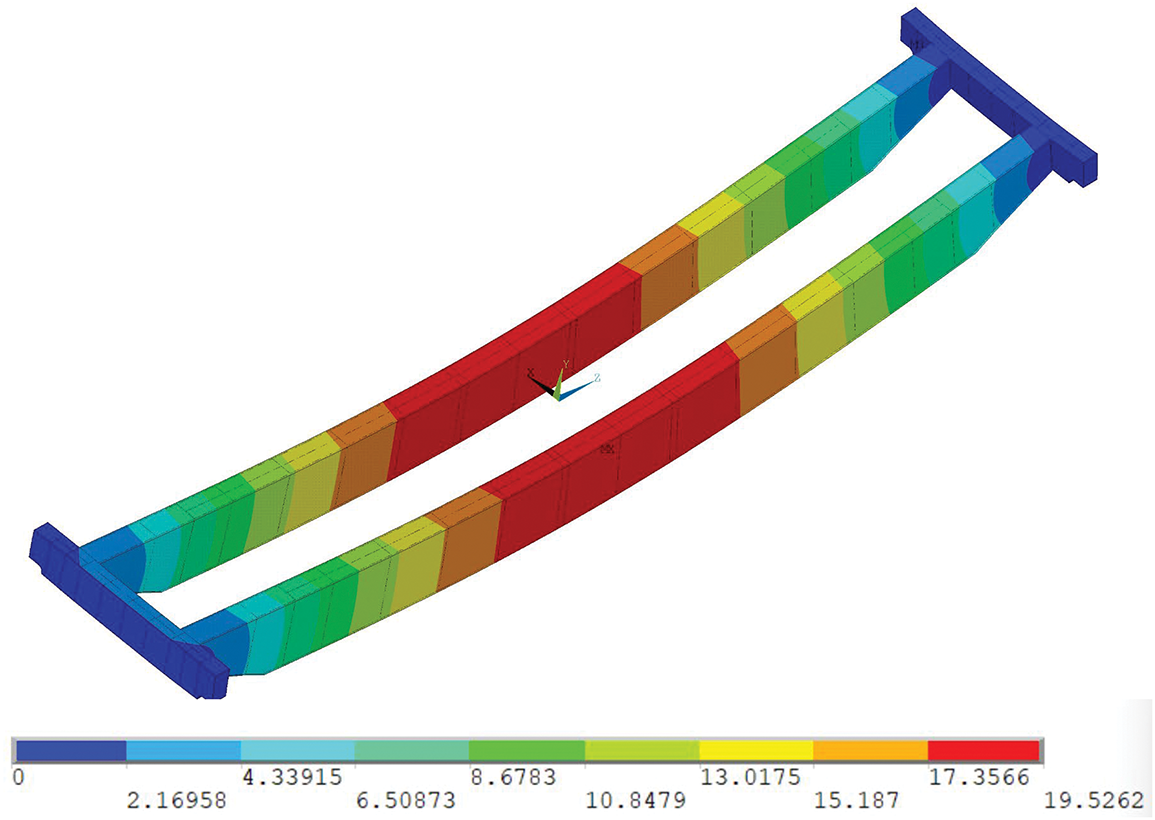
Figure 5: Displacement distribution contour map
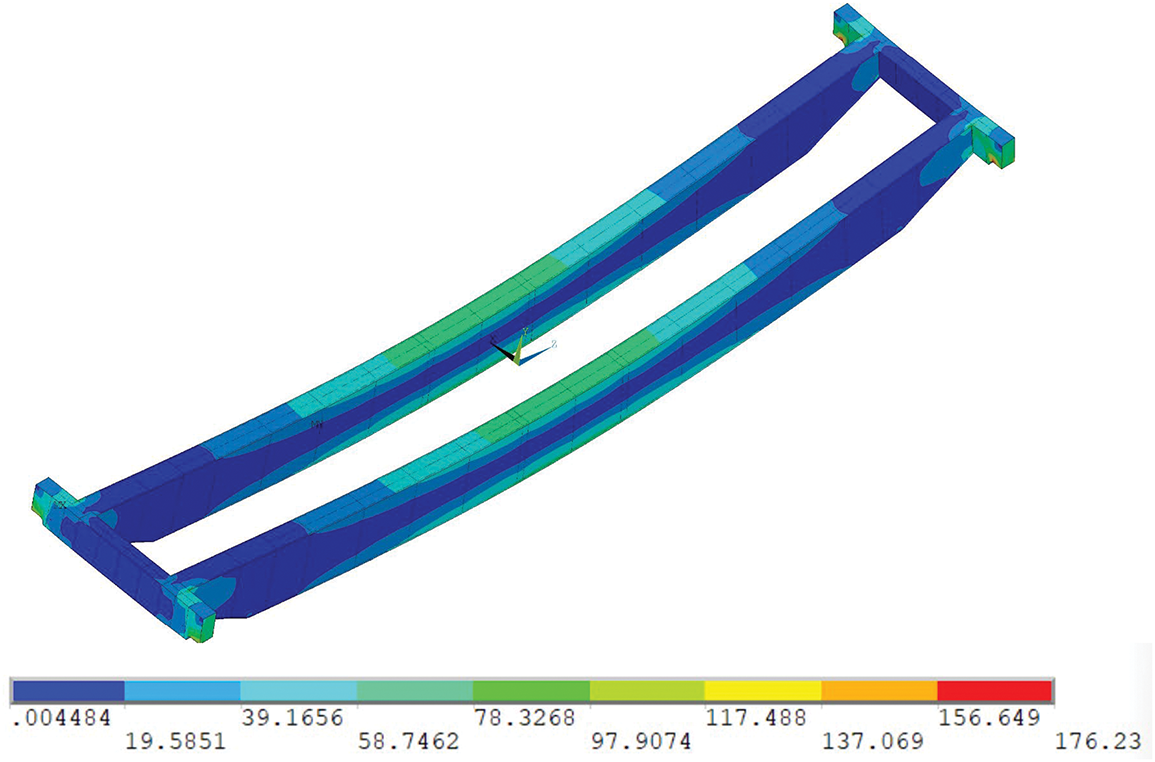
Figure 6: Stress distribution contour diagram
3.5 Simulation Results and Error Analysis
Simulation results indicate a maximum displacement of 19.526 mm at mid-span under full-load conditions. This compares with a theoretical displacement of 19.76 mm derived from static mechanics principles, representing a 1.18% deviation. Similarly, the simulated maximum mid-span stress of 48.032 MPa shows a 1.98% variance from the theoretically calculated value of 49 MPa. The close agreement between theoretical and simulated results (≤2% error) confirms the model’s capability to accurately represent the physical entity’s mechanical behavior, validating its suitability for subsequent time-history analysis.
3.6 Selection of Seismic Waves for Time-Range Analysis
According to the seismic design standard for nuclear power plants [25], the peak value of dynamic acceleration of the ultimate safety earthquake (SL-2) is not less than 0.15 g, A representative and well-researched EI-Centro actual seismic record was used as input because it meets code requirements and effectively reflects the dynamic response of the structure and the time of the strong earthquake is selected to be 20 s, and the maximum acceleration values of this seismic wave in the horizontal orthogonal X-direction, Z-direction, and vertical Y-direction are 0.21, 0.34, and 0.21 g, respectively. The seismic wave profile is shown in Figs. 7–9.
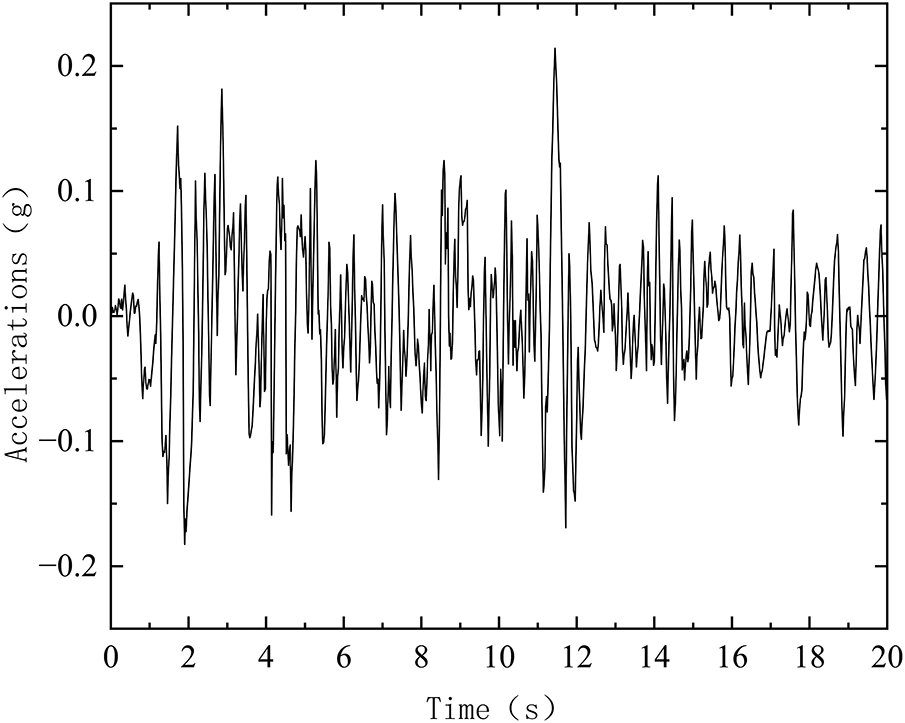
Figure 7: EI-Centro wave X acceleration time history curve
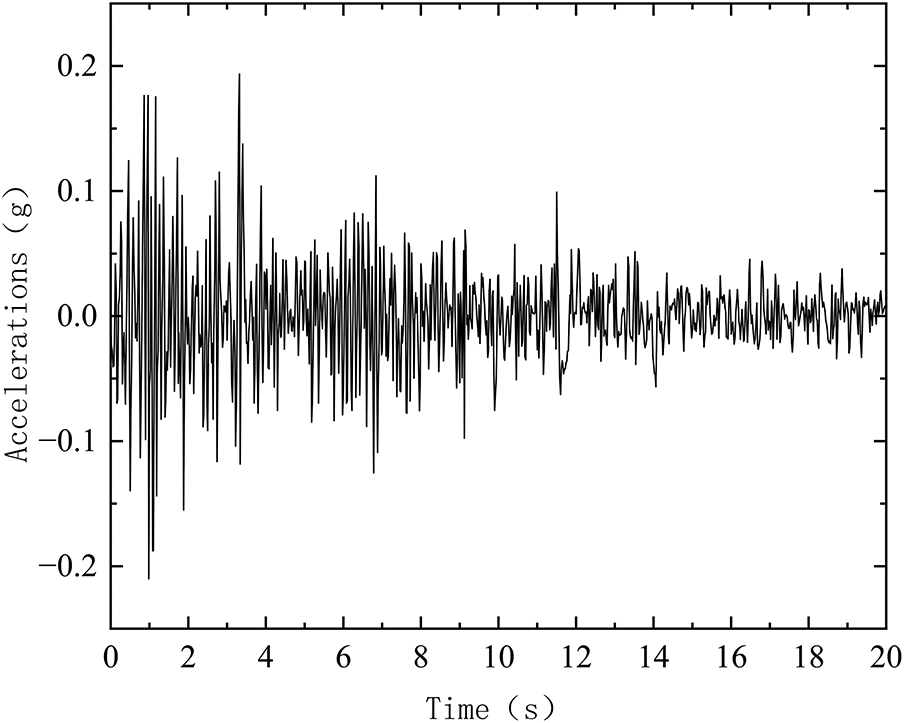
Figure 8: EI-Centro wave Y acceleration time history curve
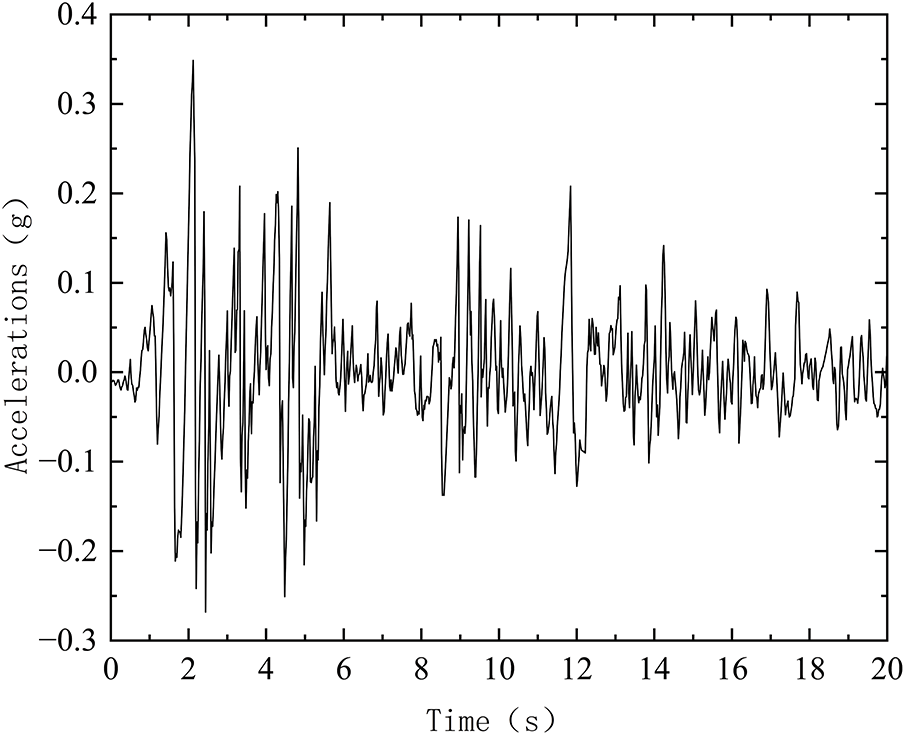
Figure 9: EI-Centro wave Z acceleration time history curve
3.7 Bridge Timing Analysis Results
The response results of the node stresses in the fully loaded span of the bridge crane bridge under seismic loading are shown in Fig. 2, and it can be seen that the maximum value of the stress is 58.77 MPa, which is used for the 2.1.3 seismic stress constraints.
4 Lightweight Design of Bridge Crane Main Girder
4.1 Overview of the Whale Optimization Algorithm
The Whale Optimization Algorithm (WOA) [26,27] is employed for structural optimization of bridge crane main girders. This algorithm demonstrates efficient search capabilities, enabling rapid identification of optimal solutions while dynamically transitioning between global exploration and local exploitation. Characterized by parametric simplicity and implementation ease, WOA exhibits robust adaptability to complex engineering problems. The optimized main girder achieves significant mass reduction with enhanced performance metrics. Furthermore, the algorithm supports parallel computation and can be integrated with complementary techniques through methodological innovation, thereby substantially improving both optimization efficiency and structural performance.
4.2 Whale Optimization Algorithm Flow
The process of using whale optimization algorithm to deal with engineering problems covers the following key stages: (1) initializing parameters; (2) initializing population; (3) calculating fitness; (4) determining optimal solution; (5) iterative optimization; and (6) outputting results.
The flow chart of the whale optimization algorithm is shown in Fig. 10.
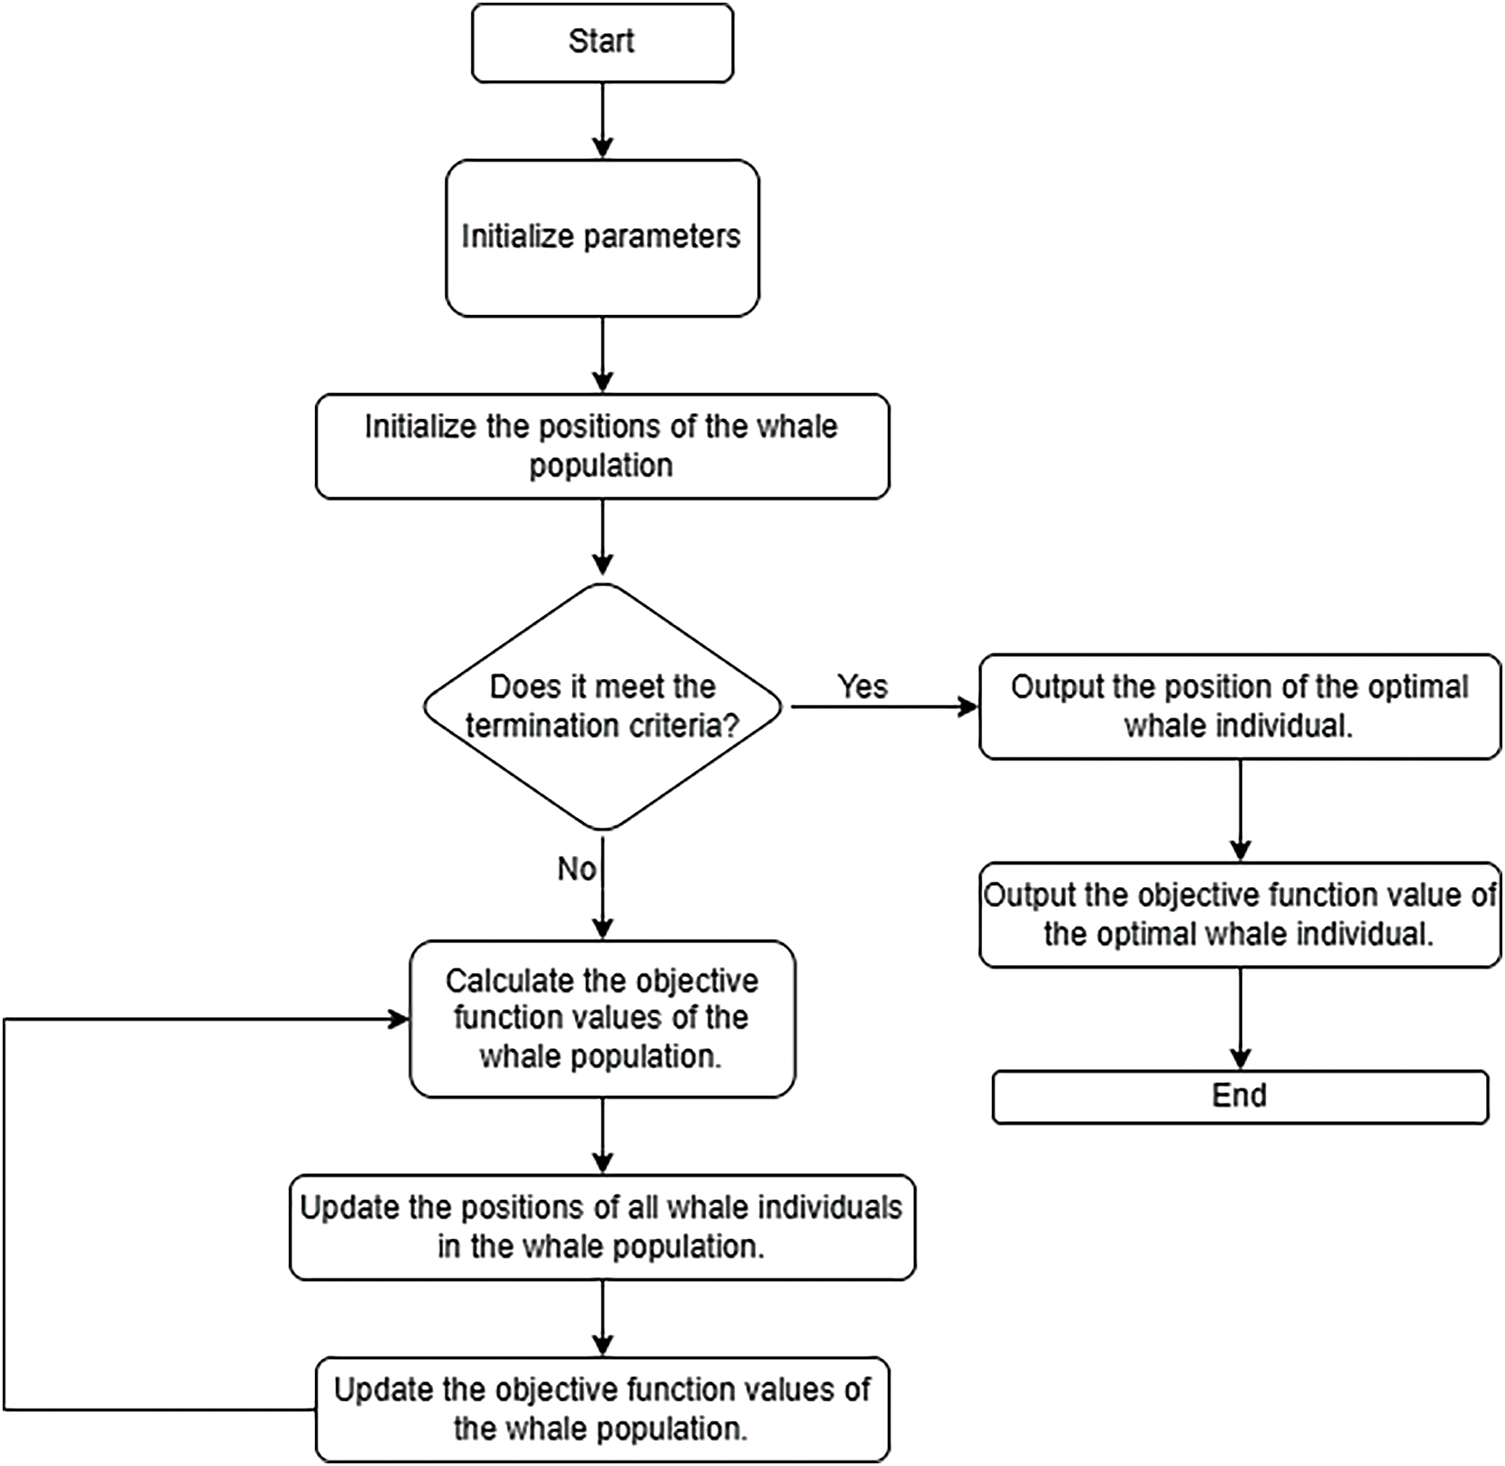
Figure 10: Flowchart of whale optimization algorithm
(1) Initialization parameters
Prior to optimizing the crane main girder, the optimization objectives and constraints must be defined (refer to Section 2.1: Structural Optimization Design Model). Based on these parameters, the Whale Optimization Algorithm is configured with: population size (number of whale agents), maximum iterations, and search space boundaries (value ranges for main girder design variables).
(2) Initialize the population
Following determination of optimization objectives and algorithm parameters, population initialization is performed. Within the design space of main girder variables, initial design solutions are randomly generated. Each solution corresponds to a whale position, representing a feasible structural configuration of the main girder.
(3) Calculate the degree of adaptation
The fitness function serves as the key metric for evaluating design solutions, explicitly defined according to optimization objectives. For instance:
When minimizing main beam mass, the fitness function is inversely proportional to structural weight.
When maximizing load capacity, the fitness function directly correlates with bearing performance.
(4) Determine the optimal solution
Following fitness value computation for each initial design solution, the current optimal solution is identified within the initial population. This determination relies on comparative fitness evaluation, where the solution exhibiting the highest fitness is designated as the global optimum. This global optimum subsequently serves as the reference benchmark for guiding search directions during iterative optimization. Upon identification, the optimal solution’s fitness value and corresponding design variables are recorded to facilitate comparison and updating in subsequent iterations.
(5) Iterative optimization
Iterative optimization is the core aspect of the whale optimization algorithm, which searches for a better design solution by constantly updating the whale position. In each iteration, according to the strategy of the whale optimization algorithm (e.g., surround prey, spiral update, search prey, etc.):
1. Surrounding prey
In the algorithm, it is assumed that the optimal solution in the current search space is the target prey location, denoted by
where: t is the current iteration number; A is a coefficient vector to control the search step size and direction; D is the distance between the current individual and the prey position; C is a coefficient vector to enhance the randomness of the search process.
2. Spiral update
The formula for updating the position of an individual whale is:
where: D is the distance between the current individual and the prey; b is a constant defining the shape of the spiral; l is a random number between [−1, 1].
To integrate shrinking encircling and spiral movements, the algorithm selects update mechanisms through stochastic probability p (where p ∈ [0, 1]), assuming equal execution probability for both strategies. When p < 0.5, the shrinking encircling mechanism activates; when p ≥ 0.5, the spiral position update mechanism engages. The mathematical model is as follows:
3. Searching for prey
The prey search mechanism similarly utilizes variation in the A vector. Humpback whales emulate stochastic foraging behavior by repositioning relative to peers; thus, random values satisfying |A| > 1 are employed to displace search agents from the reference whale. When |A| ≥ 1, individual whales conduct stochastic exploration to enhance global search capability while preventing local optima entrapment. During this phase, a randomly selected search space individual guides the position update, formulated as:
Incorporating the structural characteristics and constraints of the crane main girder, each design solution—represented as a whale position—undergoes updating. For every whale, another whale is randomly selected as the target. The distance vector between the current whale and target whale is computed, with the position update strategy determined by the stochastic parameters p and A. This strategic selection governs whale movement patterns, thereby influencing the algorithm’s exploration capability and convergence rate. Following position updates, fitness values are re-evaluated for each new design solution and compared against the current global optimum.
(6) Output results
The iterative optimization process ends when the preset maximum number of iterations is reached or the adaptation degree value converges. At this time, the final optimized crane main girder design scheme is output, including the values of each design variable, the value of the adaptability, etc.
Utilizing the Whale Optimization Algorithm (WOA) [28,29], a Python-based program [30] was developed for lightweight design of bridge crane main girders. The algorithm configuration employed 50 iterations with a population size of 50 and spiral constant b = 1. By simulating humpback whales’ predatory strategies—prey encircling and bubble-net attacking—the program efficiently explores the design variable space. It incorporates the main beam optimization objective function, accounts for cross-sectional design variables, and enforces engineering constraints.
Program execution yielded an optimized solution set containing key parameters: web thickness, web height, cover width, and cover thickness. Convergence curves (Fig. 11) visualize the objective function’s progression during iteration, quantitatively evaluating algorithmic convergence speed and optimization effectiveness. Comparative pre/post-optimization design variables are presented in Table 4. The optimal solution achieved at iteration 11 features: web height h = 1490 mm, cover width b = 510 mm, web thickness d2 = 6 mm, and cover thickness d1 = 10 mm.
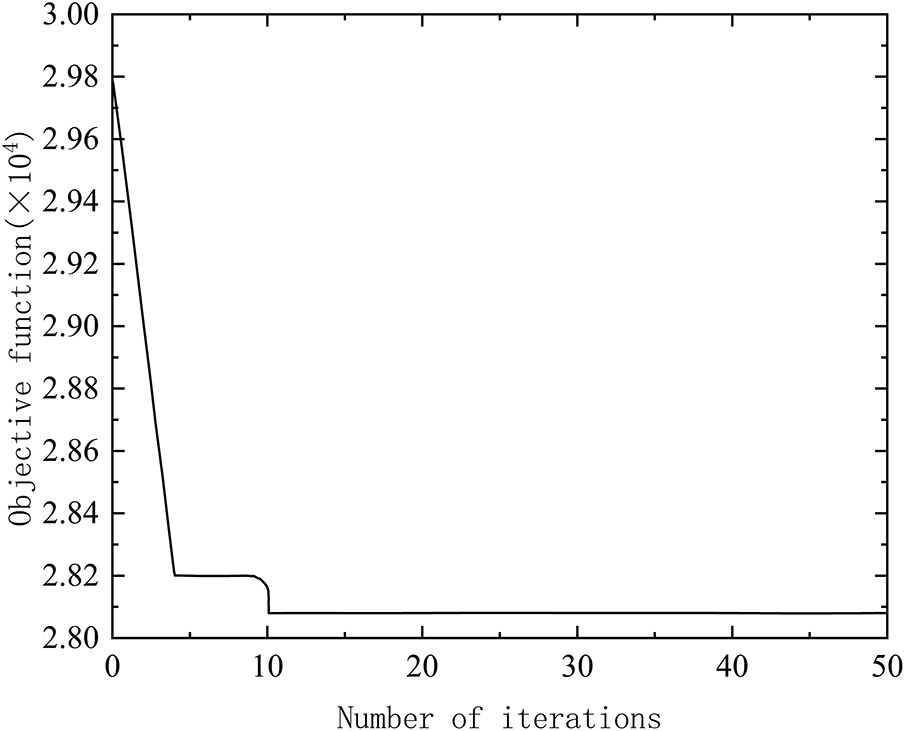
Figure 11: Objective function iteration curve
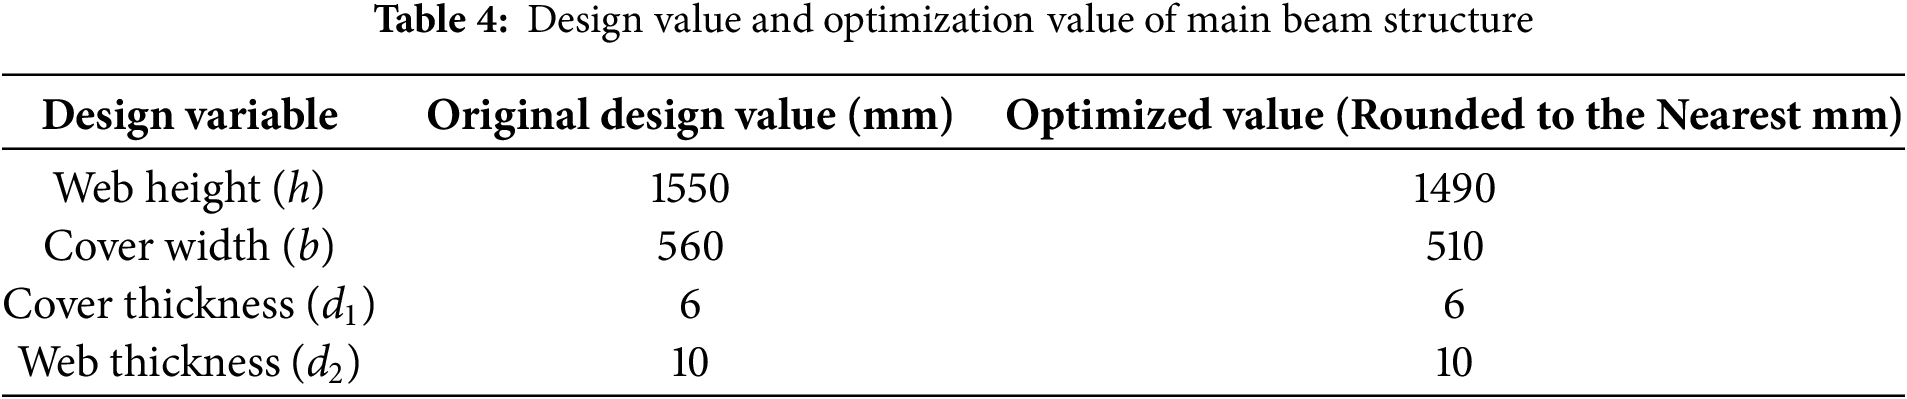
4.4 Analysis of Optimization Results
The bridge mass decreased from 24,147.2 kg pre-optimization to 22,145 kg post-optimization, achieving a mass reduction of 2002.2 kg. Comparative analysis in Fig. 12 demonstrates the stress response under full-load span conditions. The optimized structure exhibits a maximum nodal stress of 66.95 MPa at mid-span, representing a 12.2% increase compared to the baseline configuration while remaining below the material yield strength (Q460 steel: 460 MPa). These results confirm successful lightweight realization while complying with seismic design requirements.
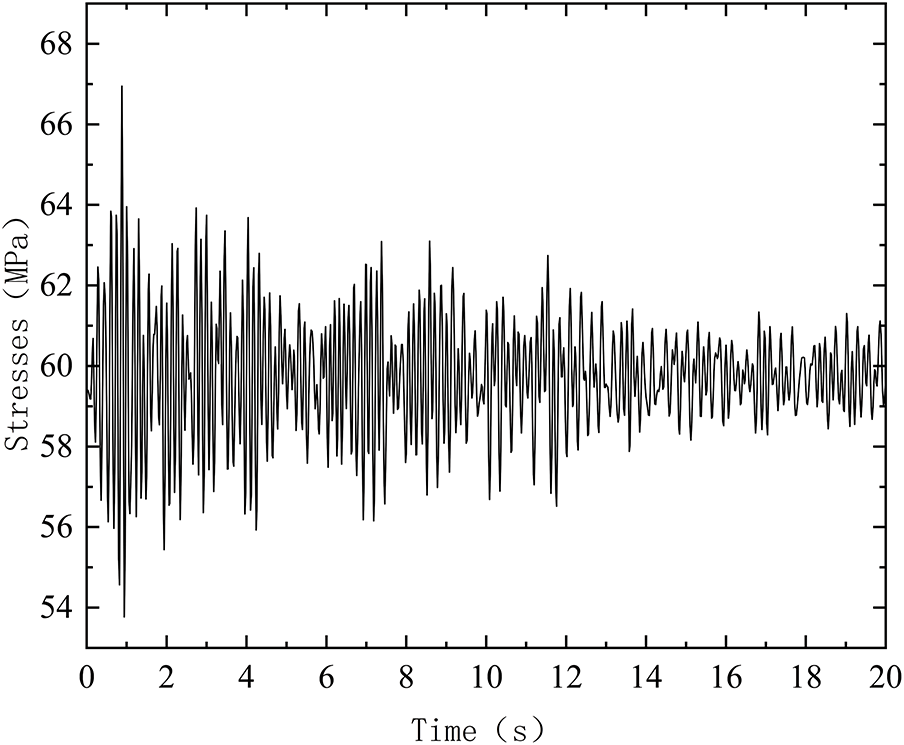
Figure 12: Combined stress curve diagram of the mid-span node after optimization
(1) Given the structural complexity of the crane, judicious simplifications were implemented during modeling. Subsequent studies should employ more comprehensive finite element models to enhance analytical accuracy and better reflect actual operating conditions.
(2) China’s seismic design code stipulates that time-history analysis for complex structures or high-precision requirements should incorporate seven or more strong ground motion records. This approach effectively reduces variability in computational outcomes while improving the accuracy and reliability of structural response predictions. Multiple seismic waves should therefore be investigated for crane structural response assessment.
(3) Current seismic computations remain at the finite element simulation stage, though seismic analysis constitutes a complex process. To further validate this seismic design methodology, comparative verification via response spectrum analysis is recommended. Where experimental resources permit, establishing scaled physical models for empirical validation is advised.
Acknowledgement: The authors would like to thank the constructive comments from the reviewers and editors that helped improve this manuscript.
Funding Statement: The authors received no specific funding for this study.
Author Contributions: Zhengyan Chang optimized the design model. Weiwei Wang and Heng Yang performed time history analysis through modal superposition, and was a major contributor in writing the manuscript. Mingliang Yang and Qing Dong optimized and analyzed the Structural. Keyuan Zhao and Jie Yuwen performed lightweight design optimization on the bridge crane’s main girder. All authors reviewed the results and approved the final version of the manuscript.
Availability of Data and Materials: The data that support the findings of Seismic optimization method of nuclear power crane structure are available from the corresponding author upon reasonable request.
Ethics Approval: This study did not involve human participants or animals. Therefore, ethical approval was not required.
Conflicts of Interest: The authors declare no conflicts of interest to report regarding the present study.
Nomenclature
| WOA | Whale Optimization Algorithm |
| WFOA | Whale of Flock Optimization Algorithm |
References
1. Doğan SÖ. Design and analysis of double girder overhead crane system. J Radiat Res Appl Sci. 2023;16(4):100701. doi:10.1016/j.jrras.2023.100701. [Google Scholar] [CrossRef]
2. Mohamed HS, Abdelwahab SA. Double-girder overhead crane optimum design using weighted decision matrix and finite element analysis. J Inst Eng. 2021;102(2):283–304. doi:10.1007/s40032-020-00652-w. [Google Scholar] [CrossRef]
3. Lin W, Zhu HY. Lightweight design of crane’s main girder based on improved rat swarm optimization algorithm. J Mach Des. 2024;41(4):131–9. (In Chinese). doi:10.13841/j.cnki.jxsj.2024.04.024. [Google Scholar] [CrossRef]
4. Dong Q, Zhang T, Qi Q, Xu G. Optimized design of crane metal structure based on structural function derived coefficients. J Eng Des. 2024;6:810–22. (In Chinese). [Google Scholar]
5. Li X, Xing N. Optimization design of gantry crane main girder structure based on genetic algorithm. China J Constr. 2024;22(5):657–61. (In Chinese). [Google Scholar]
6. Xu X, Xu G, Chen J, Liu Z, Chen X, Zhang Y, et al. Multi-objective design optimization using hybrid search algorithms with interval uncertainty for thin-walled structures. Thin Walled Struct. 2022;175(3):109218. doi:10.1016/j.tws.2022.109218. [Google Scholar] [CrossRef]
7. Weng FX, Zheng C, Wang QX. Robust optimization design of metal girder structure of bridge crane considering reliability. J Donghua Univ Nat Sci. 2021;47(5):74–9. (In Chinese). doi:10.19886/j.cnki.dhdz.2020.0270. [Google Scholar] [CrossRef]
8. Xiao H, Xiao L, He B, Zhao ZY. Safety optimization design of gantry crane main girder based on artificial hummingbird algorithm. Mach Des Res. 2023;39(3):222–6. (In Chinese). doi:10.13952/j.cnki.jofmdr.2023.0115. [Google Scholar] [CrossRef]
9. Jiao G, Tao Y, Zhang Y. Lightweight design of main girder of casting crane based on whale swarm optimization algorithm. China J Constr Mach. 2024;22(5):631–5. (In Chinese). [Google Scholar]
10. Sun Z, Wang S, An L, Chen H. Structural optimization design of anti-sway device for marine crane based on particle swarm algorithm. Sci Technol Eng. 2024;24(26):11441–8. (In Chinese). [Google Scholar]
11. Zhang L, Yu S, Xu J, Zong X, Zhang L, Dong L. Structural design and cross-section size optimization of crane reach arm for lightweighting objective. Mech Des. 2023;40(6):124–33. (In Chinese). [Google Scholar]
12. Lu J, Wang C. Optimization of gantry crane main girder based on improved projectile ejection algorithm. Mech Strength. 2023;45(3):756–62. (In Chinese). [Google Scholar]
13. Feau C, Politopoulos I, Kamaris GS, Mathey C, Chaudat T, Nahas G. Experimental and numerical investigation of the earthquake response of crane bridges. Eng Struct. 2015;84(3):89–101. doi:10.1016/j.engstruct.2014.11.022. [Google Scholar] [CrossRef]
14. Meisuh BK, Seo J, Huh J, Kim J, Kim JM. Seismic response of a container crane subjected to ground motions. Appl Ocean Res. 2022;126:103270. doi:10.1016/j.apor.2022.103270. [Google Scholar] [CrossRef]
15. Akhani M, Alidadi N, Pezeshk S. Application of metaheuristic algorithms in ground motion selection and scaling for time history analysis of structures. J Struct Eng. 2024;150(8):04024094. doi:10.1061/jsendh.steng-13470. [Google Scholar] [CrossRef]
16. Yang L, Fu Z, Wang D. Ground motion time history simulation for seismic response history analysis. Front Earth Sci. 2022;10:908498. doi:10.3389/feart.2022.908498. [Google Scholar] [CrossRef]
17. Islam MR, Das Turja S, Van Nguyen D, Forcellini D, Kim D. Seismic soil-structure interaction in nuclear power plants: an extensive review. Results Eng. 2024;23(5):102694. doi:10.1016/j.rineng.2024.102694. [Google Scholar] [CrossRef]
18. Ní Choine M, O’Connor AJ, Padgett JE. Comparison between the seismic performance of integral and jointed concrete bridges. J Earthq Eng. 2015;19(1):172–91. doi:10.1080/13632469.2014.946163. [Google Scholar] [CrossRef]
19. Forcellini D, Mitoulis SA. Effect of deterioration on critical infrastructure resilience—framework and application on bridges. Results Eng. 2025;25(1):103834. doi:10.1016/j.rineng.2024.103834. [Google Scholar] [CrossRef]
20. Celik HK, Rennie AEW, Akinci I. Design and structural optimisation of a tractor mounted telescopic boom crane. J Braz Soc Mech Sci Eng. 2017;39(3):909–24. doi:10.1007/s40430-016-0558-y. [Google Scholar] [CrossRef]
21. Xu SJ. Structural optimization of crane foundation for wind power installation vessel. Ship Equip Mater Mark. 2025;33(5):26–9. (In Chinese). doi:10.19727/j.cnki.cbwzysc.2025.05.009. [Google Scholar] [CrossRef]
22. Yu Y, Liu Z, Lu Y, Zhang P, Liu H. Optimal design of main girder structure of bridge crane based on equal life concept driven by data. J Mech Sci Technol. 2023;37(9):4767–86. doi:10.1007/s12206-023-0830-x. [Google Scholar] [CrossRef]
23. Hu SC, Liu B, Wang XJ, Zhang WY. Research on mechanical mechanics with the finite element analysis and structure optimization of large span gantry crane box beam. Adv Mater Res. 2014;910:370–4. doi:10.4028/www.scientific.net/amr.910.370. [Google Scholar] [CrossRef]
24. Zhang Y, Jiang Y, Gong Y, Zeng B. Structural optimization design of crane frame for nuclear power waste. IOP Conf Ser Mater Sci Eng. 2020;772(1):012054. doi:10.1088/1757-899X/772/1/012054. [Google Scholar] [CrossRef]
25. Gersinska R, Borsutzky R, Fäcke A, Schmitt T, Sadegh-Azar H. Development of new ISO 4917 standard series for the design of nuclear power plants against seismic events. Kerntechnik. 2025;90(1):35–43. doi:10.1515/kern-2024-0136. [Google Scholar] [CrossRef]
26. Mirjalili S, Lewis A. The whale optimization algorithm. Adv Eng Softw. 2016;95(12):51–67. doi:10.1016/j.advengsoft.2016.01.008. [Google Scholar] [CrossRef]
27. Du N, Ji Y, Wu C, Hou A, Nie W. Scheduling DAG-structured workloads based on whale optimization algorithm. J Supercomput. 2025;81(8):911. doi:10.1007/s11227-025-07415-3. [Google Scholar] [CrossRef]
28. Rana N, Latiff MSA, Abdulhamid SM, Chiroma H. Whale optimization algorithm: a systematic review of contemporary applications, modifications and developments. Neural Comput Appl. 2020;32(20):16245–77. doi:10.1007/s00521-020-04849-z. [Google Scholar] [CrossRef]
29. Gharehchopogh FS, Gholizadeh H. A comprehensive survey: whale optimization algorithm and its applications. Swarm Evol Comput. 2019;48(8):1–24. doi:10.1016/j.swevo.2019.03.004. [Google Scholar] [CrossRef]
30. Huang H, Li Y, Wang Z, Xue L, Wang Y. Modular design and its application to overhead traveling crane. Stroj Vestn J Mech Eng. 2009;55(11):645–65. [Google Scholar]
Cite This Article
 Copyright © 2026 The Author(s). Published by Tech Science Press.
This work is licensed under a Creative Commons Attribution 4.0 International License , which permits unrestricted use, distribution, and reproduction in any medium, provided the original work is properly cited.
 Downloads
 Citation Tools