
 Submit a Paper
 Propose a Special lssue
 Open Access
ARTICLE

Stress Redistribution Patterns in Road-Rail Double-Deck Bridges: Insights from Long-Term Bridge Health Monitoring
Department of Bridge and Tunnel Research Center, Research Institute of Highway, Ministry of Transport, Beijing, 100088, China
Benyu Wang. Email: ; Bingjian Wang. Email:
# Primary Corresponding Author
Structural Durability & Health Monitoring 2026, 20(1), . https://doi.org/10.32604/sdhm.2025.070137
Received 08 July 2025; Accepted 30 September 2025; Issue published 08 January 2026
 View Full Text
 Download PDF
Abstract
To examine stress redistribution phenomena in bridges subjected to varying operational conditions, this study conducts a comprehensive analysis of three years of monitoring data from a 153-m double-deck road–rail steel arch bridge. An initial statistical comparison of sensor data distributions reveals clear temporal variations in stress redistribution patterns. XGBoost (eXtreme Gradient Boosting), a gradient-boosting machine learning (ML) algorithm, was employed not only for predictive modeling but also to uncover the underlying mechanisms of stress evolution. Unlike traditional numerical models that rely on extensive assumptions and idealizations, XGBoost effectively captures nonlinear and time-varying relationships between stress states and operational/environmental factors, such as temperature, traffic load, and structural geometry. This approach allows for the identification of critical periods and conditions under which stress redistribution becomes significant. Results indicate a clear shift of stress concentrations from beam ends toward mid-span regions following the commencement of metro operations, reflecting both structural adaptation and localized overstress near arch ribs. Furthermore, the model generates robust predictions of stress evolution, demonstrating potential applications in early warning systems and fatigue risk assessment. This work represents the first application of interpretable gradient-boosting techniques to stress redistribution modeling in double-deck bridges. In addition, a Stress Redistribution Index (SRI) is proposed, derived from this monitoring study and finite-element-based transverse load distributions, to quantify temporal stress shifts between midspan and edge beams. The results provide both theoretical contributions and practical guidance for the design, inspection, and maintenance of complex bridge structures.Keywords
Double-deck bridges are increasingly employed to accommodate diverse traffic modes and optimize land use nowadays, especially in densely populated urban areas. Their unique structural configuration, however, introduces significant challenges in understanding and managing internal stress distribution. Stress analysis is pivotal in ensuring the long-term safety, functionality, and durability of these complex structures. Among the critical aspects, stress redistribution plays a central role in maintaining structural equilibrium under varying environmental influences, such as temperature fluctuations and dynamic traffic loads. Stress redistribution in long-span bridges is not merely a structural mechanics phenomenon; it can have tangible real-world consequences, such as increased fatigue damage at newly stressed regions, reduced residual service life, and escalated maintenance or retrofit costs. In extreme cases, unmonitored stress redistribution can elevate safety risks by concentrating loads on structural components that were not originally designed to sustain such high stresses. Although significant progress has been made in bridge health monitoring (BHM), a thorough understanding of stress redistribution mechanisms in double-deck bridges remains limited, thereby hindering the development of predictive maintenance strategies and resilience measures.
2 Stress Redistribution in Bridges: A Fundamental Aspect of Structural Mechanics
The principles of elasticity and plasticity form the basis for understanding how stresses are distributed within structural components such as beams, arches, and bridge decks. Classical theories, including the Euler-Bernoulli beam theory and the Timoshenko beam theory, provide analytical models for predicting stress and strain under loads.
The concept of load path optimization, developed over several decades, emphasizes how structures adapt to redistribute stresses to prevent failure in the event of overload or structural damage. Stress redistribution is crucial for maintaining the safety and performance of structures, particularly in complex systems such as double-layer bridges. Traditional studies on redistribution mechanisms have focused on single-layer structures, providing a theoretical foundation for phenomena such as stress concentration, plasticity, and load transfer under static and dynamic loads. The classical work of Timoshenko and Gere (1972) [1] laid the groundwork for understanding these phenomena.
Recent research on multilayer structures has extended fundamental principles to double-deck systems, where stress redistribution is shaped by structural connectivity, differential stiffness, and layered load paths [2,3]. Moreover, studies highlight that stress redistribution is not solely a structural response, but a multi-physics phenomenon influenced by environmental loads (e.g., temperature gradients, wind), traffic-induced vibrations, and material degradation associated with aging [4–7]. For example, Wang et al. [4] demonstrated that thermal gradients in double-deck steel trusses lead to asymmetric stress redistribution, while Lu et al. [5] showed that integrating 27 years of monitoring data with multi-scale FEA enables accurate evaluation of fatigue-induced redistribution.
2.1 Stress Distribution Patterns in Double-Deck Bridges
Early studies primarily relied on finite element analysis (FEA) and nonlinear simulations to analyze stress redistribution under seismic or extreme loading scenarios [8–11]. While these methods revealed structural vulnerabilities and mutual deck influence, they are typically limited to short-term simulations and idealized boundary conditions. Moreover, bidirectional loading often induces out-of-phase motion between adjacent girders. For example, Kumar and Nallasivam (2025) [3] employed a finite element (FE) model to show that variations in train speed and damping ratio significantly affect total deformation and equivalent stress amplitude, underscoring the role of stress redistribution and load-path adjustment under dynamic loading.
2.2 Advances in Analysis and Computational Methods for Stress Redistribution
2.2.1 Conventional Analytical Method
The development of analytical methods and modeling techniques, particularly the adoption of advanced modeling approaches such as FEA and data-driven machine learning algorithms, has significantly advanced the field of stress analysis. Katsimpini et al. (2024) [12] and Shao et al. (2024) [13] developed advanced numerical frameworks to analyze bridge response under dynamic train and seismic loads, explicitly considering soil–structure interaction, travelling wave effects, and train–bridge interaction; their studies demonstrated that such coupled dynamic effects can significantly amplify stress redistribution and internal force variation, highlighting the importance of multi-hazard and high-fidelity modeling for double-deck bridge systems. Xu et al. (2023) [14] conducted dynamic analyses of a long-span double-deck suspension bridge under stochastic traffic loads using FEA models, examining the effects of various traffic parameters on longitudinal girder motion. Similarly, Liu and Sun (2022) [15] employed Abaqus to create a 3D global-node model incorporating material nonlinearity to analyze stress distribution under adverse external forces. Meanwhile, Xie et al. (2022) [16] used 3D-Bridge software to develop FEA models, revealing significant mutual deformation impacts between upper and lower decks in dual-purpose road-rail double-deck bridges. While existing studies have extensively investigated stress redistribution mechanisms in traditional bridges, the dynamic behavior of double-deck systems under coupled dynamic and environmental loads remains an area requiring further exploration, which cannot be easily revealed through FEA or stimulation, especially since these methods mainly focus on the instantaneous changes in the structures.
The data-driven method is an emerging approach in engineering that enables the exploration and capture of complex nonlinear relationships between variables that cannot be precisely analyzed through traditional methods. This approach effectively characterizes stress redistribution patterns under seismic loading by leveraging long-term structural health monitoring data to capture the bridge’s temporal evolution, which can be integrated with finite element analyses and mathematical models to provide a robust, predictive framework for evaluating bridge seismic performance, for example, Saramago et al. (2022) [17] analyzed numerical models of rail-traffic double-deck bridge systems using a genetic algorithm-based iterative approach with the Analys software. Chen et al. (2024) [18] performed fatigue damage assessment of a large rail-cum-road steel truss-arch bridge using long-term dynamic BHM data and Zhang et al. (2025) [19] investigated the long-term operational state of bridge abutment anchorage structures through continuous monitoring and revealed the underlying stress–deformation mechanisms, demonstrating that sustained monitoring can track stress evolution and fatigue accumulation under real operating conditions and reinforce the importance of bridge health monitoring (BHM) in evaluating redistribution mechanisms in multilayer bridge systems.
In recent years, a variety of machine learning techniques have been increasingly applied to bridge structural health monitoring and predictive analysis, due to their excellent capability in handling inherently black-box data and capturing the nonlinear behavior of bridge structures. For instance, Zhang et al. (2024) [20] proposed a hybrid neural network approach based on column-bridge coupling to predict the seismic response of structural systems; In time-series forecasting tasks for coastal bridge engineering, the performance of XGBoost, LSTM (Long Short-term Memory), and ARIMA (Autoregressive Integrated Moving Average Model) models has been systematically compared, revealing their respective strengths and limitations in handling nonlinear and time-dependent data [21], Hamedani et al. (2025) [22] conducted a full-scale unsupervised monitoring validation on a truss bridge using time-series analysis of operational sensor data to detect damage and anomaly. Concurrently, researchers have evaluated the effectiveness of Random Forest (RF), XGBoost, and Artificial Neural Networks in predicting bridge deck condition ratings using the National Bridge Inventory (NBI) dataset [23]. Furthermore, XGBoost-based data-driven predictive models have been successfully applied to assess the mechanical performance of steel bridge deck paving systems, further demonstrating the advantages of machine learning techniques in practical applications [24]. Additionally, Xu et al. (2024) [25] have also featured CNN (Convolutional Neural Network)–ensemble approaches, and Jin et al. (2025) [26] utilized deep learning techniques to estimate thermal-induced displacements, collectively highlighting the increasing importance of interpretable artificial intelligence in analyzing stress redistribution in bridge structures.
Within the BHM field, XGBoost and SHAP (SHapley Additive exPlanations) have been used for environmental load impact [27] and stress anomaly detection in long-span bridges [28]. Gupta et al. (2024) [29] demonstrated that the XGBoost–SHAP framework outperforms RF in pavement stress prediction, balancing accuracy and interpretability. Fard and Sadeghi Naieni Fard (2024) [23] in their work demonstrated that XGBoost provides superior predictive accuracy for U.S. bridge deck condition ratings compared with Artificial Neural Networks (ANN) and RF. These findings suggest that machine learning methods, particularly XGBoost-based models, hold significant potential for structural health assessment, damage detection, and long-term evolution analysis of bridge structures. Therefore, XGBoost was selected over other ML models, such as Random Forest, because it offers high predictive accuracy, effectively captures complex nonlinear interactions, and provides model interpretability through SHAP value analysis, which is essential for understanding stress redistribution mechanisms.
2.3 Research Gaps and Contributions
Current research methodologies often rely on assumptions and simulated experiments that may not fully capture the unique stress dynamics of multilayer systems during actual operations. Existing studies lack continuous long-term tracking of the stress evolution process and fail to focus on locations experiencing significant stress variations. Additionally, the relationship between various influencing factors and stress redistribution in bridge structures remains insufficiently captured, highlighting the need for further research in this area.
Despite extensive FE modeling and the growing adoption of ML approaches, significant knowledge gaps persist. Firstly, most bridge simulations are not supported by in-situ measurements: numerical models are rarely calibrated using long-term monitoring data, leaving their stress predictions largely unverified in practical applications [30].
Second, traditional analyses often treat loading effects as linear and independent; however, nonlinear interactions (e.g., between thermal stress and traffic-induced stress) have not been thoroughly explored by data-driven methods [31].
Third, the response behavior of critical components in double-deck bridges—including main girders, cross-frames, and deck plates—has not been systematically characterized under combined loading. Importantly, no previous study has applied XGBoost or similar models to predict stress redistribution in double-layer bridges, revealing a clear methodological gap. To our knowledge, ensemble machine learning approaches have not yet been used to capture time-series stress patterns in such structures.
Therefore, this study contributes by (i) integrating long-term multi-source monitoring data, (ii) applying XGBoost with SHAP interpretability to identify key drivers of stress redistribution, and (iii) validating ML predictions against calibrated FE models to establish a hybrid data–mechanics framework to quantify stress redistribution.
3 Engineering Project Overview
To specifically investigate the stress redistribution phenomena in double-deck dual-purpose road-rail bridges under changing operational conditions, this study is based on a bridge health monitoring project. Utilizing the extensive historical sensor data accumulated in the health monitoring system database, in-depth modeling and analysis were conducted.
3.1 Overview of the Bridge Structure
The Fanhua Avenue Bridge of the Yangtze-Huaihe Water Diversion Project is located in Feixi County, Hefei City, Anhui Province. It is the first dual-purpose road-rail double-deck steel truss arch bridge in Anhui Province. The bridge starts at Zhougongshan Road (Guosan Road), crosses Jianghuai Avenue (Paihe Avenue), the Jianghuai Canal, and the Fangxing Avenue viaduct, and ends at Xiaolongshan Road. As a key municipal bridge in the Jianghuai Communication section of the Yangtze-Huaihe Water Diversion Project, it serves as a critical crossing for Feixi County to access Hefei’s main urban area.
The main bridge comprises a 153 m span double-deck steel truss arch, accommodating both urban roadway and rail transit functions. The upper deck, spanning 47.5 m in width, carries a six-lane urban roadway in both directions as well as a metro line. The lower deck, 56 m wide, accommodates a four-lane roadway in both directions in addition to pedestrian and bicycle facilities.
The main truss employs a flexible steel arch design with an N-type triangular truss configuration incorporating vertical posts. The standard segment length is 9.0 m, with 16 segments in the main span. The truss height measures 11.9 m, and the diagonal bracing has an inclination angle of 53°. The main arch ribs consist of steel box sections with a rise-to-span ratio of 1:4.49. Additionally, five wind bracing systems are incorporated, and the arch axis follows the equation:
where L = 128.0 m, f = 28.5 m.
The overall layout of the main bridge and the traffic configuration are illustrated in Fig. 1.
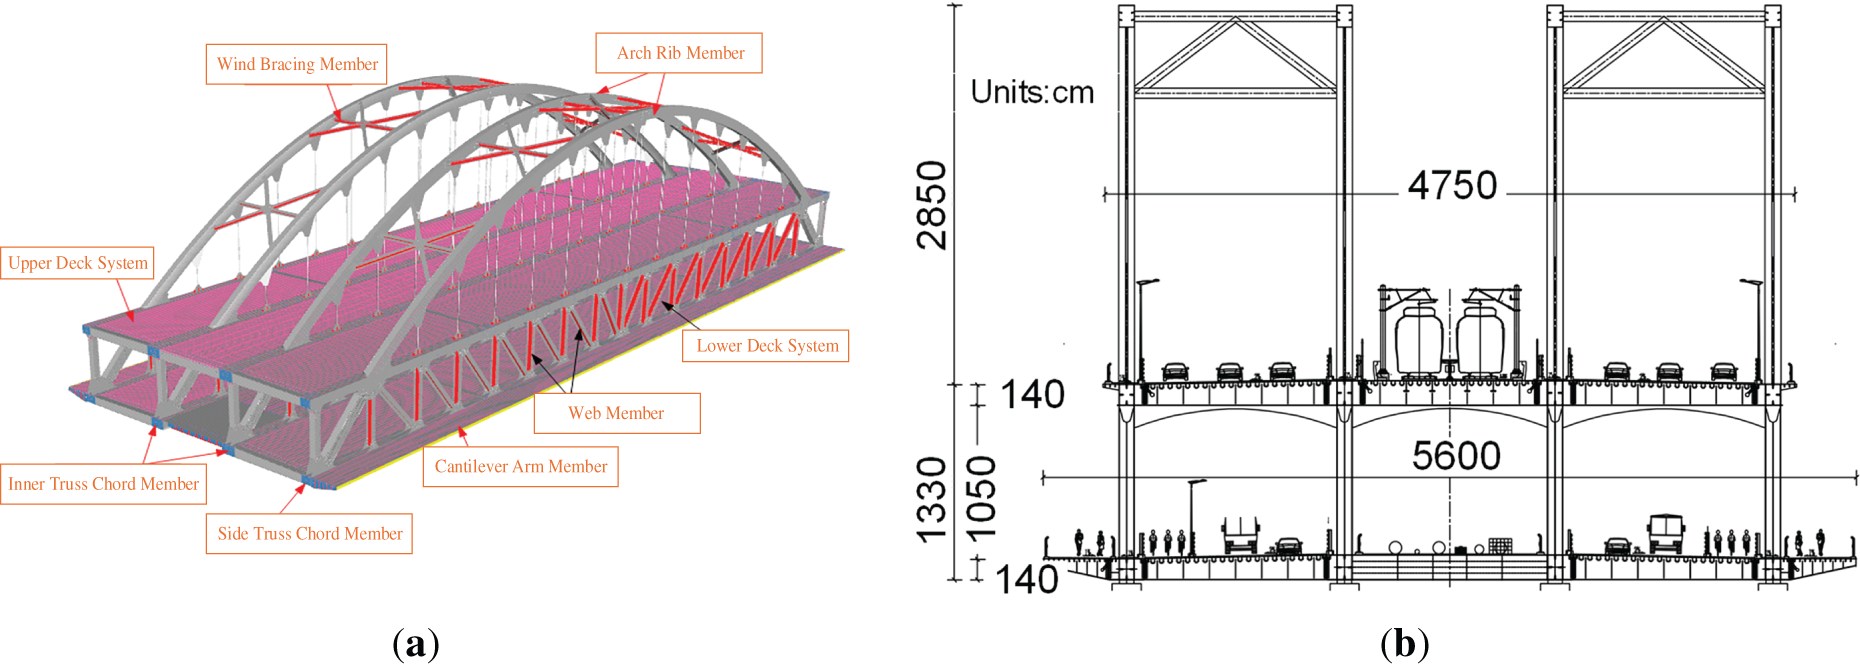
Figure 1: The overall layout of the road-rail double-deck bridges. (a) 3D-overall image of the main bridge. (b) Traffic configuration image
The total weight of the bridge is 11,894 t, distributed as follows: 2630 t for the edge members, 2831 t for the intermediate members, 2472 t for the arch ribs and wind bracing, 3919 t for the deck system, 27 t for the maintenance ladders on the arch ribs, and 15 t for the decorative lighting system. The main truss components, arch rib elements, and transverse beams in the deck system are all constructed using Q345qD-grade steel. The intermediate transverse beams and upper longitudinal connections also employ Q345qD-grade steel.
3.2 Bridge Monitoring System Layout
To ensure the long-term structural health and operational safety of the bridge, an integrated monitoring system has been installed to provide comprehensive monitoring of the entire structure. This system utilizes five types of vibrating wire sensors, strategically placed at key structural locations, covering all critical aspects of the bridge’s operation. The types of sensors and their detailed specifications are provided in Table 1.
Wireless Vibrating Wire Data Logger (6-channel, 6 units), Dynamic Data Acquisition System (1 unit), Communication Gateway (1 unit), totaling 8 units, arranged near the sensors. The monitoring system comprises 48 physical sensors, organized into groups in which each tilt or strain gauge is paired with a corresponding temperature sensor.
Total Station for supplementary measurement of arch ring spatial deformation; Portable Accelerometers for supplementary cable force measurement, primarily relying on on-site measurements by the construction monitoring team.
This monitoring system has continuously collected a variety of structural and environmental parameters since 2022, providing essential data support for in-depth analysis of the bridge’s performance. It helps in identifying key patterns and trends, which are crucial for evaluating the bridge’s health and predicting potential issues.
3.3 Changes in Operational Conditions
The bridge is a combined road and rail structure. On 1 May 2024, the southern extension of Hefei Metro Line 4 officially opened. Following the commencement of metro operations, the bridge experienced a significant increase in both static and dynamic loads, leading to notable changes in the load distribution and stress state of the structure. This has resulted in stress redistribution. Such changes introduce new challenges for evaluating the structural performance of the bridge under operational conditions, particularly in long-term safety assessments and adaptability analyses.
To explore these changes, this study selects monitoring data from two distinct periods: before the metro operation in 2023 (without train load) and after the operation in 2024 (with train load). By comparing and analyzing the variations in typical structural responses and stress redistribution characteristics, the study aims to reveal the bridge’s structural adaptability and future tendency under changing load conditions.
Traditional linear models or physics-based simulations often fail to accurately capture the nonlinear, multivariate dependencies inherent in stress redistribution in complex bridge structures, especially under mixed traffic and seasonal variations.
XGBoost, as a gradient boosting algorithm, enables accurate and interpretable modeling of such complex relationships by integrating multiple correlated inputs, including train load, temperature, component position, and structural layout.
This modeling approach is particularly valuable for double-deck steel arch bridges, where load paths and redistribution patterns are non-trivial due to geometry and functional separation of decks.
XGBoost is used for supervised learning problems, where training data with multiple features is utilized to predict the target variable. The XGBoost model is an ensemble of decision trees, specifically composed of Classification and Regression Trees (CART). In this model, a target value is divided into different leaves, and each leaf is assigned a corresponding score.
CART differs slightly from traditional decision trees, where leaves contain only decision values. In CART, each leaf is associated with a real-valued score, which enhances the model’s capacity to capture weak relationships beyond classification and improves model interpretability. Mathematically, the model can be expressed as:
where K represents the number of trees, and fk is a function from the function space F defined as:
where
The second-order Taylor expansion of the loss function involves its first-and second-order derivatives, denoted by gi and hi, respectively. The formulas are:
These terms capture the first-order gradient and second-order curvature (Hessian), which are used to approximate the loss function and optimize the tree structure efficiently.
The final objective function can be simplified into the following form:
The XGBoost model was trained using the preprocessed feature matrix X ∈ R(n × m), where n denotes the number of samples and m represents the feature dimension, along with the corresponding stress response vector y ∈ Rn. A staged training strategy was adopted, consisting of the following key steps:
(1) Initialization of the Base Learner: The training process begins by constructing an initial decision tree using a greedy algorithm, which serves as the starting point for the boosting iterations.
(2) Gradient Boosting Iterations: Subsequent trees are iteratively added to the ensemble, with each tree trained to minimize the residual errors of the preceding model. Specifically, new trees are optimized to minimize the mean squared error (MSE) loss function, thereby refining predictions and enhancing overall model performance.
(3) Early Stopping Mechanism: To prevent overfitting, training is terminated if the validation loss fails to improve for five consecutive iterations.
To further enhance computational efficiency, two key optimization techniques were employed:
Parallel Feature Splitting: Parallel computing was leveraged to accelerate the search for optimal feature split points, significantly reducing training time.
Histogram-Based Approximation: A histogram-based method was employed to approximate feature distributions, efficiently reducing memory requirements while preserving model accuracy.
The final model converged after 302 iterations, achieving a coefficient of determination (R2) of 0.65 on the validation set, demonstrating high predictive accuracy and strong generalization performance.
The experimental environment for this study is Python 3.12 and XGBoost 3.0.4, with a CPU runtime.
To ensure the reliability and consistency of the monitoring data, a multi-step preprocessing workflow was implemented following established procedures reported in previous studies.
First, sensor anomalies were identified using statistical outlier detection and cross-sensor consistency checks, allowing for the removal of spurious spikes caused by transient disturbances [32,33]. Sensor drift was mitigated through periodic baseline recalibration, and hardware faults were addressed by replacing malfunctioning units. Data segments affected by such faults, as identified through diagnostic logs, were excluded from subsequent analyses.
For the raw data obtained from the sensors, secondly, we applied spline interpolation to fill in any missing data points, primarily caused by communication interruptions or temporary sensor downtime. Spline interpolation is a smooth method for imputation that preserves the underlying trends of the data, ensuring continuity and consistency in the dataset.
To enhance data reliability and consistency, imputed values were standardized using z-scores, enabling the identification and removal of potential outliers. Based on the 3σ criterion, Z outliers (0.33% of the dataset) were identified and removed before model training. This normalization process mitigates the influence of extreme values on the subsequent analysis, ensuring that the data is better suited for modeling.
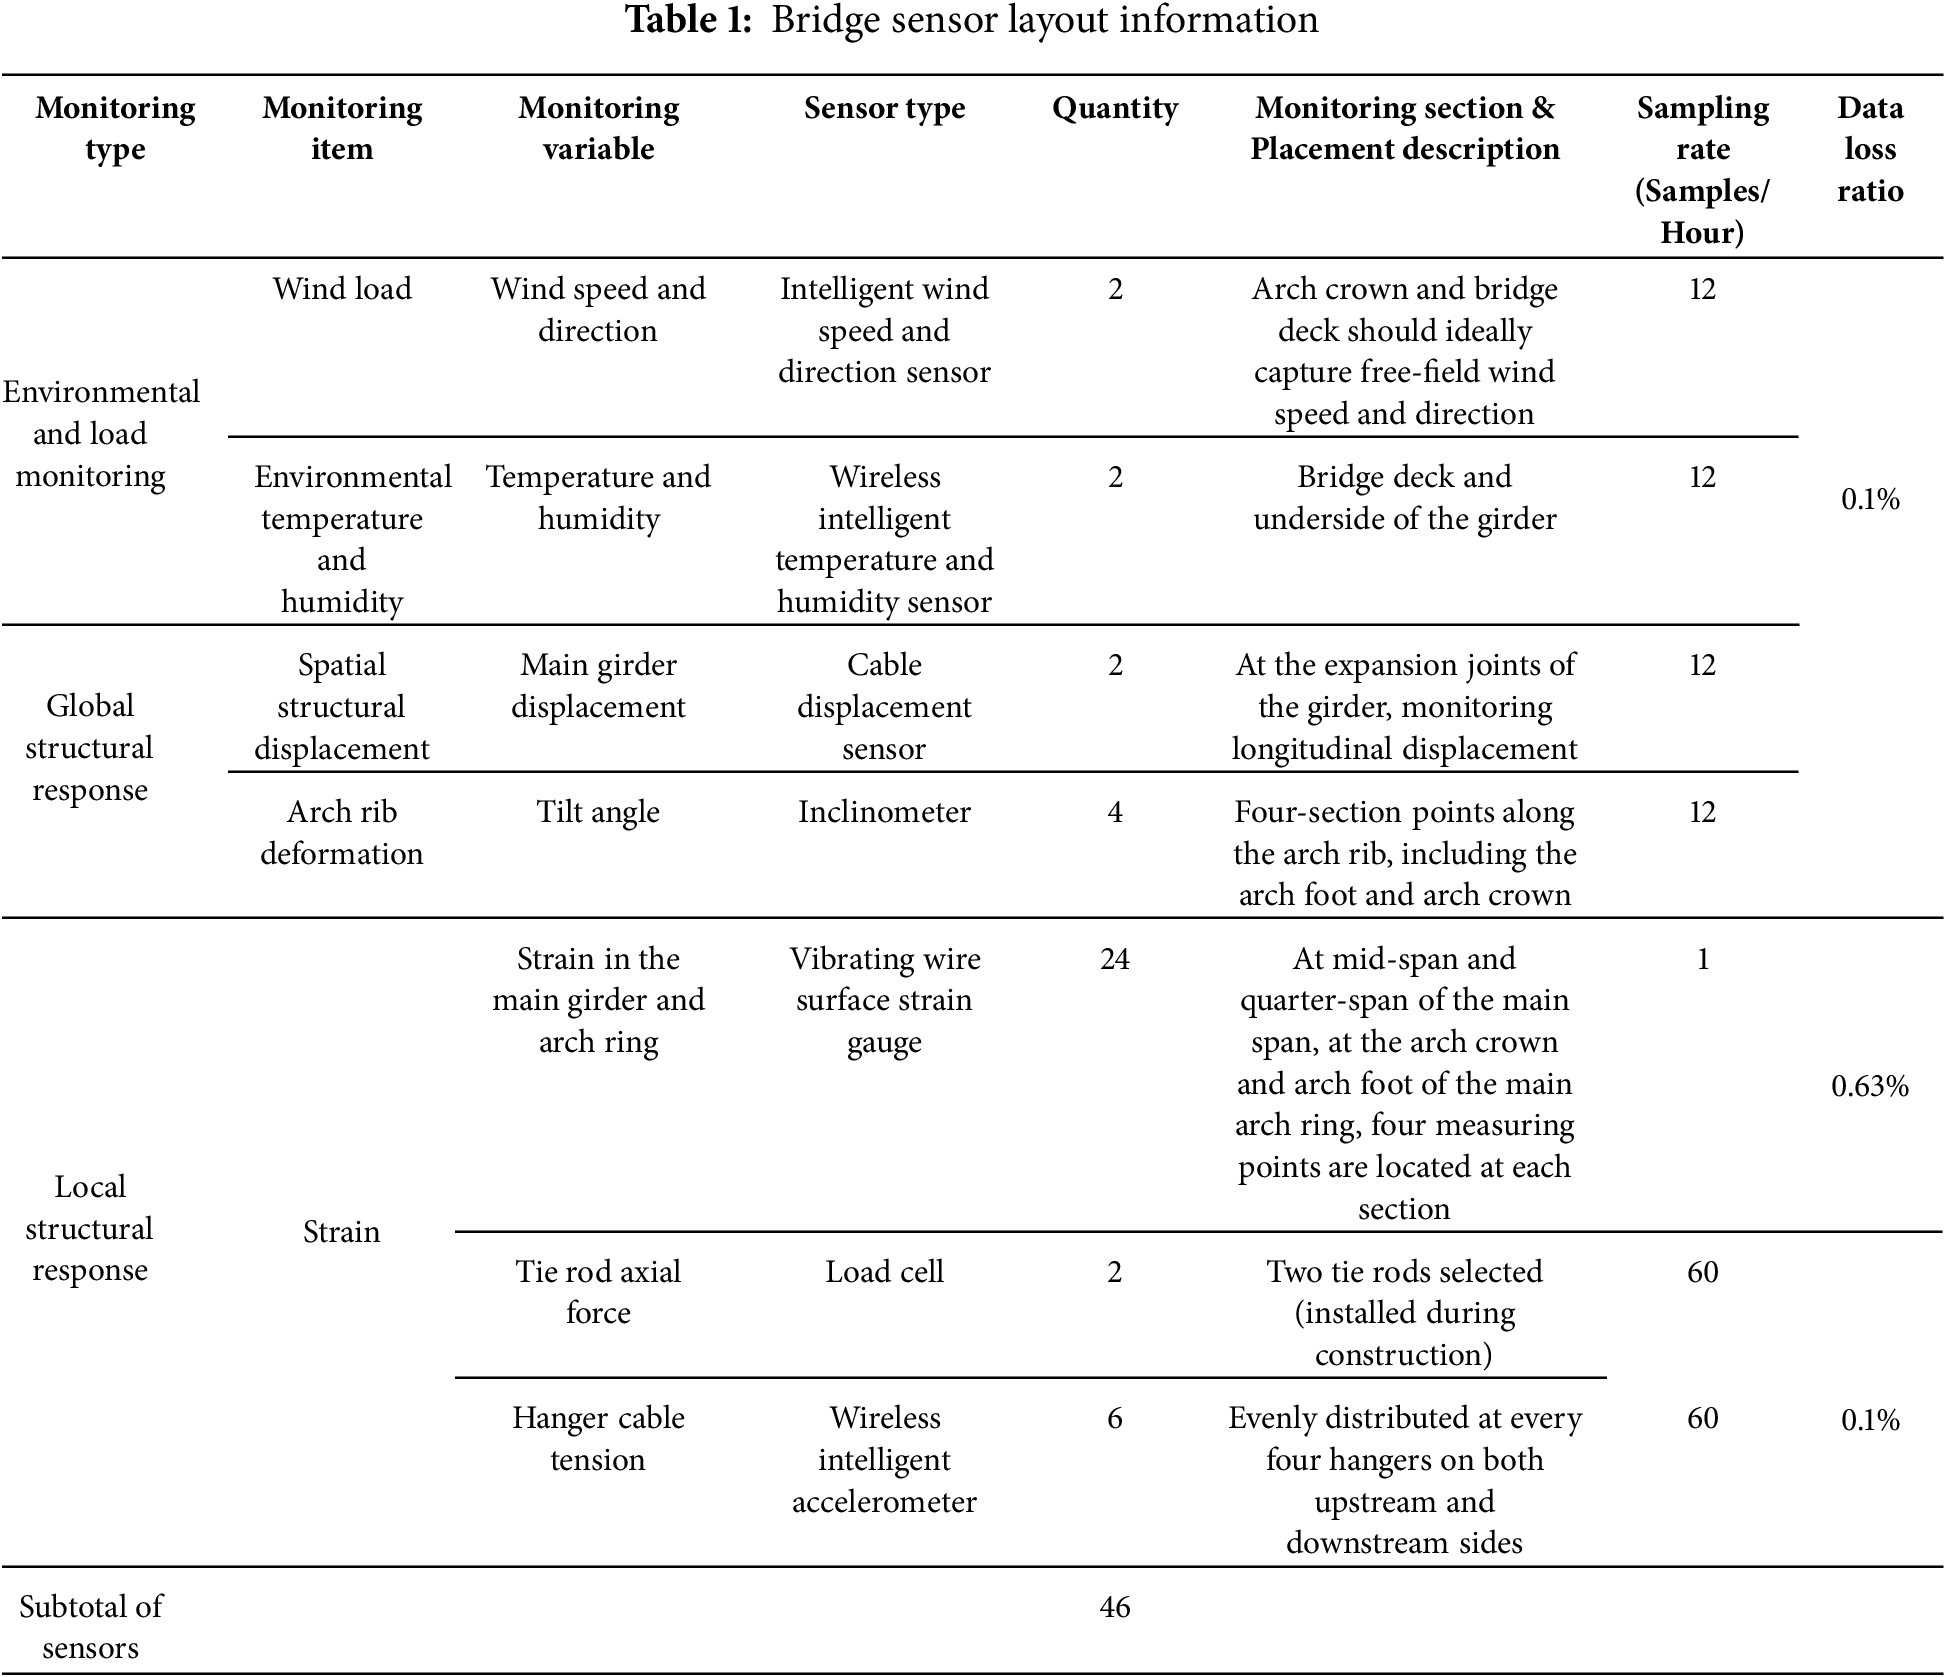
In cases where certain sensors exhibited substantial deviations in their readings, we applied the Yeo-Johnson transformation. This transformation method is effective in addressing issues such as skewness and kurtosis, as it transforms non-normal distributions into a form that approximates a normal distribution. Fig. 2 illustrates the data distributions at three stages: before preprocessing, after outlier removal and interpolation, and after Yeo–Johnson transformation. The transformation effectively reduced skewness and improved the normality of the data.
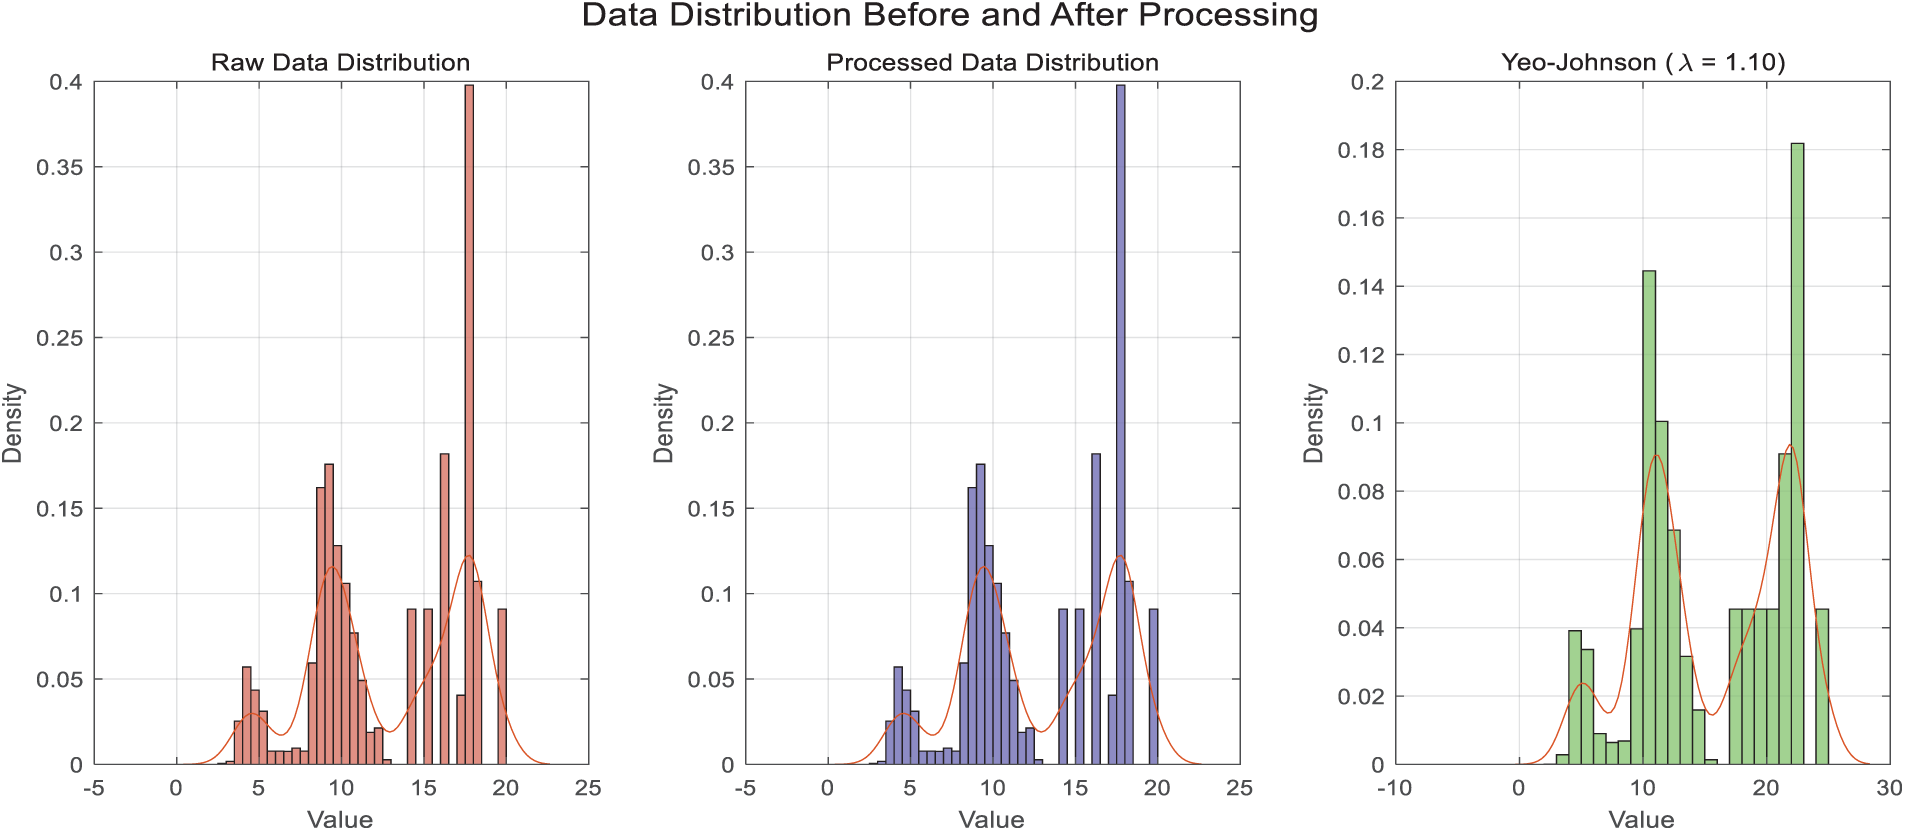
Figure 2: Data distributions before and after preprocessing
By implementing these data preprocessing techniques, we were able to significantly improve the quality of the dataset, ensuring that the input data for the subsequent modeling and prediction steps is both accurate and reliable.
5.2 Overall View of the Stress Redistribution Based on History Data
The double-deck arch bridge commenced its operation in October 2022, initially bearing only vehicular loads. In May 2024, after the opening of the second-deck rail transit, the upper deck of the bridge began directly bearing the train loads.
Based on the principles of bridge structure and elastoplastic mechanics, it is hypothesized that, when the subway trains pass, due to the concentrated load effect, the upper structure (such as the bridge deck, main beams, or upper arch ribs) primarily bears significant vertical loads and horizontal moments, with the mid-span area being particularly noticeable, exhibiting large dynamic strain amplitudes. Furthermore, the rail deck experiences substantial vertical deformation and tensile–compressive strain in response to the dynamic loading induced by train traffic. Although the lower structure indirectly bears the train loads through the overall bridge, the stresses and strains in both the longitudinal and transverse directions of the bridge are still affected. Notably, at critical load-bearing locations, including the main arches and bearings, stress concentrations arise as the upper-deck load is transferred to the lower structure, leading to localized increases in strain. The regions at the top of the pier and below the arch ribs also experience vertical compressive strains due to the transfer of train loads, significantly enhancing the local strain characteristics.
To extract the strain monitoring data from the same period in 2023 and 2024 (April to June) for the daily 00:00 measurements, the data are plotted on the same graph. Due to their size, comprehensive visualizations of the sensor measurements are included in Appendix A, as shown in Fig. A1.
Further statistical comparison was conducted on the extracted monitoring data from the same time periods, and boxplots were generated for each strain sensor. Considering the distinct load-bearing characteristics of the bridge’s two levels, the strain data were categorized by the first and second decks for separate visualization to investigate the load response characteristics of different structural decks. The result is shown in Fig. 3.
Figure 3: Comparison of boxplots of strain sensor measurements of the 1st deck (a) and the 2nd deck (b). Where f1/f2 stands for lower/upper deck, HQ/SQ stands for cross/bridge direction, and 1/2/3/4 stands for the 1st/2nd/3rd/4th beams from upstream
The results indicate that the strain measurements on the first deck showed a slight overall decrease after the rail transit commenced operation, though the number of extreme values increased. Conversely, strain measurements on the second deck revealed a significant impact of the train live load, particularly evident in the longitudinal direction at the 3rd and 4th girders (sensors ZL and B, counting from upstream), where strain values exhibited a sharp increase.
5.3 Further Quantitative Analysis
The dataset was primarily constructed using data from 26 strain gauges placed at the mid-span of the bridge. The sensor placement and naming conventions are as described in Table 1 from the previous section.
Key variables, including force direction, beam location, and other relevant parameters, were extracted from the sensor data together with their corresponding stress measurements to construct the dataset. The structure of the dataset and the definitions of the variations are illustrated in Fig. 4a and Table 2. In this dataset, Deck, beam position, stress direction, and train operation are categorical variables, while the remaining variables are continuous. Specifically, two time-related variables need to be declared. Time difference represents the cumulative number of days since the commencement of metro operation. This variable captures long-term structural adaptation and gradual stress redistribution patterns that evolve with operational aging and environmental cycles.
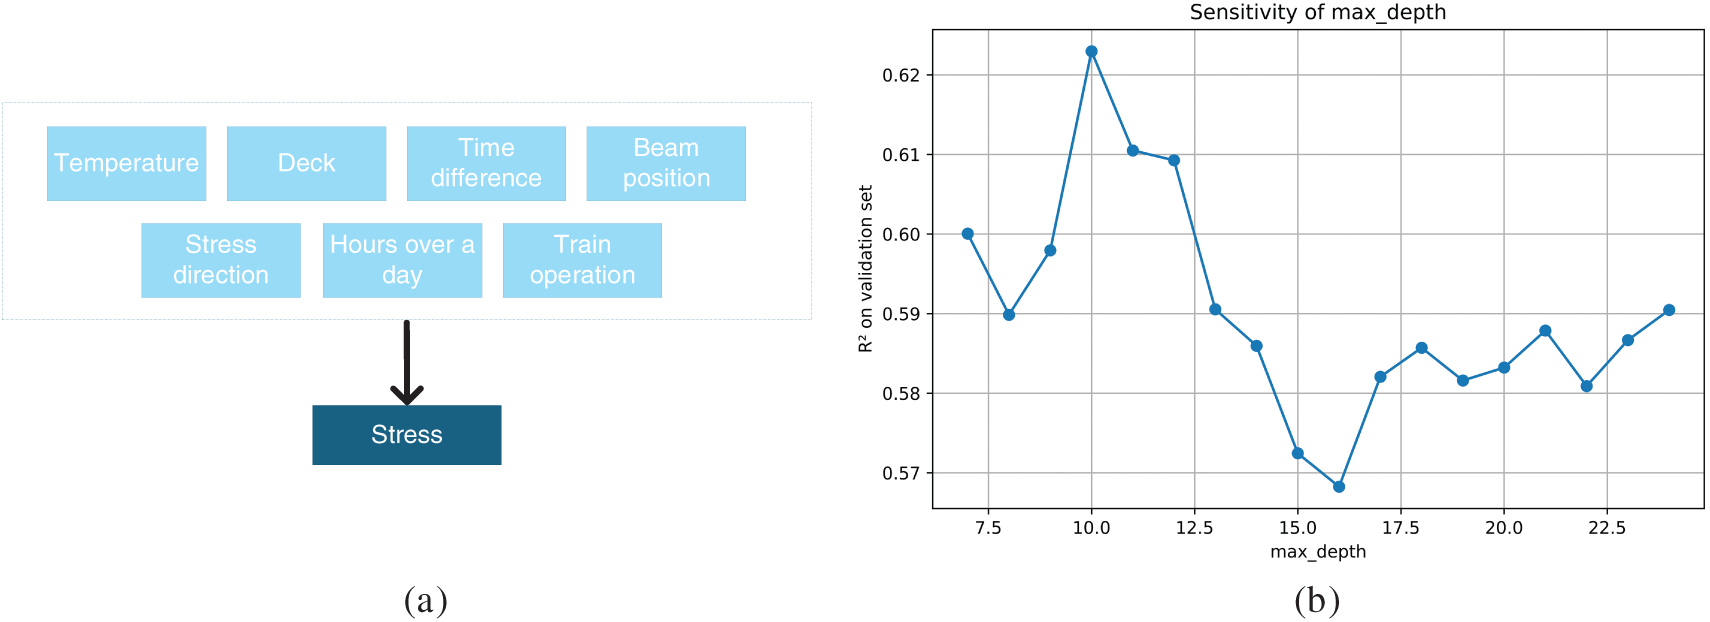
Figure 4: The model dataset structure (a) and best parameters fitting curve (b)
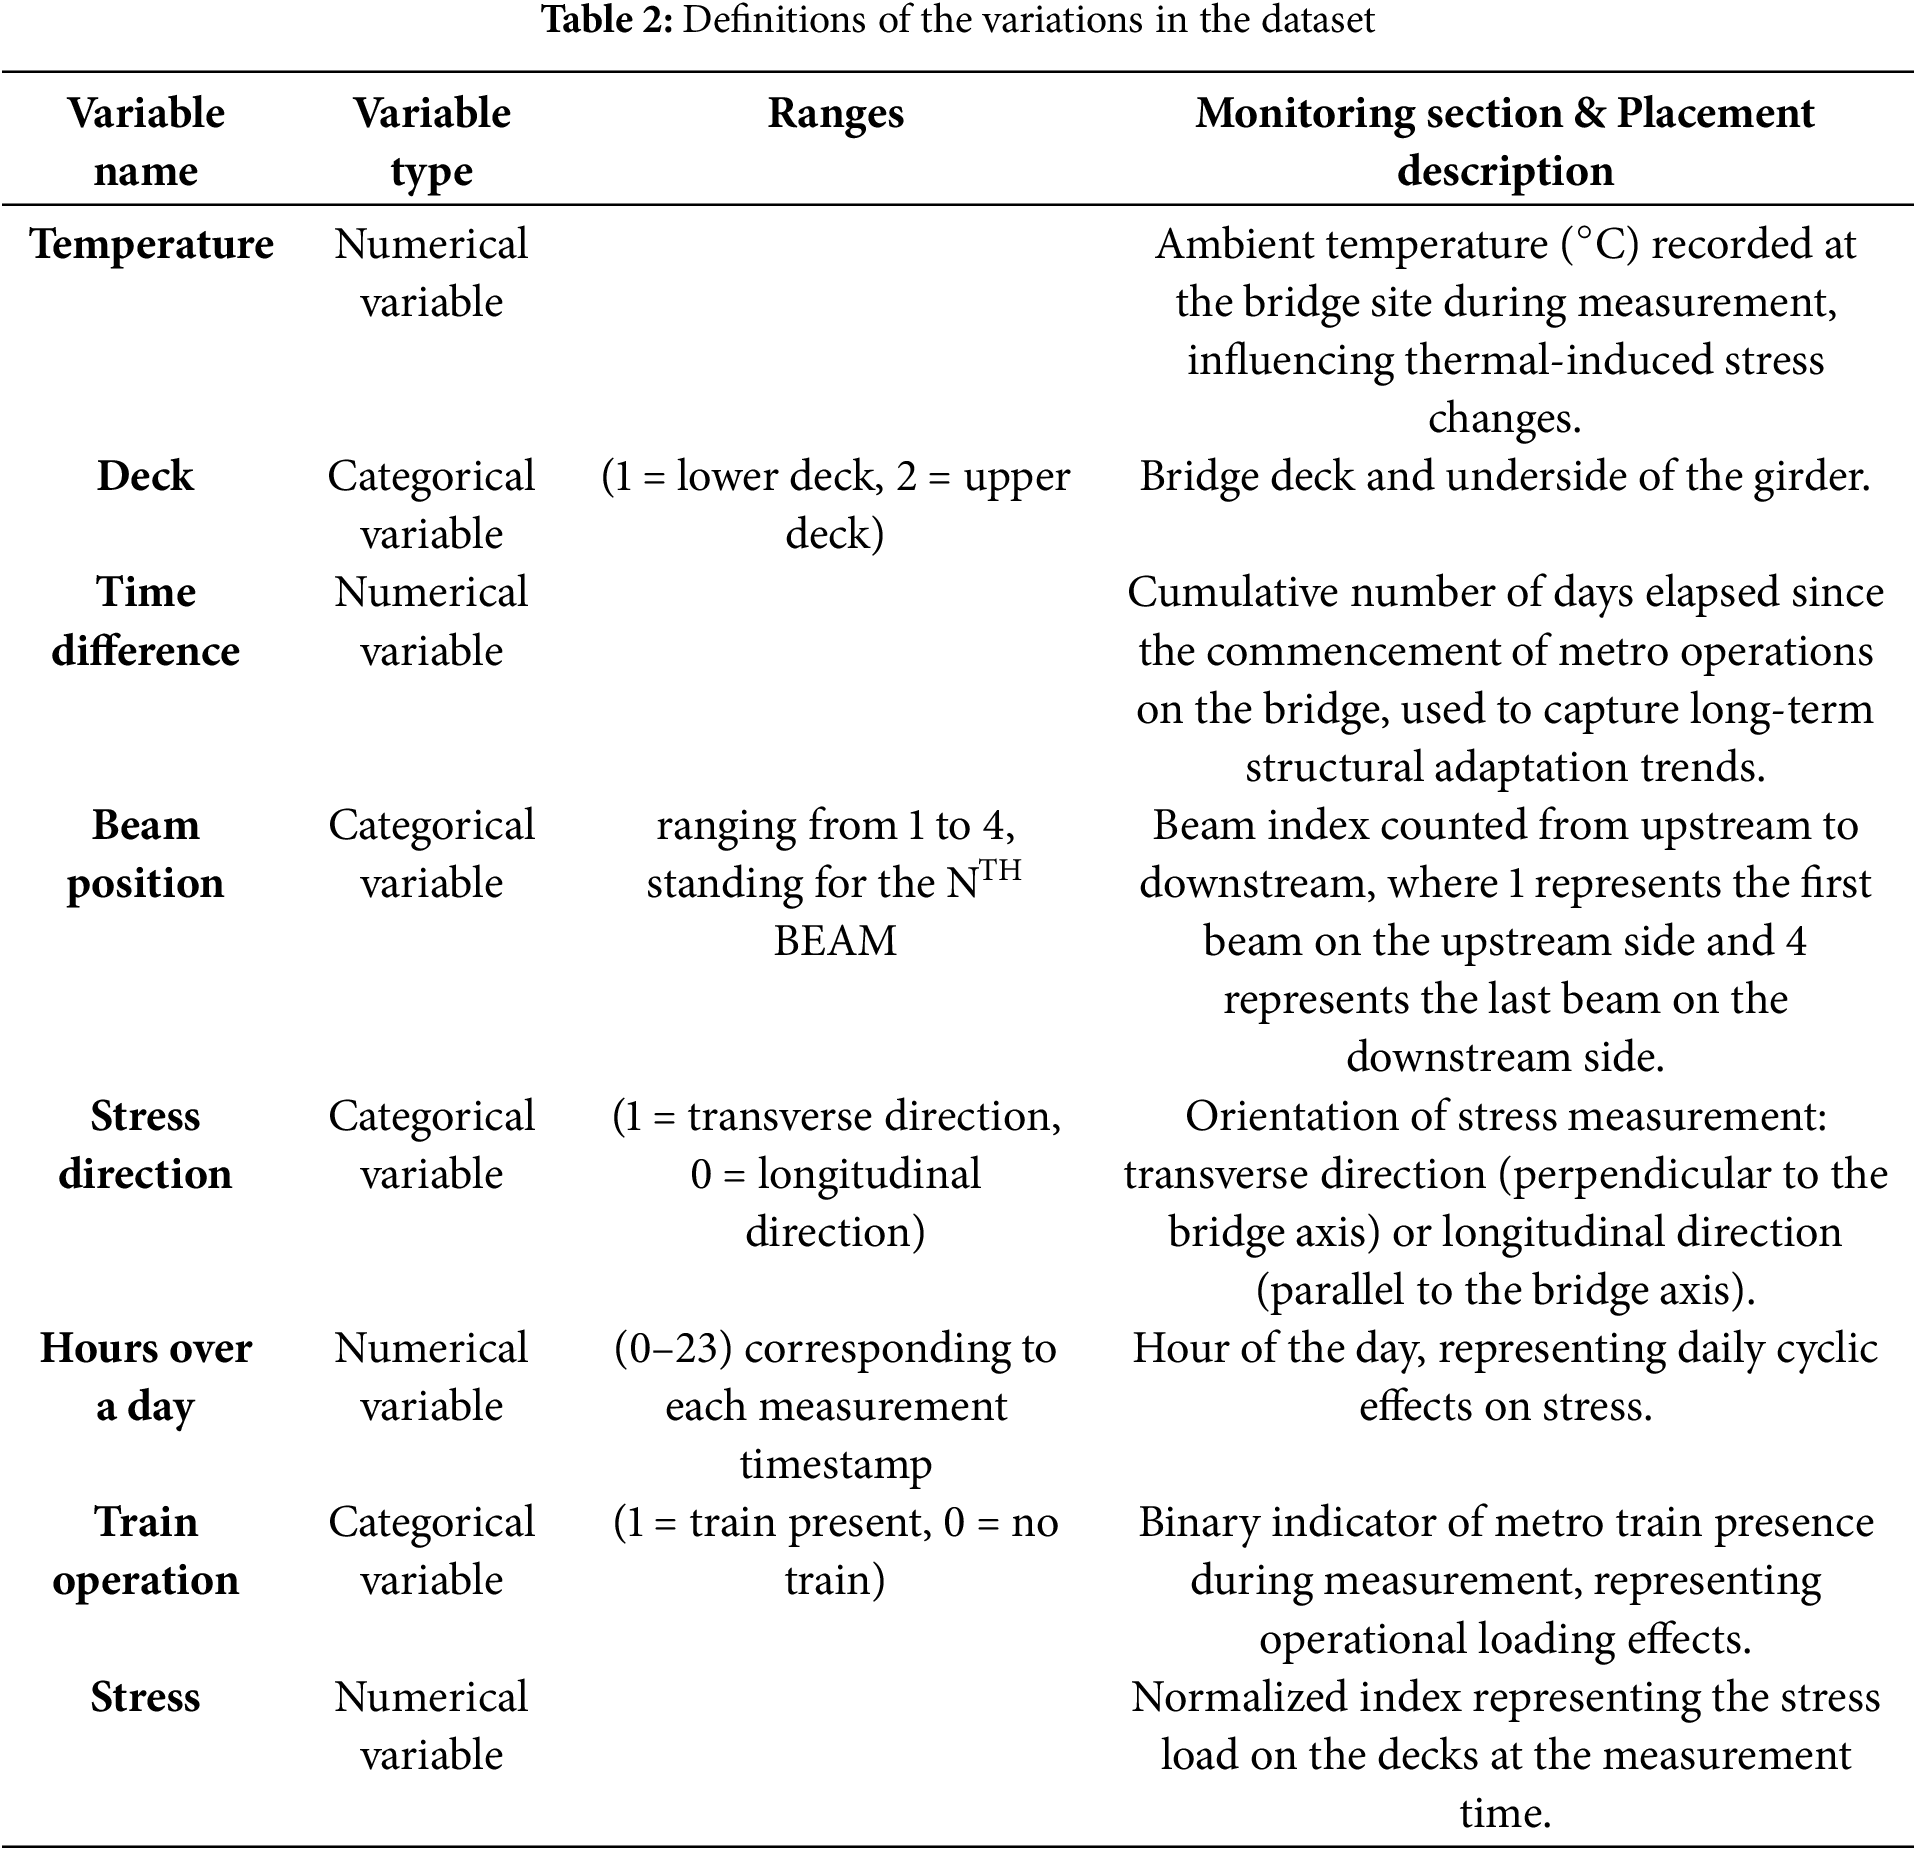
Variable Hour of the day accounts for diurnal variations in temperature, traffic flow, and other environmental factors that can induce cyclical stress fluctuations in bridge components. To enable processing by the XGBoost model, categorical variables were first converted into numerical values through appropriate encoding techniques. This preprocessing step ensures that the model can efficiently handle both categorical and continuous data, making it suitable for subsequent analysis and prediction.
Model Parameter Selection
In this study, the XGBoost regression model was selected as the core predictive algorithm [34]. The hyperparameters related to tree complexity, such as the number of estimators and maximum tree depth, were systematically tuned following a standard protocol outlined in prior work [35]. The model parameters in this study were fine-tuned through grid search and cross-validation, with the optimal configuration determined as follows in Fig. 4:
n_estimators: 1000 (Number of boosting trees, with the optimal number of iterations confirmed using early stopping)
max_depth: 10 (Maximum depth of individual trees, balancing model complexity and the risk of overfitting)
learning_rate: 0.1 (Learning rate, controlling the step size in gradient boosting)
random_state: 42 (Random seed, ensuring the reproducibility of the experiments)
This parameter combination demonstrated the best generalization performance on the validation set. The joint tuning of the learning rate and tree depth effectively mitigated overfitting in the high-dimensional feature space, improving the model’s robustness and predictive accuracy.
5.4 The Reveal Stress Redistribution Patterns
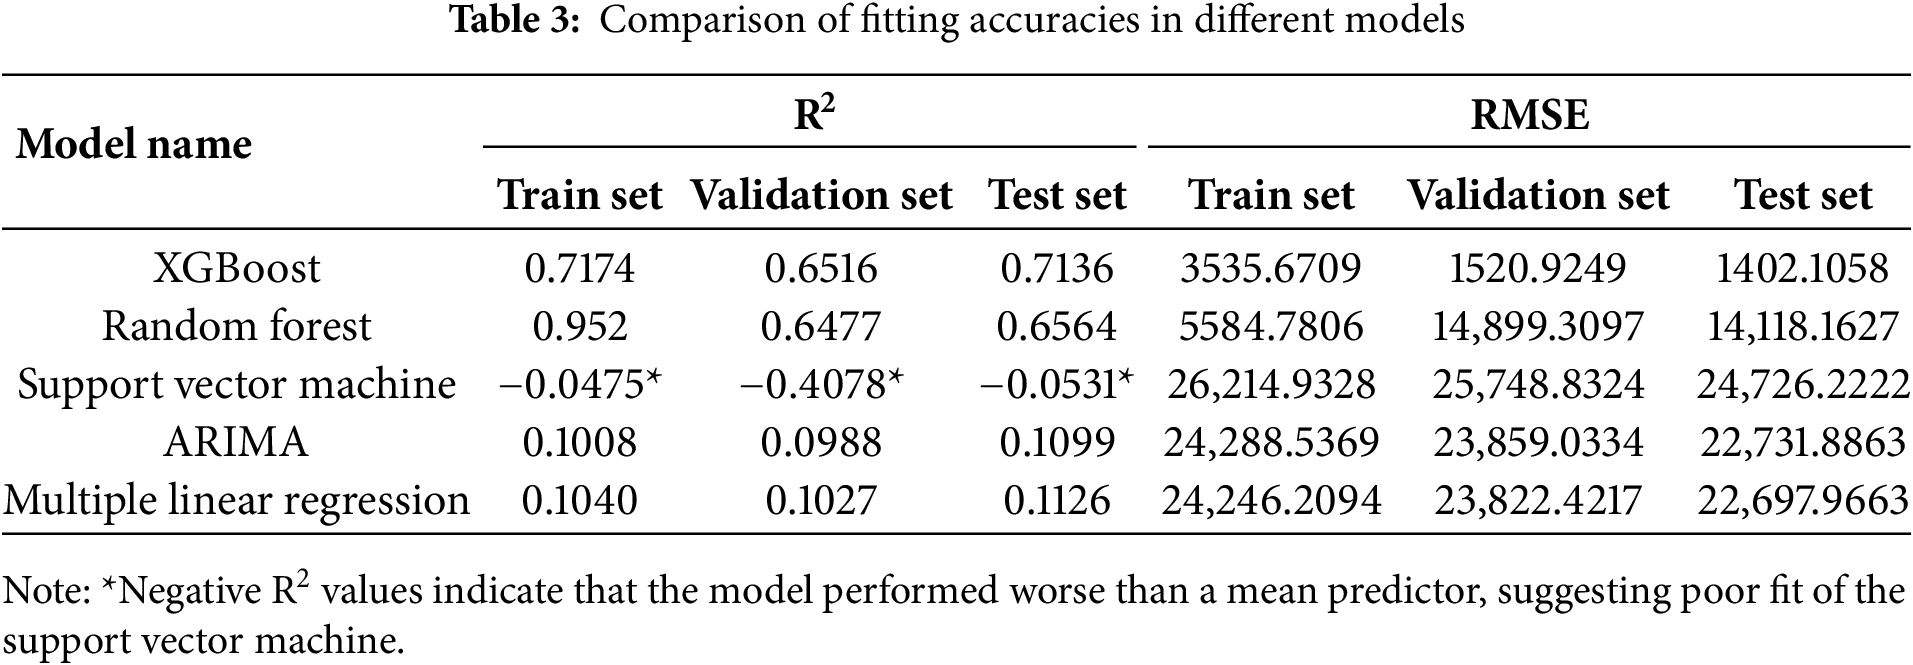
The model, based on the regularized gradient boosting framework [36], effectively captures the nonlinear relationships between stress responses and multidimensional features. The comparative results are summarized in Table 3. XGBoost achieved the most balanced and robust performance across all subsets, with coefficients of determination. By contrast, the RF model achieved a relatively high R2 on the training set (0.71) but exhibited substantial performance deterioration on the validation and test sets, with markedly elevated RMSE (Root Mean Square Error) values, indicating pronounced overfitting. SVM (Support Vector Machine) performed poorly, with negative R2 values across all subsets, implying that it failed to learn any meaningful relationships and performed worse than a naive mean predictor. Similarly, ARIMA and MLR (Multiple Linear Regression) yielded R2 values close to 0.1 and RMSE values exceeding 22,000, confirming that purely linear models are insufficient for representing the complex structural dynamics considered here.
5.4.1 Feature Importance Analysis
The Shapley Additive Explanations (SHAP) framework [37], based on game theory, provides an effective method for quantifying the marginal contribution of each feature to the stress prediction.
SHAP Value Calculation: For each feature, the SHAP value represents its contribution, or the impact of that feature on the prediction result. A unique property of SHAP values is that the sum of the SHAP values across all features equals the model’s prediction, minus the average prediction value.
Global and Local Interpretability: SHAP values offer both global and local explanations of model decisions, making them particularly useful for interpretability analysis in complex models.
The SHAP analysis plots in Fig. 5 clearly identify the factors that most significantly influence stress variation. The results show that beam position is the most important factor affecting stress variation, indicating that the loading conditions at different beam positions underwent significant changes during subway operations. Following beam position, the temperature, stress layer, and cumulative time since subway operation emerge as key factors, with these variables playing a crucial role in stress redistribution. Particularly after the subway began operations, the influence of temperature and stress layer changes on stress gradually intensified over time.
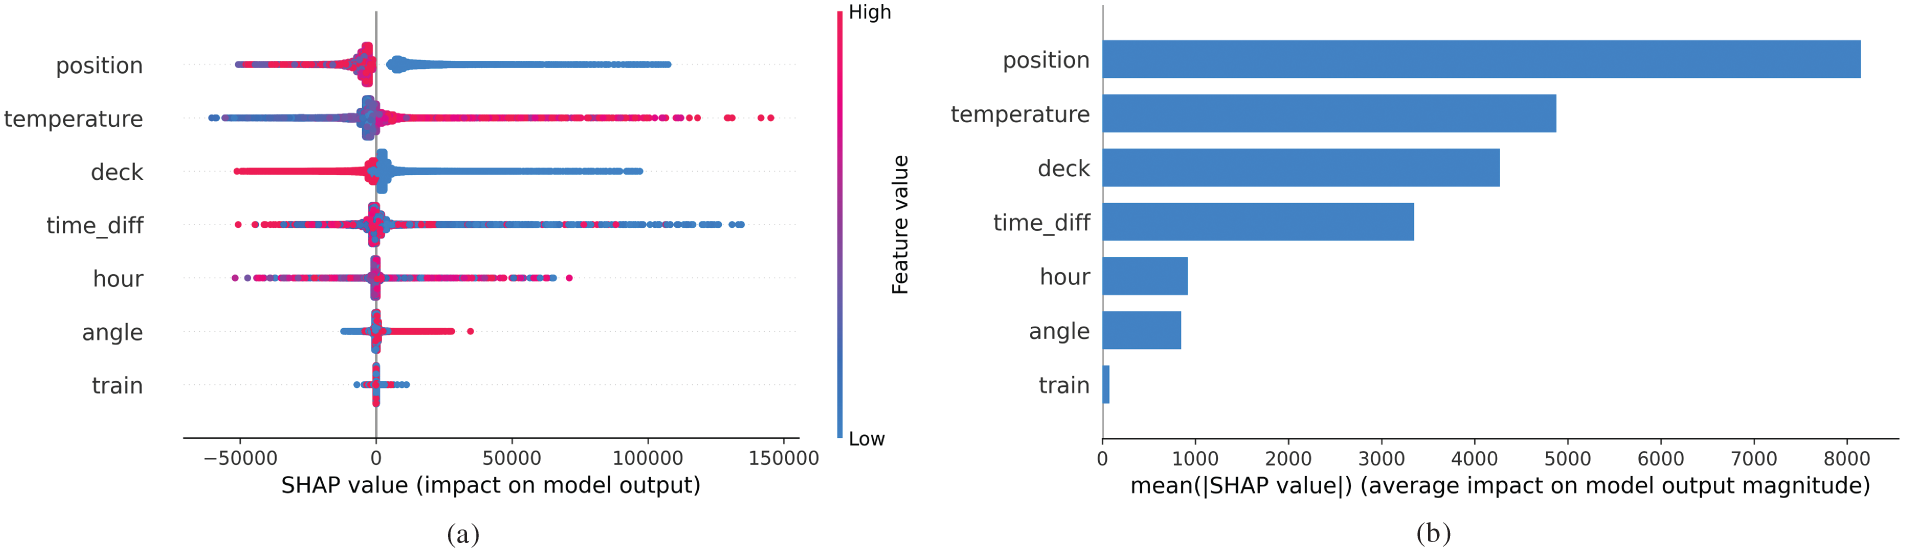
Figure 5: Global bar plot (a) and summary plot (b) of the SHAP plot of the XGBoost model
Additionally, the hour of the day and stress direction were identified as secondary influencing factors, indicating that while these variables exert some effect on stress variations, their impact is relatively minor compared with that of position, temperature, and other primary factors. Lastly, considering the high temporal precision of train operations and the sampling limitations of the bridge monitoring system, the standalone train operation status variable had minimal influence on stress variations. However, when analyzed in combination with the time difference relative to the train event (time-diff), a more comprehensive picture emerges. As shown in the SHAP analysis of pre-and post-opening periods (Fig. A2 in Appendix A), the time difference associated with train events induces notable variations in stress distributions across different bridge decks. Specifically, observations recorded on Deck 2 following train operations are associated with positive SHAP contributions, whereas those from Deck 1 predominantly exhibit negative contributions. This systematic divergence indicates that post-event structural responses are not only time-dependent but also strongly deck-dependent, reflecting asymmetric thermal effects or load transfer mechanisms within the bridge.
Dependency analysis primarily utilizes SHAP’s dependency plots to reveal the relationship between a given feature and the predicted target, as well as the interactions between that feature and other features.
The Partial Dependence Plot (PDP) analysis in Fig. 6, based on the different beam positions and stress variations, indicates that the sensitivity of stress variation differs across beam positions. Specifically, the stress values of the first and last beams, located at the upstream and downstream ends of the bridge, are significantly higher than those of the two beams positioned in the middle. This phenomenon may reflect local stress concentration effects in the structure, suggesting that the beams at both ends of the bridge might experience higher stress during load transfer. Furthermore, the PDP analysis reveals that the beams aligned in the longitudinal direction of the bridge exhibit stronger sensitivity to stress changes, which is likely related to the bridge’s structural layout and load transfer mechanisms.
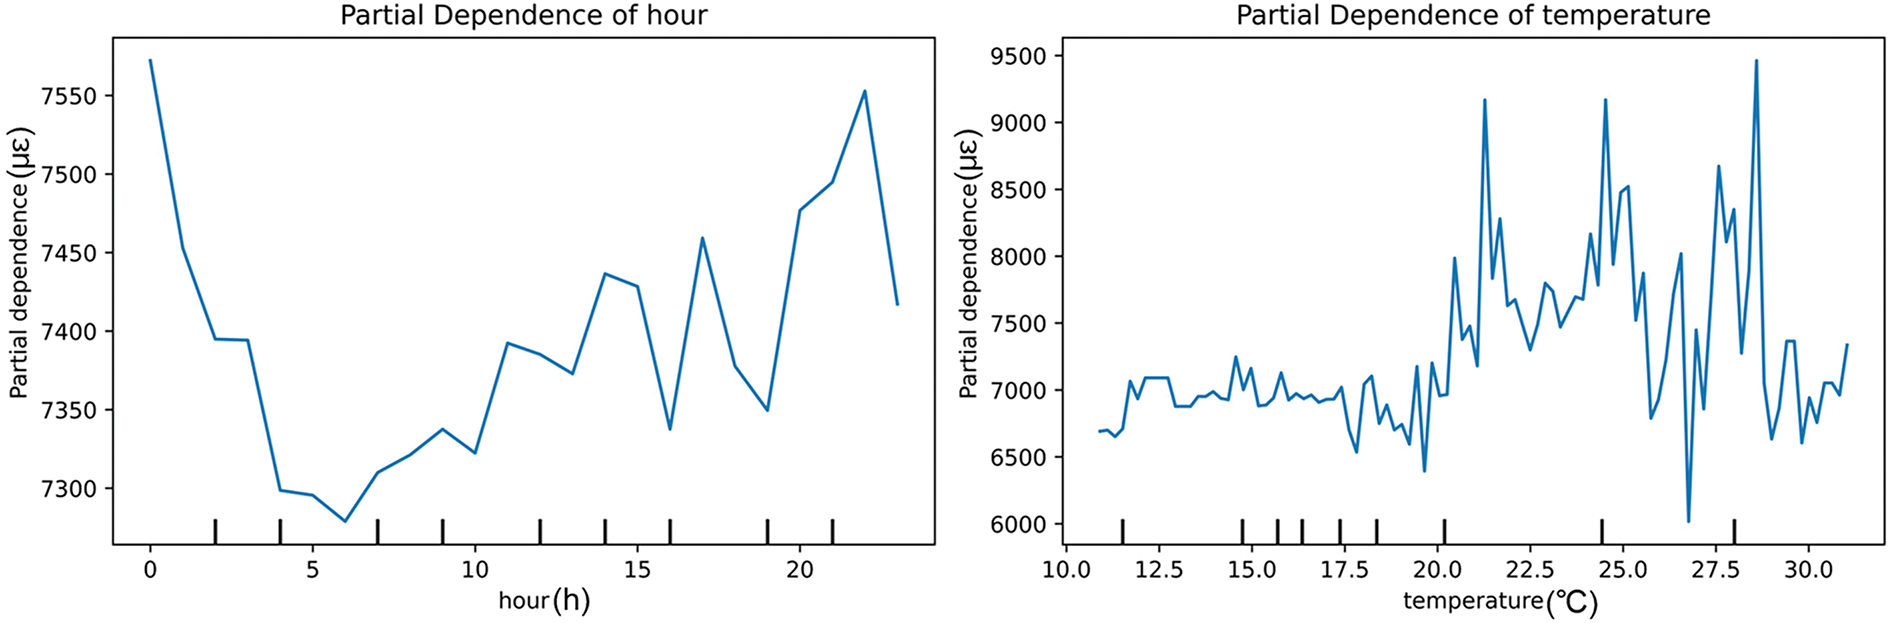
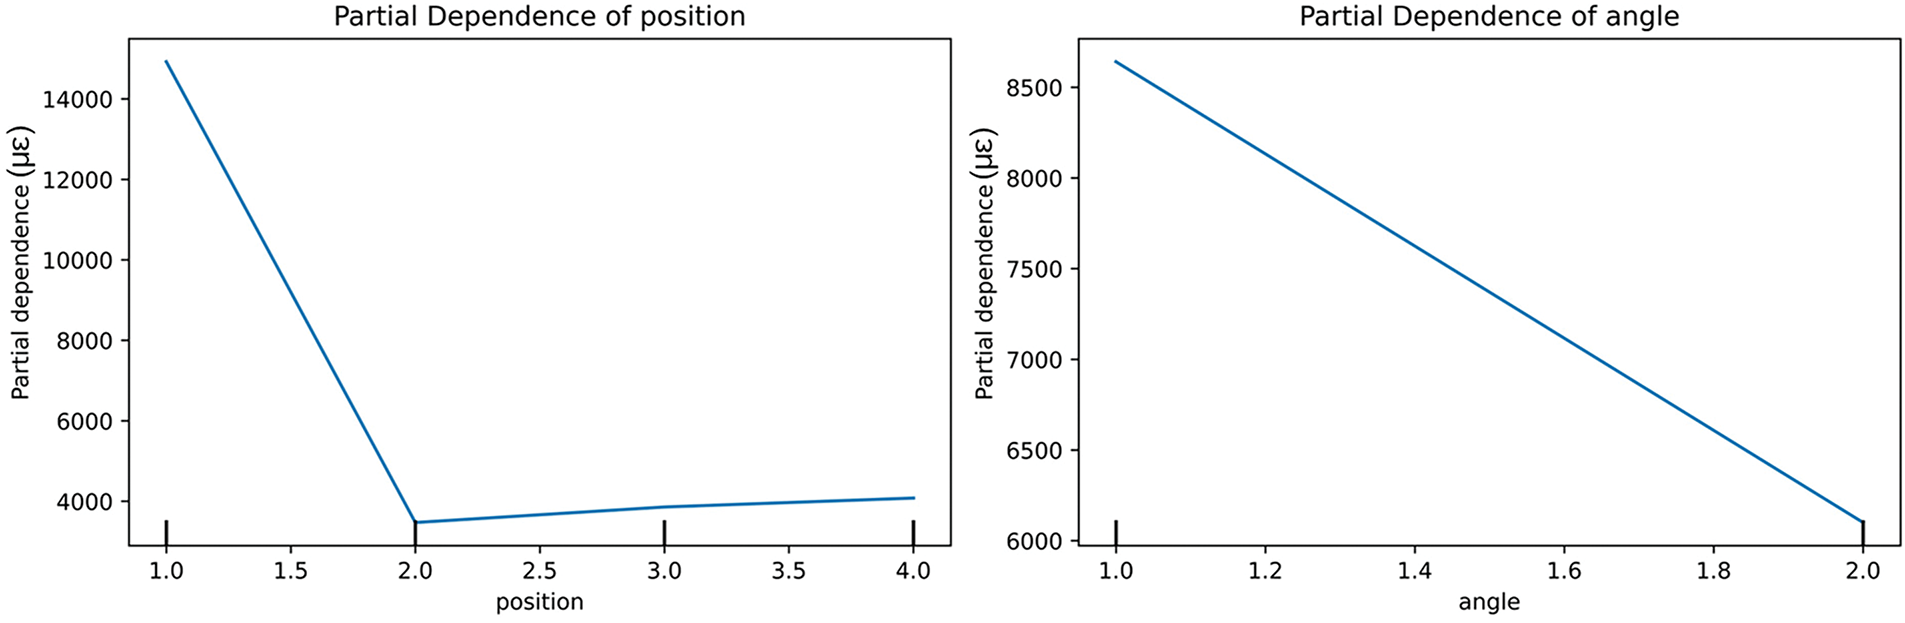
Figure 6: Dependency analysis of stress redistribution
In the PDP analysis of stress variation with respect to time of day and temperature, the results reveal a pronounced sensitivity to both temporal and thermal factors. Specifically, the sensitivity to stress variation is relatively low during early morning and afternoon periods, reflected in lower stress peaks. As the temperature rises, the stress in the bridge gradually increases, indicating a significant impact of temperature changes on the bridge’s stress. This phenomenon may be attributed to the thermal expansion effects of the bridge materials and their impact on the structure, where elevated temperatures could cause beam deformation and stress concentration. A partial dependence analysis was conducted to quantify the relationship between temperature and stress. The sensitivity analysis of the thermal response was restricted to the subset of data with temperatures in the range of 15°C–25°C. The corresponding PDP plot is presented in Appendix A, Fig. A3. Beam 3 exhibited greater sensitivity to temperature variations, likely due to its exposure to increased solar radiation. A partial dependence analysis was conducted to quantify the relationship between temperature and stress. The sensitivity analysis of the thermal response was restricted to the subset of data with temperatures in the range of 15°C–25°C. The corresponding PDP plot is presented in Fig. A3. Beam 3 exhibited greater sensitivity to temperature variations, likely due to its exposure to increased solar radiation. Overall, the results indicate that, on average, a 1°C rise in temperature corresponds to an 8–14 με change in stress, which is consistent with the expected thermo-mechanical behavior of the bridge structure.
5.4.3 Future Distribution Prediction
Based on the established model, stress variations for each beam were forecasted from 2025 onwards, covering 4 months (time indices 100–160). To ensure predictive reliability, the model was trained exclusively on historical monitoring data preceding 2025, and an independent dataset from January 2025 was reserved as the out-of-sample validation set. This temporal separation prevented information leakage between training and testing phases. Model performance on the unseen January 2025 data achieved a Mean Squared Error (MSE) of 0.71, indicating high predictive accuracy in capturing stress variation trends under real operational conditions.
To better illustrate these trends, multiple relational plots were generated, revealing the relationships between different variables and their sensitivity to time. The results in Fig. 7 are presented as follows:
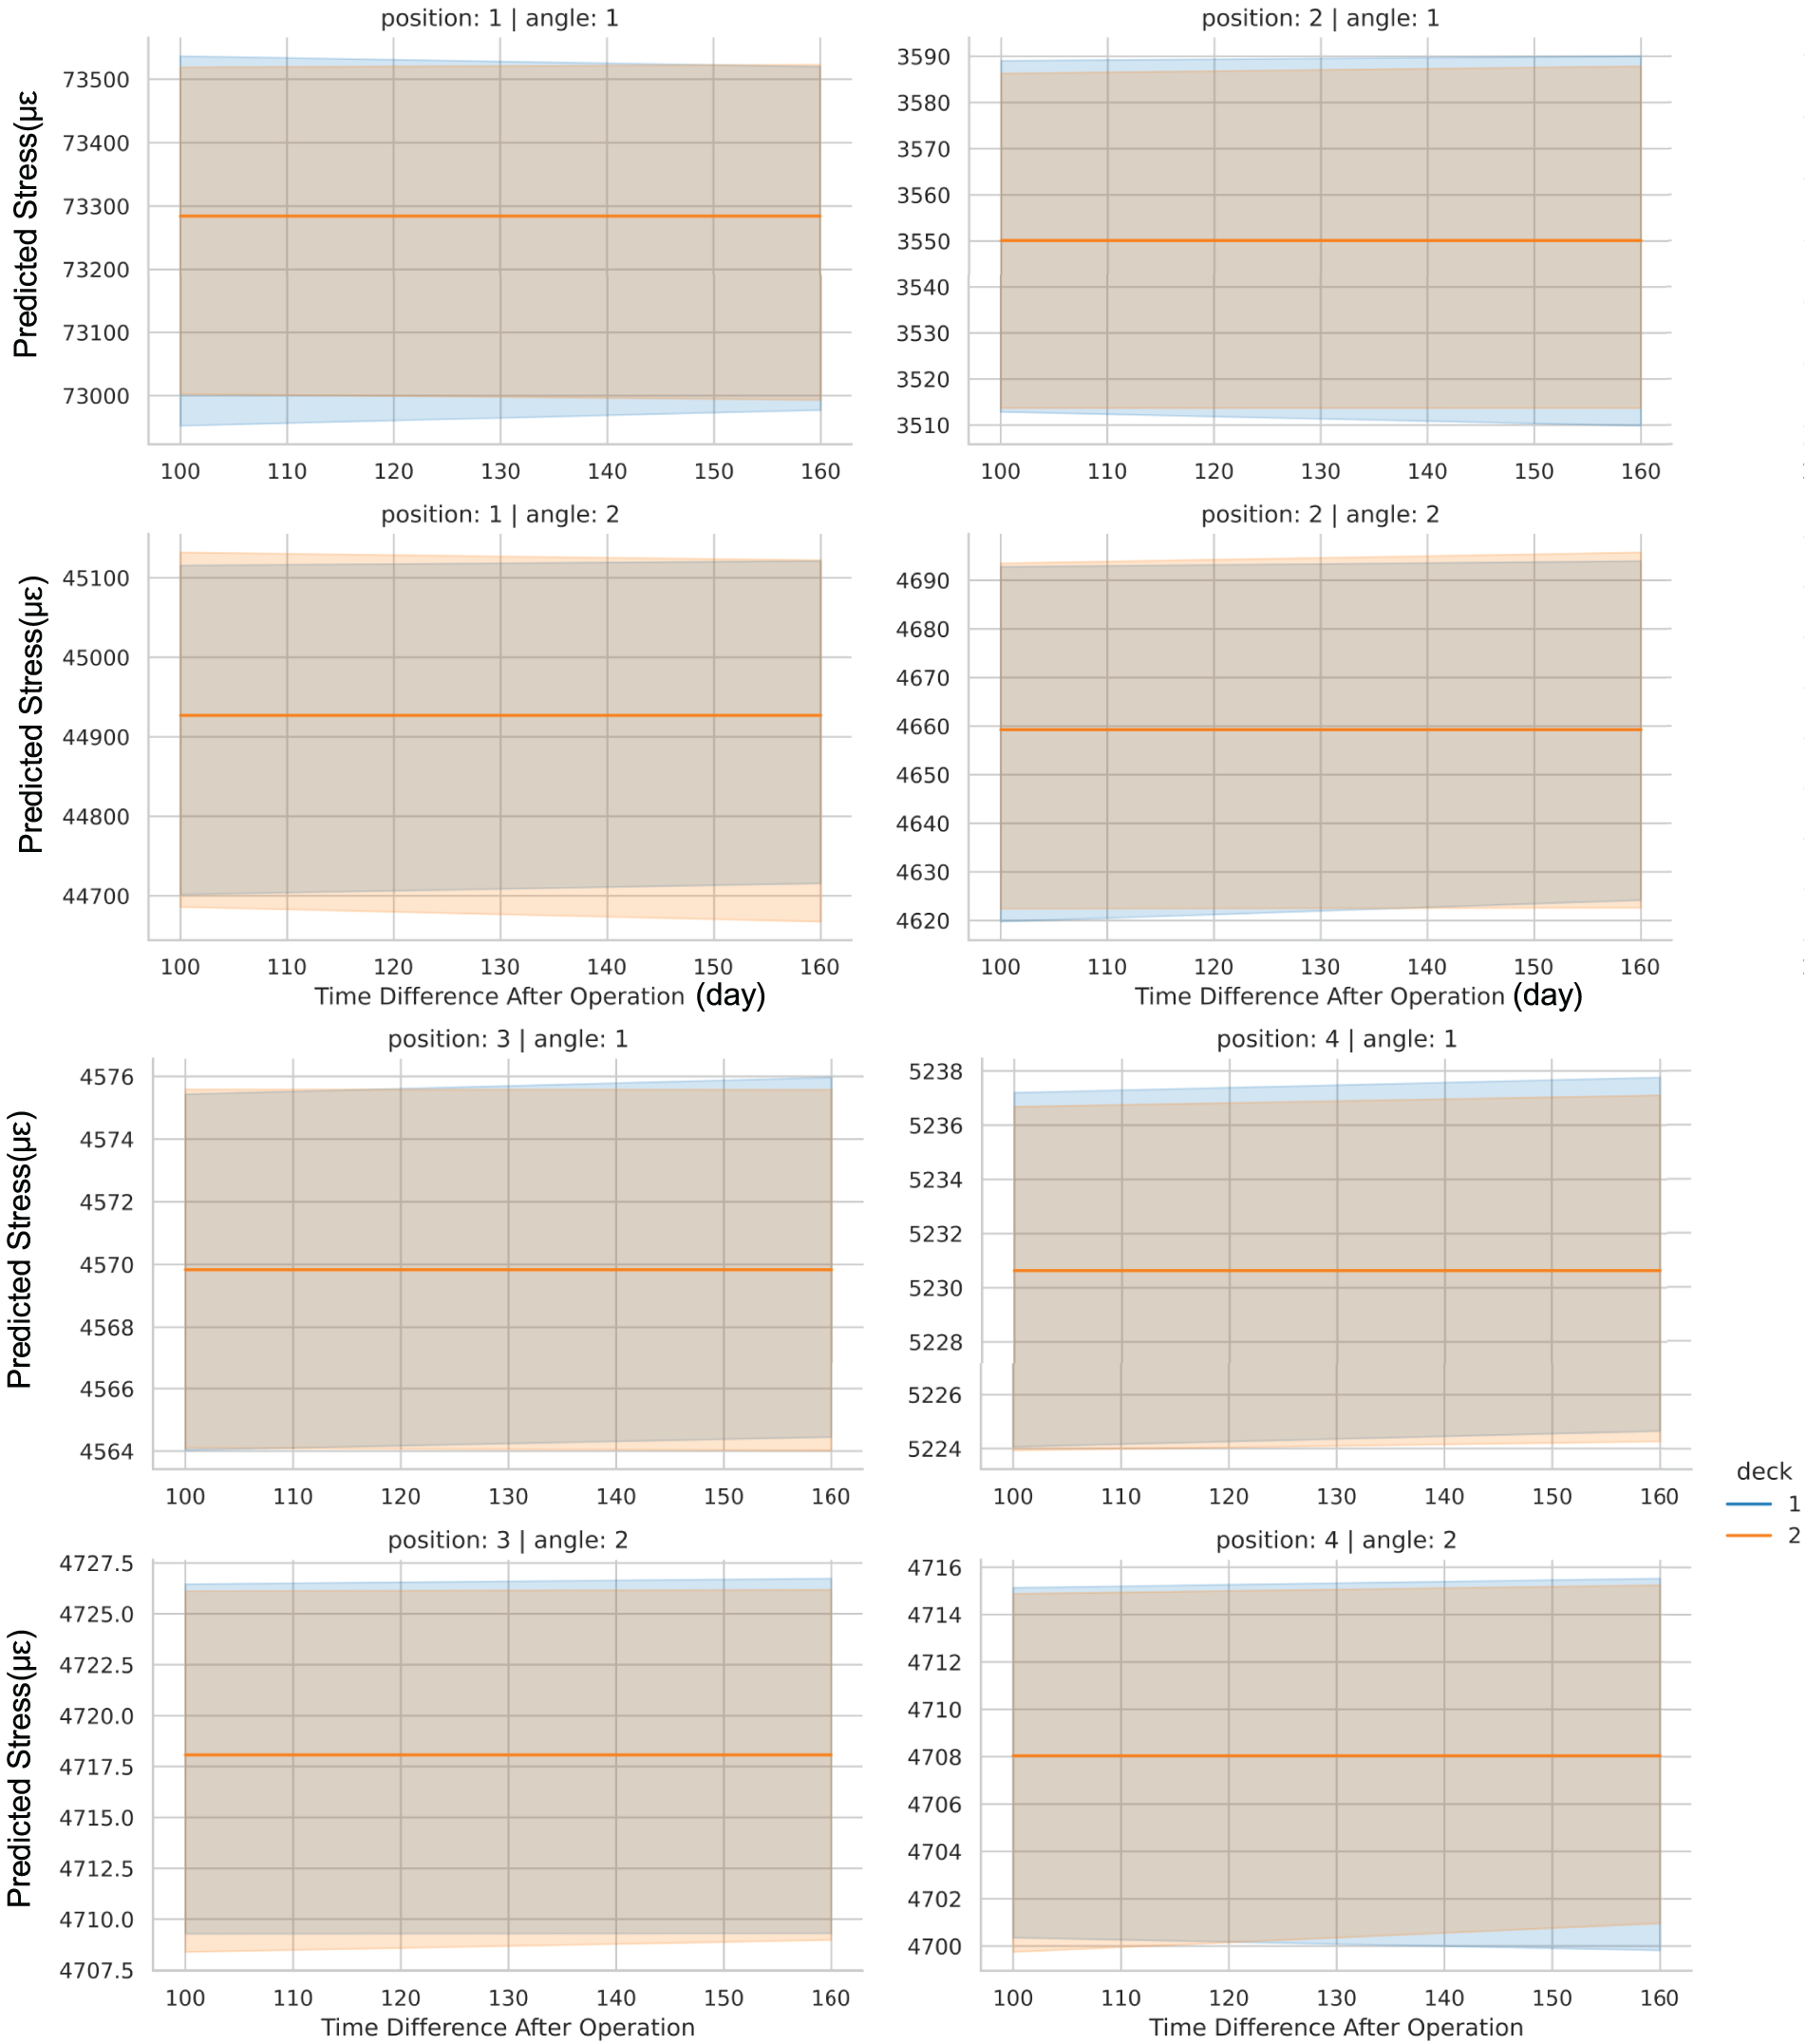
Figure 7: The stress evolution trends at different positions of different bridge decks in the future
By analyzing these plots and comparing them, the overall future varying trends are concluded in Table 4, according to which several key observations can be made:
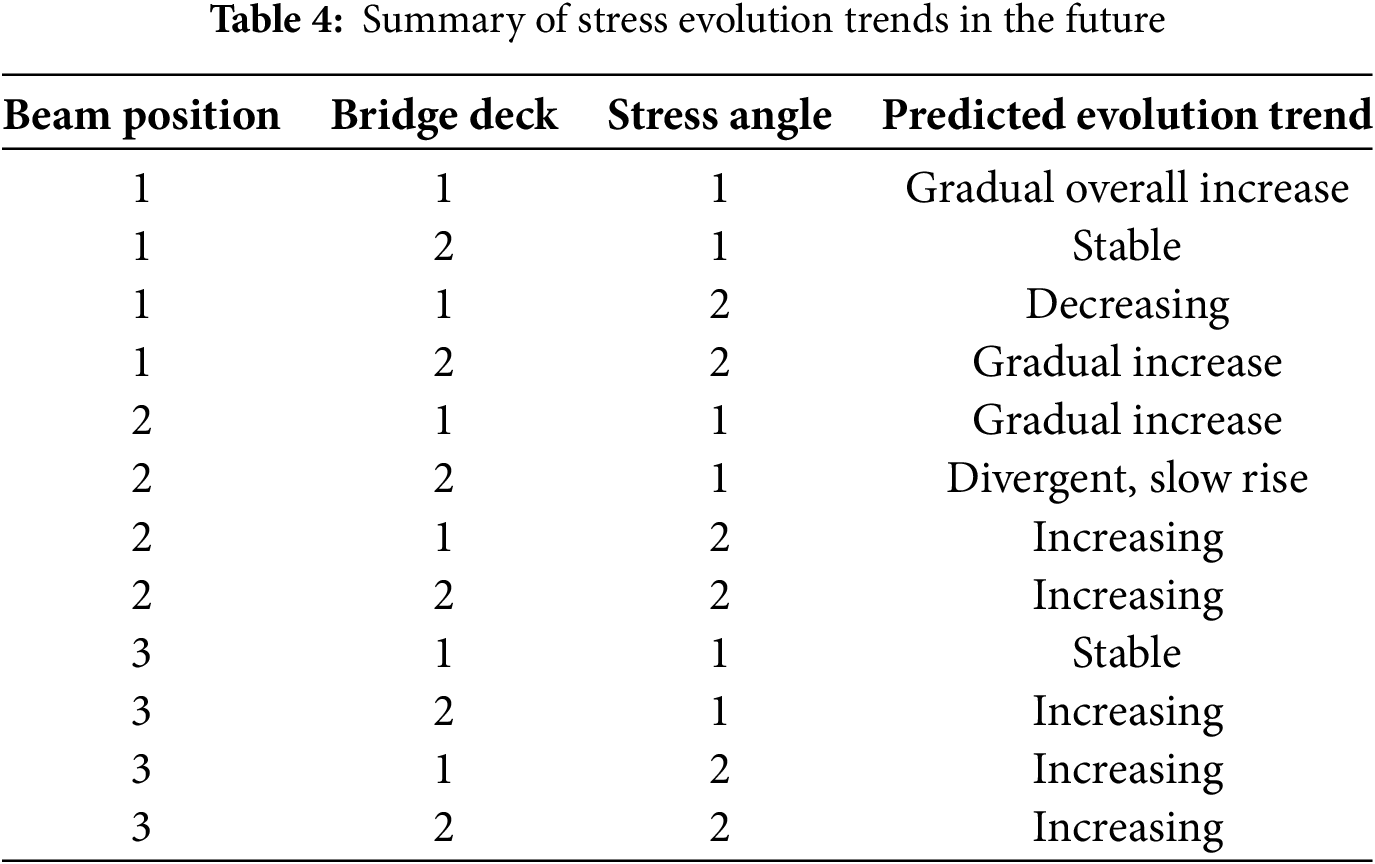
For Beam 1, the stress in the longitudinal direction is significantly higher than in the other beams, indicating that this location bears a higher level of stress within the bridge structure. Furthermore, the stress in the first layer along the bridge’s longitudinal direction remains stable, while the stress in the second layer shows a trend of decreasing upper bounds and increasing lower bounds, overall evolving toward a more stable and concentrated state. This suggests that the stress distribution in the second layer tends to become more uniform and stable over time.
For Beam 4, the stress in the first layer along the bridge’s longitudinal direction exhibits a gradual upward trend, while the stress in the second layer continues to increase. This indicates that the stress distribution in Beam 4 may change in the coming months, requiring close monitoring of its stress evolution.
Similarly, Beams 2 and 3, located near the longitudinal center of the bridge, exhibit a comparable pattern: the stress in the first longitudinal layer remains relatively stable, whereas the stress in the second layer shows a gradual increase. This progressive rise indicates the potential for long-term stress accumulation in these regions, underscoring the need for continued monitoring.
In the transverse direction, both the first and second layers exhibit a slow increase in stress. This suggests that the redistribution of stress within the entire bridge structure may influence the transverse stress distribution.
5.4.4 Analysis of Stress Redistribution Mechanisms Based on Stress Variation Trends
Based on the analysis of the bridge stress evolution trends, this paper proposes several possible stress redistribution mechanisms to elucidate the stress variation process in the bridge structure during subway operation. These mechanisms involve load transfer, structural adaptability, and long-term stability, as outlined below:
Load Transfer and Concentration Effect
Following the commencement of subway operations, the dynamic loads generated by upper-deck rail traffic exert a significant influence on the structural performance of the bridge. Specifically, the beams at the ends of the bridge (e.g., Beam 1) initially experience higher dynamic loads, which may induce stress concentration. Over time, these dynamic loads gradually transfer through the structure toward the middle beams (e.g., Beams 2 and 3). This load transfer process results in different stress evolution trends in the longitudinal direction between the end beams and the middle beams. This phenomenon suggests that the load distribution within the bridge structure is not uniform and that the influence of load transfer on the structure deepens as the subway operates over time.
Structural Deformation and Adaptability Adjustment
As subway operations continue, the bridge structure gradually adapts to the new load distribution and external influences, manifesting as gradual adjustments in structural deformation. During this process, temperature variations, vibration transmission, and the dynamic load from the upper track transportation play a significant role, especially in the variation of stress in the second layer, where thermal expansion effects are particularly evident. Fluctuations in temperature and the action of dynamic loads may lead to micro-deformations of the beams, gradually redistributing the stress from its initial state. This gradual stress redistribution process indicates that the bridge structure is not static but continuously adjusts to accommodate the changes brought about by subway operation.
Long-Term Stability and Stress Concentration Evolution
For certain beam positions (e.g., the longitudinal direction of Beam 1), the second-layer stress variation exhibits a more stable and concentrated trend. This phenomenon may indicate that, after prolonged load application and structural adaptation, certain areas of the bridge have reached a state of stress equilibrium, with deformations stabilizing. While this stress concentration may contribute to the long-term stability of the bridge structure, it also poses a risk of localized over-concentration, potentially leading to fatigue damage. Although the stress balance in the structure may gradually stabilize over time, particular attention should be paid to changes in regions of high stress. Continuous monitoring and timely maintenance of these high-stress areas are essential to prevent potential structural failure due to fatigue damage.
5.5 Stress Redistribution Index (SRI): A Quantitative Index to Identify Stress Redistribution Patterns
Finally, to quantify this pattern during bridge operation, a new index is introduced. Combining previous conclusions about spatial changes during the redistribution period and FE analysis yields a transverse load distribution of mid:edge = 2:1 under representative operating conditions. We use this as a reference for field data.
where:
SRI quantifies the deviation of the measured mid-to-edge stress ratio from the FE-derived baseline of 2:1. Its overall trend can be summarized as:
Engineering analysis indicates that, within the range of stress amplitudes observed in our monitoring, the sensitivity of the SRI to random noise is approximately on the order of 10−3. Variations smaller than |{SRI}| < 0.003 are considered indistinguishable from measurement noise. This index offers a quantitative metric for stress redistribution between the midspan and edge beams, enabling the assessment of the bridge’s load transfer characteristics.
This study presents a novel approach to modeling and interpreting stress redistribution in a dual-purpose double-deck road-rail arch bridge under evolving operational conditions, using a data-driven XGBoost model trained on long-term monitoring data. The key innovations and findings are summarized as follows:
(1) Data-Driven Discovery of Redistribution Patterns: By leveraging XGBoost’s capacity to capture complex, nonlinear interactions among operational variables (e.g., temperature, train load, and structural deformation), this study reveals that the initiation of metro operations caused distinct shifts in the internal stress distribution. Notably, stress concentrations increased at beam ends, driven by dynamic train loads, while mid-span stress patterns evolved more gradually, highlighting differential adaptation along the span.
(2) Model-Based Prediction of Structural Adaptation: Unlike conventional static analysis or modal tracking approaches, the XGBoost model captures temporal redistribution trends and predicts future stress evolution based on current load patterns. It identifies load transfer mechanisms from end beams to central spans, demonstrating how certain structural components—particularly in the second deck—exhibit gradual stabilization, while others remain prone to localized overstress.
(3) Engineering Implications and Forward Prediction: The model not only fits historical data with high fidelity but also provides forward-looking assessments of stress trajectories, offering a practical tool for early warning and preventive maintenance and a theoretical index to qualify further redistribution patterns. For example, by identifying persistent stress peaks near the arch ribs and beam-end zones with the SRI as a supplementary factor, the model highlights key areas for long-term fatigue monitoring and suggests that adaptation alone may not eliminate all critical risks.
In summary, the integration of real-world monitoring data with advanced modeling techniques has provided clear evidence of stress redistribution mechanisms in response to changing operational loads. It goes beyond snapshot-based assessments by providing a continuous, interpretable prediction model for structural behavior. This approach facilitates proactive engineering decision-making, including adjustments to inspection frequency, reinforcement of high-risk components, and validation of long-term structural adaptation mechanisms. Ultimately, the framework proposed here demonstrates that AI (Artificial Intelligence)-informed stress modeling can enhance both theoretical understanding and engineering management of complex bridges, particularly in cases involving multi-level traffic loads and evolving operational states, which traditional simulation and dynamic evaluation couldn’t handle. While the general workflow—including feature engineering, quality control, and interpretable machine-learning analysis—can be adapted to other bridges of similar structural type, span length, and operational environment. Successful transfer requires (i) structural similarity to ensure comparable load–response mechanisms, (ii) availability of equivalent input features, including temperature, traffic, and operational indicators, sensor locations, and key stress/strain measurements, and (iii) sufficient monitoring duration to capture seasonal and operational cycles. For a new site, the model parameters should be retrained using local data after harmonizing the feature set and normalizing according to site-specific statistics. Feature-importance and SHAP analysis can then be used to verify that the learned relationships align with physical expectations. Direct application without retraining is not recommended, as differences in structure and boundary conditions, materials, or sensor calibration could bias predictions.
Although the proposed XGBoost-based framework exhibits predictive accuracy and interpretability, several limitations should be acknowledged. First, its performance depends on the quality and continuity of sensor data, meaning that calibration drift, measurement noise, or data loss could affect results. Second, predictions beyond the temporal scope of the training dataset involve extrapolation and may be less reliable under unobserved environmental or operational conditions. Third, the model is not intended to capture abrupt stress surges resulting from sudden damage events, such as crack initiation or seismic activity, which may produce redistribution patterns beyond the relationships learned by the model. Future research will aim to integrate hybrid physical–statistical models, implement real-time anomaly detection, expand the dataset, and incorporate additional variables—such as train schedules and real-time traffic loads—to encompass a broader spectrum of structural responses and loading scenarios.
Acknowledgement: The authors sincerely thank all individuals and institutions who contributed to this work.
Funding Statement: This work was supported by the Key Technologies Research and Development Program under Grant 2021YFB1600300.
Author Contributions: Benyu Wang conducted the experiments and contributed substantially to data analysis, modeling, and manuscript preparation. Ke Chen assisted with the analysis and provided constructive discussions. Bingjian Wang conceived the study, oversaw the collection of all experimental data, and secured the funding. All authors reviewed the results and approved the final version of manuscript.
Availability of Data and Materials: Due to confidentiality agreements associated with our laboratory and funding project, the raw monitoring data cannot be publicly shared. However, to ensure reproducibility, we have made available:
1. Reproduction code: Includes data preprocessing, model training and evaluation, and figure plotting scripts.
2. Synthetic/anonymized dataset: Preserves the statistical distributions and temporal characteristics of the original data, sufficient to reproduce the tables and figures.
The code and anonymized dataset can be accessed at: [https://zenodo.org/records/17042669?token=eyJhbGciOiJIUzUxMiJ9.eyJpZCI6IjczNmVlMzMxLTkxNzctNDQxZS1hYmJjLWFiNzMxZTgwMzU4MyIsImRhdGEiOnt9LCJyYW5kb20iOiJmNTA0MzFhZDMwNGQ1MmE2Nzk4ZmYyODk3NTQzNDlhYiJ9.Yk363izpl2NCDChO_-PE7UzI5V2R8h_wtw2LI2-nncDdhfhOYR7XPSoN3mlPofwYf0VJNbTEYZ5-LBgMow2-cg (accessed on 01 January 2025)]. Researchers requiring access to the raw dataset for validation under confidentiality agreements may contact the corresponding author to discuss a controlled-access mechanism.
Ethics Approval: Not applicable.
Conflicts of Interest: The authors declare no conflicts of interest to report regarding the present study.
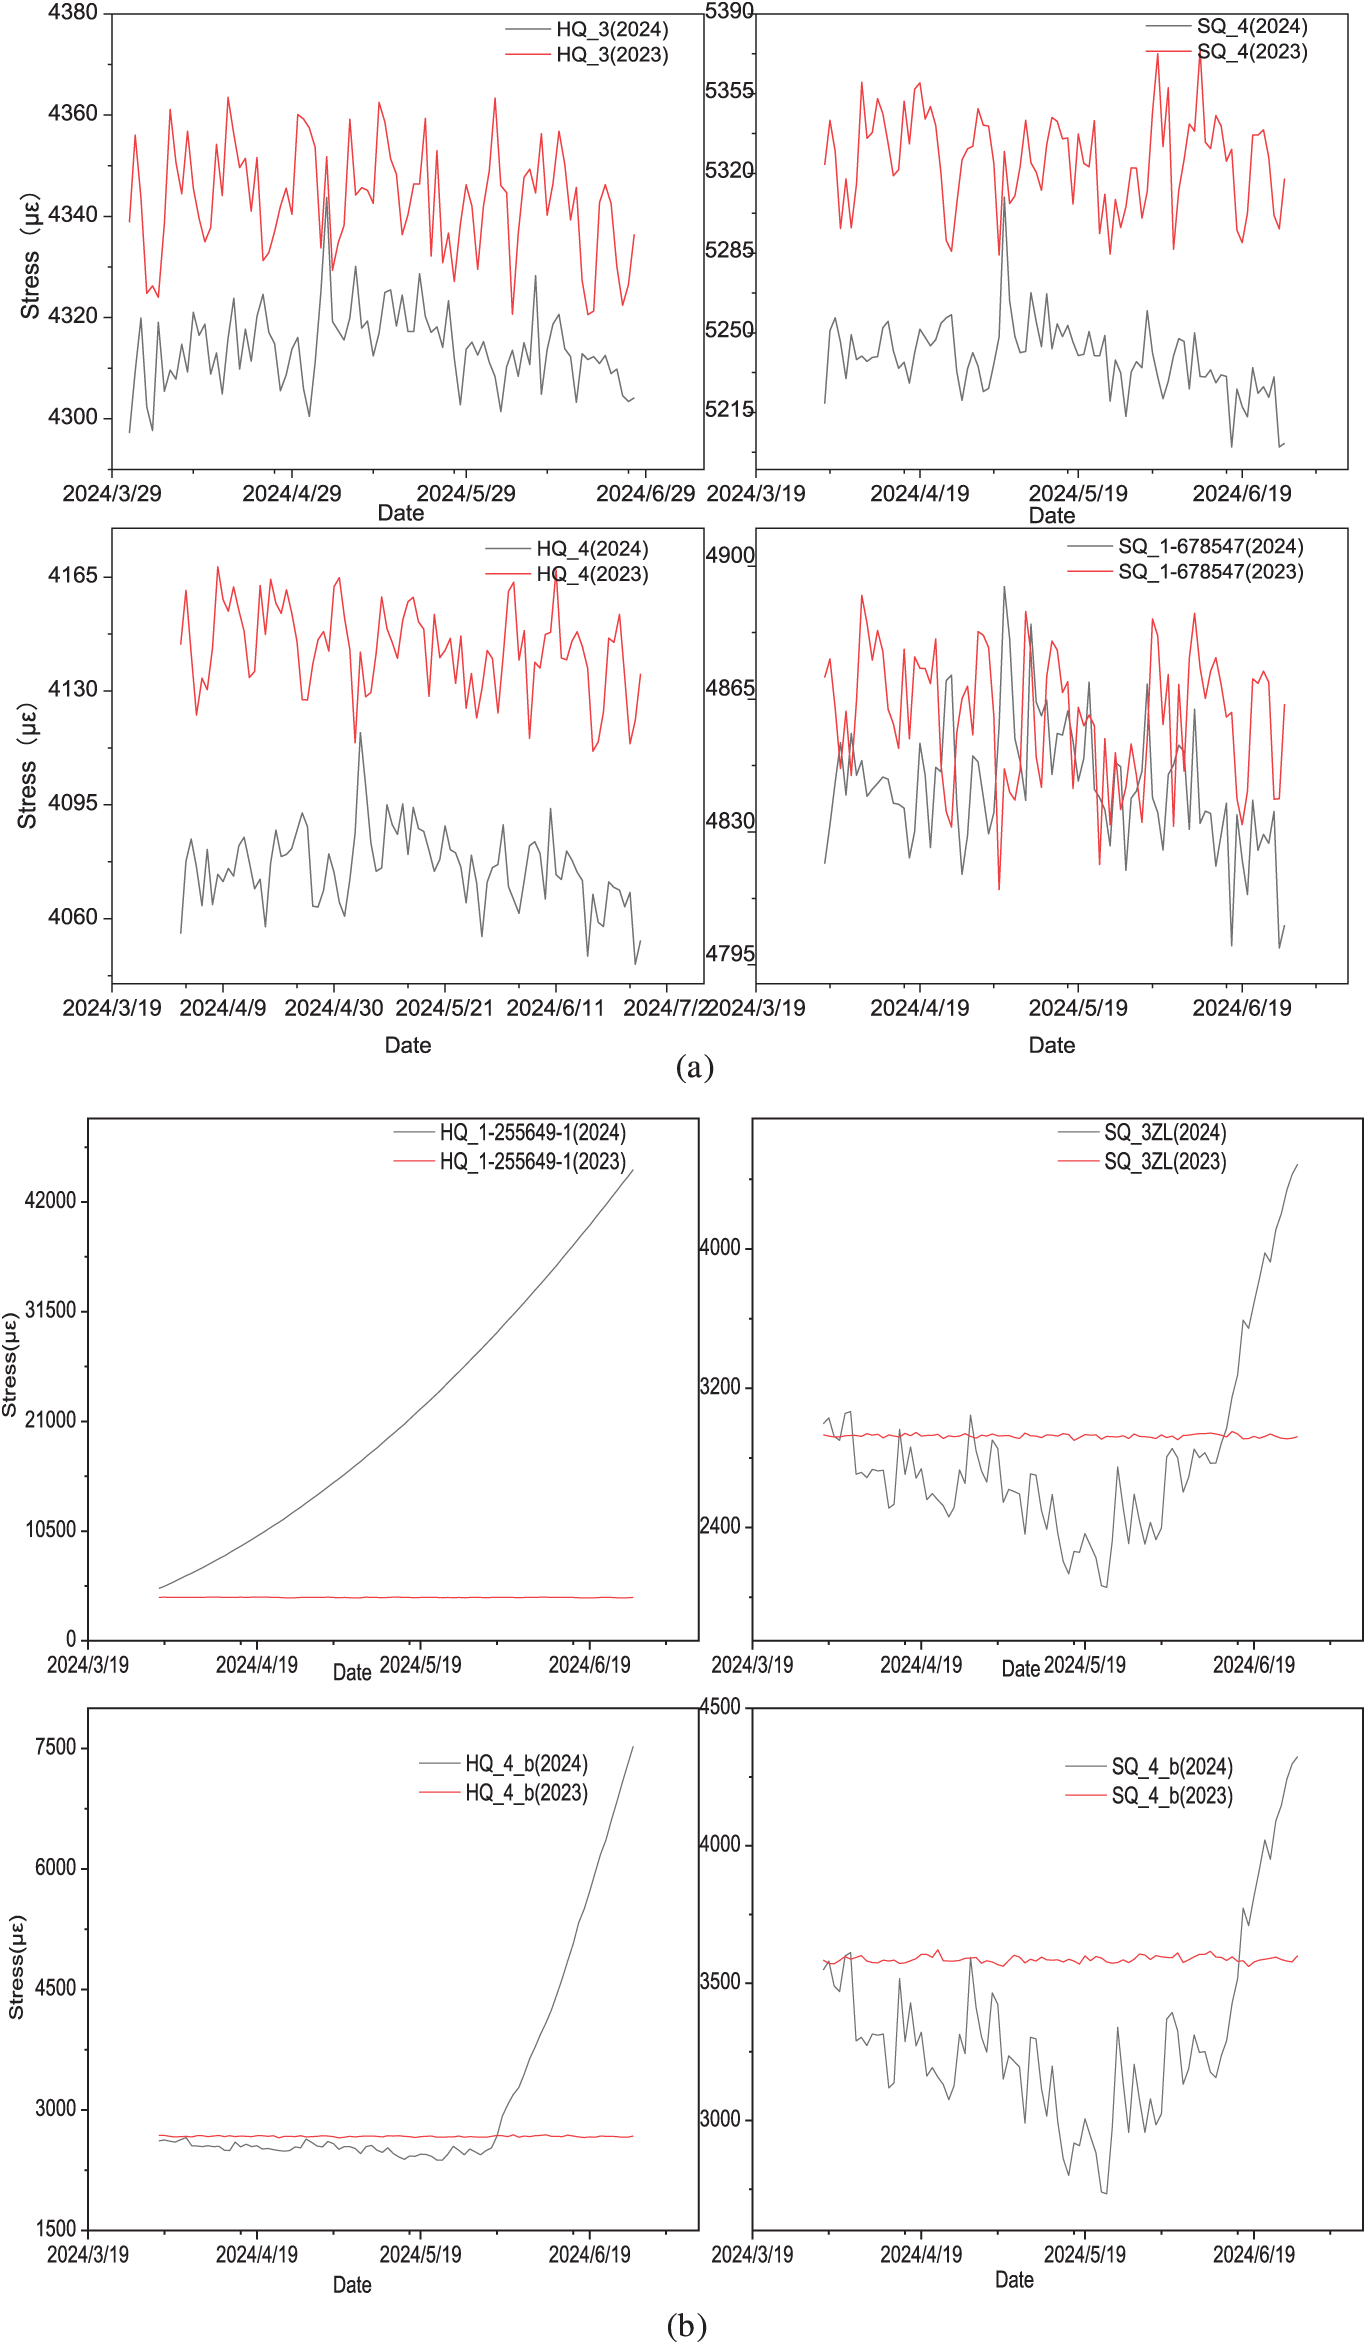
Figure A1: Comparison of strain sensor measurements before and after the operation of the rail transit of the first deck (a) and the second deck (b) over a season
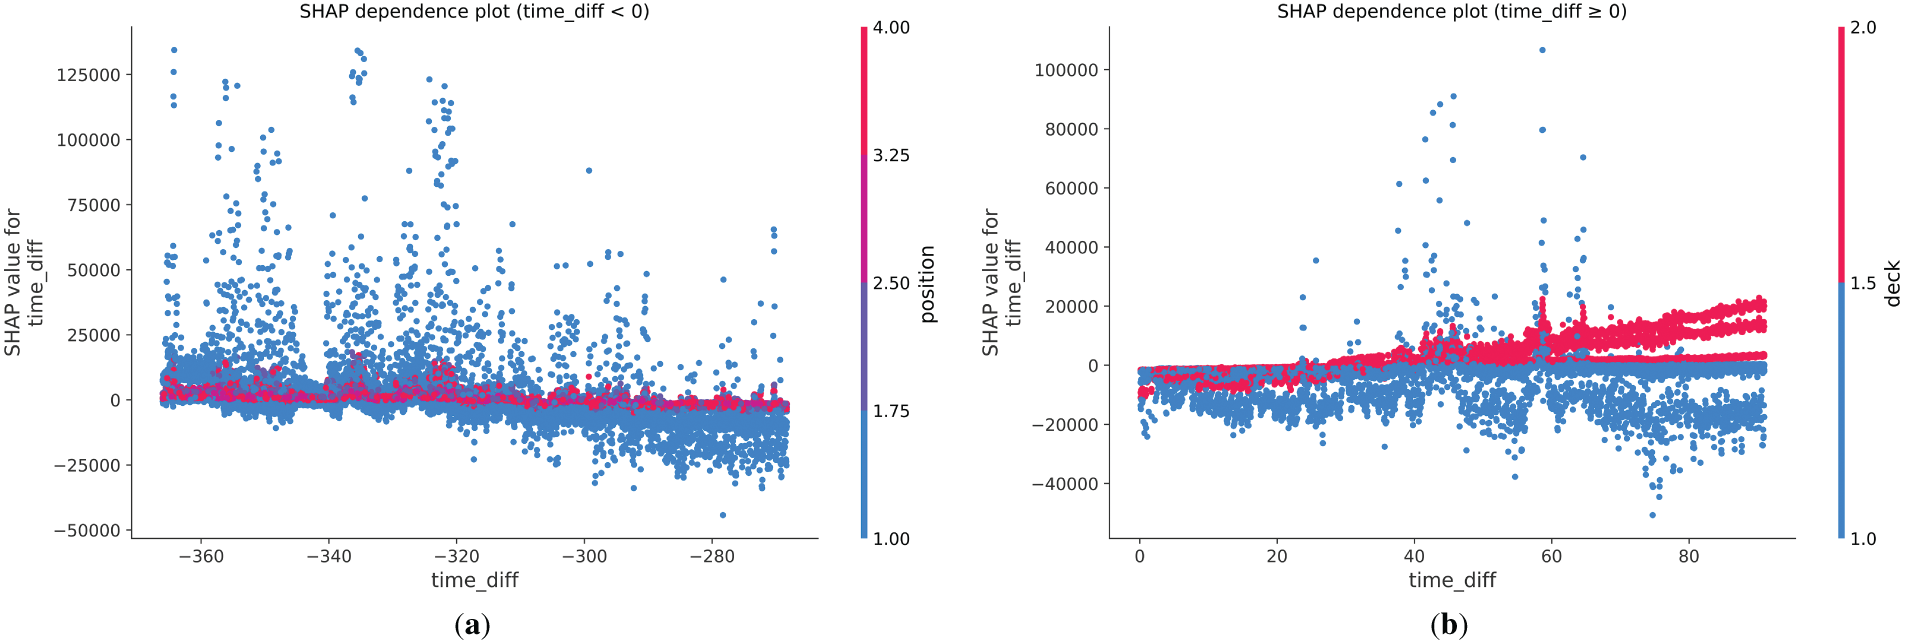
Figure A2: SHAP dependence plot for different time differences (before operation (a), after operation (b))
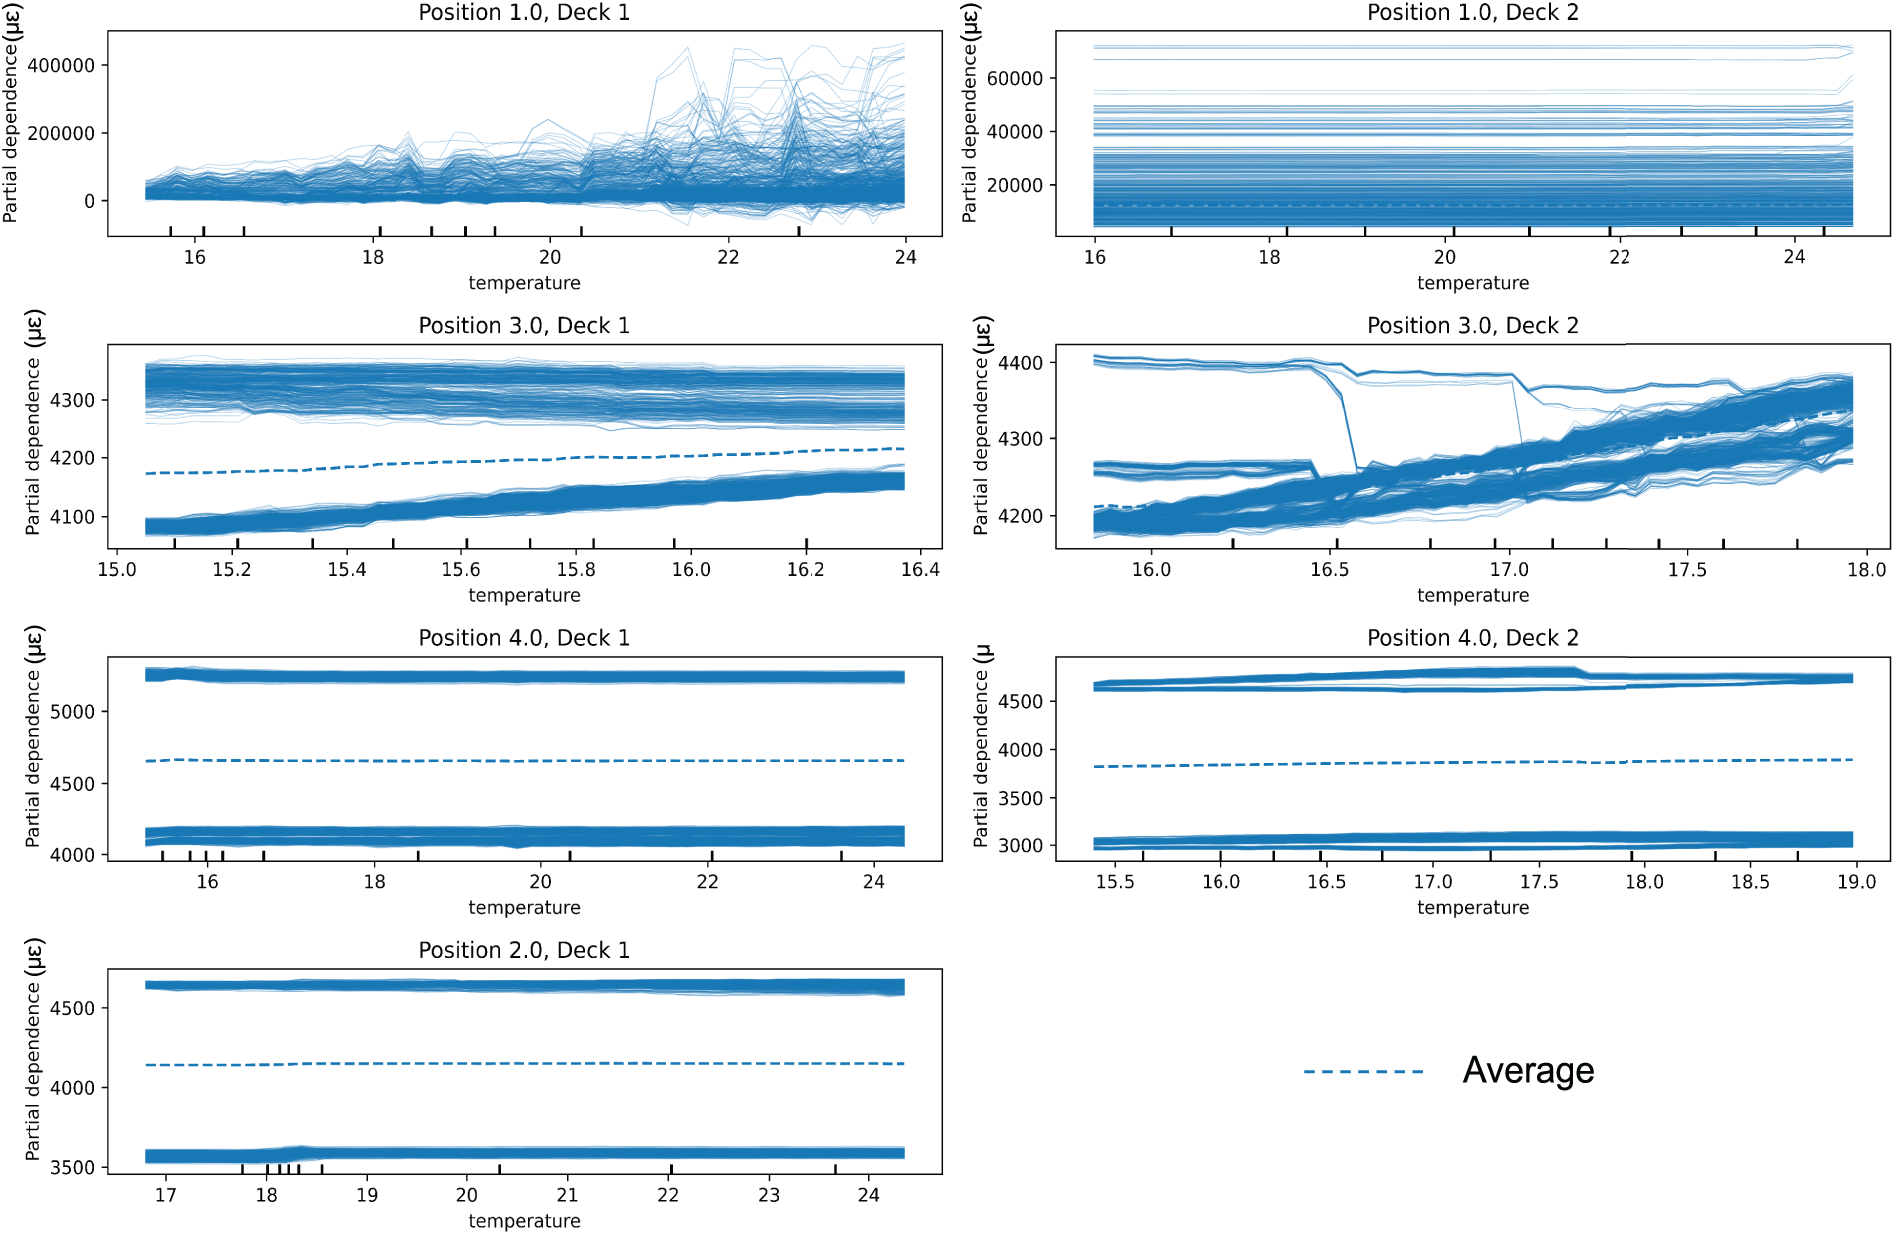
Figure A3: PDP plots stratified by beam positions and directions
References
1. Timoshenko SP, Gere JM. Theory of elastic stability. Mineola, NY, USA: Dover Publications; 2012. [Google Scholar]
2. You L, Yan K, Man J, Liu N. Anisotropy of multi-layered structure with sliding and bonded interlayer conditions. Front Struct Civ Eng. 2020;14(3):632–45. doi:10.1007/s11709-020-0617-4. [Google Scholar] [CrossRef]
3. Kumar S, Nallasivam K. Dynamic response of double deck cable-stayed bridge subjected to train load on lower deck. J Vib Eng Technol. 2025;13(1):20. doi:10.1007/s42417-024-01562-2. [Google Scholar] [CrossRef]
4. Wang S, Zhang G, Li J, Wang Y, Chen B. Temperature response of double-layer steel truss bridge girders. Buildings. 2023;13(11):2889. doi:10.3390/buildings13112889. [Google Scholar] [CrossRef]
5. Lu T, Liu J, Guo T, Zhang L, Xia Y. Traffic-induced fatigue damage evaluation of long-span suspension bridge integrating 27-year monitoring data and multi-scale finite element analysis. J Civ Struct Health Monit. 2025;15(7):2299–319. doi:10.1007/s13349-025-00936-8. [Google Scholar] [CrossRef]
6. Zhang WM, Zhang ZH, Wang ZW, Chen B. Temperature analysis and prediction for road-rail steel truss cable-stayed bridges based on the structural health monitoring. Eng Struct. 2024;315(10):118476. doi:10.1016/j.engstruct.2024.118476. [Google Scholar] [CrossRef]
7. Tomé ES, Pimentel M, Figueiras J. Structural response of a concrete cable-stayed bridge under thermal loads. Eng Struct. 2018;176:652–72. doi:10.1016/j.engstruct.2018.09.029. [Google Scholar] [CrossRef]
8. Cheng J, Xu M, Xu H. Mechanical performance analysis and parametric study of double-deck plate-truss composite steel girders of a three-tower four-span suspension bridge. Eng Struct. 2019;199(11):109648. doi:10.1016/j.engstruct.2019.109648. [Google Scholar] [CrossRef]
9. Gaute-Alonso Á, Garcia D, Uriszar-Aldaca I, Lopez C. Novel method for an optimised calculation of the cross-sectional distribution of live loads on girder bridge decks. Civ Eng J. 2022;8(3):406–20. doi:10.28991/cej-2022-08-03-01. [Google Scholar] [CrossRef]
10. Pan S, Xu W, Zhuang N, Zhang Z. Effect of bearing arrangement on seismic performance of double-deck bridges. J Disaster Prev Mitig Eng. 2010;S1:160–3. (In Chinese). [Google Scholar]
11. Alali S, Li J, Guo G. Double deck bridge behavior and failure mechanism under seismic motions using nonlinear analyzes. Earthq Eng Eng Vib. 2013;12(3):447–61. doi:10.1007/s11803-013-0185-x. [Google Scholar] [CrossRef]
12. Katsimpini PS, Papagiannopoulos G, Hatzigeorgiou G. Nonlinear analysis of bridges considering soil–structure interaction and travelling wave effects under combined train and near-fault seismic loads. Appl Sci. 2024;14(24):11688. doi:10.3390/app142411688. [Google Scholar] [CrossRef]
13. Shao Z, Xiang P, Zhao H, Zhang P, Xie X, Gan L, et al. A novel train-bridge interaction computational framework based on a meshless box girder model. Adv Eng Softw. 2024;192(10):103628. doi:10.1016/j.advengsoft.2024.103628. [Google Scholar] [CrossRef]
14. Xu J, Li J, Ye Y, Xu Y, Li C. Dynamic response of a long-span double-deck suspension bridge and its vibration reduction. Buildings. 2023;13(7):1791. doi:10.3390/buildings13071791. [Google Scholar] [CrossRef]
15. Liu Z, Sun H. Nonlinear stress analysis of key joints of steel truss bridge. J Phys Conf Ser. 2022;2185(1):012068. doi:10.1088/1742-6596/2185/1/012068. [Google Scholar] [CrossRef]
16. Xie J, Mei X, Wang B, Su Y. Study on the mutual influence of live loads on separated double-deck highway-railway arch bridges. World Bridges. 2022;3:81–6. (In Chinese). [Google Scholar]
17. Saramago G, Montenegro PA, Ribeiro D, Silva A, Santos S, Calçada R. Experimental validation of a double-deck track-bridge system under railway traffic. Sustainability. 2022;14(10):5794. doi:10.3390/su14105794. [Google Scholar] [CrossRef]
18. Chen HP, Lu SS, Wu WB, Dai L, Ceravolo R. Fatigue damage assessment of a large rail-cum-road steel truss-arch bridge using structural health monitoring dynamic data. Case Stud Constr Mater. 2024;21(12):e03772. doi:10.1016/j.cscm.2024.e03772. [Google Scholar] [CrossRef]
19. Zhang C, Sun R, Wang C, Zheng X, Li W, Cai X, et al. Long-term operation state monitoring and stress-deformation mechanism research of bridge abutment anchorage structure. Constr Build Mater. 2025;458(4):139655. doi:10.1016/j.conbuildmat.2024.139655. [Google Scholar] [CrossRef]
20. Zhang X, Xie X, Zhao H, Shao Z, Wang B, Han Q, et al. Seismic response prediction method of train-bridge coupled system based on convolutional neural network-bidirectional long short-term memory-attention modeling. Adv Struct Eng. 2025;28(2):341–57. doi:10.1177/13694332241281856. [Google Scholar] [CrossRef]
21. Yu E, Wei H, Han Y, Hu P, Xu G. Application of time series prediction techniques for coastal bridge engineering. Adv Bridge Eng. 2021;2(1):6. doi:10.1186/s43251-020-00025-4. [Google Scholar] [CrossRef]
22. Hamedani SJ, Alamdari MM, Atroshchenko E, Chang KC, Kim CW. Bridge health monitoring through series analysis: full-scale validation on a truss bridge. Eng Struct. 2025;340(4):120516. doi:10.1016/j.engstruct.2025.120516. [Google Scholar] [CrossRef]
23. Fard F, Sadeghi Naieni Fard F. Development and utilization of bridge data of the united states for predicting deck condition rating using random forest, XGBoost, and artificial neural network. Remote Sens. 2024;16(2):367. doi:10.3390/rs16020367. [Google Scholar] [CrossRef]
24. Wei Y, Ji R, Li Q, Song Z. Mechanical performance prediction model of steel bridge deck pavement system based on XGBoost. Appl Sci. 2023;13(21):12048. doi:10.3390/app132112048. [Google Scholar] [CrossRef]
25. Xu Y, Hong W, Noori M, Altabey WA, Silik A, Farhan NSD. Big model strategy for bridge structural health monitoring based on data-driven, adaptive method and convolutional neural network (CNN) group. Struct Durab Health Monit. 2024;18(6):763–83. doi:10.32604/sdhm.2024.053763. [Google Scholar] [CrossRef]
26. Jin Y, Ren Y, Guo C-Y, Li C, Guo Z-Y, Xu X. A deep learning estimation method for temperature-induced girder end displacements of suspension bridges. Struct Durab Health Monit. 2025;19(2):307–25. doi:10.32604/sdhm.2024.055265. [Google Scholar] [CrossRef]
27. Tajik N, Mahmoudian A, Taleshi MM, Yekrangnia M. Explainable XGBoost machine learning model for prediction of ultimate load and free end slip of GFRP rod glued-in timber joints through a pull-out test under various harsh environmental conditions. Asian J Civ Eng. 2024;25(1):141–57. doi:10.1007/s42107-023-00764-5. [Google Scholar] [CrossRef]
28. Chen MY, Xin JZ, Tang QZ, Hu TY, Zhou Y, Zhou JT. Explainable machine learning model for load-deformation correlation in long-span suspension bridges using XGBoost-SHAP. Dev Built Environ. 2024;20:100569. doi:10.1016/j.dibe.2024.100569. [Google Scholar] [CrossRef]
29. Gupta A, Gowda S, Tiwari A, Gupta A. XGBoost-SHAP framework for asphalt pavement condition evaluation. Constr Build Mater. 2024;426(5):136182. doi:10.1016/j.conbuildmat.2024.136182. [Google Scholar] [CrossRef]
30. Yang Y, Chen T, Lin W, Jing M, Xu W. Research progress on calibration of bridge structural health monitoring sensing system. Adv Bridge Eng. 2024;5(1):32. doi:10.1186/s43251-024-00143-3. [Google Scholar] [CrossRef]
31. Zhang Y, Shen J, Tong J, Lincoln R, Zhang L, Liu Y, et al. Data-driven design of well-behaved nonlinear structures: a case study on the von Mises truss. Int J Solids Struct. 2025;309(9):113146. doi:10.1016/j.ijsolstr.2024.113146. [Google Scholar] [CrossRef]
32. Dos Reis J, Oliveira Costa C, Sada Costa J . Strain gauges debonding fault detection for structural health monitoring. Struct Control Health Monit. 2018;25(12):e2264. doi:10.1002/stc.2264. [Google Scholar] [CrossRef]
33. Sun Z, Mahmoodian M, Sidiq A, Jayasinghe S, Shahrivar F, Setunge S. Optimal sensor placement for structural health monitoring: a comprehensive review. J Sens Actuator Netw. 2025;14(2):22. doi:10.3390/jsan14020022. [Google Scholar] [CrossRef]
34. Chen T, Guestrin C. XGBoost: a scalable tree boosting system. In: Proceedings of the 22nd ACM SIGKDD International Conference on Knowledge Discovery and Data Mining; 2016 Aug 13–17; San Francisco, CA, USA. [Google Scholar]
35. Brownlee J. How to tune the number and size of decision trees with XGBoost in python, machine learning mastery 2020 [Online]. [cited 2025 Jan 1]. Available from: https://machinelearningmastery.com/tune-number-size-decision-trees-xgboost-python/. [Google Scholar]
36. Friedman JH. Stochastic gradient boosting. Comput Stat Data Anal. 2002;38(4):367–78. [Google Scholar]
37. Lundberg SM, Lee SI. A unified approach to interpreting model predictions. Adv Neural Inf Process Syst. 2017;30:1–10. [Google Scholar]
Cite This Article
 Copyright © 2026 The Author(s). Published by Tech Science Press.
This work is licensed under a Creative Commons Attribution 4.0 International License , which permits unrestricted use, distribution, and reproduction in any medium, provided the original work is properly cited.
 Downloads
 Citation Tools