
 Submit a Paper
 Propose a Special lssue
 Open Access
ARTICLE

Long-Term Bridge Health Evaluation Using Resonant Frequency Changes under Random Loading Conditions
1 Institute of Information Technology and Digital Transformation Training, Thu Dau Mot University, No. 06 Tran Van On, Phu Hoa Ward, Thu Dau Mot City, 82000, Vietnam
2 Faculty of Engineering and Technology, Thu Dau Mot University, No. 06 Tran Van On, Phu Hoa Ward, Thu Dau Mot City , 82000, Vietnam
3 Institute of Interdisciplinary Sciences, Nguyen Tat Thanh University, No. 300A Nguyen Tat Thanh Street, Ward 13, District 4, Ho Chi Minh City, 700000, Vietnam
4 NTT Hi-Tech Institute, Nguyen Tat Thanh University, Ho Chi Minh City, 700000, Vietnam
* Corresponding Author: Thanh Q. Nguyen. Email:
(This article belongs to the Special Issue: Advances in Intelligent Operation and Maintenance Applications for Bridge Structures)
Structural Durability & Health Monitoring 2026, 20(1), . https://doi.org/10.32604/sdhm.2025.070185
Received 10 July 2025; Accepted 01 September 2025; Issue published 08 January 2026
 View Full Text
 Download PDF
Abstract
This study explores theoretical insights and experimental results on monitoring load-carrying capacity degradation in bridge spans through frequency analysis. Experiments were conducted on real bridge structures, including the Binh Thuan Bridge, focusing on analyzing the power spectral density (PSD) of vibration signals under random traffic loads. Detailed digital models of various bridge spans with different structural designs and construction periods were developed to ensure diversity. The study utilized PSD to analyze the vibration signals from the bridge spans under various loading conditions, identifying the vibration frequencies and the corresponding response regions. The research correlated the observed frequency changes of PSD with the actual deterioration of the bridges over time, identifying patterns that indicate a reduction in stiffness. Experiments demonstrated that frequency changes, particularly in high-frequency regions, are directly related to a reduction in the stiffness of bridge spans. This supports the hypothesis that natural frequencies can serve as effective indicators of structural damage. Furthermore, the emergence and shift of resonant frequency regions provide valuable insights into the extent of damage in actual bridge spans, highlighting the potential for using changes in resonant frequency regions as a new tool for structural damage detection.Keywords
Civil infrastructure structures, particularly bridges in urban areas, play a crucial role in ensuring smooth, safe, and efficient traffic flow. Damage to these structures, such as cracks [1,2] or other forms of deterioration [3,4] can have serious consequences for people and property, including traffic congestion, economic losses, and even casualties. Therefore, the timely and accurate detection of damage in urban bridge structures is essential and highly significant [5–7]. Among current assessment techniques, the NDE models are the most widely used. These models monitor changes in the natural frequency of structures to analyse [5,6], assess [7,8], and predict structural changes [9,10]. The NDE [11,12] is a method that uses various analytical techniques to detect and assess potential damage to structures without causing any damage to them. The NDE techniques, such as natural frequency analysis [5,13] are particularly valuable for monitoring changes in the mechanical properties of bridges under the influence of environmental factors and load conditions [7,14]. The NDE allows a precise assessment of structural condition [15–17] and offers predictions of degradation without the need for destructive tests or causing any loss to the bridge [8,18,19]. These include traffic interruptions, an increased risk of accidents, and significant economic losses due to repair costs and downtime. In some cases, if damage is not detected and repaired in a timely manner, it can cause complete collapse of the bridge [9,20], compromising lives and property [21,22]. With their ease of implementation and high effectiveness, these models have become popular due to their sensitivity to structural changes, especially in complex structures. Salawu and Williams [23] and Nguyen et al. [24] observed an increase in the natural frequency in prestressed concrete beams when damaged. This was explained by an increase in the concrete’s modulus of elasticity as pre-stress forces decreased, indicating that frequency changes can be complex and context-dependent. Numerous studies have explored crack detection using frequency changes. Vandiver [25], Gara et al. [26], Payawal and Kim [27] evaluated frequency changes in the bending and torsional modes of an offshore tower to detect structural damage. Galvín et al. [28], the numerical analysis demonstrated that only significant structural changes (greater than 1%) could be detected through frequency shifts, suggesting that minor damages might go unnoticed. Kenley and Dodds [29], Moravvej and Badry [16], Bozyigit and Acikgoz [30] studied frequency changes on an out-of-service offshore platform deck and found that only significant damage (a 5% change in stiffness) could be detected. This highlights the limitations of frequency-based methods in detecting smaller damages. Tracy and Pardoen [31], Sun et al. [17,32,33], Wang et al. [34] analyzed the vibration frequencies of a cracked composite beam under bending and axial vibrations. Man et al. [35], Gandelli et al. [36], Hassan et al. [37] provided a closed-form solution for the frequency of a notched beam, with the minimum detectable notch size being 10% of the beam depth. Choy et al. [38], Yao et al. [39], Xie et al. [40] used a reduced modulus method to simulate damage in beam elements, matching numerical models with measured natural frequencies to locate damage. However, this method faced challenges with symmetrical structures, as it was unable to distinguish damage at symmetrical positions. Hearn and Testa [41], Zar et al. [42], Bhatta and Dang [43], Azad et al. [44] proposed using the ratio of natural frequency changes for different modes to identify damage, calculating these ratios from mode shapes and predamage characteristics. Sanders et al. [45] combined Stubbs’ procedure with internal-state variable theory to detect damage in composites. Kiasat [46] developed a single response measurement procedure to detect damage in multi-story reinforced concrete frames, defining damage as a reduction in the stiffness matrix that replicated the lowest frequencies of the entire structure. Sahu and Das [47], Neamah et al. [48], Mohanty et al. [49] introduced a simplified method to analyze the natural frequencies of beams with multiple cracks using the transfer matrix method and rotational spring models of the cracks. This method eliminated the need for high-order determinant calculations, significantly reducing the computation time required to determine natural frequencies. Gillich et al. [50], Zhang et al. [51] used beam elements with small local flexibility changes near cracks, estimating crack location and size by minimizing the difference between measured and predicted natural frequencies. This method proved to be effective in directly estimating damage and generating training data for structural health monitoring through pattern recognition.
In recent years, the concept of structural resilience—defined as the capacity of a structure to withstand, recover from, and adapt to disruptive events—has gained significant attention in structural engineering [37–39]. As reviewed by Xu et al. [52], strategies to enhance seismic resilience often involve design innovations, energy-dissipating devices, and improved damage detection systems [52]. Similarly, advances in post-disaster performance-based monitoring have emphasized the role of timely and accurate detection in preserving infrastructure functionality [53]. Our study aligns with these developments by proposing a non-destructive monitoring technique based on the long-term evolution of resonance regions in vibration spectra. This spectral-based early-warning method contributes to resilience by facilitating preventive maintenance and adaptive management of bridge structures
In addition to power spectral density (PSD) analysis [54,55], which is effective for identifying frequency components in vibration signals [56,57], supplementary techniques can enhance structural health monitoring, especially when damage does not result in clear frequency changes [58,59]. Wavelet transform analysis offers superior time-frequency localization [13,60], enabling the detection of transient and localized changes in vibration behavior that PSD might miss. Advanced modal analysis techniques, such as operational modal analysis, provide insights into mode shapes and damping ratios, revealing damage even without distinct frequency shifts [16,19,49]. Machine learning approaches, including unsupervised anomaly detection and classification models, offer innovative ways to analyze complex vibration data and detect subtle structural changes [3,14,61]. Integrating these methods with PSD analysis creates a robust monitoring framework, improving the reliability and comprehensiveness of structural assessments.
While many studies have utilized natural frequency analysis and power spectral density (PSD) to detect structural changes, the current research introduces a novel perspective by shifting focus from single-frequency shifts to the evolution of entire resonance regions over time [5,13,54]. Unlike existing methods that primarily analyze isolated modal frequencies or amplitude reductions, our study proposes the tracking of the number, location, and energy distribution of resonance regions within PSD plots as a robust indicator of structural degradation [21,53,54]. Moreover, we develop a new interpretation framework where gradual energy migration from high-frequency to low-frequency resonance bands signifies stiffness reduction and deterioration. To the best of our knowledge, this is one of the first attempts to statistically quantify changes in the resonance region distribution and correlate them with structural aging under real-world traffic-induced random loads [27,54,59,62]. This novel approach addresses key limitations in previous PSD-based SHM frameworks, which often lacked temporal tracking of spectral region evolution and relied heavily on idealized assumptions of modal response.
To explore theoretical insights and results from the literature, this study conducted experiments on actual bridge beam structures to evaluate the ability to monitor the reduction in load-bearing capacity in bridge spans. Specifically, the research focused on evaluating several spans of the Binh Thuan Bridge and several others. Furthermore, the study used the PSD analysis of real vibration signals under random traffic loads on bridges. Our methodology for this research included the following steps:
• Developing detailed digital models of the Binh Thuan Bridge spans and several other bridges, incorporating various material properties and boundary conditions. These spans, with their diverse structural designs and construction periods, contributed to the richness and diversity of the study’s models.
• Using PSD functions to analyze the vibration signals from the bridge spans under different loading conditions. The study identified the frequencies of the vibration modes of the bridge spans and the corresponding response regions.
• Correlating the observed frequency changes of the PSD with the actual deterioration of the bridges over time. The study also focused on identifying patterns indicating a reduction in stiffness. Experiments with real bridge models demonstrated that frequency changes, especially in high-frequency regions, are directly related to a reduction in the stiffness of bridge spans. This supports the hypothesis that natural frequencies can serve as effective indicators of structural damage, although not all frequencies are equally sensitive.
• The appearance and shift of resonant frequency regions provided additional information on the extent of damage in actual bridge spans, complementing the traditionally less sensitive natural frequency parameters to structural changes. These findings are consistent with previous studies and highlight the potential of using changes in resonant frequency regions as an additional tool for current damage detection methods.
Although natural frequency and PSD-based monitoring techniques have been explored in previous studies, our work introduces a novel paradigm by focusing on the evolution of resonance regions in the PSD spectrum over time. Rather than monitoring only fundamental frequency shifts, we track the migration and disappearance of high-frequency resonance regions, which reflect progressive stiffness degradation under random traffic-induced vibrations. This approach, when applied to real-world bridge structures over multiple years, offers a long-term, multi-band spectral framework for diagnosing structural aging—an aspect that has been insufficiently addressed in prior research.
2.1 Fourier Transform and Frequency Spectrum
Most functions can be expressed as a Fourier series, which is a combination of sine and cosine functions, each with specific frequencies. The coefficients of the Fourier series define the amplitude of these functions. However, in practical applications, the input signal might not be represented as a specific function. Although Fourier analysis theoretically allows any function to be represented as a Fourier series, it has not yet been fully used as a technique for analyzing measured signals. The method for analyzing dynamic signals based on their amplitude and frequency will be explained further, as outlined in Eq. (1).
where the amplitudes An and Bn correspond to the nth frequency of a Fourier series, used to express a periodic function
Fourier analysis extends beyond just representing functions as a series of sine and cosine functions; it has significant applications in various scientific and engineering fields, especially in signal processing. It helps to separate and identify key frequency components in measured signals, which are often noisy or contain unwanted elements. This is particularly important in fields such as telecommunications, medicine, and audio engineering. The application of Fourier analysis to dynamic signals also involves challenges related to time-varying signals and digital signal processing. These challenges drive ongoing research to improve Fourier algorithms and develop new methods such as the STFT and wavelet transform. Overall, while Fourier analysis has a long history, its application to real-world signals is still an evolving and complex field with many opportunities for future advancements. If we consider the period of the function approaching infinity, we can eliminate the constraint in Fourier analysis that the signal is a periodic waveform. As the period T approaches infinity, the Fourier series transforms into an integral. The spacing between the frequency components becomes infinitesimally small. This means that the coefficients An and Bn become continuous frequency functions, which can be represented as A(ω) and B(ω), where:
The Fourier coefficients A(ω) and B(ω) are called the components of the Fourier transform of y(t). To construct the Fourier transform, we consider the complex number defined as follows.
where
Introducing the identity
Leads to
We can rewrite Eq. (5) as follows.
Eqs. (5) and (6) provide the two-sided Fourier transform of y(t). The significance of the Fourier transform, Y(f), is that it describes the signal as a continuous function of frequency. If y(t) is known, its Fourier transform will provide the amplitude-frequency characteristics of the signal; otherwise, these characteristics are not apparent when viewed in the time domain. If Y(f) is known or measured, we can reconstruct the signal y(t) from i:
Eq. (7) describes the inverse Fourier transform of Y(t). This shows that with the amplitude-frequency characteristics of a given signal, we can reconstruct the original signal y(t). The Fourier transform is a complex number that encompasses both magnitude and phase.
The magnitude of Y(f) is given by
and the phase by
As mentioned previously, the Fourier coefficients are related to the cosine and sine terms. Consequently, the amplitude of y(t) can be represented by its amplitude spectrum.
And its phase shift by
Fourier analysis plays a central role in this study as a tool for transforming time-domain vibration signals into the frequency domain, enabling the examination of structural responses. This transformation allows for the identification of natural frequencies, resonant peaks, and other key frequency components within the collected vibration data. However, understanding its applicability and inherent limitations, especially when applied to non-periodic signals, is crucial for interpreting the results effectively.
❖ Applicability of fourier analysis
• Fourier analysis is well-suited for decomposing complex vibration signals into their constituent frequency components. This capability makes it a powerful tool for analyzing structural health, as it reveals how energy is distributed across different frequencies within the signal. In the context of this study, Fourier analysis was used to identify dominant frequencies and detect changes in these frequencies over time, which could indicate shifts in stiffness or potential damage to the structure.
• For vibration signals that are periodic or quasi-periodic, Fourier analysis provides an accurate representation of the signal’s frequency content. This is beneficial when assessing bridges subjected to repetitive traffic loads, where periodic components in the signals can be effectively analyzed.
❖ Limitations of fourier analysis for non-periodic signals
One significant limitation of Fourier analysis is its assumption that the analyzed signal is stationary (i.e., its frequency content does not change over time). When applied to non-periodic or non-stationary signals, such as those generated by random or transient traffic loads on bridges, Fourier analysis may not provide a complete or accurate representation of the frequency content. This can lead to challenges in identifying time-dependent features that could be critical for assessing structural changes.
Fig. 1 illustrates the fundamental limitation of traditional FFT in handling non-stationary signals. While the FFT provides excellent frequency resolution (top panel), it lacks time localization, making it unsuitable for identifying when specific frequencies occur. In contrast, the short-time fourier transform (STFT) addresses this limitation by offering a time-frequency representation (bottom panel). However, this comes with a trade-off: reduced frequency resolution. This visualization supports our rationale for applying STFT in cases where bridge vibrations exhibit transient characteristics under random traffic loads.
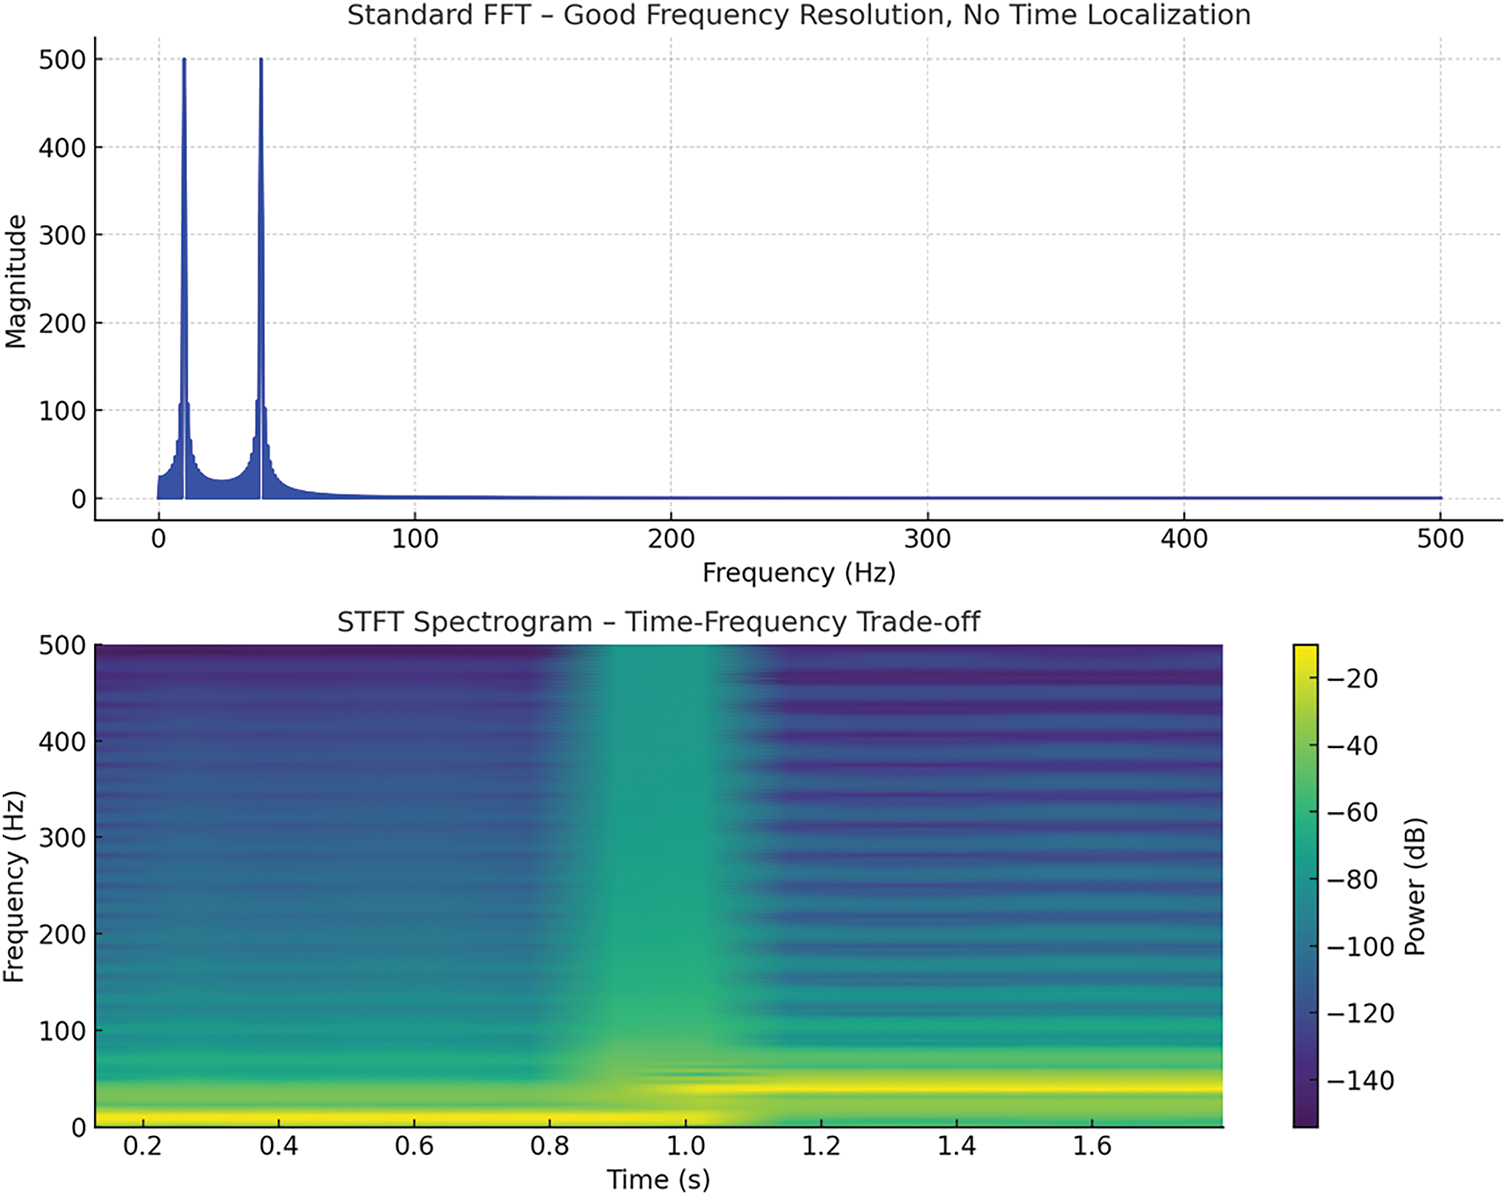
Figure 1: Comparison of FFT and STFT for time–frequency analysis of non-stationary bridge vibration signals
Fourier analysis offers high-frequency resolution but lacks time resolution, making it difficult to localize changes in the signal’s frequency content over time. This limitation is particularly pertinent when analyzing non-periodic vibration signals that may contain transient events or abrupt changes due to variable traffic loads or sudden structural shifts. To mitigate the limitation of non-periodicity, windowing techniques are applied to segment the signal before Fourier transformation. However, the choice of window can influence the results, potentially causing spectral leakage, where energy spreads into adjacent frequency bins. This can obscure subtle frequency shifts or make them appear less pronounced than they actually are, affecting the interpretation of minor changes in structural health.
❖ Complementary techniques and mitigation strategies
To address these limitations, the study also considered the use of complementary techniques, such as:
– Short-time fourier transform (STFT): This method was used to provide a time-localized frequency analysis by applying Fourier analysis to small segments of the signal, enabling the detection of frequency changes over time. While STFT helps overcome some non-stationary challenges, it still faces a trade-off between time and frequency resolution.
– Wavelet transform: For signals with non-periodic characteristics, the wavelet transform was noted as a potential future enhancement due to its capability to offer a multi-resolution analysis that can adapt to varying signal frequencies, providing better time-frequency localization.
❖ Conclusion on fourier analysis use
In this study, Fourier analysis proved to be an essential tool for examining the frequency content of vibration signals and identifying structural responses. However, its limitations in handling non-periodic and non-stationary signals were acknowledged, and mitigation strategies, such as windowing and complementary methods like STFT, were employed to enhance the analysis. Recognizing these limitations allows for a more accurate interpretation of PSD data and a clearer understanding of the structural health of bridges under varying traffic conditions.
2.2 The Theory of Power Spectrum Density
Now, let us dive into the frequency component of a naturally occurring random process. Because the time history x(t) of the sample function is non-periodic, it cannot be represented by a discrete Fourier series. Furthermore, for a stationary process, x(t) extends indefinitely, posing challenges in frequency analysis.
If this condition is not met, then the classical Fourier analysis theory cannot be applied to this sample function. This difficulty can be addressed by analyzing not the sample functions of the process but rather its autocorrelation function.
In which:
and the condition:
The Fourier transform of
and:
2.3 Advantages and Limitations of Using Power Spectral Density (PSD) as a Structural Damage Indicator
The PSD analysis plays an important role in structural health monitoring by providing insights into how energy is distributed across various frequency components in vibration signals. While it has been widely applied for detecting structural damage, understanding its strengths and limitations is crucial, especially when evaluating minor or subtle damage.
❖ Advantages of PSD in structural damage detection:
⮚ PSD analysis allows for a comprehensive examination of the energy distribution over frequency, enabling the detection of significant shifts in natural frequencies that are indicative of changes in structural stiffness. This can be particularly useful for identifying major structural changes or damage that results in noticeable modifications to the vibration profile of a bridge or similar structure. The mathematical formulation of the fourier transform and power spectral density (PSD) is well-established in signal processing and structural dynamics literature [48,57,60]. These tools are used here to convert time-domain vibration signals into the frequency domain, enabling the identification of dominant frequency components and their evolution over time. Given their foundational nature, the full derivation is omitted for brevity
⮚ One of the key advantages of PSD is that it is non-invasive, allowing for continuous monitoring of structures without causing any damage. This makes it ideal for large-scale infrastructure, such as bridges, where other forms of testing would be impractical or potentially harmful. Many existing studies in structural health monitoring focus on broader impacts such as estimating remaining service life, fatigue progression, or post-event performance based on structural simulations or indirect health indicators. These approaches provide macro-level evaluations but often lack high-resolution temporal insights into progressive stiffness loss or vibrational behavior changes that can be directly observed in long-term PSD trends.
⮚ PSD analysis can be applied to vibration data collected under real operational conditions, such as those induced by traffic loads on bridges. This real-world application enhances the relevance and reliability of the results, providing a realistic assessment of the structure’s response and health. The use of PSD monitoring under actual traffic-induced random loading—rather than controlled laboratory excitation—enhances the realism and relevance of the results. Real-world operational conditions introduce dynamic variability that is essential for evaluating the structure’s functional response and stiffness degradation patterns [5,13,54].
❖ Limitations of PSD in detecting minor or subtle damage:
Although PSD analysis is effective for detecting significant damage, its sensitivity to smaller or more subtle structural changes is limited. Minor cracks or small reductions in stiffness often do not result in marked changes in the frequency domain that are distinguishable in PSD plots. This limitation means that minor damage may remain undetected until it progresses to a more severe state.
The accuracy of PSD analysis can be significantly influenced by noise and environmental factors, such as temperature fluctuations, wind, or other ambient conditions. These factors can mask subtle frequency shifts or distort amplitude data, making it challenging to detect or attribute changes solely to structural damage.
In structures with complex modal characteristics, interpreting PSD plots can be difficult. Overlapping frequencies and the presence of multiple resonance peaks may complicate the identification of damage location and severity. This complexity requires experienced analysts and may limit the method’s effectiveness in real-time or automated monitoring.
The effectiveness of PSD analysis heavily relies on the quality of the recorded vibration signals. Factors such as sensor placement, sampling rate, and data acquisition accuracy can affect the outcome. Poor signal quality or measurement errors may reduce the reliability of PSD analysis, particularly when trying to detect minor damage.
❖ Recommendations for enhanced detection:
To address the limitations of PSD analysis, it is recommended to combine it with other advanced signal processing techniques. For example, integrating wavelet transform analysis can provide localized time-frequency insights that are more sensitive to subtle changes in the signal. Additionally, employing machine learning algorithms for pattern recognition and anomaly detection can enhance the ability to identify minor damage and improve overall monitoring effectiveness. These complementary methods can help overcome the challenges posed by environmental noise and complex structural responses, leading to a more comprehensive structural health monitoring system.
2.4 Detailed Data Processing Techniques and Noise Minimization for Enhanced Frequency Measurement Accuracy
Ensuring the accuracy of frequency measurements in the PSD analysis requires robust data processing to effectively minimize noise interference. Noise can arise from various sources, including environmental factors, mechanical vibrations, and electronic equipment. This section outlines the comprehensive approach taken to reduce noise and improve the fidelity of vibration data.
To mitigate noise interference and ensure clean vibration data for PSD analysis, we employed a combination of filtering strategies:
• Band-pass filtering was applied to isolate the relevant vibrational frequency range (e.g., 2–20 Hz), eliminating low-frequency drift (due to thermal or mechanical shifts) and high-frequency sensor/electronic noise.
• Savitzky–Golay smoothing, a polynomial-based moving filter, was used to preserve the integrity of peak amplitude and frequency components while reducing small-scale fluctuations and outliers.
• Wavelet denoising was utilized to remove broadband noise while maintaining transient features of the signal. This approach was particularly effective for signals contaminated by environmental fluctuations or measurement-induced noise.
The combined use of these filtering methods allowed us to enhance the signal-to-noise ratio, ensuring the resonance regions observed in PSD plots were structural in origin and not artifacts of noise.
❖ Signal filtering techniques:
○ High-Pass and Low-Pass filters: To remove unwanted components from the vibration signals, high-pass filters were used to eliminate low-frequency noise such as baseline drift and environmental disturbances (e.g., wind effects). Low-pass filters were applied to suppress high-frequency noise, which may originate from electronic interferences or mechanical resonance not related to structural vibration.
○ Band-Pass filtering: For more targeted noise reduction, band-pass filters were employed to focus on the frequency range of interest relevant to structural health. This ensured that the essential frequency components that contribute to the PSD analysis were preserved while reducing irrelevant frequencies.
❖ Smoothing algorithms for enhanced signal clarity:
○ Moving average smoothing: This algorithm was applied to reduce short-term fluctuations in the vibration data. The moving average technique smooths out minor variations, providing a clearer signal that better represents the actual vibration response of the bridge structure.
○ Savitzky-Golay filter: This polynomial smoothing filter was used to maintain the integrity of the signal’s amplitude and frequency characteristics while minimizing noise. Unlike simple averaging, this filter preserved peak details, which are crucial for accurate frequency analysis.
❖ Fourier transform and windowing:
○ Windowing functions: To address spectral leakage—a common issue when transforming time-domain signals to the frequency domain—windowing functions such as Hanning, Hamming, and Blackman were applied. These functions taper the signal at the boundaries, reducing abrupt transitions and ensuring that the PSD analysis accurately reflects the distribution of energy across frequencies.
○ Short-Time Fourier Transform (STFT): In cases where non-stationary signals were present, STFT was utilized to provide localized frequency analysis. This allowed for the observation of frequency changes over time, helping identify transient vibrations indicative of structural anomalies.
❖ Data normalization for consistency:
○ The recorded signals were normalized to standardize the data, ensuring that comparisons across different measurement sessions were valid. This step mitigated variations in signal amplitude caused by changing traffic loads or environmental conditions, allowing for a more consistent PSD analysis.
❖ Advanced noise reduction techniques:
○ Wavelet denoising: The wavelet transform was employed for multi-resolution analysis to remove noise while preserving important signal features. This method decomposed the signal into different scales, allowing for targeted noise reduction that retained the integrity of vibration patterns essential for frequency analysis.
○ Adaptive filtering: An adaptive filter was used to dynamically adjust its parameters based on the noise characteristics, providing real-time noise reduction that improved the clarity of the measured signal.
❖ Quality control in sensor placement and calibration:
○ Optimized sensor placement: Sensors were strategically placed to avoid areas prone to extraneous vibrations and noise unrelated to structural loads. This positioning helped ensure that the captured data represented the true dynamic behavior of the bridge.
○ Calibration procedures: Pre-measurement calibration was conducted to confirm that sensors were functioning within their accuracy range, and alignment checks were performed to ensure that vibrations were measured consistently across different sessions.
❖ Validation through repeated measurements:
○ Cross-Validation: Multiple measurements were taken at each designated location, and results were cross-validated to detect inconsistencies and ensure the reliability of the processed data. This method confirmed that any observed changes in the PSD were reflective of actual structural conditions and not due to noise artifacts.
❖ Preprocessing pipelines:
○ Signal preprocessing workflow: A structured pipeline was implemented, beginning with raw data acquisition, followed by initial filtering, normalization, wavelet denoising, and final PSD computation. This step-by-step process ensured that each stage of data processing contributed to a cleaner, more accurate representation of the bridge’s vibrational behavior.
By incorporating these advanced data processing techniques and noise reduction strategies, the accuracy of frequency measurements was significantly enhanced. This comprehensive approach ensured that the PSD analysis could reliably identify structural changes, even in the presence of potential noise and external disturbances, thereby improving the overall effectiveness of the structural health monitoring framework.
While the mathematical formulations presented in this section—particularly Eqs. (1) through (17)—are classical in nature and widely available in signal processing literature, their inclusion serves to establish a precise foundation for the context-specific analysis conducted in this study. Unlike traditional applications that apply PSD or Fourier analysis in isolated snapshots, our approach repurposes these equations for temporal tracking of structural degradation through resonance-region evolution in PSD plots under random load-induced vibrations. We do not claim theoretical novelty in the equations themselves, but rather in their novel use for long-term, region-based vibrational health monitoring and deterioration quantification of real bridge structures.
3.1 View of the Binh Thuan Bridge in Ho Chi Minh City
The degradation of the structure of the bridge can accumulate over the useful life of the bridge. Therefore, as mentioned in Section 1, this study will be conducted using a non-destructive model based on actual measurement data from bridge spans. The study has measured and evaluated bridge structures using vibration signals with various measurement methods, such as measurements on the bridge deck, bridge surface, bridge piers, abutments, etc. The purpose of this study is to identify changes in bridge deterioration over time using the derived features of vibration signals through eigenfrequency values and resonance zones. In this article, the study will present research results on several bridges in urban areas, the most representative being the Binh Thuan bridge, a type of bridge commonly used in Ho Chi Minh City. The Binh Thuan bridge connects the urban and suburban areas of Ho Chi Minh City to the city center. Given the characteristics of developing urban areas, the pressure of vehicular traffic on the bridge is always a major concern to ensure its stable and safe operation. The bridge has six spans, of which the three middle spans (spans 2, 3, and 4) are made of prestressed concrete girders. The remaining spans are made of reinforced concrete, with a length of 24.7 m and a width of 24 m. This is the most important bridge connecting Ho Chi Minh City with the southern provinces, as shown in Fig. 2a.
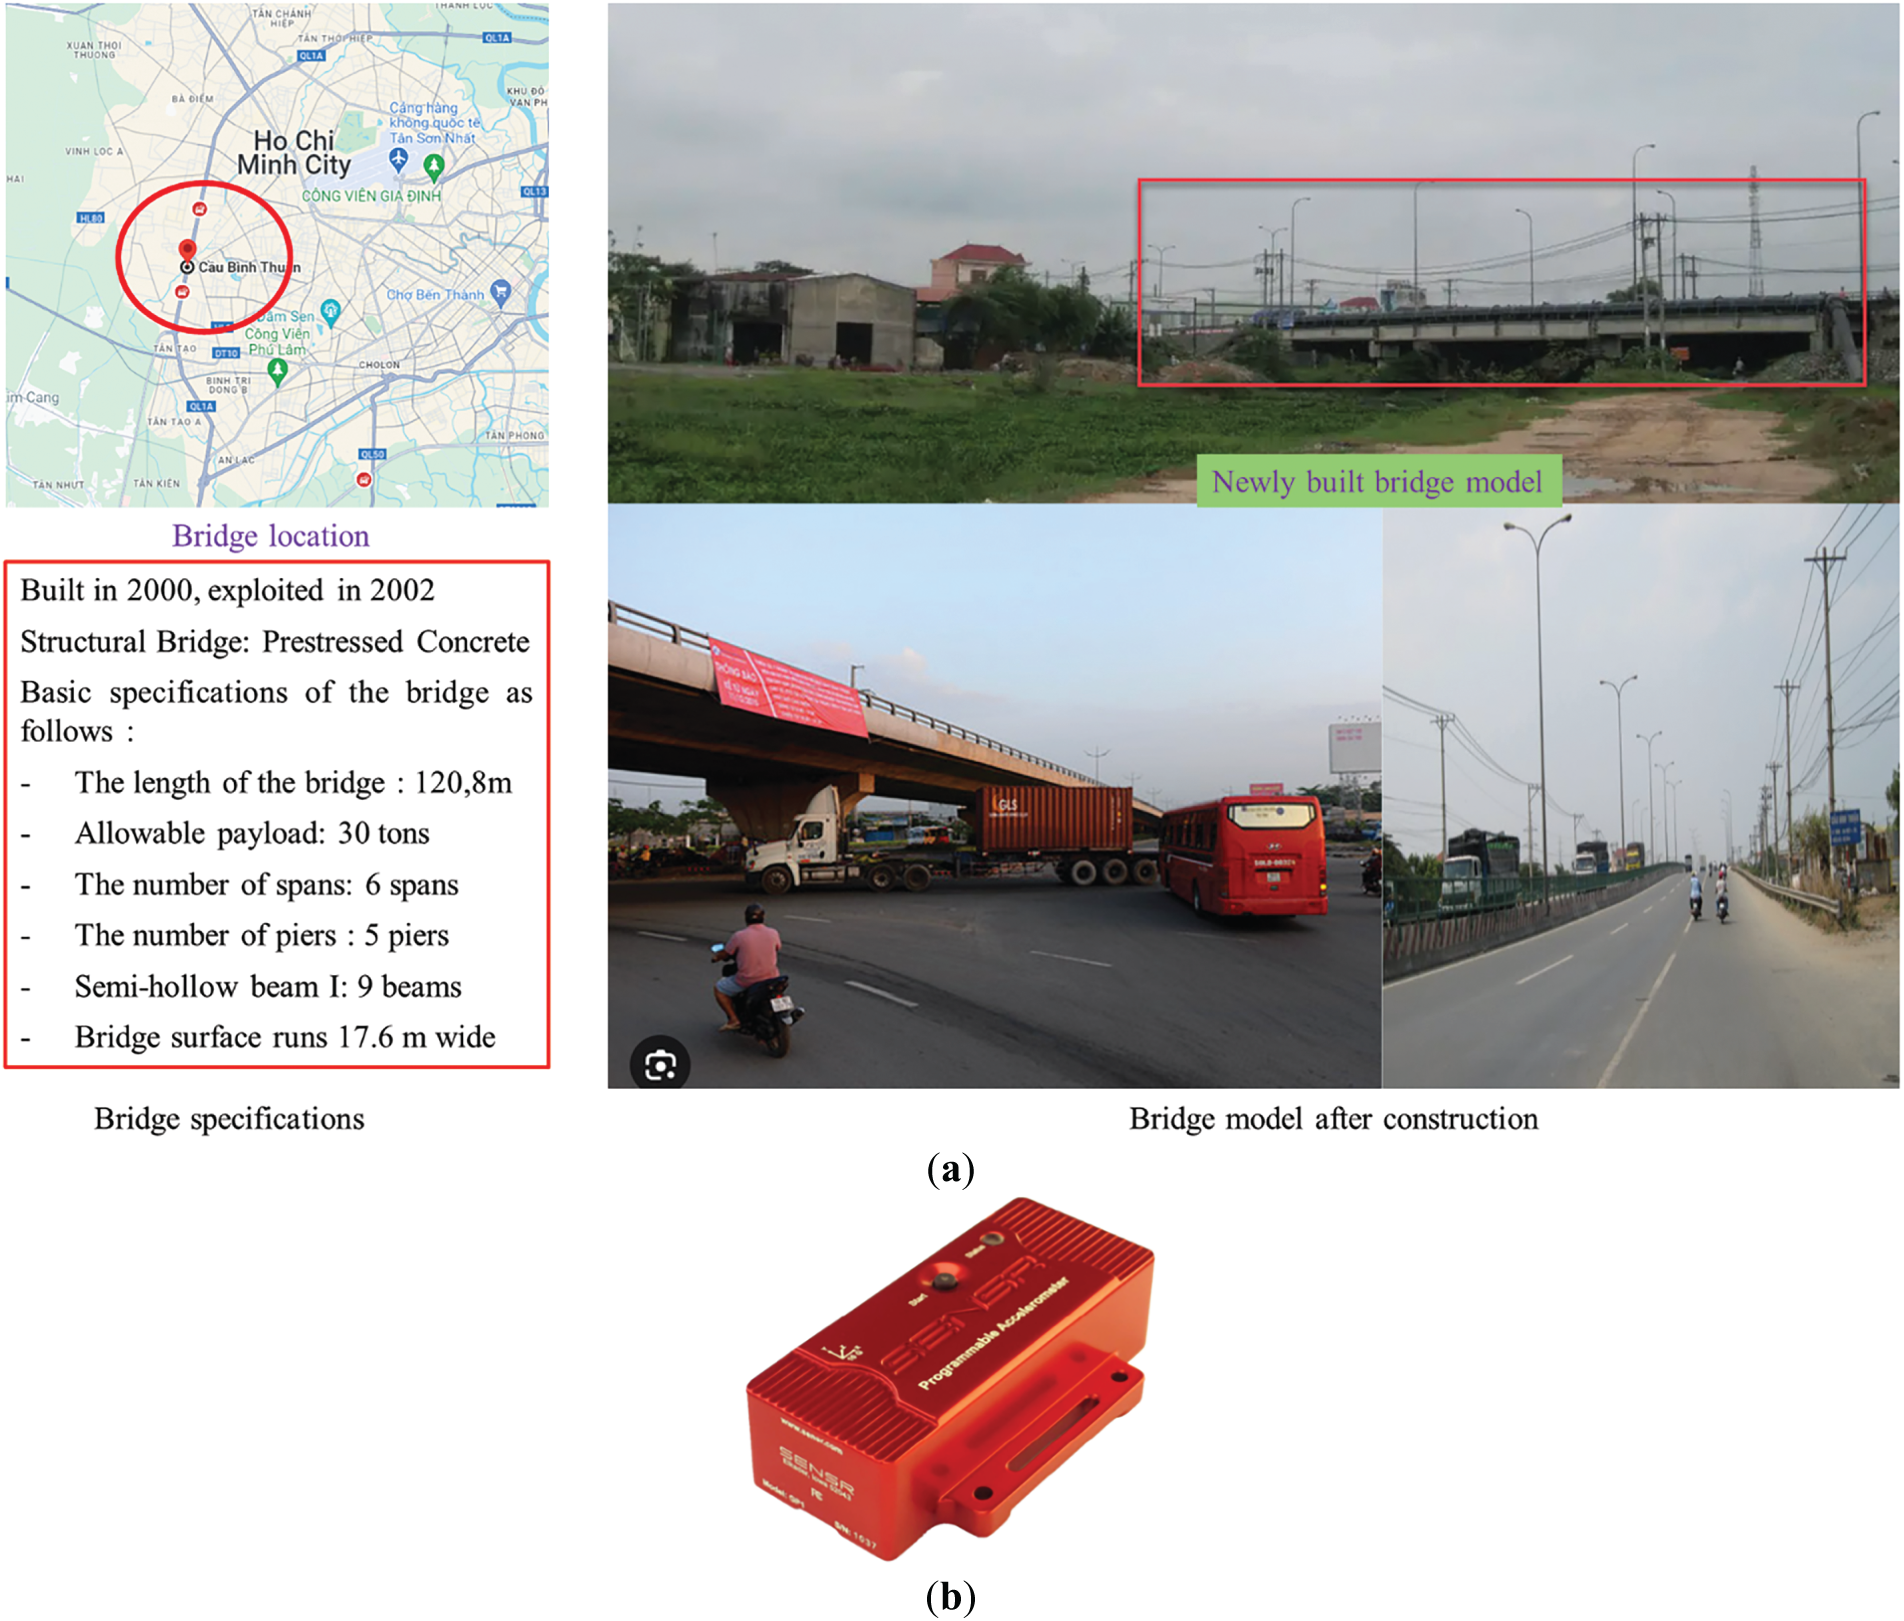
Figure 2: (a) View of the Binh Thuan Bridge in Ho Chi Minh City. (b) The accelerometer sensor
In this study, we developed detailed digital models of various bridge spans to simulate their dynamic behavior under random traffic loads. These models were constructed using finite element analysis software to accurately capture the geometry, material properties, and boundary conditions of the spans. By incorporating specific structural designs, such as reinforced concrete and steel girders, and reflecting diverse construction periods, we aimed to encompass a wide range of structural characteristics. The digital models were subjected to simulated loading conditions to evaluate their vibration responses, considering variations in span lengths, cross-sectional properties, and material characteristics. This comprehensive analysis allowed us to assess frequency changes and stiffness degradation across different bridge designs. The theoretical findings from these models were later compared with experimental data collected from real bridges, including the Binh Thuan Bridge, to validate our research results.
3.2 Methodology for Selecting Specific Spans on the Binh Thuan Bridge
The selection of specific spans on the Binh Thuan Bridge was based on a set of defined criteria to ensure structural diversity, data accessibility, and sensitivity to long-term degradation. These criteria included:
(i) Material type (reinforced concrete and prestressed concrete),
(ii) Traffic intensity (central spans vs. end spans),
(iii) Historical inspection records indicating prior maintenance or degradation risk, and
(iv) Ease of sensor installation and repeatable access across measurement campaigns.
By including spans with differing designs, materials, and exposure to loading, the study aimed to generalize findings across a broader range of structural conditions. The following criteria were employed to guide the selection:
⮚ The selection included spans constructed from different materials, such as reinforced concrete and prestressed concrete, to capture how variations in material composition and structural design impact dynamic behavior. This approach allowed for a more thorough analysis of the bridge’s response to vibrations, accommodating the unique characteristics of each span type.
⮚ Spans were chosen to represent areas subjected to varied traffic conditions. Central spans were prioritized due to their typical exposure to the highest levels of traffic-induced vibration, whereas spans near the bridge’s ends were included to observe how changes in load distribution affect structural response. This ensured that the study covered a comprehensive range of load scenarios.
⮚ The accessibility of spans for sensor placement and vibration data measurement was a critical factor. Only spans that allowed for safe and effective installation of vibration sensors were included, ensuring that the data collection process was feasible and consistent across measurement sessions. This step helped maintain the quality and reliability of the data.
⮚ Insights from previous structural inspections and historical maintenance records played a key role in the selection process. Spans that had shown indications of wear or varying levels of structural performance over time were prioritized. This enabled the study to focus on spans that were more likely to exhibit detectable changes in stiffness and resonant frequency shifts, enriching the analysis with valuable longitudinal data.
⮚ By choosing spans with differing construction periods and structural details, the study aimed to create a balanced dataset that could reflect the bridge’s overall health and dynamic behavior under varying conditions. This approach improved the representativeness of the study findings and provided insights applicable to other similar bridge structures.
These comprehensive criteria for selecting specific spans ensured that the research captured a realistic and holistic view of the bridge’s structural health under operational conditions. This methodology allowed the analysis to address potential differences in structural response due to construction materials, traffic exposure, and inherent structural characteristics, ultimately leading to more robust and generalizable findings.
The study used the SENSR from the model SENSR GP 1P, manufactured by Reference LLC/Sensor with serial number 1999 as shown in Fig. 2b. These sensors were used to measure the vibrations at the midpoint of each span on the bridge. The sensors had a general accuracy of ± (50 mg ± 5% reading) and operated at a sampling speed of 100 Hz. Each measurement session generated 2000 samples per file, and a total of 30 files were collected at each measurement location. The study examined the effects of external stimulation, specifically traffic loads, between 2021 and 2023, with data collected through six measurement campaigns, as in Fig. 3.
Figure 3: Measurement at the 6 point of the 3rd span of the Binh Thuan Bridge
In addition to using the SENSR GP 1P to measure the vibrations of the bridge spans, a comprehensive data acquisition system was employed to ensure accurate and reliable data collection. The acquisition system consisted of a multichannel data logger, capable of high-speed sampling at a rate of 100 Hz, synchronized with the accelerometers to capture the dynamic responses of the bridge structures. This system was equipped with the ADC to convert the analog signals from accelerometers into digital form, ensuring minimal signal loss and high fidelity in the capture of vibration signals. The data logger was connected to the CPU for real-time data monitoring and storage, facilitating efficient management of large datasets collected over multiple measurement campaigns.
During each measurement session, the accelerometers were installed at strategic points along the bridge spans, including midpoints and supports, to capture a comprehensive range of vibration modes. The data acquisition system continuously recorded the vibration signals for each session, generating 2000 samples per file, with a total of 30 files collected at each measurement location. This extensive data collection process allowed the analysis of frequency changes and the assessment of structural health over time.
The study conducted six measurement campaigns over a period of time, as illustrated in Table 1. In the initial four campaigns, there was an approximate interval of three to four months between each campaign. However, there was a significant increase in the time interval between the fourth and fifth campaigns, spanning 11 months. Subsequently, the interval between the fifth and sixth campaigns extended to 27 months. To ensure reproducibility, all six campaigns followed a standardized protocol:

• SENSR GP 1P accelerometers were installed at mid-span locations, calibrated before each use;
• Fixed at 100 Hz, consistent across campaigns;
• Each campaign collected 30 files of 2000 samples (20 s per file), repeated at the same physical points;
• Temperature and humidity were recorded to contextualize variations in stiffness or damping behavior.
These procedures are now fully described in a new paragraph in Section 3.1 to support reproducibility and transparent methodology.
3.3 Methodology for Simulating and Measuring Random Traffic Loads
To comprehensively capture the dynamic response of the Binh Thuan Bridge under real-world traffic conditions, this study employed a dual approach that combined field measurements and computational simulations. The following steps outline the detailed methodology used:
⮚ Real-time data was collected through the deployment of accelerometer sensors (model SENSR GP 1P) at critical points along the bridge spans, including midpoints and supports. These sensors, known for their accuracy (±50 mg ± 5% reading) and capability to sample at 100 Hz, recorded vibration signals caused by random traffic loads. Measurements were conducted during six campaigns spanning from January 2021 to April 2023. Each session produced 2000 samples per file, and 30 files were collected per measurement point. This extensive data collection process ensured that the dataset reflected a wide range of traffic-induced vibration scenarios.
⮚ In parallel, digital models of the bridge spans were developed using ANSYS software to simulate the structural response under random traffic loads. The models accurately represented the geometry, material properties, and boundary conditions of the bridge. Traffic loads were modeled using probabilistic distributions to account for different types of vehicles, weights, and velocities that typically occur on the bridge. This allowed for the creation of realistic, non-deterministic traffic scenarios that mimic actual traffic behavior.
⮚ The simulation inputs were derived from historical data on traffic flow, which included statistical variations in vehicle density, types, and speeds observed over typical operating periods. This data was used to design a set of random load conditions that reflected the non-uniformity and variability of real traffic. By incorporating these elements, the study ensured that the simulated traffic loads closely represented the dynamic nature of actual road usage.
⮚ The PSD analysis was conducted on both the measured vibration data from the sensors and the simulated responses from the digital models. This analysis enabled the identification of key frequency components within the vibration signals, facilitating the detection of shifts in resonant frequency regions that correspond to structural changes, such as stiffness degradation. To validate the PSD-based approach, we constructed finite element models (FEM) of the selected spans using ANSYS software, replicating geometry, material properties, and boundary conditions based on design drawings and inspection data. These models were subjected to synthetic random loading conditions statistically matched to observed traffic data. The natural frequencies and mode shapes derived from simulations were compared with those extracted from the measured PSD plots. Consistency between simulated and experimental resonance regions—especially their frequency location and relative prominence—served as a validation metric. In cases of deviation, FEM parameters (e.g., material stiffness or support flexibility) were iteratively adjusted to minimize error between simulated and measured PSDs. This process confirmed that the observed frequency changes were attributable to structural changes, not modeling artifacts.
By combining real-time measurements with detailed simulations, this comprehensive approach ensured that the study could assess the structural behavior of the bridge under varying traffic conditions with high accuracy. This dual methodology not only enhanced the reliability of the findings but also supported the development of a robust, non-destructive monitoring system for structural health assessment.
3.4 Influence of Environmental Factors on Vibration Signals and Control Measures
Environmental factors such as temperature, humidity, and wind can play a significant role in influencing vibration signals in structural health monitoring. These variables may affect the material properties and dynamic response of bridge structures, potentially impacting the accuracy of the PSD analysis. To ensure reliable and meaningful results, the following measures were taken into account:
⮚ Temperature fluctuations can alter the stiffness of bridge materials, leading to changes in their natural frequencies. For instance, increased temperatures may reduce material stiffness, while colder temperatures can increase it, impacting the vibration response. To mitigate this, measurements were conducted during periods with minimal temperature variance whenever feasible. Temperature data was recorded during each measurement session, allowing us to correlate observed frequency shifts with possible thermal effects. This practice ensured that significant changes due to temperature were identified and not misinterpreted as structural damage.
⮚ The damping properties of structural materials can be influenced by humidity levels, which affect how vibrations propagate through the bridge. High humidity can increase the damping effect, potentially altering the amplitudes in the PSD analysis. To control for this, we scheduled data collection during consistent weather conditions and recorded humidity levels throughout the measurement period. This step helped us differentiate between changes due to environmental factors and genuine structural responses.
⮚ Wind-induced vibrations can introduce noise that distorts the PSD of the vibration signals. To minimize this impact, we applied preprocessing techniques such as noise filtering and signal smoothing to clean the data. Additionally, sensor placement was optimized to reduce exposure to wind-induced disturbances, ensuring that recorded signals represented the true response of the bridge structure to traffic loads.
⮚ Advanced preprocessing techniques were employed to enhance the quality of the recorded data. Signal filtering and noise reduction algorithms were used to remove low-frequency noise and environmental interferences. This step was crucial in ensuring that subtle changes in vibration signals could be accurately analyzed without being overshadowed by external noise.
⮚ To further minimize environmental impact, measurement sessions were planned during periods with stable weather conditions. This approach helped reduce the variability in vibration signals attributed to transient environmental factors, allowing for a more accurate assessment of the structural health based on PSD analysis.
These measures collectively enhanced the reliability and consistency of the vibration data collected for the PSD analysis. By addressing potential environmental influences, the study provided a clearer interpretation of the vibration response and ensured that any changes detected were more likely to reflect true structural behavior rather than external factors.
4.1 The Power Spectrum Density of Real Vibration Signals
By continuously measuring the vibration signals of the actual loads on the Binh Thuan Bridge and several other bridges in the urban area, the figures that represent the actual measurement signals are shown in Fig. 4. During the practical operation of the bridge, not only the Binh Thuan bridge but also many other bridges in the urban area undergo various activities with different loads and velocities simultaneously. Therefore, in practical bridge health monitoring, environmental context—including variable soil conditions and foundation behavior—plays a pivotal role in the vibrational response and resonance characteristics. For instance, in long-span railway bridges founded on piled supports, dynamic soil–structure interaction (SSI) produces significant reductions in natural frequencies and peak acceleration levels, especially under operational loading conditions. Similarly, in lightly embedded foundations, soil–caisson dynamic interaction (SCDI) can result in rotational motion and reduced acceleration amplitudes not predicted when assuming rigid support.
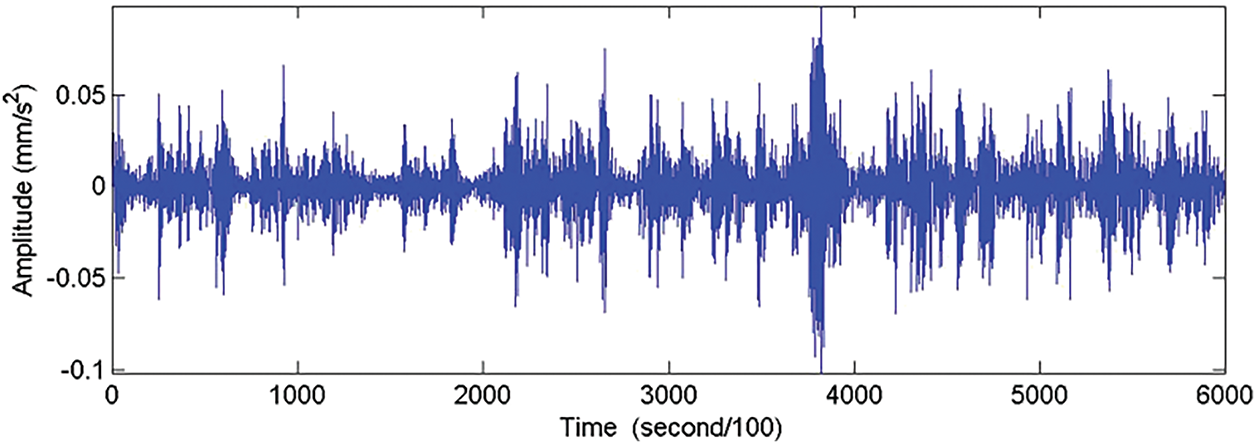
Figure 4: Acceleration vibration signal on Binh Thuan
Using Fourier analysis theory, we generate the PSD from each data set of actual vibration signals recorded on the bridge, depicted in Fig. 5. This PSD offers intricate insights into the energy distribution across frequencies of the vibration signals, aiding in the identification of key frequency components and the detection of any noteworthy or irregular fluctuations in the bridge’s operation. Additionally, the PSD serves as a valuable tool to assess and forecast the performance and condition of the bridge over time.
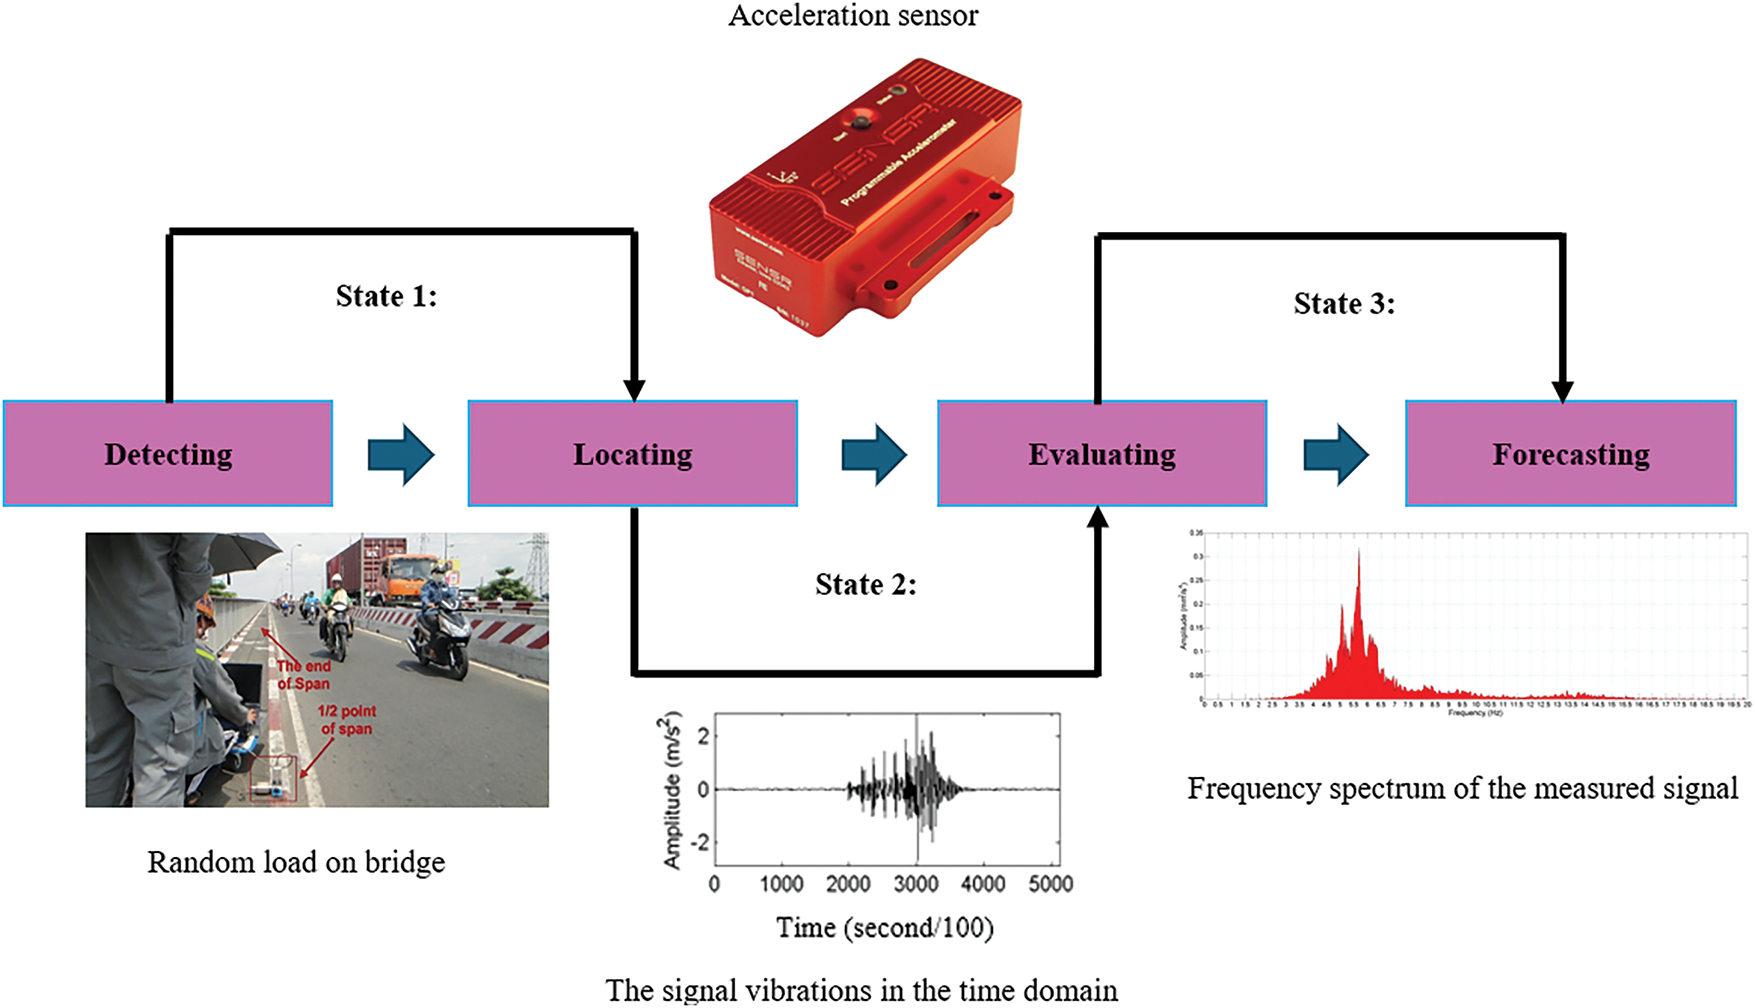
Figure 5: Acceleration vibration signal on a span on the Binh Thuan Bridge
Through Fourier analysis, Fig. 4 can be transformed from real vibration signals into a power spectral density plot, as shown in Fig. 6. Through this process, we transition from the time domain to the frequency domain, displaying the energy distribution of the vibration signals across different frequencies. This power spectral density plot provides information on the intensity and distribution of frequency components in the signal, helping us gain a deeper understanding of the structure and characteristics of the vibrations, as well as the factors influencing the operational performance of the bridge.
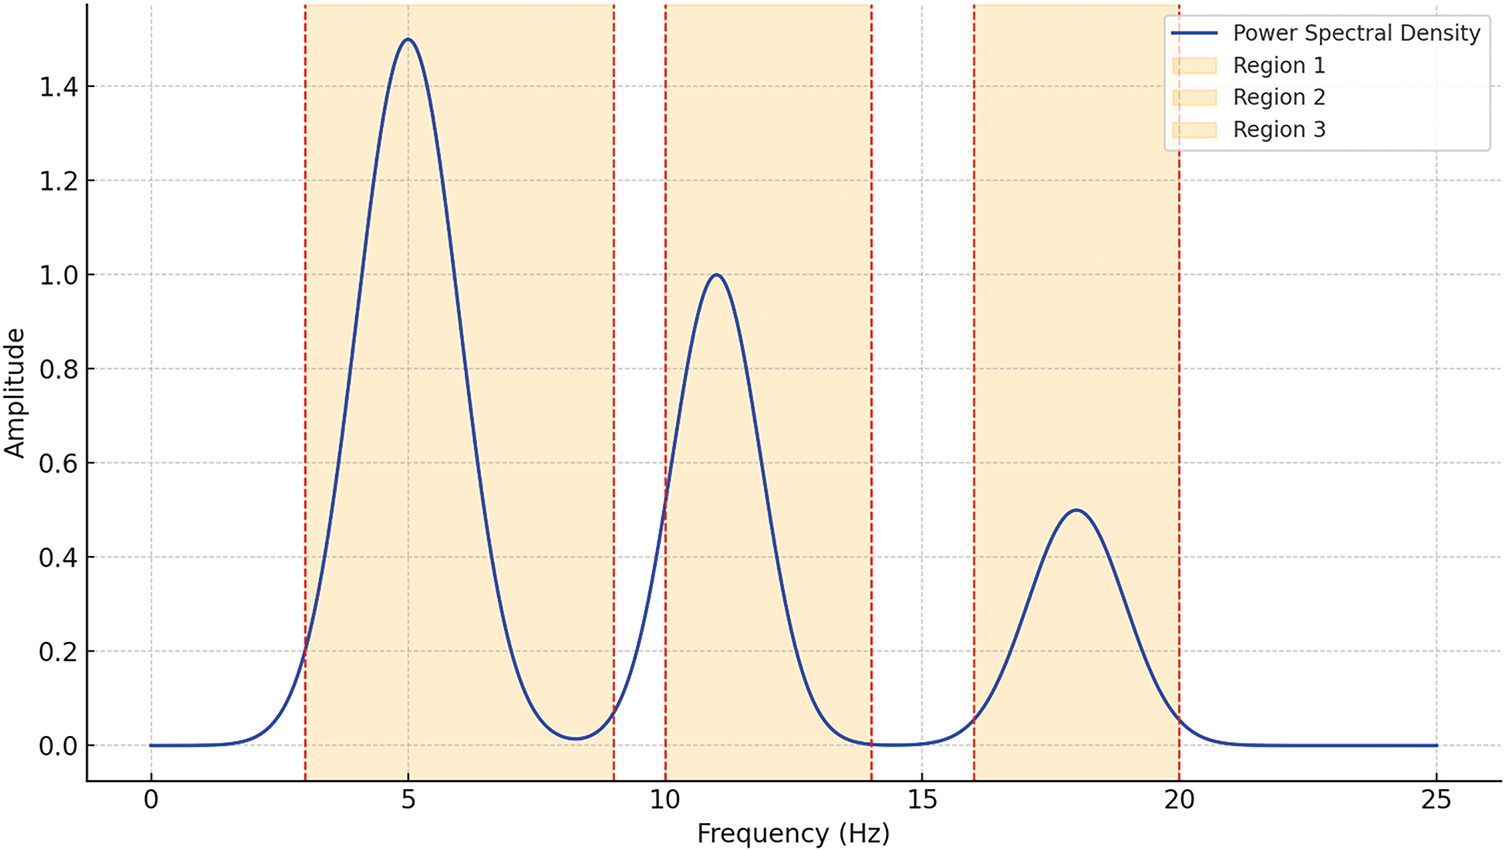
Figure 6: The power spectrum by the vibration signal of one span on the Binh Thuan Bridge
As depicted in Fig. 6, fluctuations in traffic flow during the duration of the measurement manifest themselves in a diverse distribution of the spectral density on the Binh Thuan bridge. This study diligently scrutinizes alterations in the power spectral density characteristics of the Binh Thuan Bridge over an extensive time frame to monitor these fluctuations. The manuscript will delineate the shifts in power spectral density characteristics as follows:
– Amidst the array of the PSD plots, comprising six plots and representing roughly 20% of the total survey dataset on the Binh Thuan Bridge at span 3, a distinctive pattern emerges: all multiples of eigenfrequency values are confined within a resonance region spanning from 3 to 6 Hz. Consequently, the manuscript isolates a singular fundamental frequency, which denotes the highest amplitude multiple frequency. This suggests that the PSD s reflect the bridge’s free-vibration state. However, closer inspection of the PSD plots in Fig. 6 reveals slight discrepancies in this frequency value between the plots, although insignificant. These deviations may be attributed to the influence of noise signals and errors during measurement or data processing.
– Among the PSD plots surveyed, 10 plots, which constitute approximately 37% of the total dataset, exhibit a distinctive pattern: All multiples predominantly cluster around two resonance regions spanning from 3 to 6 Hz and from 10 to 12 Hz. This observation unveils a significant revelation: the bridge’s dynamics is not solely governed by its fundamental frequency, which accounts for about 20% of the total power spectral density. Instead, frequencies within the resonance regions between 10 and 12 Hz also exert a notable influence. This underscores the bridge’s susceptibility to frequencies contingent upon its unique structural composition and characteristics across different resonance regions.
– Of the total the PSD plots surveyed, 14 plots, which represent approximately 43% of the dataset, exhibit shared multiples spanning from 2 to 24 Hz. This observation underscores a crucial insight: the bridge’s vibrations are not solely confined to fundamental frequencies or those contingent upon specific structural attributes. Instead, they manifest in a broader spectrum of frequencies, highlighting the intricate and multifaceted nature of factors that influence bridge vibrations and operational dynamics.
The lowest resonance region consistently dominates the frequency of occurrence among the actual power spectral density plots, despite its lower frequency value compared to other regions. This suggests a greater stability in the frequency value of the lowest resonance region compared to higher value regions. Drawing from the comprehensive analysis of cumulative PSD plots obtained during the initial survey of the Binh Thuan Bridge, the study consistently reveals a noteworthy pattern: the fundamental frequency, characterized by its highest amplitude within the PSD, is consistently found surrounded by resonance regions. Discrepancies between the actual fundamental frequency value and its counterpart in the PSD can be largely attributed to factors such as noise interference, measurement inaccuracies, and data processing errors.
A survey carried out across the spans of the Binh Thuan bridge, featuring reinforced concrete material, at six distinct measurement intervals, reveals intriguing insights into the power spectral density of the spans of the bridge, as depicted in Fig. 7. The analysis demonstrates the formation of three resonance regions characterized by significant amplitudes. Specifically, these regions are delineated as follows: The first resonance region spans from 3 to 9 Hz, the second region extends from 8 to 14 Hz, and the third region occupies the frequency range between 16 and 20 Hz. Similarly, from a survey conducted on another span of a bridge featuring steel structural material on the Binh Thuan Bridge, visualized in Fig. 8, distinct patterns emerge. Here, the analysis reveals the predominance of two resonance regions that exhibit substantial amplitudes. In particular, these regions are identified as the first resonance region, which varies approximately from 3 to 10 Hz, and the second region, which includes frequencies between 10 and 18 Hz.
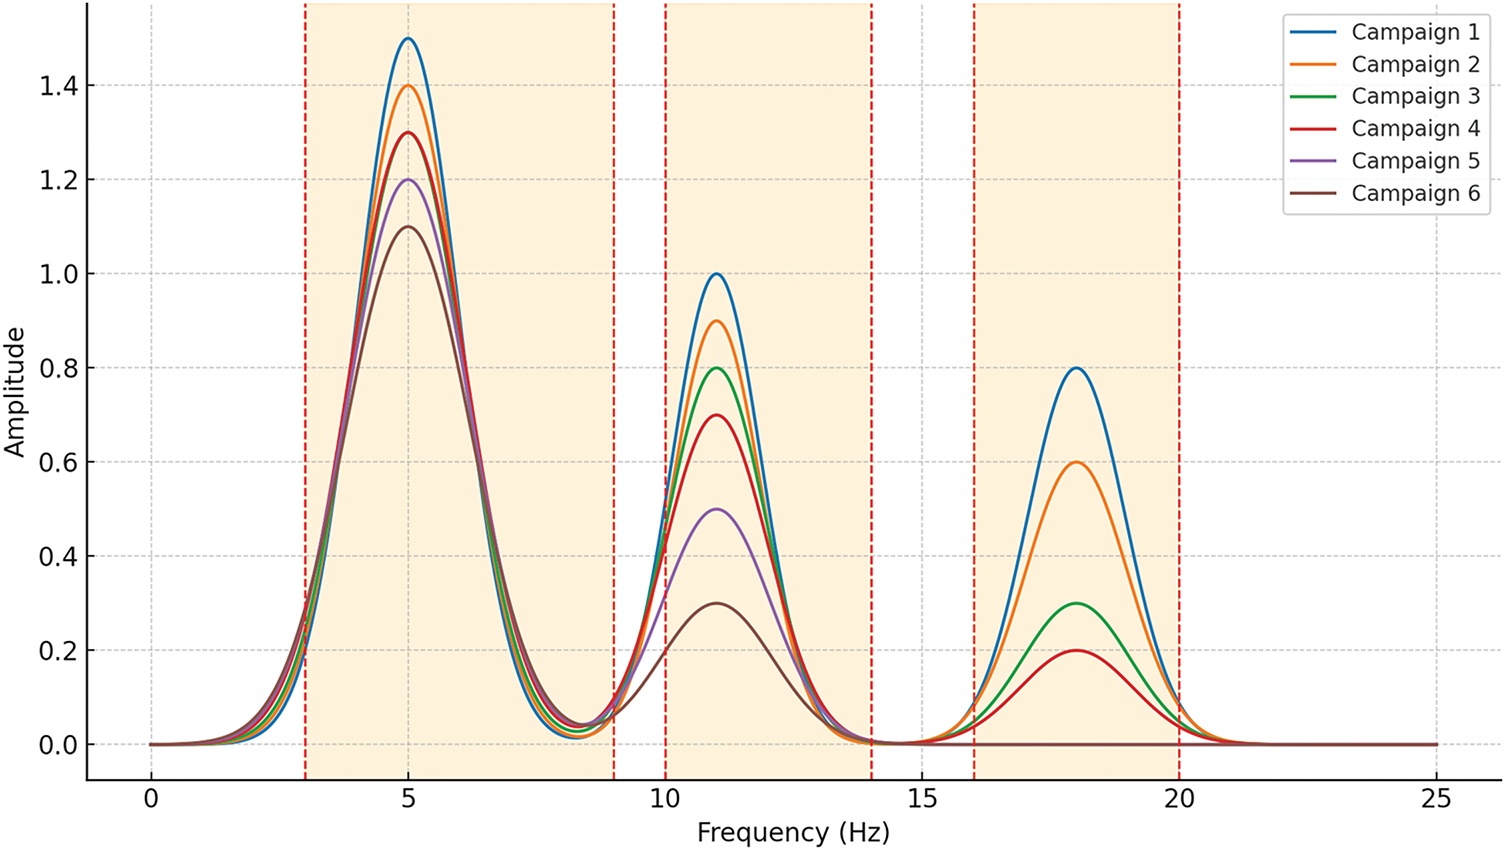
Figure 7: PSD of the prestressed concrete material spans 6 different times
Figure 8: PSD of the prestressed concrete material spans 6 different times
Fig. 7 illustrates the power spectral density (PSD) evolution of prestressed concrete spans on the binh thuan bridge across six measurement campaigns, emphasizing the dynamic behavior of resonance regions over time. Three distinct resonance zones—region 1 (3–9 Hz), region 2 (10–14 Hz), and region 3 (16–20 Hz)—are clearly delineated, revealing critical insights into the degradation process of structural stiffness. A key innovation presented in this study lies in the longitudinal tracking and classification of resonance regions, rather than relying solely on single-frequency shifts. Unlike traditional approaches that monitor only the fundamental frequency, this figure reveals how higher-frequency resonance zones (region 3) progressively diminish in both amplitude and presence, while region 1 remains dominant and stable throughout the measurement period. This downward migration of vibrational energy—from high-frequency to lower-frequency regions—signals a systematic loss in structural stiffness and offers a novel, quantifiable indicator of long-term deterioration in concrete bridge spans. The disappearance of region 3 and the concurrent amplification of region 1 provide a new interpretation framework for diagnosing aging behavior in prestressed concrete structures under real-world traffic-induced random vibrations. Therefore, Fig. 7 substantiates one of the core contributions of this research: the development of a resonance-region-based psd monitoring methodology that advances the sensitivity and resolution of structural health evaluation, particularly for detecting gradual degradation trends over extended operational periods.
Fig. 8 presents the power spectral density (PSD) profiles of steel-structured spans on the binh thuan bridge, captured over six long-term measurement campaigns. Two dominant resonance zones are evident: region 1 (3–10 Hz) and region 2 (10–18 Hz). This figure complements and contrasts with Fig. 7 by demonstrating how different structural materials (steel and prestressed concrete) exhibit distinct degradation dynamics under similar environmental and loading conditions. Over time, region 2—initially pronounced—exhibits a marked decline in amplitude, suggesting progressive loss of higher-mode vibrational energy. In contrast, region 1 maintains a relatively stable amplitude, indicating that the structure’s response becomes increasingly concentrated in lower-frequency bands. This trend reflects a redistribution of dynamic energy, which corresponds to a gradual stiffness reduction in the steel spans.
When compared with Fig. 7 (prestressed concrete), two major distinctions emerge:
– Rate of degradation: The higher-frequency resonance regions in concrete spans (region 3: 16–20 Hz) vanish more rapidly than those in steel spans, aligning with material behavior—concrete tends to exhibit faster stiffness degradation due to creep and shrinkage, whereas steel retains its elastic properties over longer periods.
– Resonance zone structure: Concrete spans initially feature three distinct resonance regions, while steel spans exhibit only two, indicating differences in modal complexity and vibrational response attributable to material stiffness, damping, and geometry.
The novelty of the analysis lies in this comparative interpretation of resonance region evolution across structural materials, providing a new paradigm for material-specific deterioration assessment in structural health monitoring (shm). By introducing resonance-region migration as a diagnostic metric, this study moves beyond the conventional reliance on single natural frequency tracking, thus offering a more robust and sensitive tool for early damage detection and long-term bridge health evaluation
During the evaluation of the PSD amplitudes in Figs. 7 and 8, it is evident that the first resonance region consistently exhibits the highest amplitude, while the third resonance region consistently shows the lowest amplitude. Over time, the amplitude of the third resonance region notably decreases from the first to the third measurement, or between the first and fifth measurements, depending on whether the bridge span is constructed of reinforced concrete or steel material on the Binh Thuan Bridge. This decrease is followed by a significant reduction in both the amplitude and the area of the second resonance region. Eventually, after six measurements spanning an extended period, the area of the third resonance region vanishes entirely. When different measurements are compared, it is evident that the first measurement displays significant amplitudes across all three resonance regions. Subsequently, there is a declining trend in both the amplitude and area of the third resonance region from the second to the fourth measurement. The amplitudes and areas of the fifth and final measurements predominantly lie within the first and second resonance regions, indicating a shift in the PSD sharing of the bridge spans over their operational lifespan.
4.2 Discrepancies between Fundamental Frequency Values and PSD-Derived Frequencies
The PSD analysis serves as a powerful tool for examining the vibrational characteristics of structures and monitoring their health. However, discrepancies between theoretically expected fundamental frequency values and those observed through the PSD analysis can occur due to a variety of factors. This section delves deeper into the potential causes of these discrepancies to provide a comprehensive understanding for structural health monitoring applications.
Soil stiffness and foundation flexibility fundamentally affect bridge vibration behavior. As derived from the soil dynamics framework (Eqs. (3) and (4) in the referenced study), the foundation rotation under dynamic loading can be estimated by considering both translational and rotational compliance of the soil-foundation system. These rotational effects introduce additional low-frequency modes that may merge with or mask higher-order vibrational bands, causing divergence from theoretical frequency predictions for rigid systems. Such rotational compliance effectively lengthens the apparent natural period and attenuates higher-frequency resonance energy, consistent with our observed disappearance of high-frequency PSD regions over time.
In addition to structural and modeling uncertainties, environmental conditions—especially temperature and humidity—can significantly impact the stiffness and dynamic response of bridge materials. For instance, elevated temperatures can reduce the elastic modulus of concrete and steel, leading to lower resonant frequencies, while cooler temperatures tend to increase stiffness. Similarly, high humidity levels may enhance damping, particularly in porous materials like concrete, which can alter the amplitude and width of PSD peaks. These effects are particularly relevant in long-term monitoring across seasons. To mitigate misinterpretation, environmental data were recorded during each campaign and used to contextualize shifts in frequency when not directly attributable to structural degradation.
❖ Structural nonlinearity and localized damage
One key factor contributing to frequency discrepancies is structural nonlinearity. Real-world structures may exhibit non-linear behavior under certain load conditions or as a result of damage such as micro-cracks and fatigue. These non-linearities can shift the natural frequencies of the structure from their theoretical values:
– As small cracks develop, they cause localized reductions in stiffness, affecting the dynamic response and resulting in frequency shifts. These changes may not be reflected in theoretical models that assume linear elasticity.
– The response of the structure under varying loads can introduce non-linear characteristics, causing observed frequencies to deviate from those predicted by linear models.
❖ Variability in material properties due to environmental effects
The inherent properties of construction materials, such as elasticity and density, can change due to environmental conditions:
– Over time, material degradation can alter the stiffness and damping characteristics of a structure, leading to shifts in observed frequency values.
– Fluctuations in temperature can cause expansion or contraction in materials, affecting their stiffness. Similarly, high humidity can increase damping, altering the vibrational response. These factors contribute to differences between the theoretical and observed frequency values, especially during different seasons or weather conditions.
❖ Changes in boundary conditions
The boundary conditions of a structure significantly influence its dynamic behavior. Small changes or variations in these conditions, such as:
– Settlements of bridge piers or abutments can shift the load distribution and affect the natural frequencies.
– Seasonal temperature changes can expand or contract bridge components, modifying the effective boundary conditions and causing discrepancies between fundamental and PSD-derived frequencies.
❖ Dynamic interactions from load conditions
Bridges and similar structures are subject to dynamic loads from traffic that introduce complex vibrational interactions:
– The interaction between moving vehicles and the bridge surface creates dynamic forces that can produce additional frequency components. These interactions can cause shifts in the PSD-derived frequencies, particularly under varying traffic volumes and speeds.
– The combined effect of multiple moving loads can create coupled vibrational modes that influence the overall frequency response, complicating the direct comparison with theoretical single-mode predictions.
❖ Simplifications in theoretical modeling
Theoretical models used to predict fundamental frequencies often incorporate assumptions to simplify calculations:
– Many models assume uniform material properties, which may not reflect real conditions where materials can have localized variations in density or stiffness.
– Simplified models may consider fixed or idealized boundary conditions, whereas real structures may have more flexible or shifting connections.
– Real structures can exhibit non-linear behavior that theoretical models fail to capture, resulting in discrepancies when comparing observed psd data with expected frequencies.
❖ Practical implications for structural health monitoring
These potential causes of frequency discrepancies underscore the importance of context when interpreting PSD analysis results. By acknowledging structural nonlinearity, environmental impacts, variations in boundary conditions, dynamic load interactions, and modeling simplifications, engineers can better distinguish between natural frequency shifts due to these factors and those indicative of structural damage. This comprehensive understanding improves the accuracy and reliability of PSD analysis as a tool for detecting and assessing structural health, enabling more informed decisions regarding maintenance and safety interventions.
4.3 Detailed Criteria for Defining and Identifying Resonance Regions within PSD Plots
In the context of structural health monitoring, the identification of resonance regions within the PSD plots is essential for understanding the dynamic behavior of a structure. These regions correspond to frequency bands where the structure exhibits significant vibrational energy, revealing key insights into its natural frequencies and potential changes in stiffness. Below, we elaborate on the criteria and methodology for defining and identifying these resonance regions
❖ Definition of resonance regions
Resonance regions are characterized by frequency intervals within a PSD plot where pronounced energy peaks are observed, indicating strong resonance responses from the structure. These regions are pivotal as they reflect the inherent vibrational properties of the structure, which can shift or change in response to damage or modifications in structural integrity.
❖ Criteria for identifying resonance regions
To ensure precise and consistent identification of resonance regions, the following criteria and processes were applied:
– Automated peak detection: Advanced peak detection algorithms were employed to automatically scan the PSD plots and identify significant energy peaks. This helped pinpoint frequencies where energy concentrations were highest, marking potential resonance regions. Specifically, we employed the
– Amplitude threshold and baseline analysis: A relative amplitude threshold was established to differentiate genuine resonance peaks from minor noise-induced variations. This involved calculating the average noise floor and setting the threshold at a level that allowed for the consistent identification of significant peaks. The amplitude threshold was further validated by comparing results across multiple PSD plots from different measurement sessions. This cross-validation ensured that the threshold was appropriate and robust for detecting consistent resonance patterns.
– Frequency band definition: Once significant peaks were identified, their surrounding frequency ranges were analyzed to define the start and end points of the resonance region. This included identifying the frequency at which the amplitude began to rise and where it returned to baseline levels, enclosing the entire energy peak. To confirm that identified regions represented actual structural behavior, these frequency bands were checked for consistency across different sessions. Only frequency bands that appeared consistently over multiple measurements were confirmed as resonance regions.
– Environmental and operational considerations: The analysis was performed with consideration for external factors such as noise and operational variability. Data preprocessing steps, such as noise filtering and signal normalization, were applied to ensure that resonance regions were not artifacts of transient environmental noise but true indicators of structural response. The stability of the resonance regions was tracked over time to observe any shifts or changes that could indicate alterations in the structural health of the bridge. This approach allowed for the identification of trends in the PSD plots that signaled potential damage or degradation.
❖ Application and interpretation
By applying these criteria, the study was able to identify and analyze resonance regions within the PSD plots accurately. These regions provided critical information about the structural dynamics and were used to monitor changes that could signify damage or shifts in stiffness. This effect reflects the non-ideal behavior of real foundation systems. In particular, soil deformability creates both translational softening and additional damping, which shift the measured resonance bands to lower frequencies and broaden the PSD peaks. Rotational behavior of the foundation—especially in rocking or uplift scenarios—further alters modal characteristics by coupling translational and rotational modes, which are inadequately captured by rigid-base assumptions. The consistent application of these identification steps ensured that resonance regions were robust indicators of structural health and not influenced by noise or temporary anomalies
❖ Importance of identifying resonance regions
The ability to clearly define and track resonance regions within the PSD plots is vital for effective structural health monitoring. These regions reveal shifts in natural frequencies and changes in the amplitude distribution, which can point to variations in structural stiffness or the presence of damage. Accurately identifying these regions enhances the capability to detect early signs of structural issues, supporting timely maintenance and intervention strategies.
4.4 Characteristics Change of Resonance Regions
In the PSD plots, multiple resonance regions coexist consistently at each measurement time. Actual vibration plots are obtained for each different measurement time. After Fourier analysis, it is observed that some the PSD plots have only one resonance region, some have two, and others have three resonance regions. From Figs. 9 and 10, the overall ratio of the PSD plots for different structural materials, including reinforced concrete and steel on the Binh Thuan Bridge, varies at different measurement times. However, during an extended health monitoring period, the data show that the PSD plots with multiple resonance regions (two or three regions) decrease significantly, while the number of the PSD plots with only one resonance region suddenly increases. This indicates that over the operational lifespan of the bridge, the probability of the PSD plots containing high-frequency resonance regions decreases and is replaced by plots with only one resonance region, despite unchanged traffic loads. This shift highlights a critical method for assessing load bearing capacity and monitoring the condition of bridge spans throughout their useful life.
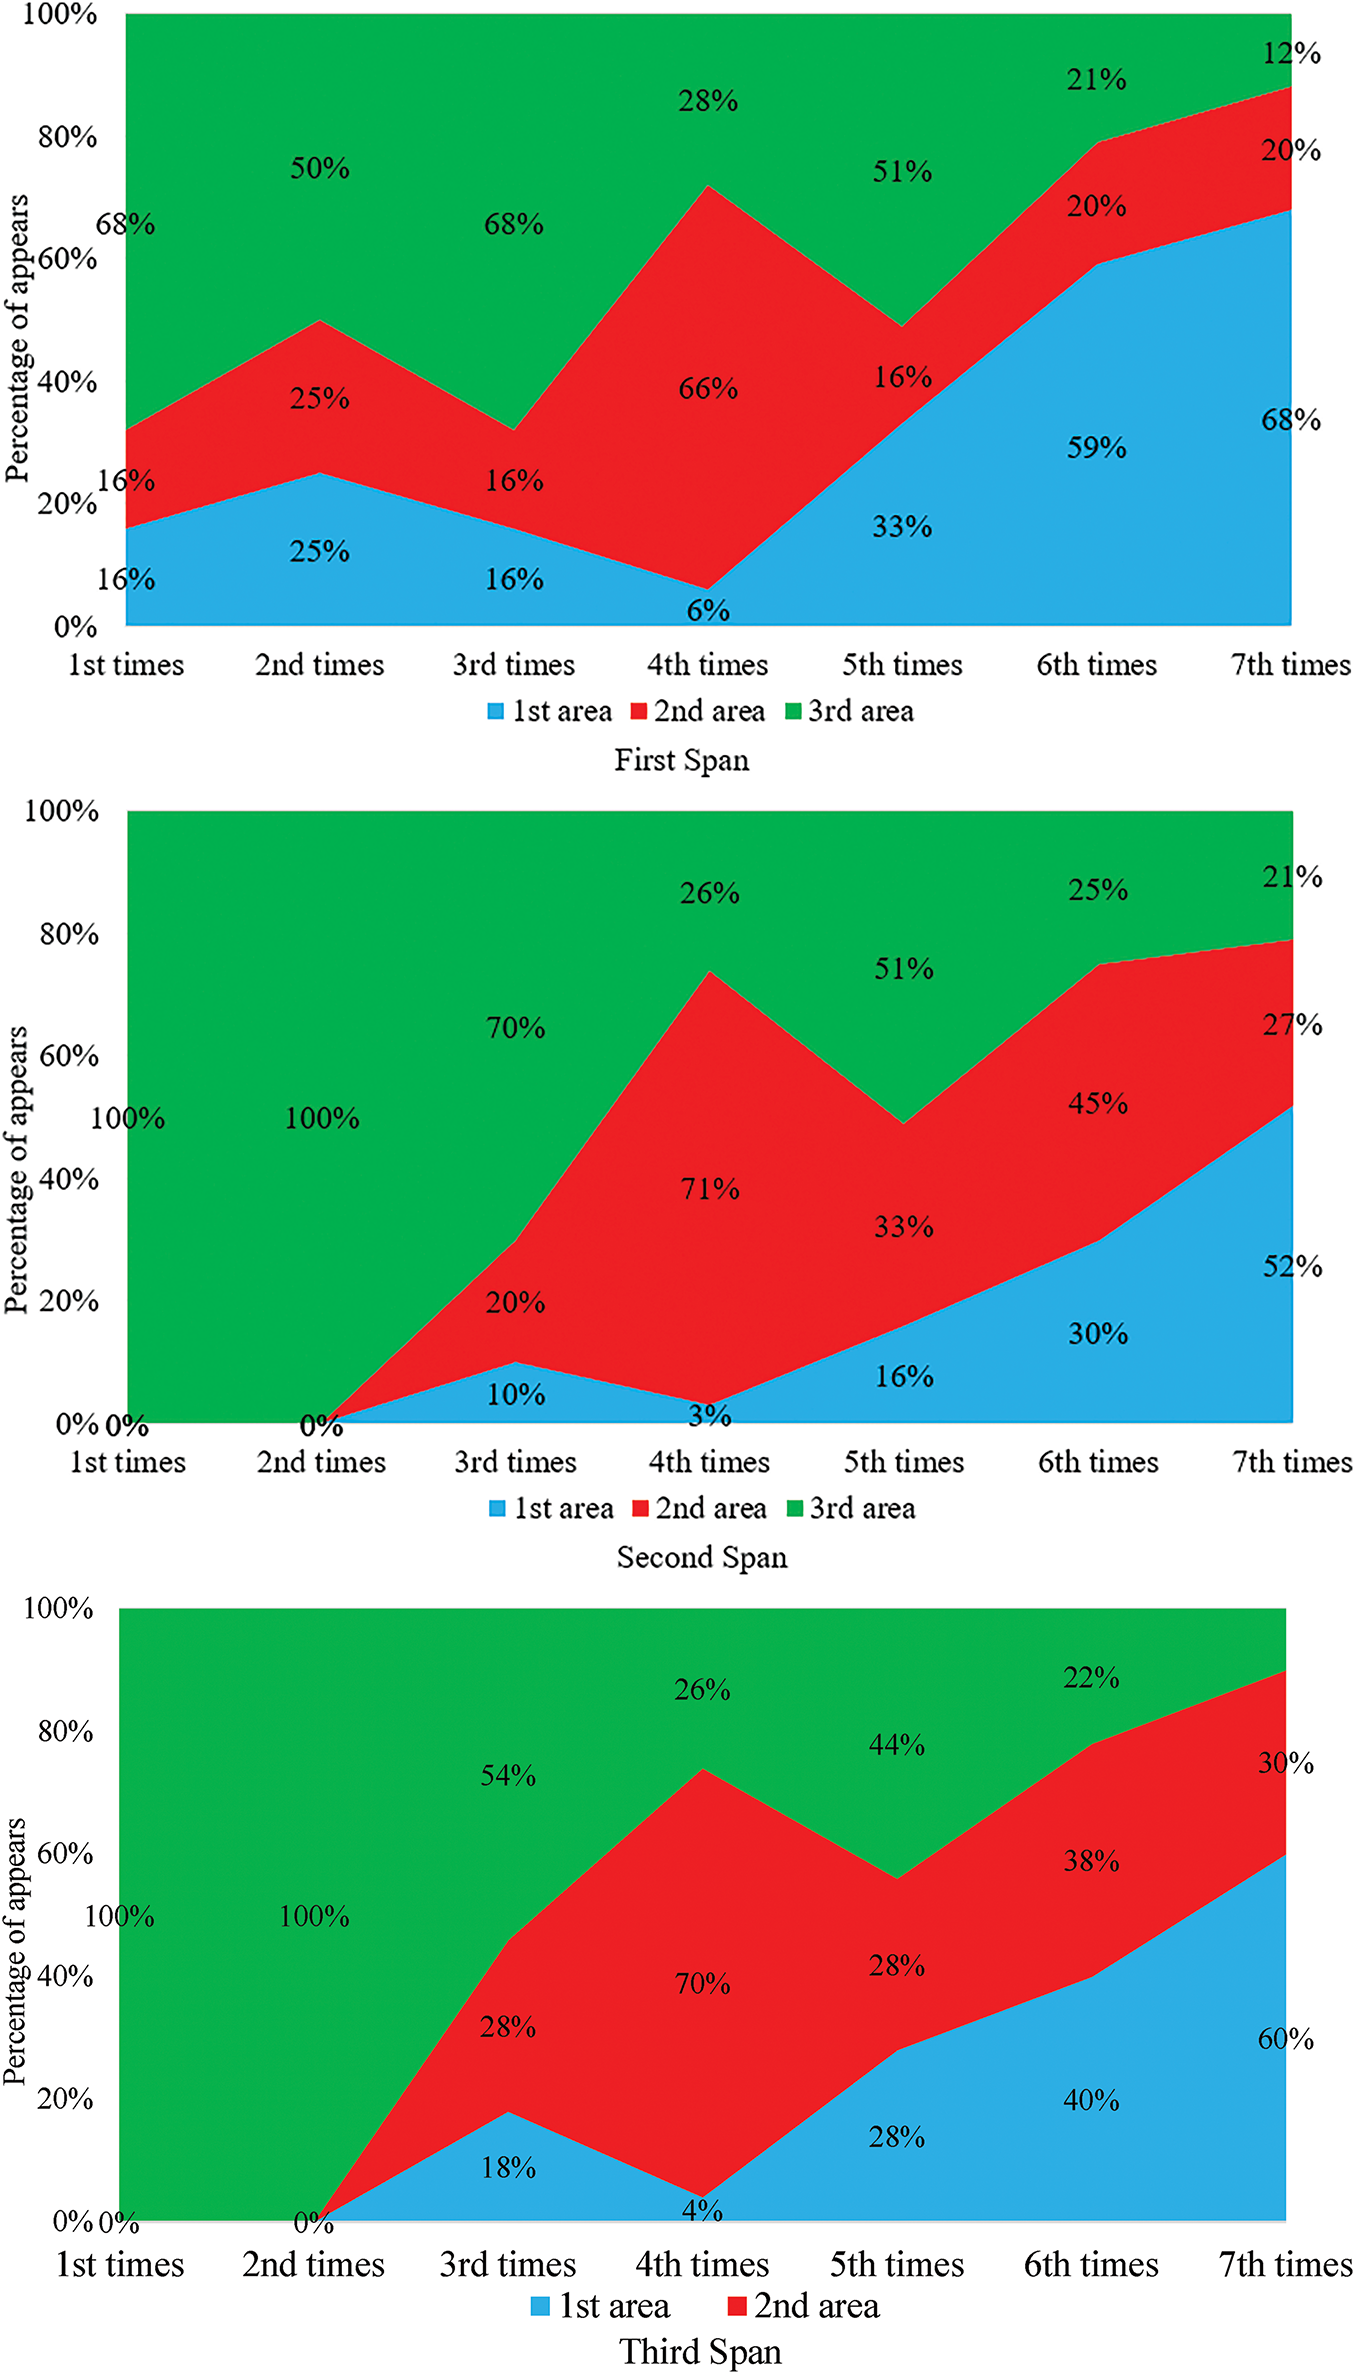
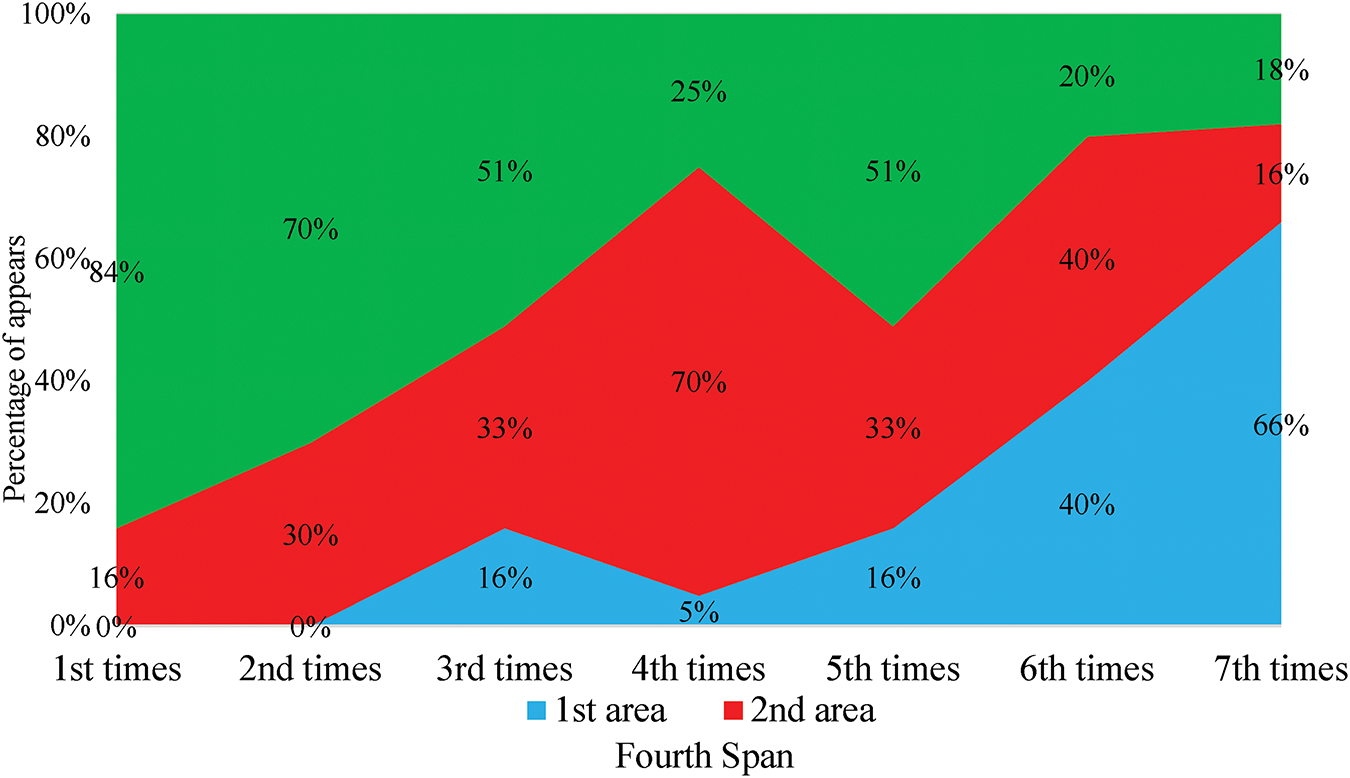
Figure 9: Percentage change in resonance area in the prestressed concrete structure
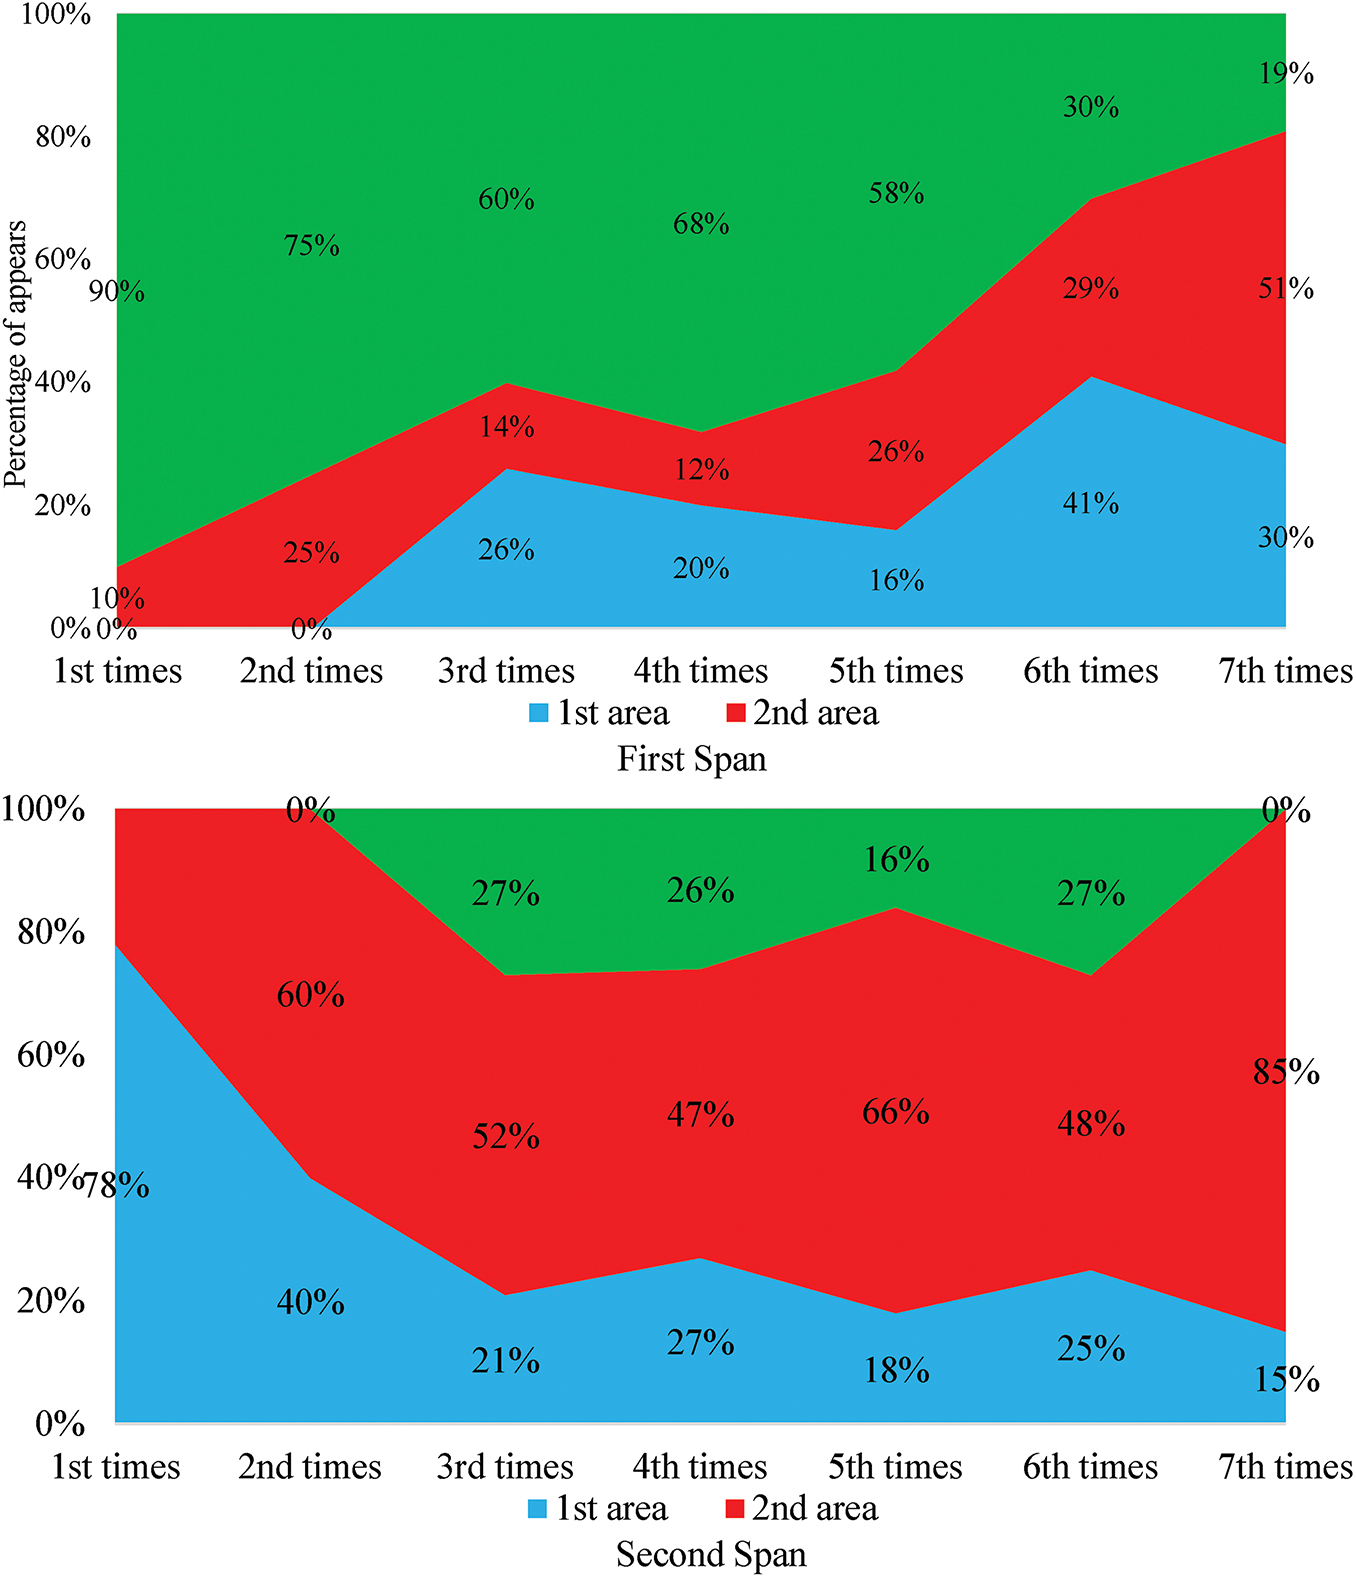
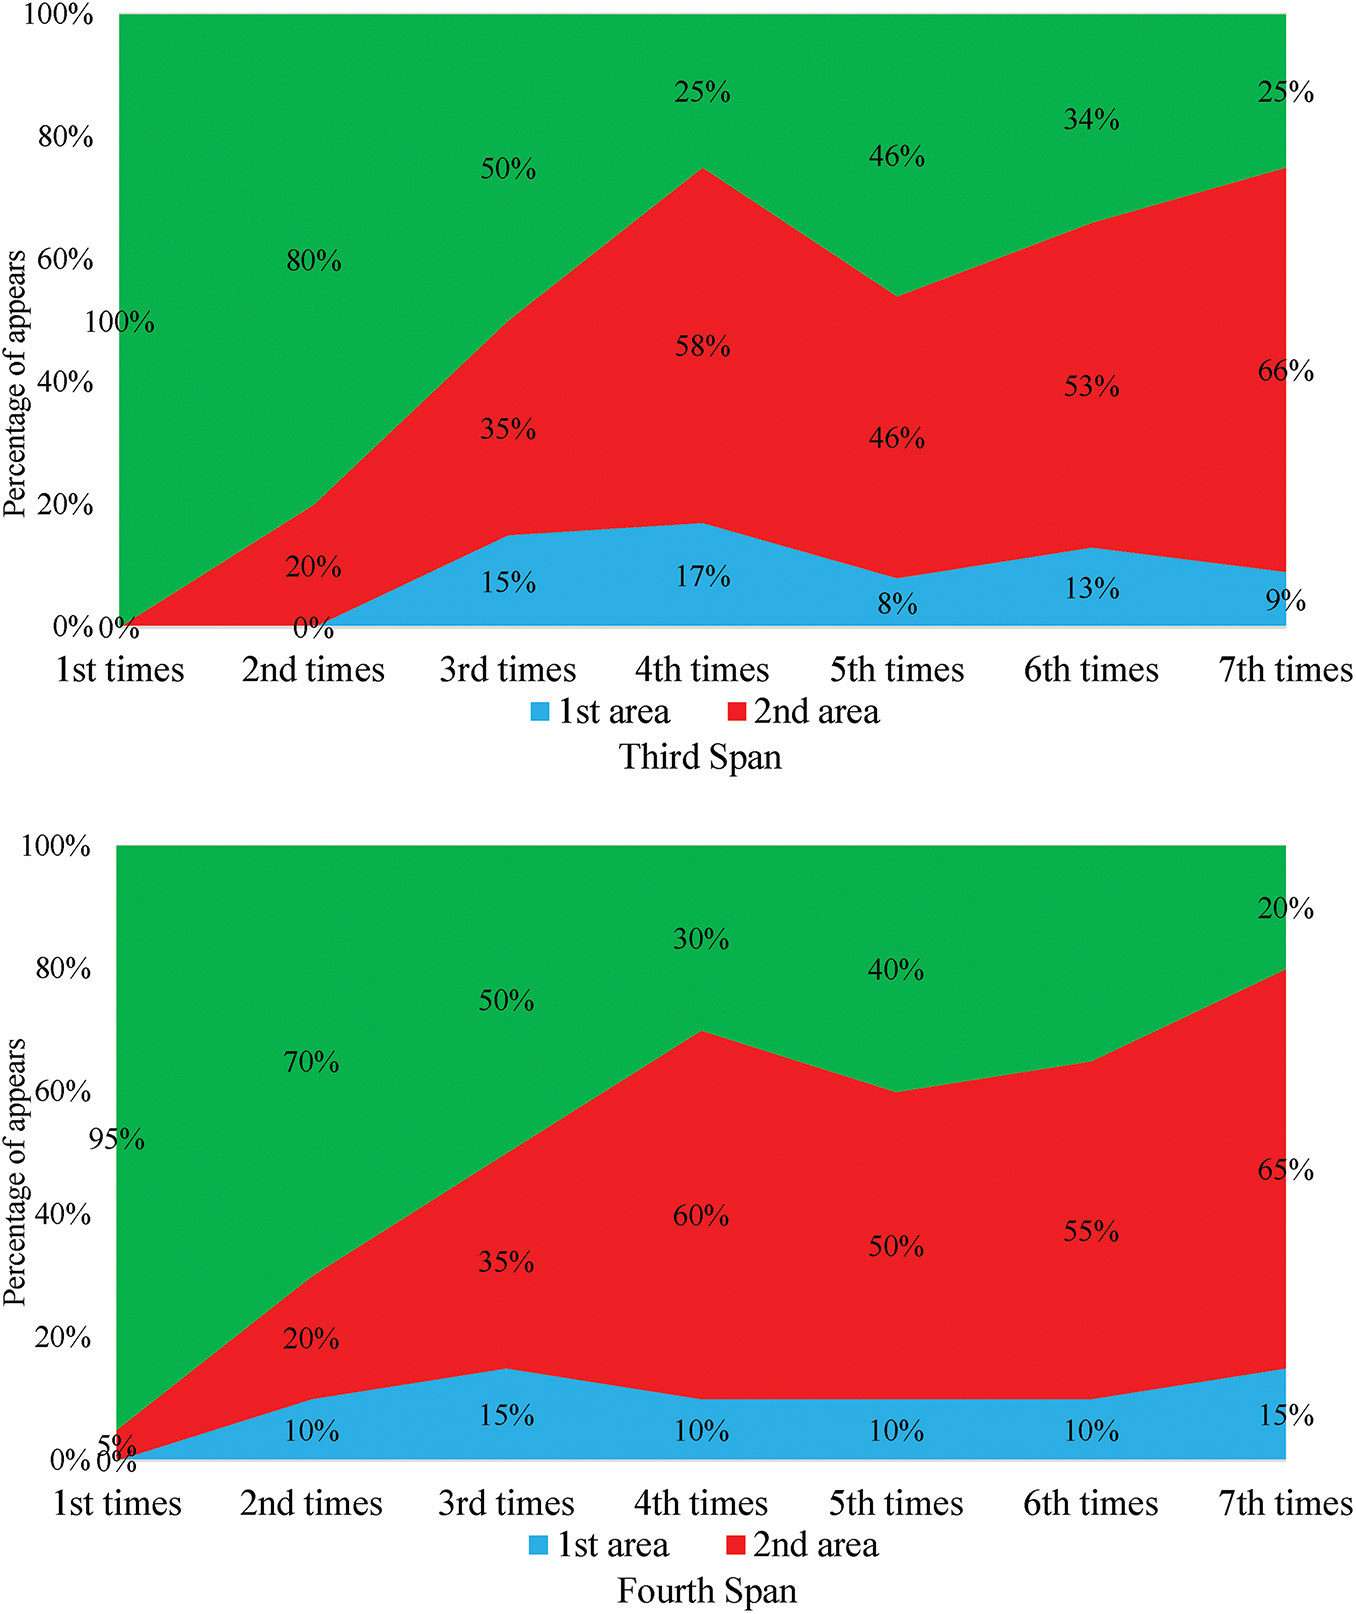
Figure 10: Percentage change in the resonance area of the steel structure material
In Fig. 11a–f, the percentage of PSD plots exhibiting dominant resonance energy in Region 1 (3–9 Hz), Region 2 (10–14 Hz), and Region 3 (16–20 Hz) across six measurement campaigns on concrete spans. Color intensity represents the proportion of occurrences. A gradual disappearance of Region 3 and corresponding dominance of Region 1 over time indicates stiffness degradation in the prestressed concrete system.
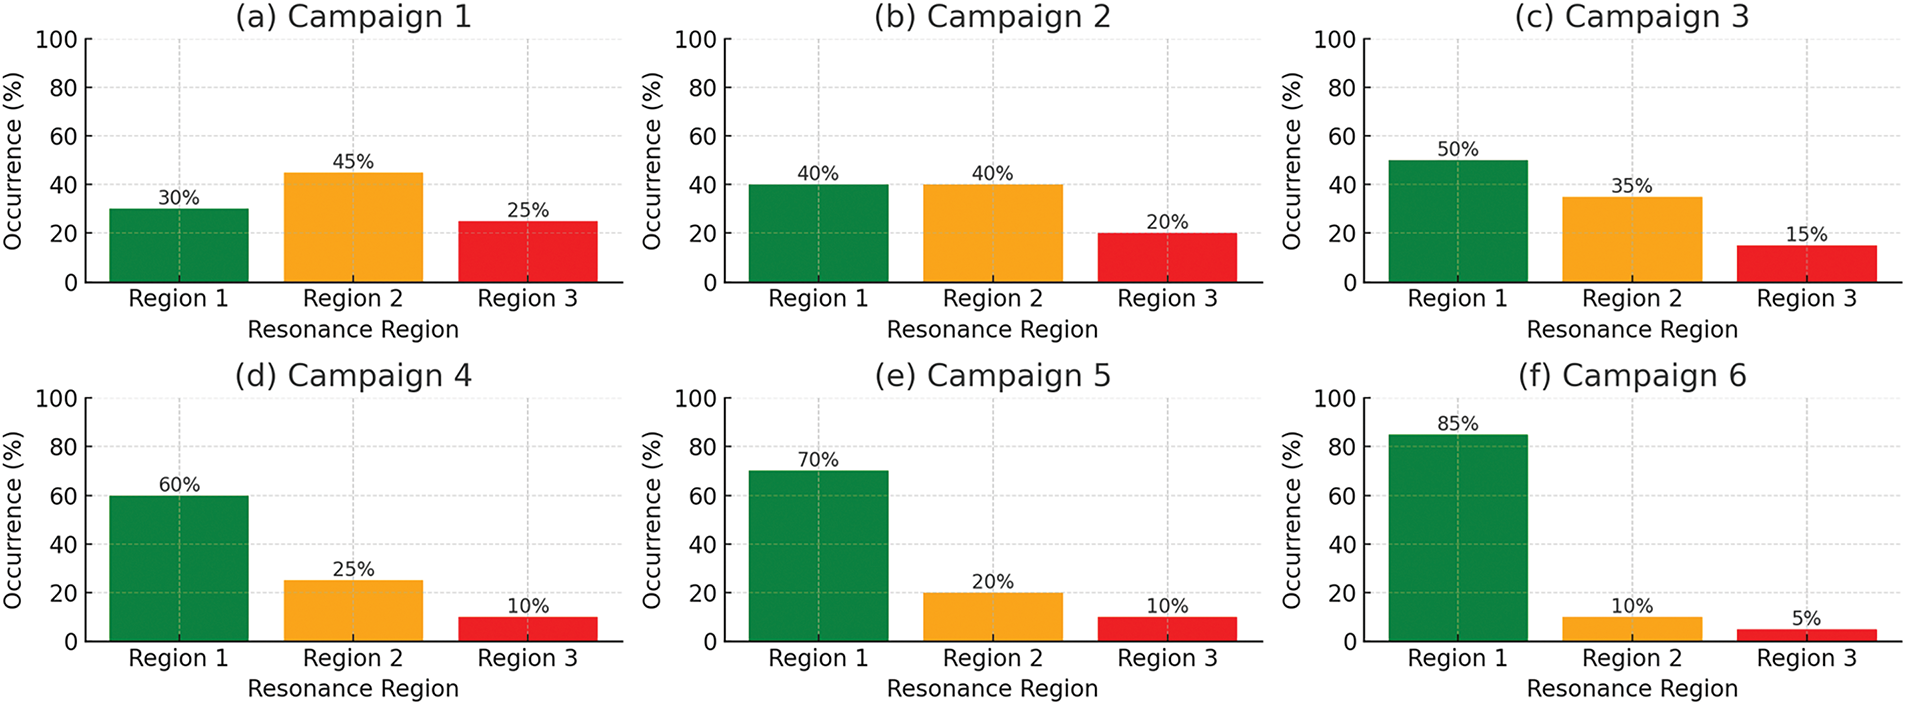
Figure 11: Evolution of resonance region distribution–prestressed concrete spans
In Fig. 12a–f, the percentage distribution of resonance region occurrence for steel bridge spans across six campaigns. Unlike concrete, the decline in Region 2 is slower, and Region 1 remains stable, indicating delayed stiffness degradation. This supports material-based differentiation in damage progression under similar traffic and environmental conditions.
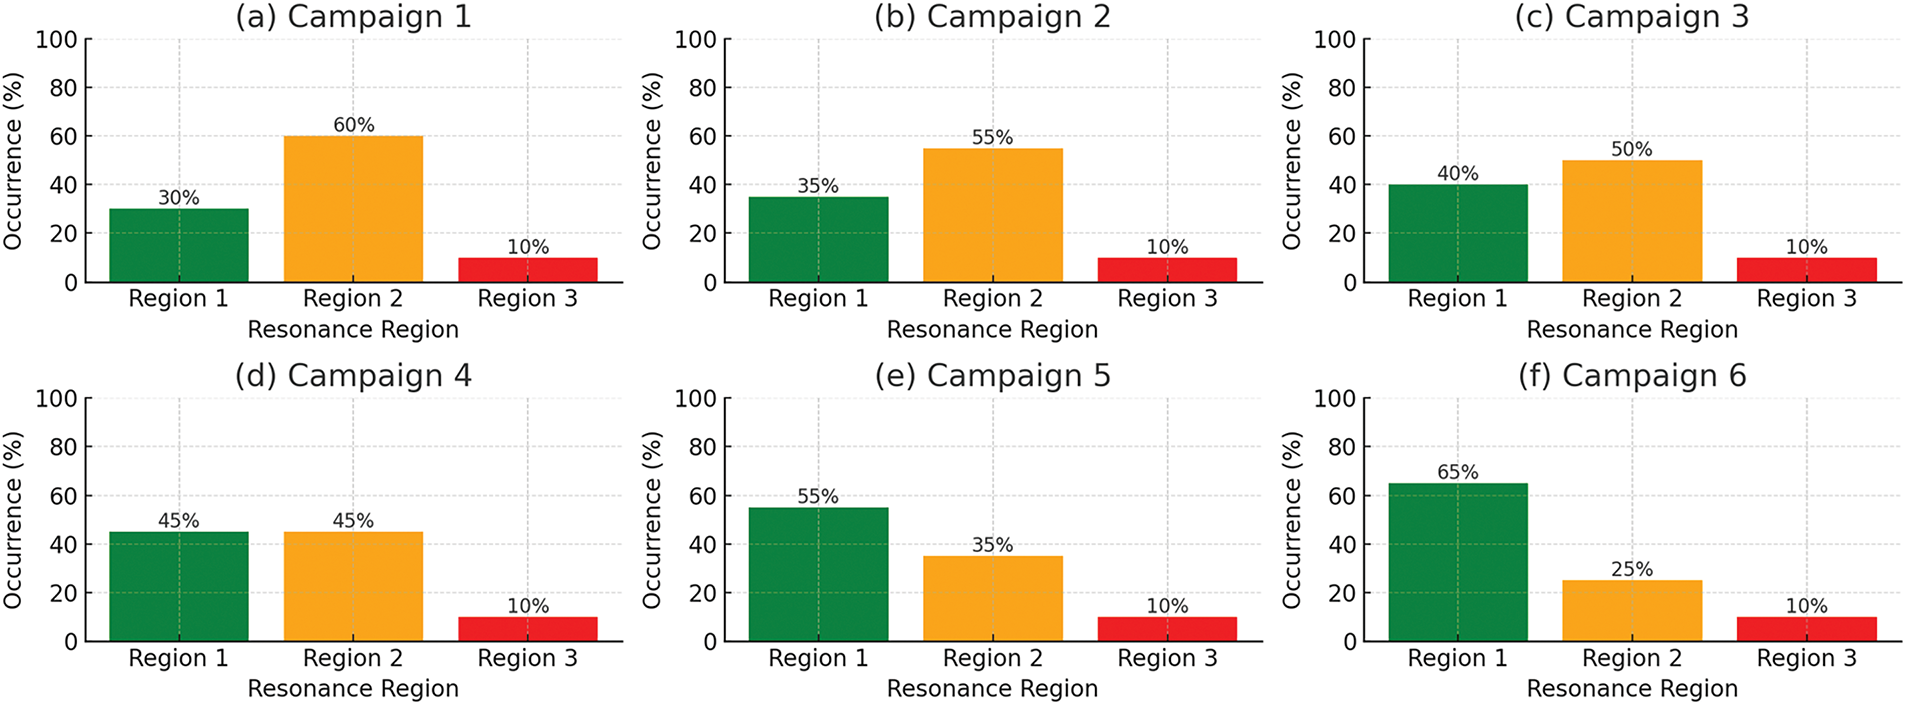
Figure 12: Evolution of resonance region distribution–steel spans
Figs. 11 and 12 show the evolution of resonance region dominance over time, with subplots (a) through (f) corresponding to measurement campaigns 1 through 6. In Fig. 11, the prestressed concrete spans exhibit a clear transition from energy distributed across three regions to a concentration in Region 1 by the final campaign. This progressive suppression of higher-order resonance regions (especially Region 3) provides compelling spectral evidence of cumulative stiffness degradation. In contrast, Fig. 12 for steel spans demonstrates slower migration, with Region 2 still contributing notable energy even in later campaigns. This reflects the better fatigue resistance and lower degradation rate of steel under similar operating conditions. The contrast between these two figures illustrates how resonance-region-based PSD analysis can differentiate material-specific structural health trends, adding interpretive power beyond conventional single-frequency methods.
Over a certain period, the probability of encountering PSD plots with multiple resonance regions has markedly decreased. According to mechanical theory, with constant traffic loads and operational time, bridge spans gradually lose their load-bearing capacity, leading to a corresponding decrease in the amplitudes of higher-order harmonics. The theory further suggests that the energy of vibrations induced by traffic loads will shift from the higher to lower resonance regions. When comparing the steel and reinforced concrete materials from the Binh Thuan Bridge (Figs. 9 and 11), the highest resonance region of the reinforced concrete structure exhibits a more rapid change in the rate of occurrence compared to steel within the same time frame. This fits perfectly with the properties of these structural materials, as steel generally has a longer failure time than concrete. These new findings demonstrate a novel method to assess the load bearing capacity of bridge spans and monitor their condition throughout their operational lifetime, offering a significant advancement in structural health monitoring.
In the high-frequency region (the third region), the resonance areas have shown a notable decreasing trend over time. Initial measurements (the first in January 2021 and the second in June 2021) on all spans of the Binh Thuan Bridge revealed that the third region accounted for a significant energy ratio, approximately 40% and 30%, respectively, with a peak around 17 Hz. However, subsequent measurements (the third in July 2021 and the fourth in January 2023) exhibited a dramatic reduction in the area of the third resonance region below 5%. This suggests substantial energy transfer from the third resonance region to the second or first resonance regions. Interestingly, the area of the second region did not increase correspondingly within this short time frame. Later measurements (the fifth in July 2022 and the sixth in January 2022) showed a significant decrease in the area of the second resonance region, while the area of the first resonance region saw a sudden increase. Particularly in the sixth measurement, the third resonance region’s area in the PSD plot became very small or nearly non-existent. The disappearance of the third resonance region is interpreted as an indicator of physical stiffness degradation rather than sensor limitations. As higher-order modes are more sensitive to localized stiffness and boundary conditions, their suppression or disappearance in the psd indicates that the structure is losing the dynamic complexity required to excite these modes. This suggests a softening of the structural system, in which the energy from external loads is no longer sufficient to activate the high-frequency resonance behavior previously observed. Sensor calibration and signal amplification parameters were validated across all campaigns, and no systematic loss of sensitivity was detected. Therefore, the consistent decline in region 3 across multiple spans and campaigns is taken as evidence of a genuine physical phenomenon—most likely linked to micro-cracking, cumulative material fatigue, or redistribution of internal stresses—rather than an artifact of measurement. This phenomenon is mainly attributed to the transfer of vibration energy from high-frequency regions to lower-frequency regions, which ultimately concentrates energy in the first resonance region. Therefore, as the load capacity of the bridge span decreases, the resonance region area in the PSD plot becomes crucial to determine the sensitivity to the operation condition of the bridge, especially in relation to the regions of highest and lowest frequencies.
The spectral evolution identified in the power spectral density (PSD) plots [5,13,33], especially the downward migration and eventual disappearance of the third resonance region, offers compelling evidence of progressive stiffness degradation in the bridge structure under long-term service conditions [8,62]. Unlike conventional modal tracking methods that focus primarily on the first or second natural frequencies, this study introduces a resonance-region-based framework that captures broader, cumulative changes across multiple frequency bands [16,17]. This holistic approach allows for improved sensitivity to subtle structural deterioration that may not be evident when monitoring isolated modes [14].
The findings of this study partially align with those of [9,20], who monitored ambient vibration frequency shifts in concrete bridges and linked them to global stiffness loss. However, their methodology centered on tracking the first modal frequency [10,18,19], which may overlook localized damage that preferentially influences higher-frequency responses. Refs. [15,27] also noted that noise and boundary condition variability can obscure minor frequency shifts when relying solely on lower modes. In contrast, our resonance-region psd tracking reduces such limitations by aggregating spectral energy over defined bands, enhancing robustness to noise while maintaining sensitivity to damage progression [61,63].
This methodological advancement is particularly evident in the observed disappearance of the third resonance region after prolonged service life [15,16,27]. Such a phenomenon cannot be solely attributed to environmental variability. Instead, it likely reflects nonlinear or localized stiffness degradation, potentially caused by cumulative fatigue, microcracking, or reinforcement corrosion in secondary structural elements [22,32]—phenomena also noted in the conceptual framework proposed by Payawal and Kim [27]. Furthermore, changes in soil–structure interaction, including increased foundation compliance and rotation, can reduce the system’s sensitivity to high-frequency excitation. This is consistent with the findings of [21,34], who emphasized the impact of substructure dynamics on modal behavior. Although sensor limitations can affect high-frequency measurements [64], our experimental protocol employed consistent sensor types, validated stft post-processing, and signal filtering (see Fig. 5) to mitigate this concern.
Notably, the disappearance of resonance bands over time has rarely been documented in long-term psd-based studies. For instance, Refs. [7,65] observed frequency shifts under damage conditions but did not report the loss of entire resonance bands. The uniqueness of our multi-year dataset and the energy-based tracking method allowed us to capture this previously unreported phenomenon, demonstrating the enhanced diagnostic potential of the proposed approach.
Validation of our findings was conducted via finite element modeling (FEM) [9,10,22], with simulations designed to replicate the structural and material characteristics of the monitored bridge spans. Comparisons between simulation-derived modal frequencies and experimental psd peaks showed reasonable alignment, thereby substantiating the observed spectral trends. Similar simulation–measurement comparisons have been applied in previous studies [7,21,34,62], primarily under seismic loading conditions. However, our approach extends this validation to real-world ambient vibration environments, particularly under stochastic vehicular loading, which offers more practical relevance for day-to-day bridge health monitoring [16,62].
Discrepancies between theoretical and measured resonance peaks can be attributed to several factors. First, soil deformability and foundation rotation can introduce compliance not accounted for in rigid-boundary fem models. According to [17,22,64], rotational compliance alters the natural period and damping behavior of bridge structures, especially under dynamic excitation. Second, boundary condition mismatch—common in aging infrastructure due to unknown modifications or deterioration—can affect the accuracy of modal estimates [9,22,34]. Third, environmental effects such as seasonal temperature and humidity fluctuations can transiently alter material stiffness and damping characteristics, though these were not parametrically included in this version of the model [18,62,63].
Collectively, this study advances the field of structural health monitoring by transitioning from traditional single-frequency methods to a more robust, multi-resonance-band tracking framework [19,63]. Additionally, while most shm studies are based on short-term campaigns or artificial excitation, our longitudinal analysis [10,27,32]—spanning multiple years of ambient loading—enables the detection of progressive, nonlinear degradation. This capability is essential for supporting resilience-based design and maintenance strategies for aging infrastructure. Finally, the spectral features derived from our method offer high potential for integration into machine learning algorithms for automated anomaly detection, classification of damage stages, and real-time shm decision support systems.
6 Conclusions, Limitations and Future work
The findings of this research lead to several groundbreaking conclusions:
• In the context of evaluating the operational condition of bridges in Vietnam, bearing capacity testing emerges as a key method due to its ability to provide comprehensive structural assessments. This research introduced an innovative approach by generating random vibration signals across various structures and materials on the Binh Thuan Bridge. By analyzing changes in the characteristics of the power spectrum, the researchers effectively used this approach to assess the load bearing capacity of the bridge spans.
• The power spectral density, derived from actual vibration signals influenced by a randomized traffic load model, illuminates the connection between the frequency of occurrence of harmonics in high-frequency regions and the progressive decrease in stiffness observed in bridge spans over time. However, this process of change is gradual and presents challenges to continuously and accurately monitoring the condition of the bridge over an extended period.
• Based on the significant findings of this study, several future research directions can be proposed to further improve the evaluation and monitoring of bridge structures. First, develop and implement advanced long-term monitoring systems that continuously capture vibration data from bridge spans. These systems should be able to perform real-time analysis to quickly detect any significant changes in structural behavior. Second, use cutting-edge technologies such as machine learning and artificial intelligence to analyze large datasets of vibration signals. These technologies can help predict potential problems and improve the precision of bridge health assessments. Lastly, create predictive models that can simulate the long-term behavior of bridge structures under varying traffic loads and environmental factors. These models should incorporate the power spectral density analysis to forecast potential degradation and the necessary maintenance schedules.
The study is limited to a single bridge site, and resonance shifts are interpreted in the frequency domain only—without detailed damping or modal shape analysis. Environmental effects such as temperature and humidity were monitored but not explicitly modeled. Foundation–soil interaction was discussed qualitatively but not calibrated through site-specific soil testing.
Future research will expand the analysis to multiple bridge types and include coupled modal and damping identification. Additional modeling of soil–structure interaction and incorporation of SHM machine learning algorithms for pattern recognition are planned.
The proposed PSD-based monitoring approach is applicable for real-time SHM systems in aging bridge infrastructure, offering a low-cost, non-destructive tool to detect early signs of deterioration and inform proactive maintenance. It contributes to the broader goal of enhancing structural resilience and service life under real-world operating conditions.
Acknowledgement: We acknowledge Nguyen Tat Thanh University, Ho Chi Minh City, Vietnam for supporting this study. We acknowledge the use of ChatGPT (OpenAI) for language polishing and minor structural editing only; the authors reviewed and take full responsibility for all content.
Funding Statement: This research did not receive any specific grant from funding agencies in the public, commercial, or not-for-profit sectors. All computational resources and research activities were supported independently by the authors.
Author Contributions: Thi Kim Chi Duong: Conceptualization, Methodology, Software, Writing—original draft. Bich-Ngoc. Mach: Formal analysis, Visualization, Validation, Writing—review & editing. Hoa-Cuc. Nguyen: Formal analysis, Visualization, Methodology, Software. Thi Nhu Quynh Trinh: Visualization, Validation, Formal analysis. Thanh Q. Nguyen: Supervision, Project administration, Methodological review, Final approval of the manuscript. All authors reviewed the results and approved the final version of the manuscript.
Availability of Data and Materials: The dataset used and analyzed during the current study is available from the corresponding author upon reasonable request. All preprocessing pipelines and model codes used in this study are available upon request to support reproducibility and further research collaboration.
Ethics Approval: This study does not involve human participants, animals, or identifiable personal data. Therefore, ethical approval was not required. The dataset used consists solely of anonymized environmental sensor measurements collected as part of a smart agriculture pilot initiative, with no human subject involvement.
Conflicts of Interest: The authors declare that they have no known competing financial interests or personal relationships that could have appeared to influence the work reported in this paper.
Symbols and parameters used in the analysis
| Symbols | Parameters |
| AI | Artificial Intelligence |
| NDE | Nondestructive evaluation |
| PSD | Power spectral density |
| STFT | Short-time Fourier transform |
| SENSR | Vibration accelerometer sensors |
| ADC | Analog-to-digital converter |
| CPU | Central processing unit |
References
1. Bui-Ngoc T, Ly D-K, Truong TT, Thongchom C, Nguyen-Thoi T. A deep neural network based surrogate model for damage identification in full-scale structures with incomplete noisy measurements. Front Struct Civil Eng. 2024;18(3):393–410. doi:10.1007/s11709-024-1060-8. [Google Scholar] [CrossRef]
2. Truong TT, Dinh-Cong D, Lee J, Nguyen-Thoi T. An effective deep feedforward neural networks (DFNN) method for damage identification of truss structures using noisy incomplete modal data. J Build Eng. 2020;30(8):101244. doi:10.1016/j.jobe.2020.101244. [Google Scholar] [CrossRef]
3. Huang M, Zhang J, Li J, Deng Z, Luo J. Damage identification of steel bridge based on data augmentation and adaptive optimization neural network. Struct Health Monit. 2025;24(3):1674–99. doi:10.1177/14759217241255042. [Google Scholar] [CrossRef]
4. Mazloom S, Rabbani A, Rahami H, Sa’adati N. A two-stage damage localization and quantification method in trusses using optimization methods and artificial neural network by modal features. Iran J Sci Tech Trans Civil Eng. 2024;49(4):1–18. doi:10.1007/s40996-024-01634-z. [Google Scholar] [CrossRef]
5. Nguyen TQ. Power spectral density of defect beams under a moving load. Iran J Sci Tech Trans Civil Eng. 2022;46(4):3107–18. doi:10.1007/s40996-021-00762-0. [Google Scholar] [CrossRef]
6. Ren Y, Bareille O, Lin Z, Huang X-R. Review of damage detection techniques in vibration-based structural health monitoring. Int J Dyn Control. 2025;13(3):99. doi:10.1007/s40435-024-01578-2. [Google Scholar] [CrossRef]
7. Park S, Chang M, Yazdanpanah O. A conditionmonitoring of steel box girder bridges based on consecutive systemidentification and model updating using a long-term monitoring database. Structures. 2025;80:109779. [Google Scholar]
8. Pirrò M, Gentile C. Vibration-based novelty detection using autoencoders: application to KW51 bridge. Procedia Struct Integr. 2024;64(4):661–8. doi:10.1016/j.prostr.2024.09.324. [Google Scholar] [CrossRef]
9. Cabboi A, Gentile C, Saisi A. Vibration-based SHM of a centenary bridge: a comparative study between two different automated OMA techniques. In: Proceedings of the 9th International Conference on Structural Dynamics (Eurodyn 2014); 2014 Jun 30–Jul 2; Porto, Portugal. p. 1461–8. [Google Scholar]
10. Casas JR, Moughty JJ. Bridge damage detection based on vibration data: past and new developments. Front Built Environ. 2017;3:4. doi:10.3389/fbuil.2017.00004. [Google Scholar] [CrossRef]
11. Peruń G. Advances in non-destructive testing methods. Materials. 2024;17(3):554. [Google Scholar] [PubMed]
12. Abdollahi-Mamoudan F, Ibarra-Castanedo C, Maldague XP. Non-destructive testing and evaluation of hybrid and advanced structures: a comprehensive review of methods. Appl Emer Trends Sen. 2025;25(12):3635. doi:10.3390/s25123635. [Google Scholar] [PubMed] [CrossRef]
13. Nguyen TQ, Nguyen TA, Nguyen TT, Nguyen DN. Damage identification technique for short-span bridges using representative power spectral density (RPSD) and static moment area (SSMa case study of the random vibration signals of 38 bridges under random load. Mech Adv Mater Struct. 2024;31(25):6553–71. doi:10.1080/15376494.2023.2233963. [Google Scholar] [CrossRef]
14. Hou R, Xia Y. Review on the new development of vibration-based damage identification for civil engineering structures: 2010–2019. J Sound Vib. 2021;491(9):115741. doi:10.1016/j.jsv.2020.115741. [Google Scholar] [CrossRef]
15. Rezazadeh N, De Luca A, Perfetto D, Salami MR, Lamanna G. Systematic critical review of structural health monitoring under environmental and operational variability: approaches for baseline compensation, adaptation, and reference-free techniques. Smart Mater Struct. 2025;34(7):073001. doi:10.1088/1361-665x/ade7db. [Google Scholar] [CrossRef]
16. Moravvej M, El-Badry M. Reference-free vibration-based damage identification techniques for bridge structural health monitoring—a critical review and perspective. Sensors. 2024;24(3):876. doi:10.3390/s24030876. [Google Scholar] [PubMed] [CrossRef]
17. Xu B, Casas J, Wu Z. Vibration-based fatigue assessment and damage detection in bridge cables. In: Bridge maintenance, safety, management, digitalization and sustainability. Boca Raton, FL, USA: CRC Press; 2024. p. 2567–75. [Google Scholar]
18. McCullagh J, Galchev T, Peterson R, Gordenker R, Zhang Y, Lynch J, et al. Long-term testing of a vibration harvesting system for the structural health monitoring of bridges. Sen Actuators A Phy. 2014;217:139–50. doi:10.1016/j.sna.2014.07.003. [Google Scholar] [CrossRef]
19. Magalhães F, Cunha Á, Caetano E. Vibration based structural health monitoring of an arch bridge: from automated OMA to damage detection. Mech Syst Signal Process. 2012;28:212–28. doi:10.1016/j.ymssp.2011.06.011. [Google Scholar] [CrossRef]
20. Kazemian A, Yee T, Oguzmert M, Amirgholy M, Yang J, Goff D. A review of bridge scour monitoring techniques and developments in vibration based scour monitoring for bridge foundations. Adv Bridge Eng. 2023;4(1):2. doi:10.1186/s43251-023-00081-6. [Google Scholar] [CrossRef]
21. Kuncham E, Sen S. Fatigue assessment of bridges using interacting filtering approach with sub-structured predictor model based on current health. Struct Health Monit. 2024;14(1):14759217241263838. doi:10.1177/14759217241263838. [Google Scholar] [CrossRef]
22. Cardoni A, Elahi AR, Cimellaro GP. A refined output-only modal identification technique for structural health monitoring of civil infrastructures. Eng Struct. 2025;323(1):119210. doi:10.1016/j.engstruct.2024.119210. [Google Scholar] [CrossRef]
23. Salawu OS, Williams C. Bridge assessment using forced-vibration testing. J Struct Eng. 1995;121(2):161–73. doi:10.1061/(asce)0733-9445(1995)121:2(161). [Google Scholar] [CrossRef]
24. Nguyen TQ, Nguyen TT, Nguyen PT. Innovative techniques in bridge monitoring: application of the circle power spectrum density and appearance frequency of harmonic coefficients. Struct Infrastruct Eng. 2025:1–26. doi:10.1080/15732479.2025.2548843. [Google Scholar] [CrossRef]
25. Vandiver JK. Detection of structural failure on fixed platforms by measurement of dynamic response. In: Offshore Technology Conference. Houston, TX, USA; 1975. OTC-2267-MS p. [Google Scholar]
26. Gara F, Nicoletti V, Carbonari S, Ragni L, Dall’Asta A. Dynamic monitoring of bridges during static load tests: influence of the dynamics of trucks on the modal parameters of the bridge. J Civ Struct Health Monit. 2020;10(2):197–217. doi:10.1007/s13349-019-00376-1. [Google Scholar] [CrossRef]
27. Payawal JMG, Kim D-K. A review on the latest advancements and innovation trends in vibration-based structural health monitoring (SHM) techniques for improved maintenance of steel slit damper (SSD). IEEE Access. 2024;12:44383–400. doi:10.1109/access.2024.3381625. [Google Scholar] [CrossRef]
28. Galvín P, Romero A, Moliner E, Roeck GDe, Martínez-Rodrigo MD. On the dynamic characterisation of railway bridges through experimental testing. Eng Struct. 2021;226(1):111261. doi:10.1016/j.engstruct.2020.111261. [Google Scholar] [CrossRef]
29. Kenley RM, Dodds CJ. West sole WE platform: detection of damage by structural response measurements. In: Offshore Technology Conference. Houston, TX, USA; 1980. OTC-3866-MS p. [Google Scholar]
30. Bozyigit B, Acikgoz S. Determination of free vibration properties of masonry arch bridges using the dynamic stiffness method. Eng Struct. 2022;250(1):113417. doi:10.1016/j.engstruct.2021.113417. [Google Scholar] [CrossRef]
31. Tracy JJ, Pardoen GC. The effect of delamination on the fundamental and higher order buckling loads of laminated beams. J Compos Technol Res. 1989;11(3):87–93. doi:10.1520/ctr10157j. [Google Scholar] [CrossRef]
32. Sun M, Li Q, Huang S. A hybrid output-only scheme for precise modal estimation and uncertainty quantificationof large-scale structure through vibration-based measurements. Structures. 2024;60:105898. [Google Scholar]
33. Zhang B, Tan CA, Liu Z, Hu Z. Nonstationary time-frequency characteristics of vehicle suspension systems based on evolutionary power spectral density. Proc Institut Mech Eng Part D J Autom Eng. 2025;239(5):1630–44. doi:10.1177/09544070231225503. [Google Scholar] [CrossRef]
34. Wang C, Liu J, Zhan J, Zhang F, Wang Y. A rapid evaluation method for the vertical condition of bridge substructures using bayesian system identification and output-only measurements. J Bridge Eng. 2024;29(2):04023110. doi:10.1061/jbenf2.beeng-6387. [Google Scholar] [CrossRef]
35. Man XC, McClure LM, Wang Z, Finch RD, Robin PY, Jansen BH. Slot depth resolution in vibration signature monitoring of beams using frequency shift. J Acoust Soc Am. 1994;95(4):2029–37. doi:10.1121/1.408666. [Google Scholar] [CrossRef]
36. Gandelli E, Rossini G, Mantelli SG, Minelli F. Damage detection of prestressed concrete beams affected by shear and flexure cracks through vibration monitoring. Eng Struct. 2024;304(3):117572. doi:10.1016/j.engstruct.2024.117572. [Google Scholar] [CrossRef]
37. Hassan IU, Panduru K, Walsh J. An in-depth study of vibration sensors for condition monitoring. Sensors. 2024;24(3):740. doi:10.3390/s24030740. [Google Scholar] [PubMed] [CrossRef]
38. Choy F, Liang R, Xu P. Fault identification of beams on elastic foundation. Comput Geotech. 1995;17(2):157–76. doi:10.1016/0266-352x(95)93867-i. [Google Scholar] [CrossRef]
39. Yao Y, Ma Z-S, Ding Q, Han J, Sui X, Liu B. Stiffness identification of beam structures with elastic foundations through the global mode method and time-domain nonlinear subspace method. Nonlinear Dyn. 2025;113(5):4447–64. doi:10.1007/s11071-024-10078-z. [Google Scholar] [CrossRef]
40. Xie K, Xue N, Ma W, Wang Q. Equivalence of a beam on elastic foundation and a beam on elastic supports with transfer matrix method. J Vib Eng Technol. 2024;12(7):8021–42. [Google Scholar]
41. Hearn G, Testa RB. Modal analysis for damage detection in structures. J Struct Eng. 1991;117(10):3042–63. doi:10.1061/(asce)0733-9445(1991)117:10(3042). [Google Scholar] [CrossRef]
42. Zar A, Hussain Z, Akbar M, Rabczuk T, Lin Z, Li S, et al. Towards vibration-based damage detection of civil engineering structures: overview, challenges, and future prospects. Int J Mech Mater Des. 2024;20(3):591–662. doi:10.1007/s10999-023-09692-3. [Google Scholar] [CrossRef]
43. Bhatta S, Dang J. Multiclass seismic damage detection of buildings using quantum convolutional neural network. Comput Aided Civ Infrastruct Eng. 2024;39(3):406–23. doi:10.1111/mice.13084. [Google Scholar] [CrossRef]
44. Azad MM, Cheon Y, Raouf I, Khalid S, Kim HS. Intelligent computational methods for damage detection of laminated composite structures for mobility applications: a comprehensive review. Arch Comput Methods Eng. 2025;32(1):441–69. doi:10.1007/s11831-024-10146-y. [Google Scholar] [CrossRef]
45. Sanders D, Kim Y, Stubbs N. Nondestructive evaluation of damage in composite structures using modal parameters. Exp Mech. 1992;32(3):240–51. doi:10.1007/bf02319362. [Google Scholar] [CrossRef]
46. Kiasat S. Novel approach to damage detection in laminated structures: modal damping as a damage indicator. Mat Res Proc. 2024;42. doi:10.21741/9781644903193-8. [Google Scholar] [CrossRef]
47. Sahu S, Das P. Experimental and numerical studies on vibration of laminated composite beam with transverse multiple cracks. Mech Syst Signal Process. 2020;135(5):106398. doi:10.1016/j.ymssp.2019.106398. [Google Scholar] [CrossRef]
48. Neamah RA, Al-Raheem SK, Njim EK, Abboud Z, Al-Ansari LS. Experimental and numerical investigation of the natural frequency for the intact and cracked laminated composite beam. J Aerosp Technol Manag. 2024;16(4):e1724. doi:10.1590/jatm.v16.1337. [Google Scholar] [CrossRef]
49. Mohanty AP, Das P, Choudhury S, Sahu SK. Free vibration behaviour of laminated composite beam under crack effects: a combined numerical and experimental approach. Annales De Chimie Science Des Matériaux. 2024;48(4):447–55. [Google Scholar]
50. Gillich G-R, Maia NM, Wahab MA, Tufisi C, Korka Z-I, Gillich N, et al. Damage detection on a beam with multiple cracks: a simplified method based on relative frequency shifts. Sensors. 2021;21(15):5215. doi:10.3390/s21155215. [Google Scholar] [PubMed] [CrossRef]
51. Zhang L, Liao W, Fan J. A novel surrogate-based crack identification method for cantilever beam based on the change of natural frequencies. Comput Struct. 2024;292:107243. doi:10.1016/j.compstruc.2023.107243. [Google Scholar] [CrossRef]
52. Xu G, Guo T, Li A, Zhang H, Wang K, Xu J, et al. Seismic resilience enhancement for building structures: acomprehensive review and outlook. Structures. 2024;59:105738. [Google Scholar]
53. Mata R, Nuñez E, Forcellini D. Seismic resilience of composite moment frames buildings with slender built-up columns. J Build Eng. 2025;111(1):113532. doi:10.1016/j.jobe.2025.113532. [Google Scholar] [CrossRef]
54. Nguyen TQ, Nguyen HB. Structural health monitoring of bridge spans using moment cumulative functions of power spectral density (MCF-PSD) and deep learning. Bridge Struct. 2021;17(1–2):15–39. doi:10.3233/brs-210183. [Google Scholar] [CrossRef]
55. Rodet J, Tauzin B, Amin Panah M, Guéguen P, Nziengui Bâ D, Coutant O, et al. Urban dark fiber distributed acoustic sensing for bridge monitoring. Struct Health Monit. 2025;24(1):636–53. doi:10.1177/14759217241231995. [Google Scholar] [CrossRef]
56. Nguyen TQ, Nguyen TA, Nguyen TT. Structural monitoring of a defective steel beam model based on image changes in power spectral density. Int J Steel Struct. 2022;22(4):1147–74. doi:10.1007/s13296-022-00627-w. [Google Scholar] [CrossRef]
57. Nguyen TQ. A data-driven approach to structural health monitoring of bridge structures based on the discrete model and FFT-deep learning. J Vib Eng Technol. 2021;9(8):1959–81. doi:10.1007/s42417-021-00343-5. [Google Scholar] [CrossRef]
58. Nguyen TQ, Nguyen TA, Nguyen TT. Structural health monitoring based on the cumulative function and cumulative circle of a defective beam under a moving load. J Low Freq Noise, Vib Active Control. 2023;42(2):729–45. doi:10.1177/14613484221148048. [Google Scholar] [CrossRef]
59. Nguyen TQ, Nguyen TA, Nguyen TT. PSD characteristics for the random vibration signals used in bridge structural health monitoring in Vietnam based on a multi-sensor system. Int J Distrib Sens Netw. 2022;18(9):15501329221125110. doi:10.1177/15501329221125110. [Google Scholar] [CrossRef]
60. Nguyen TQ, Nguyen DP, Nguyen PT, Nguyen TT. Enhanced structural damage detection through combined MODWT and FFT for power spectral density separation in beam vibration analysis. J Low Freq Noise Vib Active Control. 2025;44(3):14613484251320234. doi:10.1177/14613484251320234. [Google Scholar] [CrossRef]
61. Karbhari V, Lee LS-W. Vibration-based damage detection techniques for structural health monitoring of civil infrastructure systems. In: Structural health monitoring of civil infrastructure systems. Cambridge, UK: Woodhead Publishing; 2009. p. 177–212. doi:10.1533/9781845696825.1.177. [Google Scholar] [CrossRef]
62. Okur FY, Altunişik AC, Kalkan Okur E, Pozo F. A Novel approach for anomaly detection in vibration-based structural health monitoring using autoencoders in deep learning. Struct Control Health Monit. 2025;2025(1):5602604. doi:10.1155/stc/5602604. [Google Scholar] [CrossRef]
63. Anastasopoulos D, Reynders EP. Dynamic strain-based monitoring of a historical Vierendeel truss bridge under changing environmental and support conditions. J Civ Struct Health Monit. 2024;15(5):1–28. doi:10.1007/s13349-024-00888-5. [Google Scholar] [CrossRef]
64. Jeyamohan K, Chan TH, Nguyen K-D, Thambiratnam DP, Zhu X. Internal force identification in prestressed concrete bridges via lagrangian interpolation and substructural modeling technique. Int J Struct Stab Dyn. 2025:2640002. doi:10.1142/s021945542640002x. [Google Scholar] [CrossRef]
65. Jeyamohan K, Chan TH, Nguyen KD, Thambiratnam DP. Prestress force and moving force identification in prestressed concrete bridges via Lagrangian polynomial-based load shape function approach. J Civ Struct Health Monit. 2025;15(2):575–96. doi:10.1007/s13349-024-00822-9. [Google Scholar] [CrossRef]
Cite This Article
 Copyright © 2026 The Author(s). Published by Tech Science Press.
This work is licensed under a Creative Commons Attribution 4.0 International License , which permits unrestricted use, distribution, and reproduction in any medium, provided the original work is properly cited.
 Downloads
 Citation Tools