
 Submit a Paper
 Propose a Special lssue
 Open Access
ARTICLE

H/V Spectral Ratio Reveals Seismic Response of Base-Isolated Large-Span High-Rise in Beijing
1 Beijing Geolight Technology Co., Ltd., Beijing, 102628, China
2 Key Laboratory of Optoelectronic Technology and Systems (Ministry of Education of China), College of Optoelectronic Engineering, Chongqing University, Chongqing, 400044, China
3 Beijing Construction Project Management General Headquarters, Capital Airports Holdings Co., Ltd., Beijing, 102604, China
* Corresponding Author: Zhangdi Xie. Email:
(This article belongs to the Special Issue: Advanced Strategies for Structural and Non-Structural Seismic Protection and Damage Prediction in Reinforced Concrete Structures)
Structural Durability & Health Monitoring 2026, 20(1), . https://doi.org/10.32604/sdhm.2025.070531
Received 18 July 2025; Accepted 26 September 2025; Issue published 08 January 2026
 View Full Text
 Download PDF
Abstract
This study employed tri-component continuous monitoring data from 10 measurement points on both sides of a base isolation layer in the basement of a large-span high-rise building in Beijing, as well as from a free-field station and roof frame, during a Mw 5.5 magnitude earthquake in Pingyuan, Shandong, in 2023. The H/V spectral ratio method was used to evaluate the structural dynamic response characteristics of the building and analyze the regulatory effect of the base-isolation layer on seismic waves. The results indicate that during the earthquake, the peak frequency of the free-field and the measurement points below the base-isolation layer was stable at 0.17 Hz, whereas the main frequency of the measurement points above the base-isolation layer increased to 0.75–1.18 Hz, which is 4–6 times greater than that of the points below. The amplitude was suppressed by more than 70%, confirming that the base isolation layer effectively isolated the low-frequency energy from the ground and increased the response frequency of the building. When the building was excited by an earthquake, a three-tier frequency gradient was formed throughout the building: “base-isolation layer (0.17 Hz)-main body (1.18 Hz)-roof frame (3.83 Hz)”, which can effectively avoid resonance of the entire building. In addition, the composite base-isolation device changed the dynamic characteristics of the structure. The resonance period was extended from 0.74 s (theoretical value without base isolation) to 5.9 s (calculated value), and the resonance frequency was reduced from 1.35 to 0.17 Hz. This finding indicates that the base-isolation layer can enhance seismic performance by increasing flexibility and damping.Keywords
The core objective of earthquake engineering is to increase the seismic safety of building structures through scientific analysis methods. The response spectrum method (RSM) is widely used in engineering scenarios such as single-story frames and truss bridges because of its computational efficiency and ability to accurately characterize structural responses in the elastic stage [1]. With the increasing seismic resistance requirements of engineering, the RSM, which is based on the assumption of linear elasticity, cannot effectively handle the nonlinear response after the structure enters the elastoplastic stage [2], and the calculation error increases in nonclassical damping systems. Therefore, the time-history analysis method is introduced as a supplementary means for complex structural analysis and can be used for the supplementary calculation of multistory steel frames [3]. Owing to the uncertainty of seismic-motion input data, site parameters and seismic-wave propagation characteristics, different types of buildings need to be analyzed by corresponding methods. Taking a high-rise large-span building in Beijing as an example, the building is equipped with 1376 sets of composite base isolation devices (including rubber bearings, sliding bearings and viscous dampers), which need to meet the requirements of seismic resistance and vibration reduction and noise reduction at the same time. Given this background, the spectral ratio method, with its unique theoretical and analytical advantages, has gradually become an important research method in the analysis of complex structures.
The theory of the spectral ratio method begins with the sedimentary layer–bedrock spectral ratio model proposed by Borcherdt [4]. Nakamura [5] confirmed through underground microseismic experiments that the horizontal/vertical spectral ratio of bedrock is equivalent to the vertical component spectral ratio of sedimentary layers and thus developed the H/V spectral ratio method (HVSR: horizontal-to-vertical spectral ratio) without bedrock reference. On the basis of the assumption that the microtremor wavefield is approximately isotropic and that the site is horizontally layered with homogeneous media, the site is considered to exhibit a linear response under microtremor excitation, with the spectral-ratio peak predominantly governed by the fundamental resonance mode. Consequently, this method can be used to analyze the resonant frequency of plain seismic noise [6], establish a relationship between shear wave velocity and sediment thickness and resonant frequency [7], and evaluate the site amplification effect [8]. Compared with other methods for assessing building safety, the H/V spectral-ratio technique offers the advantages of simple data acquisition and rapid processing, and has become a primary means for quickly evaluating site effects and retrieving shallow subsurface structures [9–11]. For example, Kanamori et al. [12] used the spectral ratio method to reveal the structural response characteristics under special vibration sources such as spacecraft launches; Satake and Yokota [13] determined the feasibility of complex structural analysis through steel–structure buildings; Mucciarelli et al. [14] clarified the mechanism of the impact of ambient noise on seismic–wave propagation; Michel et al. [15] used this method to obtain key dynamic parameters of high-rise buildings, such as the structural natural frequency and vibration mode. Gamal [16] inverted the natural frequencies of buildings via microtremor data, an approach well-suited for assessing the seismic hazard of high-rise structures [17,18] and for analyzing the predominant frequencies and resonance hazard of bridges [19–21]. In recent years, the H/V spectral-ratio method has been widely applied to studies on sediment thickness and site effects [22–24], shallow velocity structures [25–28], and shear-wave velocity analysis [29,30].
To investigate the vibration characteristics of long-span high-rise buildings under seismic conditions and analyze the internal changes that occur within such structures during earthquakes, on the basis of the abovementioned theories, the H/V spectral ratio method was applied in this study to analyze the structural response of a high-rise, large-span building in Beijing. In view of the complex dynamic characteristics of its base-isolation layer, the monitoring data from both sides of the base-isolation layer, which included seismic records, were obtained through the existing monitoring system of the building. By calculating the H/V curves for different time periods, the natural frequencies of the site and the building were analyzed. The transfer functions of the building and the site were constructed, and the regulatory roles of the building structure and the base isolation layer under seismic excitation were analyzed.
2.1 Monitoring System and Data
The target building is located in Beijing, the capital of China, and is currently the world’s largest seismically isolated single-structure building. Its main body comprises a central core and five finger-like concourses. The central core employs a monolithic cast-in-place concrete slab with a projected area of 565 m × 437 m. Owing to its immense scale; the structure is highly sensitive to temperature variations and must also address vibrations and noise induced by nearby high-speed rail lines and subway operations. The core area of the basement of the target building is equipped with a comprehensive base isolation layer, which includes base isolation devices comprising 1124 rubber isolation bearings, 108 elastic sliding bearings, and 144 viscous dampers. These components work together to enhance the seismic performance and reduce vibration transmission. The main body of the building is monitored through a dual monitoring system for vibration and displacement to ensure the normal operation of the base-isolation devices and to analyze and assess their base-isolation effectiveness. The former uses strong-motion accelerometers to collect the structural acceleration response in real time, analyze time-frequency parameters such as frequency and amplitude, and trigger abnormal alarms. The latter monitors the displacement changes of the base-isolation layer under normal operation and seismic conditions through displacement meters, providing data support for structural condition assessment. In addition to recording background noise interference, the monitoring system of the target building has successfully recorded a series of recent minor earthquakes, such as 2.6-magnitude earthquakes in Langfang, Hebei, in 2023; 5.5-magnitude earthquakes in Pingyuan, Shandong, in 2023; and 3.4-magnitude earthquakes in Renqiu, Hebei, in 2025. To explore the dynamic response characteristics of a building under seismic action, tri-component continuous monitoring data were obtained from 10 measurement points on both sides of the base—the isolation layer in the basement, one free-field measurement point, and four measurement points on the roof frame—for analysis. The ten measuring points on both sides of the isolation layer are shown in Fig. 1. Among them, DX03, DX05, D09, DX11, and DX13 are located below the isolation layer, whereas DX04, DX06, DX10, DX12, and DX14 are positioned at the same horizontal coordinates but above the isolation layer. All the points are equipped with a GL-PA4 triaxial digital strong-motion accelerometer, and the sampling rate is 100 Hz.
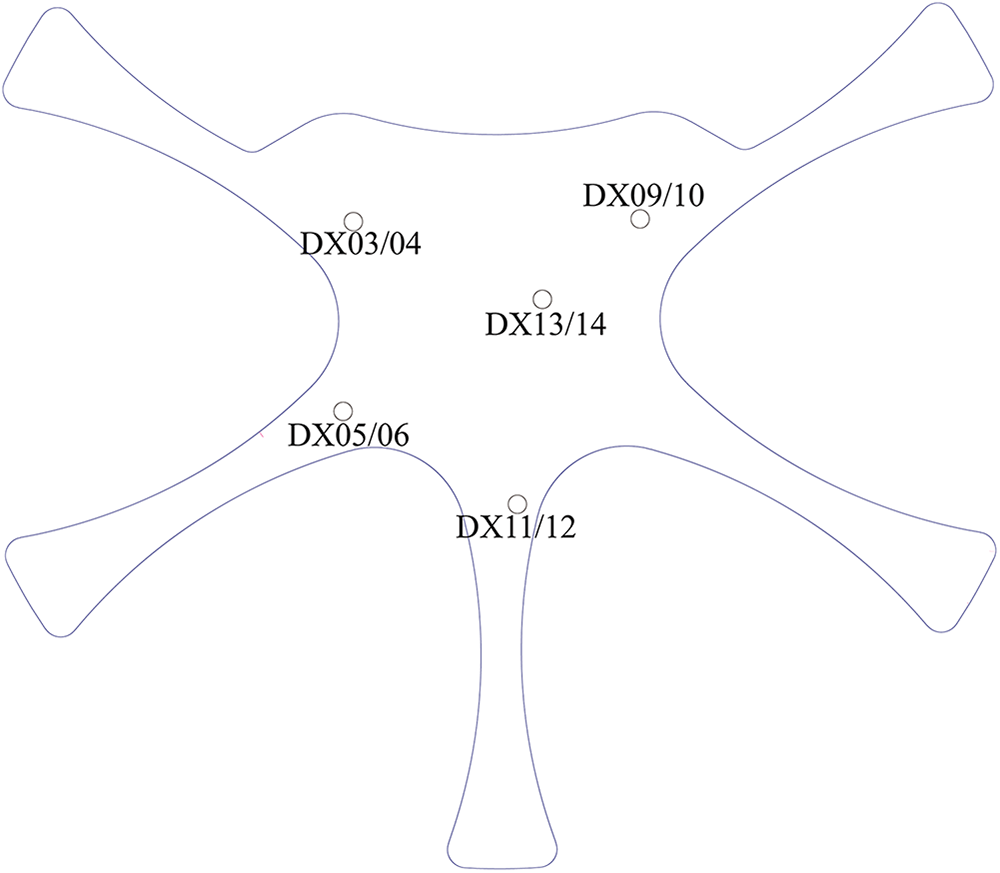
Figure 1: Locations of monitoring points on the subsurface side of the building. DX03, DX05, DX09, DX11, and DX13 are located beneath the isolation layer; DX04, DX06, DX10, DX12, and DX14 are horizontally aligned with the lower points but situated above the isolation layer. The blue outlines indicate the building frame
Since the 5.5-magnitude earthquake in Pingyuan, Shandong, had a relatively large magnitude and the seismic wave characteristics were relatively clear when they propagated to the main body of the building, continuous waveform data with a duration of 3600 s starting at 2:00 on 6 August 2023, were selected during the data collection process. These data not only include background noise records from 1800 s before the earthquake but also complete records of the 5.5-magnitude earthquake in Pingyuan, Shandong, on 6 August 2023. This approach helps to explore the regulatory role of base isolation devices under both seismic and nonseismic conditions, understand the deformation characteristics and energy dissipation situation of the base isolation layer during an earthquake, and thus evaluate its working performance. Through the study of data from different measurement points, the vibration response law of the terminal building structure under seismic action can be analyzed in detail, which is conducive to identifying weak parts and provides a basis for structural reinforcement and optimization of the base-isolation device performance.
The H/V spectral ratio method [31] assumes that the vertical component mainly reflects incident waves from bedrock, whereas the horizontal component contains multiple reflections and resonance amplification effects of the sedimentary layers. This method evolved from the method of identifying seismic phases via the ratio of the horizontal to vertical components of seismic records. Its mathematical principle is based on the statistical characteristics of seismic wave fields and the relationships among site frequency responses [5]. The calculation method is as follows: For three-component seismic records, let the horizontal component time series signal be
where
After the seismic signal is truncated within the S-wave window, performing the Fourier transform directly without processing the ends will produce sidelobe effects that interfere with spectral analysis. Therefore, before conducting the Fourier transform on the data, it is necessary to apply a Tukey window (also known as a cosine-squared window or tapered cosine window) to reduce spectral leakage. The Tukey window constructs a gradual weighting at both ends of the data, allowing the data to smoothly transition to zero at the truncation points. This effectively suppresses the sidelobe effects and improves the spectral quality. The Tukey window function is defined in the time domain as:
where
Since the original seismic ground–motion spectrum often contains noise and fluctuations that interfere with the dynamic characteristics of the site, to effectively retain important frequencies, reduce the interference of noise and fluctuations, and accurately display the frequency characteristics of the signal, the Konno–Ohmachi smoothing operator [32] is used for smoothing. The frequency-smoothing operator is applied to the PSD as follows:
where
In seismic monitoring and site-response studies, the accuracy of HVSR calculations is affected by various parameters, among which the window-length parameter is particularly critical. To analyze the effect of window length on the HVSR, this paper tests different time window lengths (30–330 s, with an interval of 30 s). When the window length is 120, 150, or 180 s, the resonant frequency recorded at all stations is 0.17 Hz. For window lengths of 30, 60, and 90 s, some stations exhibit resonant frequencies of 0.15 or 0.18 Hz, whereas the remaining stations still have a frequency of 0.17 Hz. When the window length exceeds 180 s, the H/V curves are essentially identical, and only a few stations display a resonant frequency of 0.18 Hz. Therefore, the results show that the window length has a relatively small influence on the resonance frequency, which is essentially concentrated between 0.15 and 0.18 Hz. However, longer window lengths (above 90 s) may increase the stability of the resonance frequency. The peak amplitude shows some fluctuations with increasing window length. Shorter window lengths (e.g., 30 s) may lead to lower amplitudes, whereas longer window lengths (above 180 s) may cause higher amplitudes. Since the waveform contains the 5.5-magnitude earthquake in Pingyuan, Shandong, in 2023, which lasted for approximately 60 s, to record this earthquake signal fully and consider the stability of the resonance frequency and the magnitude of the peak amplitude, a time window of 180 s was finally selected. During the calculation process, to avoid oversmoothing that may lead to information loss, the Tukey window function (
3.1 Measurement Points below the Base Isolation Layer
On the basis of the calculation methods and parameters described above, the HVSR values for the five measurement points below the base isolation layer in the basement of the target building (DX03, DX05, DX09, DX11, and DX13) and the free-field measurement point (DX35) were obtained (Fig. 2). The results indicate that during the seismic event, the average peak frequency of all the measurement points was stable at 0.17 Hz (5.9 s) (Fig. 2a), which is close to the peak frequency calculated by Peng et al. [33] via a dense array in the Sanhe–Pinggu area. This reveals the significant low-frequency response characteristics of the site. The measurement points below the base-isolation layer exhibited lower frequencies and amplitude suppression due to the coupling effect between the building foundation and the subsoil, whereas the free-field measurement point DX35 had a prominent low-frequency response with an amplitude reaching 2.8.
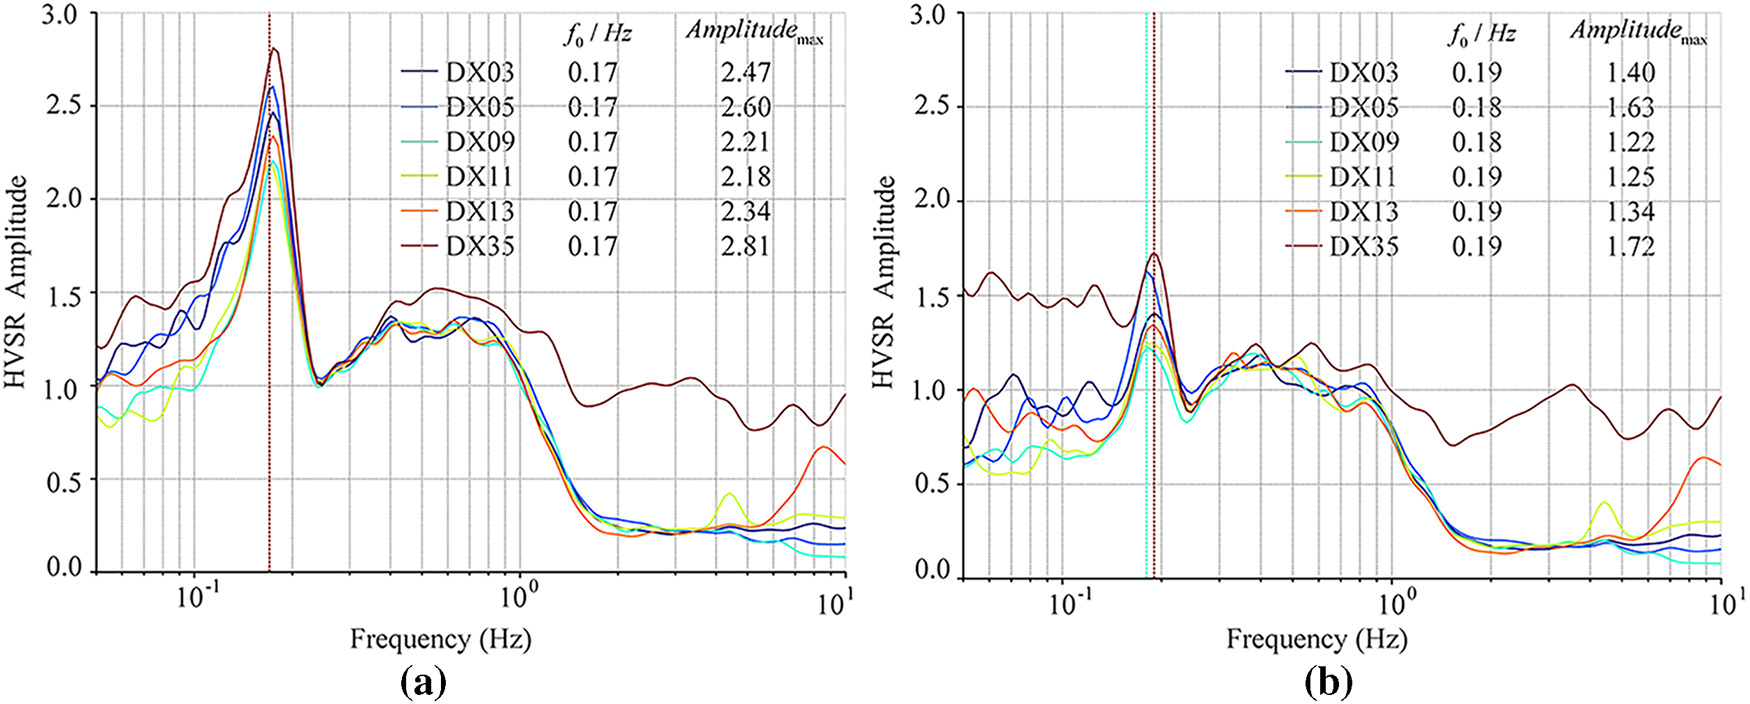
Figure 2: HVSR values of the measuring points below the isolation layer and at the free-field measuring points; (a,b) HVSR results with and without seismic records, respectively; DX03, DX05, DX09, DX11, and DX13 are measurement points below the isolation layer; DX35 is the free-field measurement point; and
Further comparison with the HVSR results during nonseismic periods (Fig. 2b) revealed significant differences in dynamic characteristics when excited by the earthquake: the frequency of the measurement points below the base-isolation layer systematically shifted upward (0.18–0.19 Hz) during nonseismic times, with reduced amplitudes (Fig. 2b). Free-field measurement point DX35 had a frequency increase to 0.19 Hz and an amplitude decrease to 1.7 during nonseismic times, indicating that the earthquake can excite low-frequency vibrations and that the 5.5-magnitude earthquake in Pingyuan, Shandong, amplified the low-frequency energy of the free field (Fig. 2a). In summary, the input of seismic motion caused a shift in frequency toward lower frequencies. The measurement points below the base–isolation layer were modulated by foundation–soil interactions, and the increase in amplitude during the earthquake was limited to approximately 1.7 times.
When there is a large impedance contrast (>2.5) between the surface loose layer (sedimentary layer) and the underlying hard layer (bedrock layer), the HVSR curve will peak [34,35]. The peak frequency corresponds to the resonant frequency of the sedimentary layer (also known as the dominant frequency) [36]. This frequency can be used to obtain the thickness of the sedimentary layer, determine the site type, identify the rock type of the site, and determine the range of shear wave velocity [37]. Additionally, the amplitude of the peak can serve as a lower limit for the site amplification factor [38].
The Daxing International Airport and its surrounding areas are located at the forefront of the Yongding River alluvial fan. The empirical relationships among the HVSR peak frequency
On the basis of the borehole data, the shear wave velocity
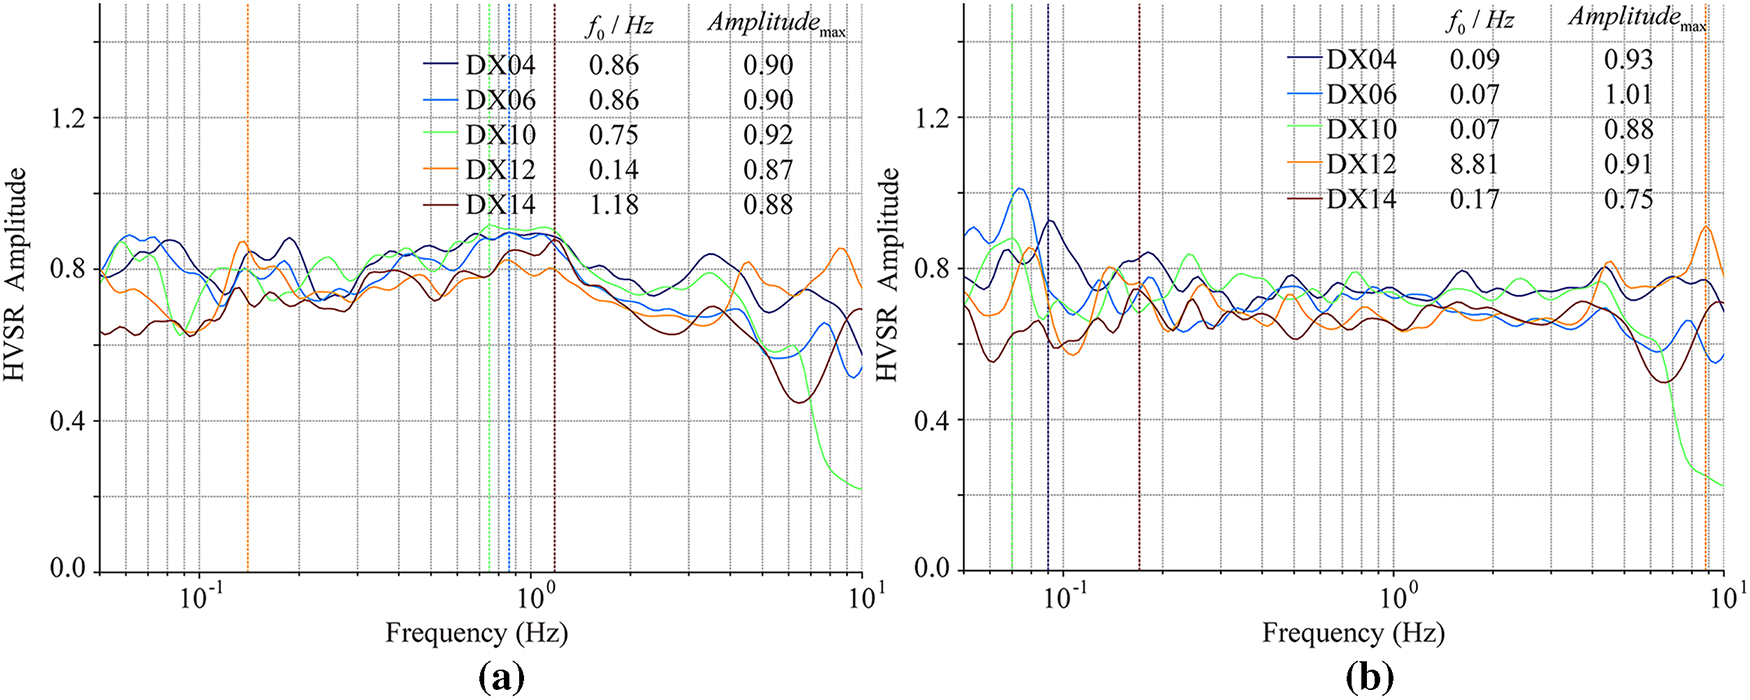
Figure 3: HVSR values of the measuring points above the isolation layer; (a,b) present the HVSR results with and without seismic records, respectively; DX04, DX06, DX10, DX12, and DX14 are measurement points above the isolation layer;
3.2 Measurement Points above the Base Isolation Layer
The base-isolation layer, as a key structure for building seismic resistance, supports the main body of the building above it. Its vibration response not only reflects the effectiveness of the base isolation layer but is also related to the safety of the equipment and personnel inside the building. To analyze the working mechanism of the base-isolation layer, the HVSR was calculated for the measurement points above the base-isolation layer (DX04, DX06, DX10, DX12, and DX14) corresponding to the points below the base-isolation layer (DX03, DX05, DX09, DX11, and DX13). Data analysis of the HVSR from the corresponding measurement points on both sides of the base-isolation layer helps to study the regulation of seismic-wave propagation, vibration frequency, and amplitude by the base-isolation layer, thereby understanding its actual role in the entire building seismic-resistance system.
A comparison of the HVSR values calculated from the measurement points above the base-isolation layer (Fig. 3) with those from the corresponding points below the base-isolation layer (Fig. 2) during the seismic event reveals that the main frequency of the points below the base-isolation layer (DX03, DX05, etc.) is stable at 0.17 Hz (period 5.9 s) (Fig. 2a), whereas the main frequency of the points above the base-isolation layer (Fig. 3a) significantly shifts to 0.75–1.18 Hz, with an amplitude maintained at 0.88–0.92. This indicates that the base-isolation layer increases the building response frequency by approximately 5 times and suppresses more than 70% of the amplitude growth, effectively isolating the low-frequency energy from the site.
During the nonseismic state (Fig. 2b), the frequency of 0.18 Hz below the base-isolation layer and the ultralow frequency (0.07–0.09 Hz) of the points above the base-isolation layer (Fig. 3b) form a frequency difference of 10 times. Seismic-motion input reduces the frequency difference between the two sides of the base-isolation layer to 6 times (1.18 and 0.17 Hz). In the 5.5-magnitude earthquake in Pingyuan, Shandong, the HVSR amplitude above the base–isolation layer was approximately 70% smaller than that of the points below, and the peak frequency shifted from 0.17 Hz (below) to 0.75–1.18 Hz (above). This effectively isolates seismic motion and avoids resonance, verifying the effectiveness of the base-isolation system’s frequency-avoidance mechanism. However, base isolation devices have insufficient high-frequency filtering efficiency above 10 Hz, and the dynamic parameters of the bearings need to be optimized through time‐frequency analysis. Owing to the isolation layer, in addition to the intense vibrational response during earthquakes, high-frequency pulses closely related to the building’s own dynamic characteristics or to the surrounding environment (e.g., traffic, mechanical equipment) are also observed. For example, station DX12 exhibits an anomalous high-frequency peak at 8.81 Hz in the absence of seismicity (Fig. 3b), likely arising from the interaction between ambient vibrations and the building’s localized dynamic response.
The seismic performance evaluation of a building as a whole requires a comprehensive analysis of all key parts. Michel et al. [15] reported significant differences in the H/V spectral ratios of different floors when analyzing the dynamic parameters of high-rise buildings through ambient vibration data. The identification of higher-order vibration modes depends on the height distribution of the monitoring points. Satake and Yokota [13] discovered in vibration tests of steel-structured buildings that the frequency response of the top floor measurement points contains more high-frequency components, which contrasts with the fundamental frequency results of the bottom floor measurement points. Gallipoli et al. [42] noted that soil–structure interactions can cause frequency shifts in measurement points at different heights.
The roof frame, as the topmost part of the building structure, reflects not only the final effect of seismic wave propagation through the lower structure during an earthquake but also the overall stability of the building. From the base-isolation layer to the roof frame, the path of seismic-wave propagation lengthens, energy is gradually dissipated and transformed, and the structural form and mechanical properties change significantly. Therefore, to construct a complete building seismic dynamic response model and gain a deep understanding of the impact of earthquakes on buildings, four measurement points on the roof frame were selected for HVSR analysis.
On the basis of the HVSR results from the measurement points below the base-isolation layer (Fig. 2), above the base-isolation layer (Fig. 3), and within the roof frame (Fig. 4), the overall dynamic performance of the building clearly exhibited a significant spatial gradient characteristic: during the earthquake, the building structure formed a three-tier frequency gradient of “base-isolation layer (0.17 Hz)-main body (1.18 Hz)-roof frame (3.70 Hz)”. The frequency of measurement points at different heights gradually shifts [42], with each segment having a frequency difference of more than three times, effectively avoiding resonance coupling. Under non-seismic state, the main frequency of 0.18 Hz below the base-isolation layer is transmitted through the building structure to the roof, where the main frequency of the truss measurement points increases to 0.83–4.25 Hz, creating a frequency amplification effect of approximately 5–20 times. This confirms that the structural stiffness increases progressively along the vertical direction [23].
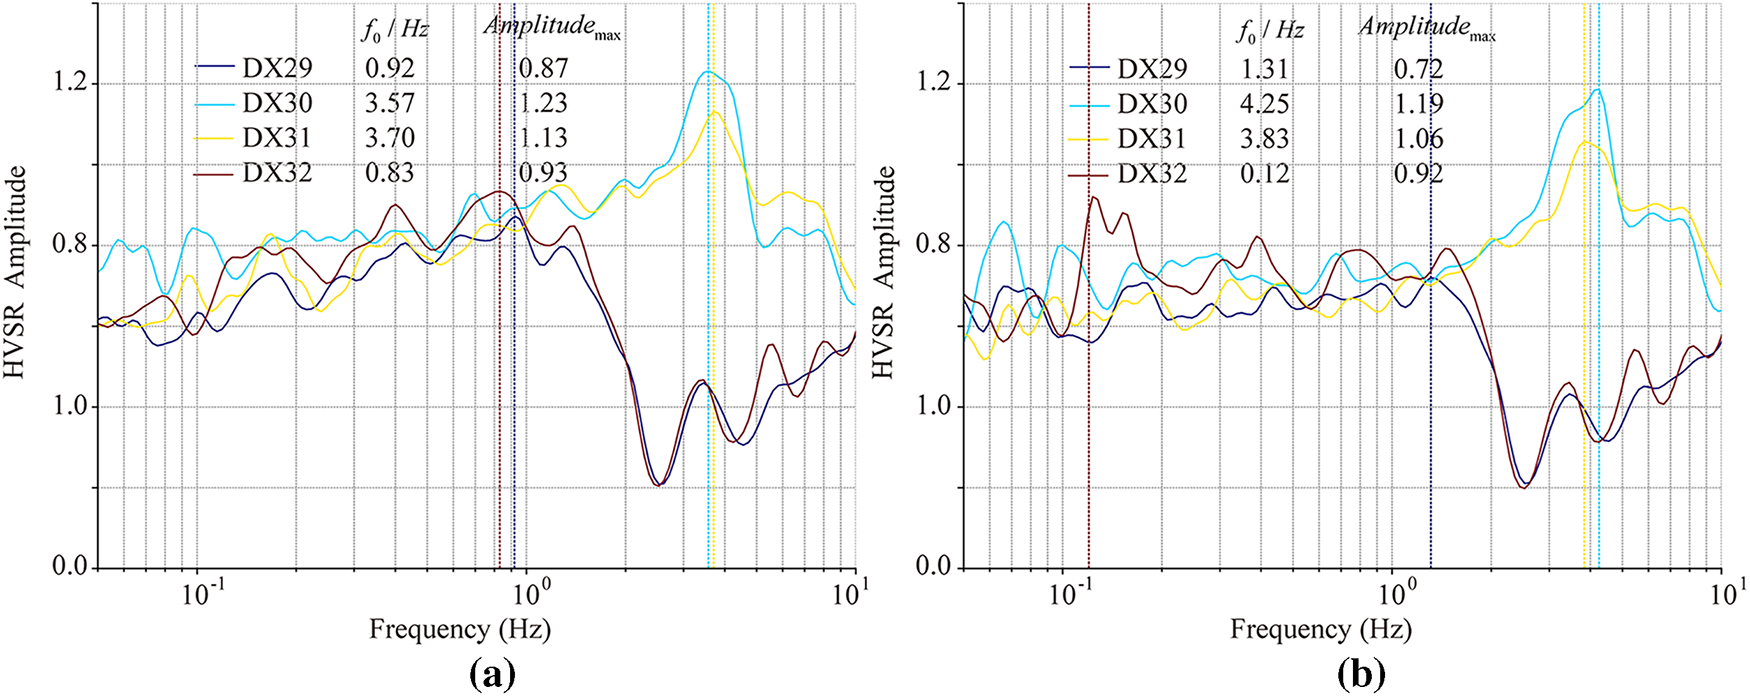
Figure 4: The calculated HVSR results of the measuring points of the roof frame; (a,b) present the HVSR results with and without seismic records, respectively; DX29, DX30, DX31, and DX32 are measurement points on the roof frame;
During the earthquake, roof frame measurement points DX30 and DX31 exhibited prominent high-frequency responses (3.57–3.70 Hz) with amplitudes ranging from 1.23–1.13. Compared with the nonseismic period (Fig. 4b), the amplitude increase is ≤4%, indicating that the local stiffness of the truss is relatively high and that the transmission of seismic energy is limited. In contrast, the main frequencies of measurement points DX29 and DX32 shift from 1.31/0.12 Hz during the nonseismic period (Fig. 3b) to 0.92/0.83 Hz during the earthquake (Fig. 3a), reflecting the partial filtering effect of the base-isolation system on vibrations above 1 Hz.
3.3 Dynamic Characteristics of the Structure
To further analyze the role of the base-isolation layer in the entire seismic-resistance system of a building structure, as well as its mechanism for transmitting and regulating seismic waves, comparing the HVSR values on both sides of the base-isolation layer is a key research direction. By analyzing these two sets of HVSR values, one can intuitively observe the regulation of key parameters such as the frequency and amplitude of seismic waves by the base-isolation layer. Here, the HVSR transfer function of the base-isolation layer is defined as the ratio
where
On the basis of the analysis of the HVSR ratio between the measurement points on both sides of the base-isolation layer during the earthquake (Fig. 5a), the data exhibit a typical three-segment energy-transfer pattern in the frequency-domain space. In the low-frequency band (<1.0 Hz), the basic filtering effect dominates, and the ratio is stable at approximately 0.8. In the middle-frequency band (1.0–2.0 Hz), the ratio increases exponentially, corresponding to the structural resonance zone. The multiple-frequency relationship between the building’s natural frequency (0.75–1.18 Hz) and the site’s dominant frequency (0.17 Hz) induces energy amplification, with the maximum increase reaching 3.2 times. In the high-frequency band (2–10 Hz), the material dissipation mechanism gradually takes the lead, with an amplitude oscillation attenuation ranging from 0.5–1.2.
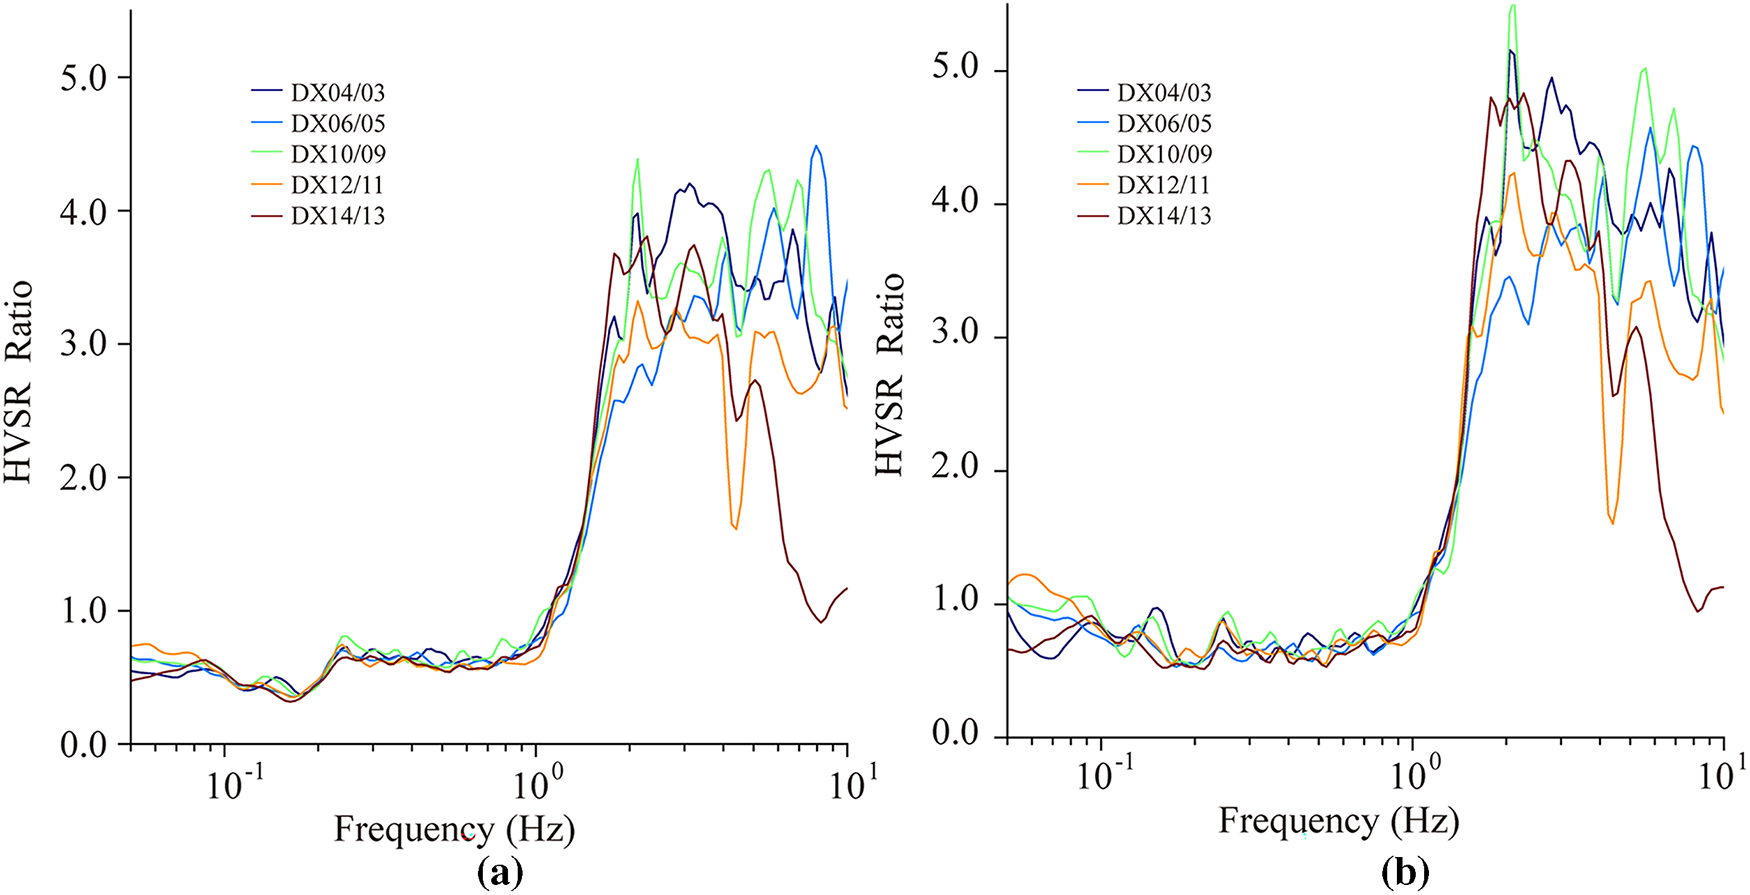
Figure 5: HVSR ratios of the corresponding measuring points on both sides of the isolation layer; (a,b) present the HVSR results with and without seismic records, respectively; Ratio of the HVSR at measurement points above the isolation layer to the HVSR at measurement points below the isolation layer
The input under non-seismic state strengthens the abovementioned characteristics (Fig. 5b). In the low-frequency band (with a ratio of approximately 0.8), the frequency stability of the basic filtering effect is relatively high. In the high-frequency band (>2.0 Hz), the peak ratio increases from 4.0 to 5.0, revealing the dynamic softening characteristics of the base-isolation material under high-strain-rate conditions. In the middle-frequency band (1.0–2.0 Hz), the exponential growth slope increases from 1.2 to 1.5. This model reveals the dynamic response process of the base-isolation system.
In the dynamics of building structures, there is a specific relationship between the height of reinforced concrete buildings and their resonant periods. According to the empirical formula for the height-resonant period of reinforced concrete buildings proposed by:
Given the parameters
After performing HVSR calculations on the building’s monitoring data, the peak frequency below the base-isolation layer under non-seismic state was found to be approximately 0.18 Hz (Fig. 2b), and the peak frequency of the measurement points above the base-isolation layer was approximately 0.07–0.17 Hz (Fig. 3b). These measured frequency values are significantly lower than the 1.35 Hz calculated via the empirical formula. These findings demonstrate that composite base-isolation devices have a significant effect on the dynamic characteristics of the Daxing International Airport structure. The composite base-isolation devices successfully increased the building’s resonant period and decreased the resonant frequency. As a result, when facing dynamic loads such as earthquakes, a building can reduce the transmission of seismic energy to the structure through its own base-isolation and energy-dissipation characteristics, thereby enhancing the seismic performance and safety of the building.
This study analyzed the structural dynamic response of a high-rise, large-span terminal building in Beijing via the H/V spectral ratio method, revealing the core role of the base isolation layer in regulating seismic wave propagation. Under non-seismic state, the frequency of the measurement points below the base-isolation layer was 0.18–0.19 Hz, with the amplitude limited to approximately 1.5. During an earthquake, the frequency of the free field and the measurement points below the base isolation layer decreased to 0.17 Hz, and the amplitude increased by approximately 1.7 times. The low-frequency response (0.17 Hz) of the free-field measurement point DX35 and the frequency (0.17 Hz) of the measurement points below the base-isolation layer indicate a significant coupling effect between the building foundation and the subsoil.
The sedimentary layer thickness calculated from the HVSR peak frequency f_0 and the empirical formula (approximately 208 m) is close to the results from borehole investigations, validating the accuracy of the calculation results using the parameters in this paper. The analysis of the effectiveness of the base-isolation layer reveals that under seismic excitation, the building response frequency increases by 4–6 times (0.75–1.18 Hz) and suppresses the amplitude by more than 70%, effectively isolating low-frequency energy and reducing the risk of resonance. However, there is insufficient filtering in the high-frequency band (>10 Hz). The building as a whole exhibits a three-tier frequency gradient of “base-isolation layer-main body-roof frame” when excited by an earthquake. A structural design with frequency differences greater than three times can effectively avoid resonance coupling. The results of this study confirm the applicability of the H/V spectral ratio method in the analysis of complex base-isolation structures and provide a basis for optimizing the seismic design of terminal buildings. Additionally, for the abnormal high-frequency (8.81 Hz) result of measurement point DX12 during the nonseismic period, further investigation into the impact of ambient microvibrations and equipment disturbances on the base-isolation system is needed in the future.
In this study, the H/V spectral-ratio method was applied to evaluate the effectiveness of the isolation system at measurement points both inside and around a single long-span high-rise building, thereby verifying the applicability of the H/V technique for analyzing complex base-isolated structures and providing a basis for optimizing the seismic design of such buildings. Our results indicate that incorporating an isolation layer at the base of a long-span high-rise structure can effectively mitigate earthquake effects on the structure. During the planning phase, it is therefore essential to consider the relationship between the site’s resonant frequency and that of the building, and to implement appropriate isolation and damping measures to prevent resonance-related damage. Nonetheless, the study examined only a single isolation layer and did not perform detailed analyses for earthquakes of varying epicentral distances or magnitudes. Consequently, the findings may not be directly applicable to all base-isolated structures, and further investigations are needed for different building types, isolation systems, and seismic scenarios.
Acknowledgement: Not applicable.
Funding Statement: This work was supported by the Deep Earth Probe and Mineral Resources Exploration-National Science and Technology Major Project (Grant No. 2025ZD005100) and by Beijing Geolight Technology Co., Ltd. under the project “The Impact of Strong Ground Motion on Buildings” (YF-202520).
Author Contributions: The authors confirm their contributions to the paper as follows: study conception and design: Zhangdi Xie; data collection: Yong Wu, Linghui Niu, Jianming Zhao; analysis and interpretation of results: Zhangdi Xie, Cantao Zhuang; draft manuscript preparation: Zhangdi Xie, Cantao Zhuang. All authors reviewed the results and approved the final version of the manuscript.
Availability of Data and Materials: The data that support the findings of this study are available from the Corresponding Author, Zhangdi Xie, upon reasonable request.
Ethics Approval: Not applicable.
Conflicts of Interest: The authors declare no conflicts of interest to report regarding the present study.
References
1. Yang ZY, Wang YK, Huang JF. Effective selection methods of seismic waves for elastic and elastoplastic time history analysis. In: Proceedings of the 23rd National Conference on High-Rise Building Structures; 2014 Nov 19. Guangzhou, China. (In Chinese). [Google Scholar]
2. Zhang AL, Zhang CC, Liu XC. The response spectrum analysis of the terminal building of Beijing Capital Airport under multi-dimensional earthquake input. J Earthq Eng Eng Vib. 2008;28(1):32–7. (In Chinese). doi:10.13197/j.eeev.2008.01.011. [Google Scholar] [CrossRef]
3. Yang L, Chen H, Yue YZ, Li MF. Contrast in seismic analysis with response spectrum and time history analysis methods. J Shenyang Univ Technol. 2016;38(3):331–6. (In Chinese). [Google Scholar]
4. Borcherdt RD. Effects of local geology on ground motion near San Francisco Bay. Bull Seismol Soc Am. 1970;60(1):29–61. doi:10.1785/BSSA0600010029. [Google Scholar] [CrossRef]
5. Nakamura Y. A method for dynamic characteristics estimation of subsurface using microtremor on the ground surface. In: Railway Technical Research Institute, quarterly reports. Vol. 30. Tokyo. Japan: Railway Technical Research Institute/Tetsudo Gijutsu Kenkyujo; 1989. p. 25–33. [Google Scholar]
6. Cara F, Di Giulio G, Rovelli A. A study on seismic noise variations at Colfiorito, central Italy: implications for the use of H/V spectral ratios. Geophys Res Lett. 2003;30(18):1–4. doi:10.1029/2003gl017807. [Google Scholar] [CrossRef]
7. Parolai S, Bormann P, Milkereit C. New relationships between VS, thickness of sediments, and resonance frequency calculated by the H/V ratio of seismic noise for the cologne area (Germany). Bull Seismol Soc Am. 2002;92(6):2521–7. doi:10.1785/0120010248. [Google Scholar] [CrossRef]
8. Luo GC, Liu LB, Qi C, Chen QF, Chen YP. Structural response analysis of a reinforced concrete building based on excitation of microtremors and passing subway trains. Chin J Geophys. 2011;54(10):2708–15. (In Chinese). doi:10.3969/j.issn.0001-5733.2011.10.028. [Google Scholar] [CrossRef]
9. Ma X, Yang W, Xu S, Zhang Y, Wang W, Song J, et al. Shallow characteristics of Chenghai Fault Zone, Yunnan, China, from ambient noise tomography and horizontal-to-vertical spectral ratio with two dense linear arrays. Tectonophysics. 2024;881:230351. doi:10.1016/j.tecto.2024.230351. [Google Scholar] [CrossRef]
10. Liu L, Chen QF, Wang W, Rohrbach E. Ambient noise as the new source for urban engineering seismology and earthquake engineering: a case study from Beijing metropolitan area. Earthq Sci. 2014;27(1):89–100. doi:10.1007/s11589-013-0052-x. [Google Scholar] [CrossRef]
11. Tian B, Du Y, You Z, Zhang R. Measuring the sediment thickness in urban areas using revised H/V spectral ratio method. Eng Geol. 2019;260:105223. doi:10.1016/j.enggeo.2019.105223. [Google Scholar] [CrossRef]
12. Kanamori H, Mori J, Anderson DL, Heaton TH. Seismic excitation by the space shuttle Columbia. Nature. 1991;349(6312):781–2. doi:10.1038/349781a0. [Google Scholar] [CrossRef]
13. Satake N, Yokota H. Evaluation of vibration properties of high-rise steel buildings using data of vibration tests and earthquake observations. J Wind Eng Ind Aerodyn. 1996;59(2–3):265–82. doi:10.1016/0167-6105(96)00011-6. [Google Scholar] [CrossRef]
14. Mucciarelli M, Gallipoli MR, Ponzo F, Dolce M. Seismic waves generated by oscillating buildings: analysis of a release test. Soil Dyn Earthq Eng. 2003;23(4):255–62. doi:10.1016/S0267-7261(03)00021-6. [Google Scholar] [CrossRef]
15. Michel C, Guéguen P, Bard PY. Dynamic parameters of structures extracted from ambient vibration measurements: an aid for the seismic vulnerability assessment of existing buildings in moderate seismic hazard regions. Soil Dyn Earthq Eng. 2008;28(8):593–604. doi:10.1016/j.soildyn.2007.10.002. [Google Scholar] [CrossRef]
16. Gamal MA. Using microtremors for microseismic zonation in Cairo’s crowded, urban areas. J Seismol. 2009;13(1):13–30. doi:10.1007/s10950-008-9113-3. [Google Scholar] [CrossRef]
17. Bonnefoy-Claudet S, Baize S, Bonilla LF, Berge-Thierry C, Pasten C, Campos J, et al. Site effect evaluation in the basin of Santiago de Chile using ambient noise measurements. Geophys J Int. 2009;176(3):925–37. doi:10.1111/j.1365-246x.2008.04020.x. [Google Scholar] [CrossRef]
18. Qin L, Wang Y, Chen C, Wei Y, Liao C, Zhang Y, et al. Resonance analysis in a high-rise building: combined translational and rotational measurements. J Earth Sci. 2024;35(3):1069–74. doi:10.1007/s12583-024-2011-y. [Google Scholar] [CrossRef]
19. Güllü H, Özel F. Microtremor measurements and 3D dynamic soil-structure interaction analysis for a historical masonry arch bridge under the effects of near-and far-fault earthquakes. Environ Earth Sci. 2020;79(13):338. doi:10.1007/s12665-020-09086-0. [Google Scholar] [CrossRef]
20. Nadi MAB, Nurfaizia, Karunia MN, Aspar WAN, Barasa W, Fudholi A. Characterization of site effect and natural frequency of railway bridges. Int J Sustain Dev Plan. 2022;17(1):243–9. doi:10.18280/ijsdp.170124. [Google Scholar] [CrossRef]
21. El Mehdi N, Abdellah EH, Aomar IB, Mohammed C, Driss EH, Abderrahmane J. The H/V spectral ratio technique for dynamic characterization of existing buildings in Morocco. Civ Eng Archit. 2025;13(1):224–36. doi:10.13189/cea.2025.130113. [Google Scholar] [CrossRef]
22. Zhang Y, Lu L, Maupin V, Qin T, Ding Z. Mapping 3D sedimentary structures with joint inversion of H/V spectral ratios and multimode dispersion curves derived from ambient noise—application to the Xiong’an new area, China. Bull Seismol Soc Am. 2025;115(2):619–45. doi:10.1785/0120240174. [Google Scholar] [CrossRef]
23. Anukwu GC, Mohammed MHB, Obi-Enadhuze D. Site effects estimation using the horizontal to vertical spectral ratio for different geological formations. J Eng Geol Environ Res. 2024;1:35–42. [Google Scholar]
24. Li Q, Bo J, Peng D. Characterization of HVSR and VRSR in the Loess Plateau of China based on strong-motion data. Appl Sci. 2025;15(1):67. doi:10.3390/app15010067. [Google Scholar] [CrossRef]
25. Qin T, Lu L, Ding Z, Feng X, Zhang Y. High-resolution 3D shallow S wave velocity structure of Tongzhou, subcenter of Beijing, inferred from multimode Rayleigh waves by beamforming seismic noise at a dense array. J Geophys Res Solid Earth. 2022;127(5):e2021JB023689. doi:10.1029/2021JB023689. [Google Scholar] [CrossRef]
26. Rong M, Fu LY, Francisco José SS, Sun W. Joint inversion of earthquake-based horizontal-to-vertical spectral ratio and phase velocity dispersion: applications to Garner Valley. Front Earth Sci. 2022;10:948697. doi:10.3389/feart.2022.948697. [Google Scholar] [CrossRef]
27. Grutas RN, Serrano AT, Tan JMLC, Castro RAF. Rapid estimation of Vs30 through elitist genetic algorithm HVSR inversion and refraction microtremor data analysis in the greater metro Manila area and Leyte province, Philippines. Appl Sci. 2025;15(5):2447. doi:10.3390/app15052447. [Google Scholar] [CrossRef]
28. Sánchez-Sesma FJ, Weaver RL, Baena-Rivera M, Arciniega-Ceballos A, Rodríguez-Zosayas DA, Perton M. Modelling noise H/V spectral ratio in a laterally inhomogeneous layered medium. Geophys J Int. 2025;240(3):1652–66. doi:10.1093/gji/ggaf009. [Google Scholar] [CrossRef]
29. Zhao Y, Dutta U, Yang ZJ. Joint inversion of MASW and ambient noise HVSR data for estimating shear wave velocity in warm permafrost sites. Cold Reg Sci Technol. 2025;239:104623. doi:10.1016/j.coldregions.2025.104623. [Google Scholar] [CrossRef]
30. Trichandi R, Bauer K, Ryberg T, Heit B, Araya Vargas J, von Blanckenburg F, et al. 3D shear wave velocity imaging of the subsurface structure of granite rocks in the arid climate of Pan de Azúcar, Chile, revealed by Bayesian inversion of HVSR curves. Earth Surf Dynam. 2024;12(3):747–63. doi:10.5194/esurf-12-747-2024. [Google Scholar] [CrossRef]
31. Nakamura Y. What is the nakamura method? Seismol Res Lett. 2019;90(4):1437–43. doi:10.1785/0220180376. [Google Scholar] [CrossRef]
32. Konno K, Ohmachi T. Ground-motion characteristics estimated from spectral ratio between horizontal and vertical components of microtremor. Bull Seismol Soc Am. 1998;88(1):228–41. doi:10.1785/bssa0880010228. [Google Scholar] [CrossRef]
33. Peng F, Wang WJ, Kou HD. Microtremer H/V spectral ratio investigation in the Sanhe-Pinggu area: site responses, shallow sedimentary structure, and fault activity revealed. Chin J Geophys. 2020;63(10):3775–90. (In Chinese). doi:10.6038/cjg2020O0025. [Google Scholar] [CrossRef]
34. Field E, Jacob K. The theoretical response of sedimentary layers to ambient seismic noise. Geophys Res Lett. 1993;20(24):2925–8. doi:10.1029/93GL03054. [Google Scholar] [CrossRef]
35. Lachetl C, Bard PY. Numerical and theoretical investigations on the possibilities and limitations of Nakamura’s technique. J Phys Earth. 1994;42(5):377–97. doi:10.4294/jpe1952.42.377. [Google Scholar] [CrossRef]
36. Bonnefoy-Claudet S, Cornou C, Bard PY, Cotton F, Moczo P, Kristek J, et al. H/V ratio: a tool for site effects evaluation. Results from 1-D noise simulations. Geophys J Int. 2006;167(2):827–37. doi:10.1111/j.1365-246X.2006.03154.x. [Google Scholar] [CrossRef]
37. Qin TW, Wang ST, Feng XZ, Lu LY. A review on microtremor H/V spectral ratio method. Rev Geophys Planet Phys. 2021;52(6):587–622. (In Chinese). doi:10.19975/j.dqyxx.2021-003. [Google Scholar] [CrossRef]
38. Bard PY, Participants S. The SESAME project: an overview and main results. In: Proceeding of the 13th World Conference on Earthquake Engineering; 2004 Aug 1–6; Vancouver, BC, Canada. [Google Scholar]
39. Chen Z, Yao H, Shao X, Luo S, Yang H. Detailed sedimentary structure of the Mianning segment of the Anninghe fault zone revealed by H/V spectral ratio. Earthq Res Adv. 2023;3(3):100232. doi:10.1016/j.eqrea.2023.100232. [Google Scholar] [CrossRef]
40. Xuan Y, Wu T, Liu X, Li WH, Wang JP. Study of relationship between shallow shear wave velocity and buried structure in Beijing Plain. N China Earthq Sci. 2014;32(2):25–8. (In Chinese). [Google Scholar]
41. Li H, Luo GC, Rong MS, Wang JX, Liu AY, Kong XS. Empirical relationship between overburden thickness and natural frequency based on borehole data in Beijing region. Acta Seismol Sin. 2024;46(6):1063–75. (In Chinese). [Google Scholar]
42. Gallipoli MR, Mucciarelli M, Castro RR, Monachesi G, Contri P. Structure, soil-structure response and effects of damage based on observations of horizontal-to-vertical spectral ratios of microtremors. Soil Dyn Earthq Eng. 2004;24(6):487–95. doi:10.1016/j.soildyn.2003.11.009. [Google Scholar] [CrossRef]
Cite This Article
 Copyright © 2026 The Author(s). Published by Tech Science Press.
This work is licensed under a Creative Commons Attribution 4.0 International License , which permits unrestricted use, distribution, and reproduction in any medium, provided the original work is properly cited.
 Downloads
 Citation Tools