
 Submit a Paper
 Propose a Special lssue
 Open Access
ARTICLE

BIM-Based Visualization System for Settlement Warning in Multi-Purpose Utility Tunnels (MUTs)
1 School of Civil Engineering and Architecture, NingboTech University, Ningbo, 315100, China
2 School of Civil Engineering, Chongqing Jiaotong University, Chongqing, 400074, China
* Corresponding Author: Wangxin Li. Email:
Structural Durability & Health Monitoring 2026, 20(1), . https://doi.org/10.32604/sdhm.2025.070873
Received 26 July 2025; Accepted 15 September 2025; Issue published 08 January 2026
 View Full Text
 Download PDF
Abstract
The existing 2D settlement monitoring systems for utility tunnels are heavily reliant on manual interpretation of deformation data and empirical prediction models. Consequently, early anomalies (e.g., minor cracks) are often misjudged, and warnings lag by about 24 h without automated spatial localization. This study establishes a technical framework for requirements analysis, architectural design, and data-integration protocols. Revit parametric modelling is used to build a 3D tunnel model with structural elements, pipelines and 18 monitoring points (for displacement and joint width). Custom Revit API code integrated real-time sensor data into the BIM platform via an automated pipeline. The system achieved a spatial accuracy of ±1 mm in locating deformation hotspots. Notifications are triggered within 10 s of anomaly detection, and the system renders 3D risk propagation paths in real-time. Real-time 3D visualization of risk propagation paths is also facilitated. The efficacy of the solution was validated in a Ningbo utility tunnel project, where it was demonstrated that it eliminates human-dependent judgment errors and reduces warning latency by 99.9% compared to conventional methods. The BIM-IoT integrated approach, which enables millimetre-level precision in risk identification and near-instantaneous response, establishes a new paradigm for intelligent infrastructure safety management.Keywords
Multi-purpose utility tunnels (MUTs) are critical underground infrastructure that carry power, telecom, water, heating, gas and other lifelines [1]. Compared with traditional direct burial pipelines, MUTs significantly improve the efficiency of emergency repairs, maintenance, and upgrades of internal pipelines, effectively avoiding repeated road excavation and achieving outstanding comprehensive benefits [2]. However, the highly integrated, deep underground linear structure also poses challenges during operation and maintenance, such as the complex evolution of structural performance and a significant impact from dynamic changes in internal and external environments (geology, loads, seepage, etc.), which significantly increases the difficulty of risk management [3]. Common disasters affecting MUTs include structural subsidence, explosions caused by pipeline leaks, and seismic responses, all of which can pose a serious threat to the safety of surrounding buildings and facilities.
Settlement is one of the primary risk factors that threaten the safe operation of underground MUTs [4]. Uneven settlement can cause cracks in the concrete of the pipe gallery, misalignment of joints, and even instability or leakage of the entire structure. Structural deformation can affect internal pipelines, increasing the risk of rupture, which in turn can lead to secondary disasters such as gas leaks and electrical short circuits. In addition, MUTs are often located under major urban roads, and severe settlement can cause road collapse, directly threatening ground buildings and traffic safety. Shenzhen Metro tunneling in permeable strata caused measurable surface settlements, showing how geotechnical conditions can worsen deformation and raise the risk of structural damage [5]. Case study of masonry building damage: A metro shield tunnel led to cracking and settlement in the overlying masonry structures. Finite element analysis verified the tensile strain thresholds where wall cracks begin to form [6]. Settlement data from the stacked tunnel in Singapore configurations highlighted complex subsidence behavior, emphasizing the importance of monitoring and prediction in layered urban tunneling [7]. Wang et al. [8] evaluated settlement in cohesive soil and calculated failure probabilities under different soil properties, reinforcing the need for risk assessment during tunnel excavation.
The settlement repair process typically requires the interruption of pipeline services, which can significantly impact the integrated functions of MUTs. For instance, it affects the transportation function for both large and small vehicles, as well as the recovery of exhaust emissions. Interrupting the pipeline service during settlement repair results in a complete halt of key functions of MUTs, such as traffic management and tail gas recovery. Additionally, the repair operation depends on millimeter-level, continuous, real-time settlement monitoring data to guide construction, demanding high levels of technical precision and coordinated management [9,10]. Therefore, for key urban infrastructure such as MUTs, prevention is far better than treatment. Real-time, comprehensive assessment of structural conditions, prediction, and early warning of safety risks, along with timely intervention, are crucial for preventing accidents [11].
For MUTs, traditional maintenance methods mainly rely on manual inspections and regular monitoring, which hinder real-time monitoring and early warning capabilities. Maintenance can account for 80%–90% of operational costs [12], highlighting the need for efficient management. The maintenance phase is a critical stage in ensuring the safe operation and continuous functionality of tunnels, involving a wide range of activities such as structural health monitoring [13], environmental and safety monitoring [14,15] (including air quality and hazard detection), electromechanical equipment management [16,17] (such as maintaining ventilation and lighting systems), operational status monitoring [18], routine inspections and maintenance [19], and emergency response [20,21] (including incident handling and evacuation procedures). It draws from multiple information sources—such as automated monitoring data, manual inspection records, and historical archives [22,23]—and features broad spatial and temporal distribution, diverse data types, and varying update frequencies. Compared to industrial or civil buildings in concentrated areas, MUTs encounter more complex and variable geological conditions, larger engineering scopes, and greater uncertainty, which demand higher resource allocation and intelligent management throughout their lifecycle [24]. Despite ongoing advances in monitoring technologies, traditional methods still dominate tunnel structural health monitoring. Current systems often lack effective three-dimensional visualization capabilities, and the use of virtual reality technology remains underdeveloped. Recognizing the importance of visualization in risk management for civil structures is increasing. Studies show that traditional monitoring systems face challenges like data fragmentation, delayed feedback, and limited spatial awareness, making timely decision-making difficult, especially in real-time structural risk scenarios [25]. Visualization enables engineers to quickly construct and modify models in a parameterized way to meet stakeholders’ needs [26]. Additionally, a neutral data format (such as IFC) that stores standard and customized data for all project elements can provide interoperable digital representations, facilitating compatibility between BIM applications [27]. The integration of real-time data visualization via systems greatly enhances decision-making by delivering clearer, more accurate risk assessments and supporting early interventions. These systems allow stakeholders to monitor both structural health and environmental conditions simultaneously, improving their ability to respond quickly and efficiently [28,29]. However, these technologies often function independently, resulting in severe data silos that reduce data processing and analysis efficiency, increase the burden of data storage and preprocessing, and delay feedback of monitoring results [30], making it harder to meet the demands for real-time, precise early warnings. Wang et al. believe that traditional settlement monitoring data contains anomalies and missing data, and that combining data from multiple sources is challenging. The large volume of data also causes processing delays. Therefore, they introduced algorithms for surface subsidence monitoring in Kunming, enabling automated data calculation [31]. Peduto and colleagues [32] argue that data from different observation sources need to be integrated and calibrated, and that using multi-source data is essential to advance settlement monitoring and prediction beyond traditional methods. When studying China’s high-speed rail settlement system, Zhuo et al. [33] found that traditional monitoring and manual measurement, due to long measurement cycles, low efficiency, and the lack of timely warnings, cannot meet modern requirements. The relevant means need to be improved.
Building Information Modelling (BIM) serves as a digital representation tool for the entire lifecycle of a project based on parametric design. Its core advantage lies in integrating information to support design, construction, and operations. In the field of underground engineering, BIM applications are primarily concentrated in the design and construction phases (e.g., collaborative design [34], visualization analysis [35], parametric modelling [7], clash detection [36], construction simulation [37], risk assessment [38], and scheme management [39]). By integrating GIS data, it enables three-dimensional visualization of underground pipelines, geological strata, and construction scenarios [40]. It combines Internet of Things (IoT) technology for real-time monitoring and parameter optimization during the construction phase [41]. The primary objectives are to optimize processes, enhance efficiency, and reduce costs.
However, there is still significant room for improvement in the deep application of BIM during the operation and maintenance phase, particularly in the area of structural health monitoring and early warning for MUTs. Existing research and practice on BIM systems primarily focus on model conversion, information display, and numerical simulation structural analysis. Wang et al. [42] realized the information conversion between MUTs BIM and GIS, Xie et al. [43] explored Web-based BIM data processing and display, Huang et al. [44] proposed an automated numerical simulation framework, Qiu et al. [45] realized the intelligent analysis of foundation pit excavation using BIM-FEM, and Fabozzi et al. [46] imported BIM into PLAXIS 3D to perform deformation analysis. However, they do not exploit BIM’s integration strengths: they neither unify multi-source operational data nor support intelligent analysis and real-time 3D decision-support [47]. Existing BIM-based visualization systems still lack sufficient capability to process real-time monitoring data and effectively map and locate it on three-dimensional models.
Therefore, this study focuses on developing a BIM-based MUTs visualization early warning system. Targeting the most critical settlement risk during the MUTs operation period, it realizes the organic integration of BIM models and monitoring data through the Revit platform. Based on the overview of a MUTs tunnel project in Ningbo and the BIM application objectives, a detailed 3D model was constructed using Revit parametric modelling, and 18 deformation measurement points were spatially distributed, including two types of deformation indicators: displacement and crack width. Compared with traditional monitoring systems that present settlement information in two-dimensional charts, the three-dimensional BIM visualization system constructed in this paper can accurately locate abnormal areas and realize automatic early warning in combination with monitoring data, thereby improving the accuracy and intelligence of settlement monitoring and providing more intuitive and efficient decision-making support for MUTs operation and maintenance management.
2 BIM-Based Secondary Development on Revit
During operations and maintenance, BIM should serve as an integrated platform for monitoring data and computational models, supporting real-time updates, historical queries, and collaborative decision-making. This creates a digital twin that parallels the physical structure [48,49]. Fig. 1 illustrates the information mapping mechanism between the physical space and the digital twin model constructed using BIM. Autodesk Revit is a common BIM running platform. It offers an open NET API for secondary development in C# or VB.NET, using Visual Studio for coding and debugging. Its architecture includes Application, Document, and Element classes. Development requires referencing the Revit API assembly (RevitAPI.dll, RevitAPIUI.dll) and debugging and management using tools such as Revit Lookup and Add-In Manager [50].
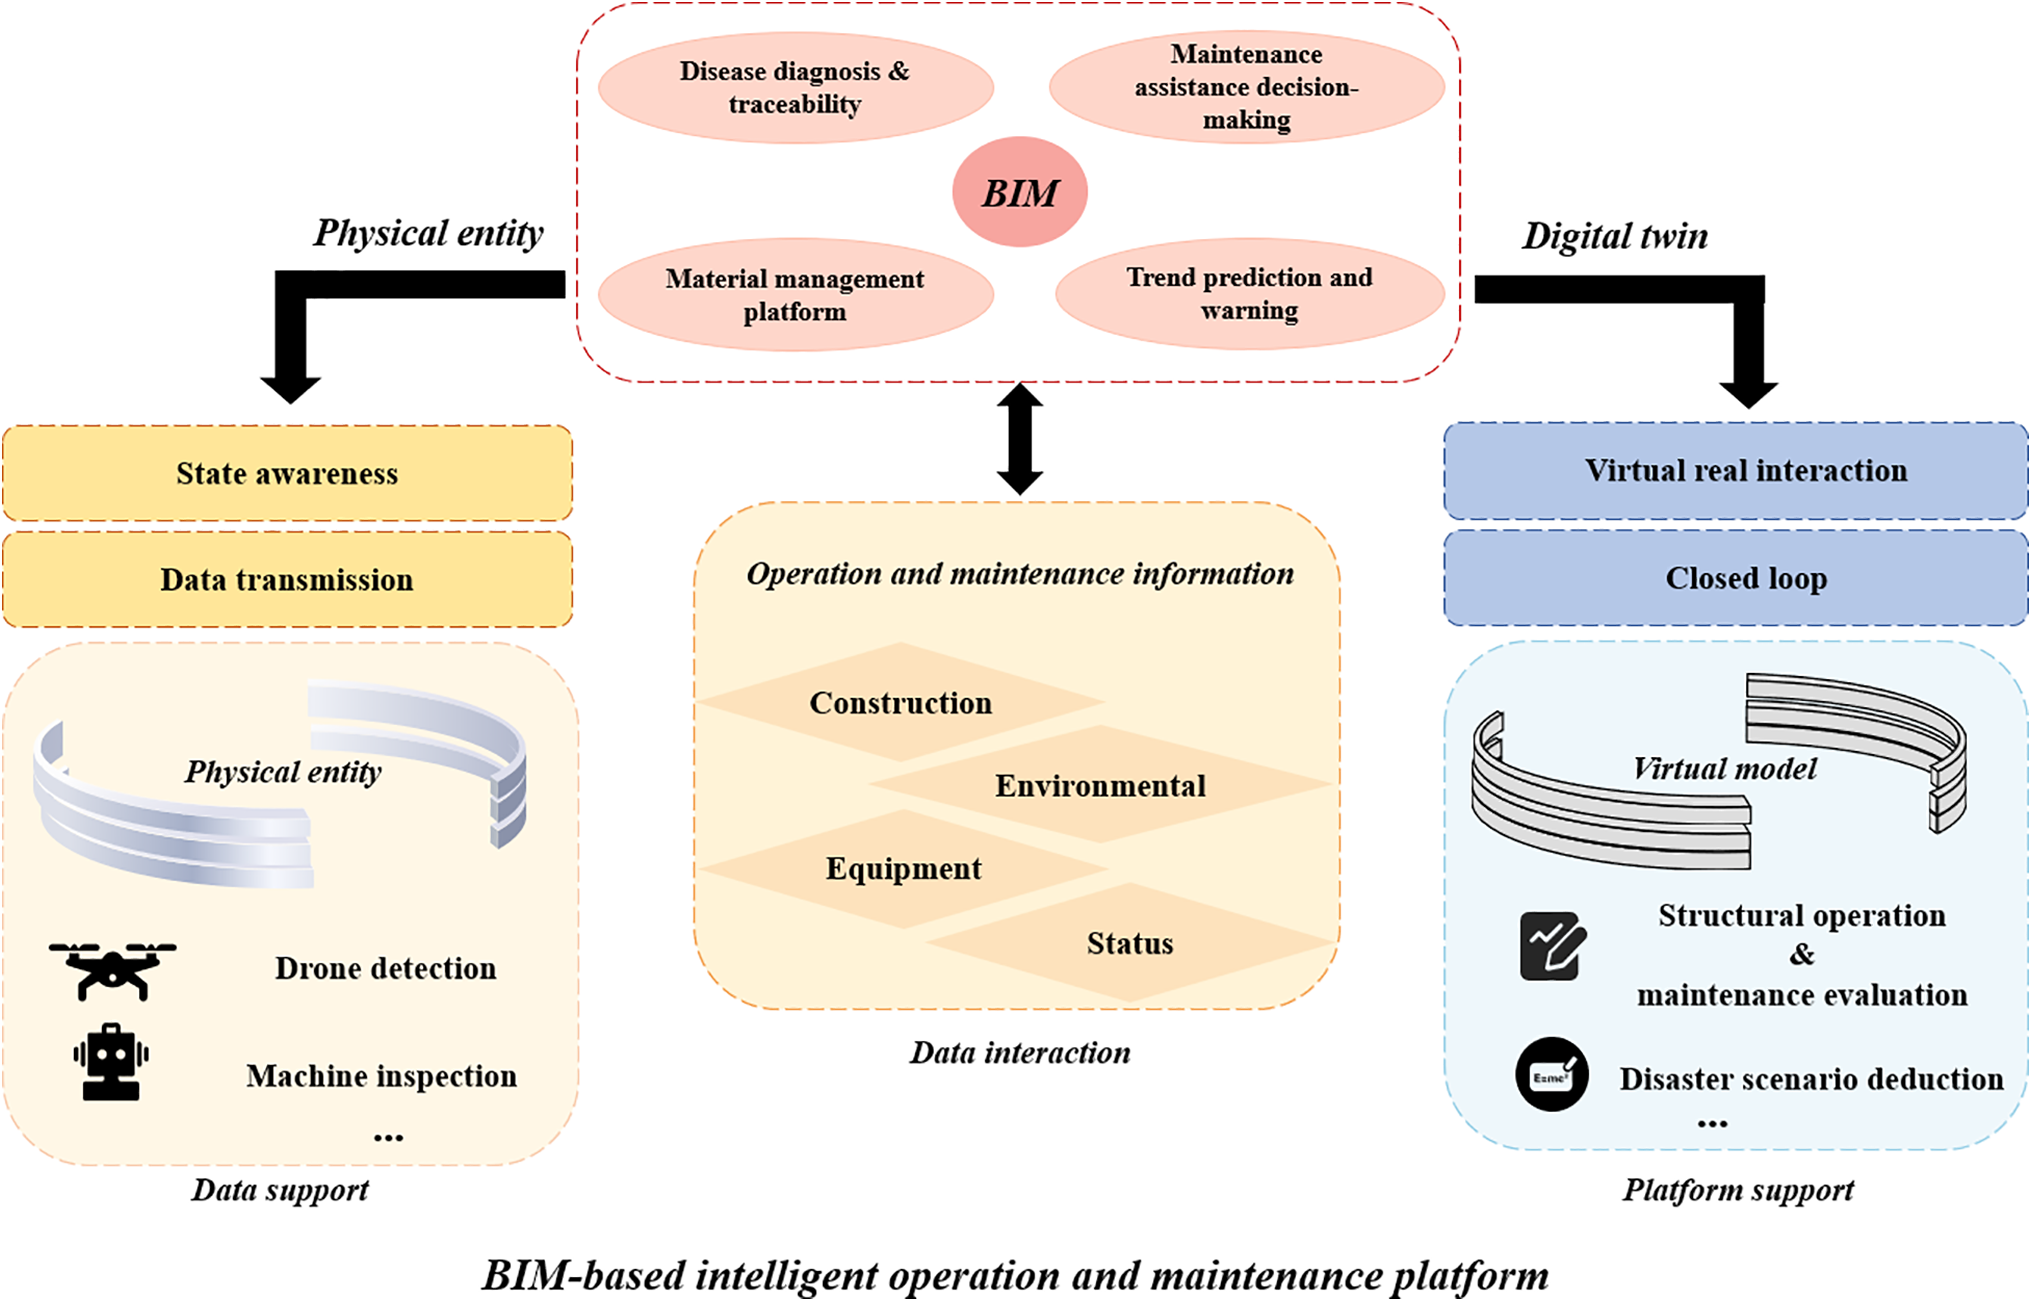
Figure 1: Information mapping between BIM-based physical entities and digital twin models
Secondary development based on Revit API empowers BIM models for in-depth application in areas such as dynamic monitoring, intelligent operation, and maintenance. Through secondary development, Revit can not only achieve data interconnection with external databases, real-time monitoring systems, and AI prediction platforms, thereby breaking down traditional information silos, but also customise functional modules according to specific engineering needs, thereby improving the adaptability and efficiency of the system. Additionally, secondary development enables the model to have real-time data binding and dynamic feedback capabilities, supporting three-dimensional visualization, warnings, and automatic navigation functions, which further optimize risk identification and decision-making support processes. Furthermore, the system can integrate various interactive methods such as AR/VR, enriching the operational experience and enhancing the flexibility of inspections and maintenance. Leveraging its high system openness, Revit secondary development provides robust technical support for building an intelligent, integrated infrastructure maintenance management platform.
The Revit API, as the application programming interface for Autodesk Revit, enables the creation of three-dimensional parametric models based on relational databases and integrates geometric, attribute, and view data through the Document Model. It uses a single-threaded mode (STA) and supports two types of extensions: IExternal Command and IExternal Application:
(1) IExternal Command
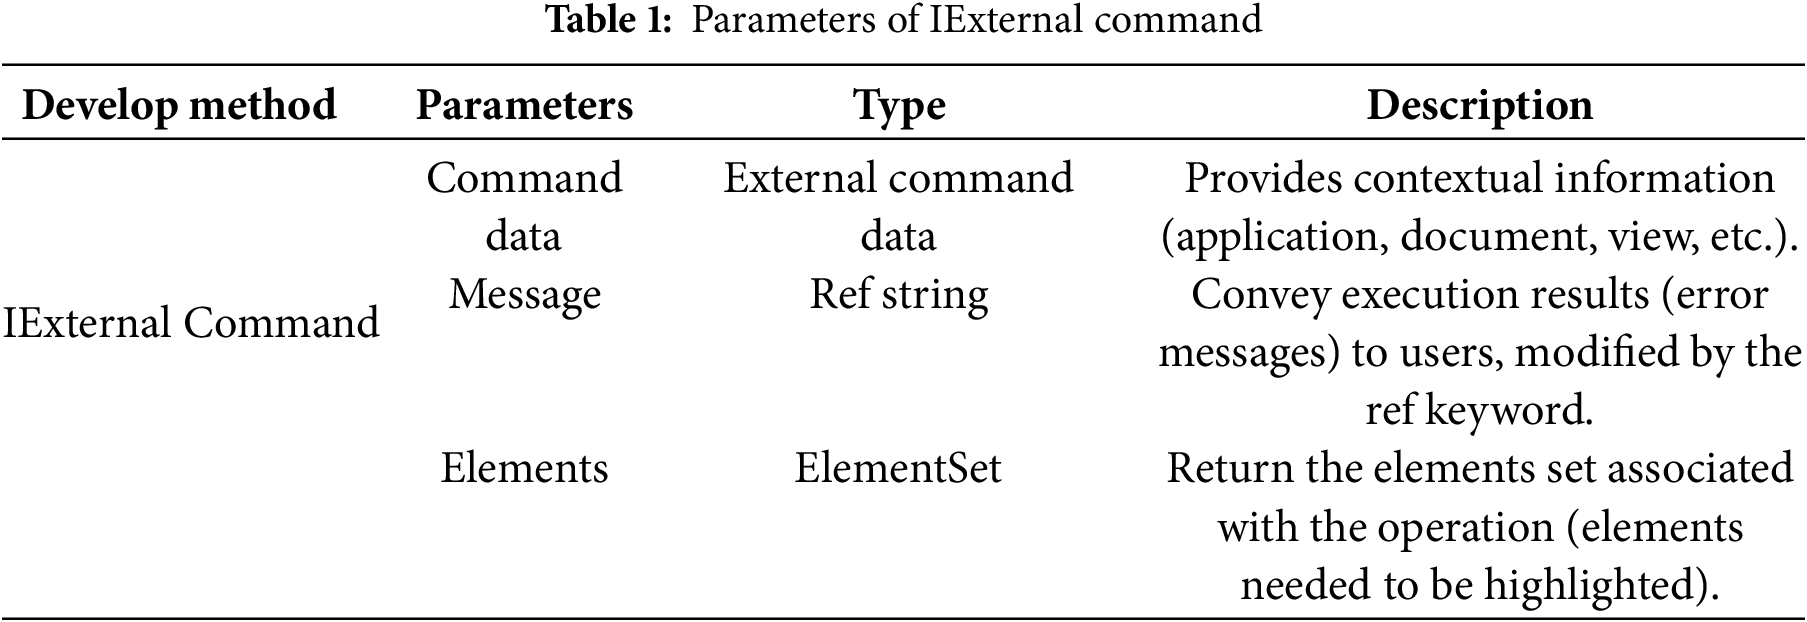
When Revit is not calling other commands or is not in edit mode, external command programs must inherit from the IExternalCommand interface and execute the Execute function. Specific parameter descriptions are shown in Table 1. This requirement is a core design principle of the Revit API to ensure system stability. Revit operates as a single-threaded environment, meaning it can only process one operation at a time. The IExternalCommand interface acts as a standardized protocol. It ensures that our custom monitoring tool executes only when Revit is idle and ready to receive instructions, thereby preventing conflicts with other commands and guaranteeing the integrity of the model and data. The execute function is the mandated entry point that Revit calls when it is safe to proceed.
(2) IExternal Application
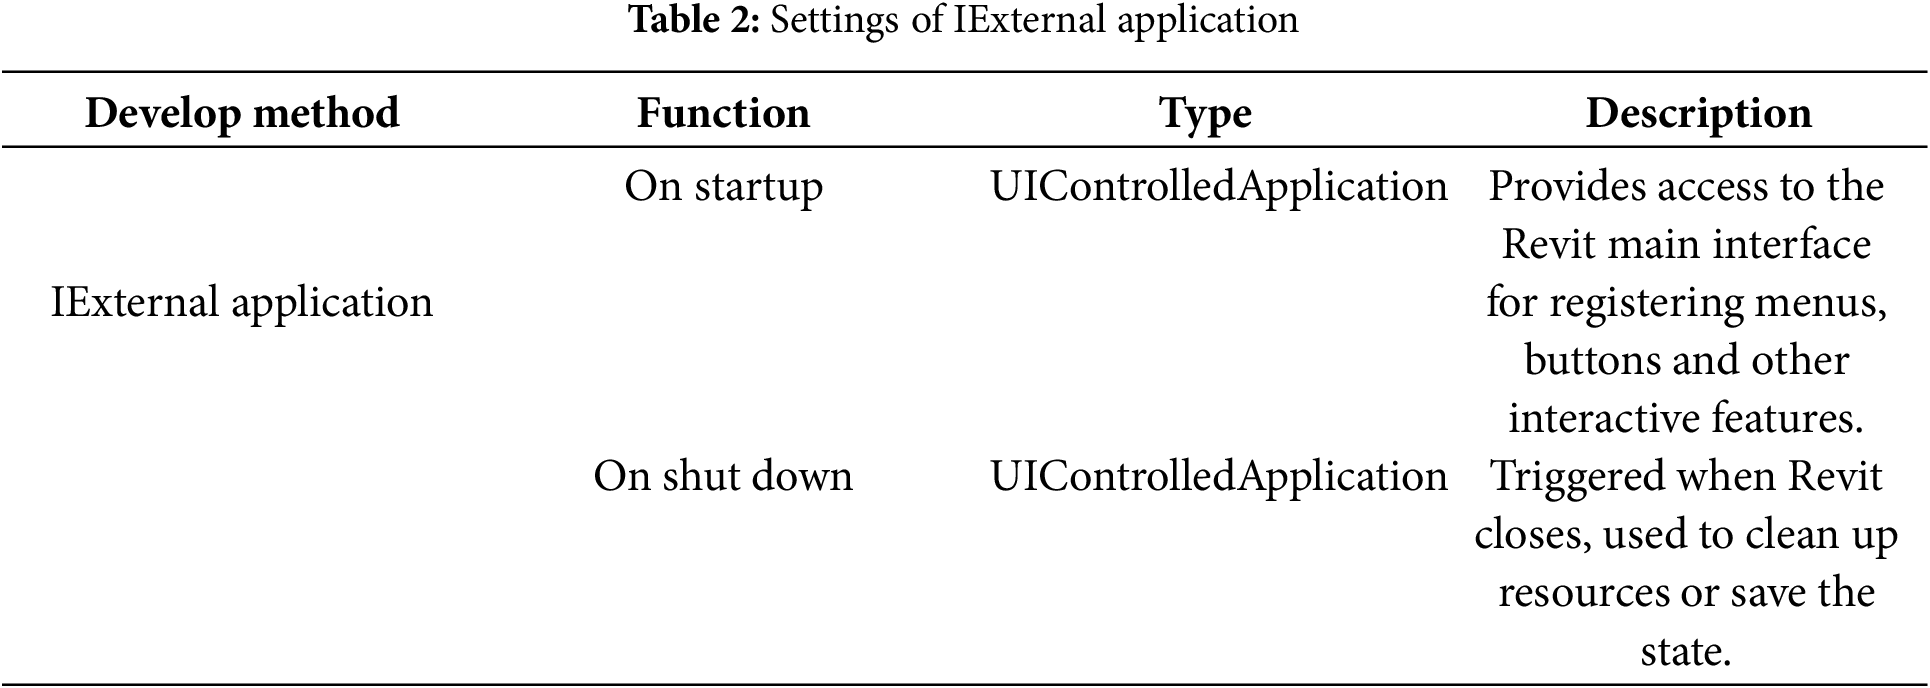
External applications are plugins developed by implementing the IExternal Application interface, designed to initialise upon Revit startup and possess an extended lifecycle. They govern their lifecycle through the OnStartup and OnShutdown methods, support interface customization—such as Ribbon buttons—and facilitate the registration of global events. Specific parameters are delineated in Table 2. External commands execute specific logic and are administered by the external application framework. Both components are associated via the addin configuration file, which enables automatic plugin loading and seamless functional integration, thereby establishing a comprehensive plugin ecosystem.
The specific process for secondary development is as follows:
(1) Create a new “class library” project in Visual Studio 2017.
(2) Add the two assemblies Autodesk.Revit API.dll and Autodesk.Revit APUI.dll to the project. Revit API.dll provides various methods for accessing database-level Application, Document, Element, and Parameter objects, while Revit APIUI.dll provides methods for creating and managing plugin interfaces.
(3) Load the Add-In Manager and Revit Lookup plugins, write functional programs using C#, call Execute in the program to display the external interface, and write related command code to complete the interaction between Revit and the database, as well as the extension of the Revit UI interface.
(4) Debug the written program. In Visual Studio 2017, select to add the process to Revit for debugging, and promptly modify and adjust any issues that arise.
(5) Generate the Addin file from the compiled code.
(6) Run Revit and verify whether the tunnel monitoring plugin can run.
3 BIM-Based Model Construction
MUTs feature complex designs and challenging underground conditions that complicate construction and operation. With the widespread application of BIM technology, the design, construction, and operation management of MUT projects have become more efficient and accurate. BIM technology not only helps to create three-dimensional digital models of MUTs, but also effectively optimizes the design process, improves construction efficiency, and reduces risks. The specific steps are as follows:
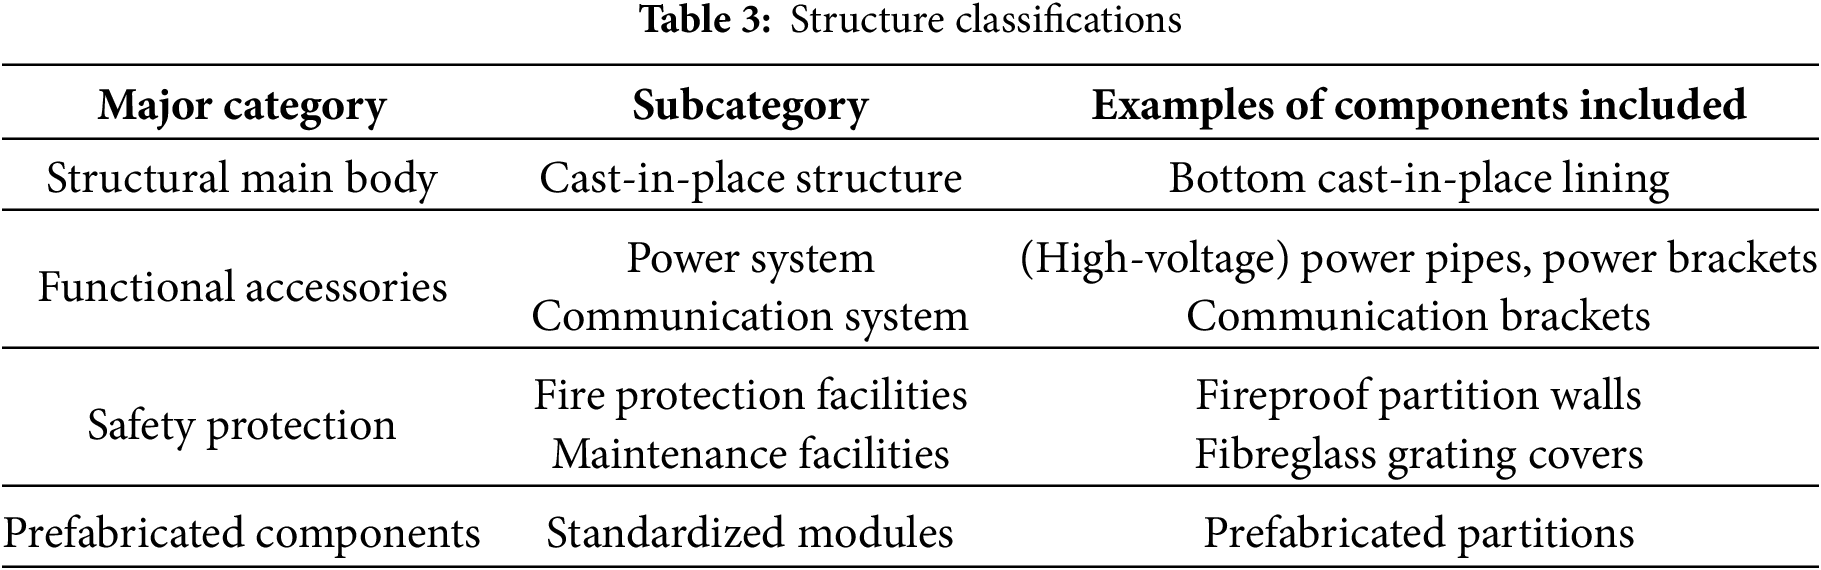
(1) Based on the structural characteristics of MUTs, analyze the functional requirements and design standards of each type of component, and use a hierarchical classification method to classify each type of component in the tunnel step by step, as shown in Table 3.
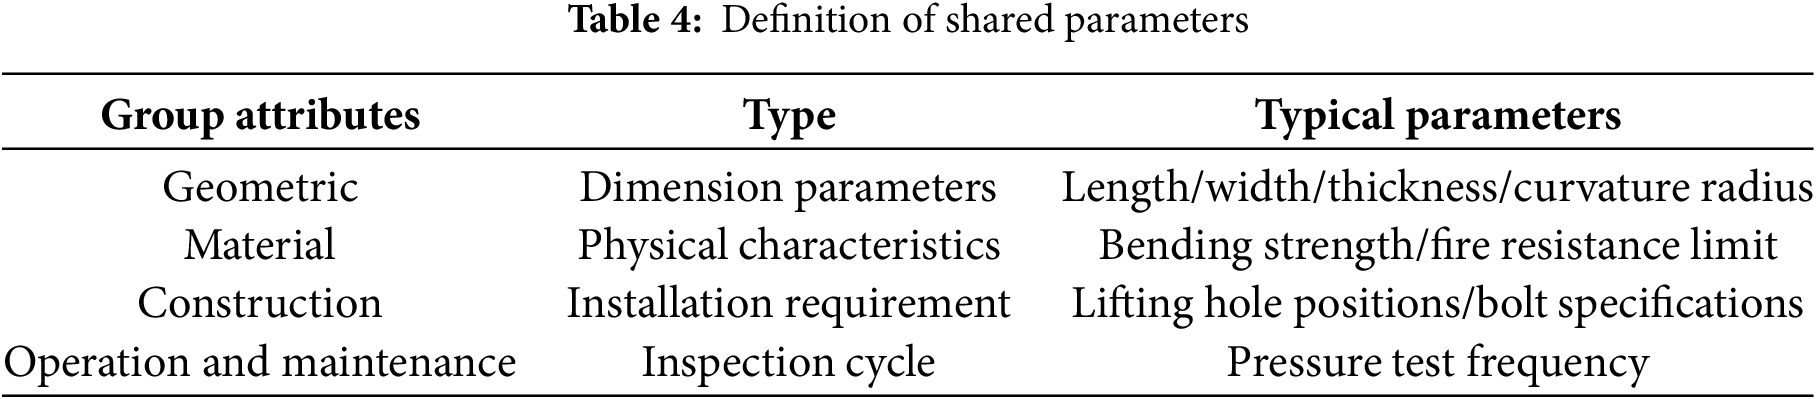
(2) Standardized parameter design and shared parameter creation
Each type of component includes essential parameters such as dimensions, materials, and load-bearing capacity, as shown in Table 4. These components are designed according to uniform standards, and shared parameter files are created, providing a data foundation for constructing accurate 3D models. This ensures that components can be managed and called up in different families and projects.
(3) 3D modelling and component library creation
Based on Revit, three-dimensional modelling of MUT components is performed according to the plan given in the design drawings. At this stage, elements such as FRP grating covers, power pipes, power brackets, communication brackets, and fire walls are classified and summarized to form a complete component family library for subsequent use and management throughout the project. The model of each component will be stored in this family library and optimized according to project requirements.
(4) Component parameterization and family instance generation
In actual MUT projects, the established component family library is used to modify the parameters of the component family through external data files, generating corresponding family instances. The specific construction process is shown in Fig. 2. For example, the dimensions and materials of electrical pipes or electrical brackets can be modified to meet specific construction requirements. After all component family instances are generated, they are assembled into a complete MUTs BIM model, reducing uncertainty and conflicts in the design.
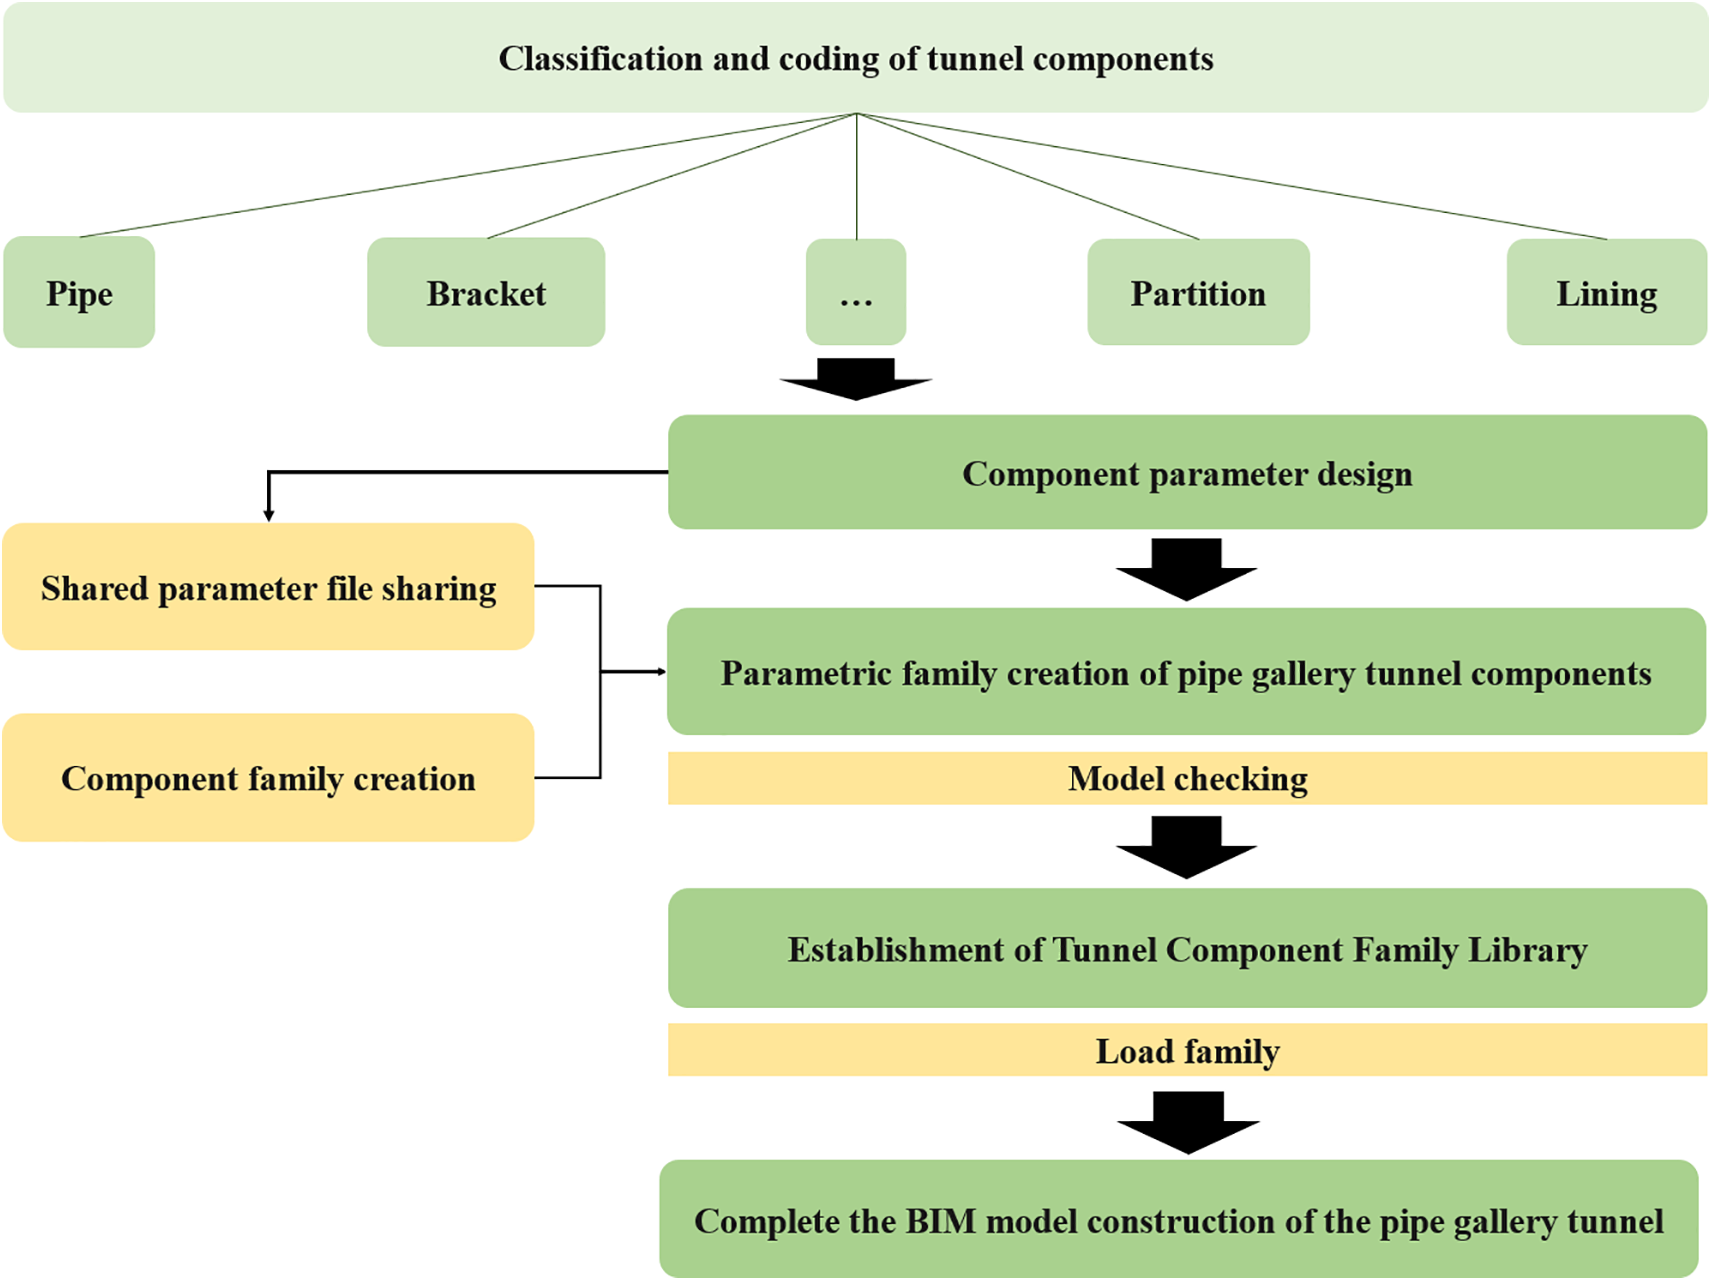
Figure 2: Construction process of the MUTs model based on BIM
Based on the aforementioned 3D modelling method and relying on the Ningbo Tongtu Road MUTs tunnel project, core components, including the cast-in-place lining structure at the bottom of the MUTs, corbel components, and functional partition units, were constructed. According to the elevation system, each module was assembled in layers and calibrated with three-dimensional coordinates to achieve accurate component overlap. In the model visualization stage, by assigning real physical property parameters to materials such as concrete and steel, the surface texture mapping and light reflection characteristics were optimized, which significantly improved the structural expressiveness and engineering simulation of the model. Finally, a complete three-dimensional model of the MUTs tunnel was integrated, as shown in Fig. 3.
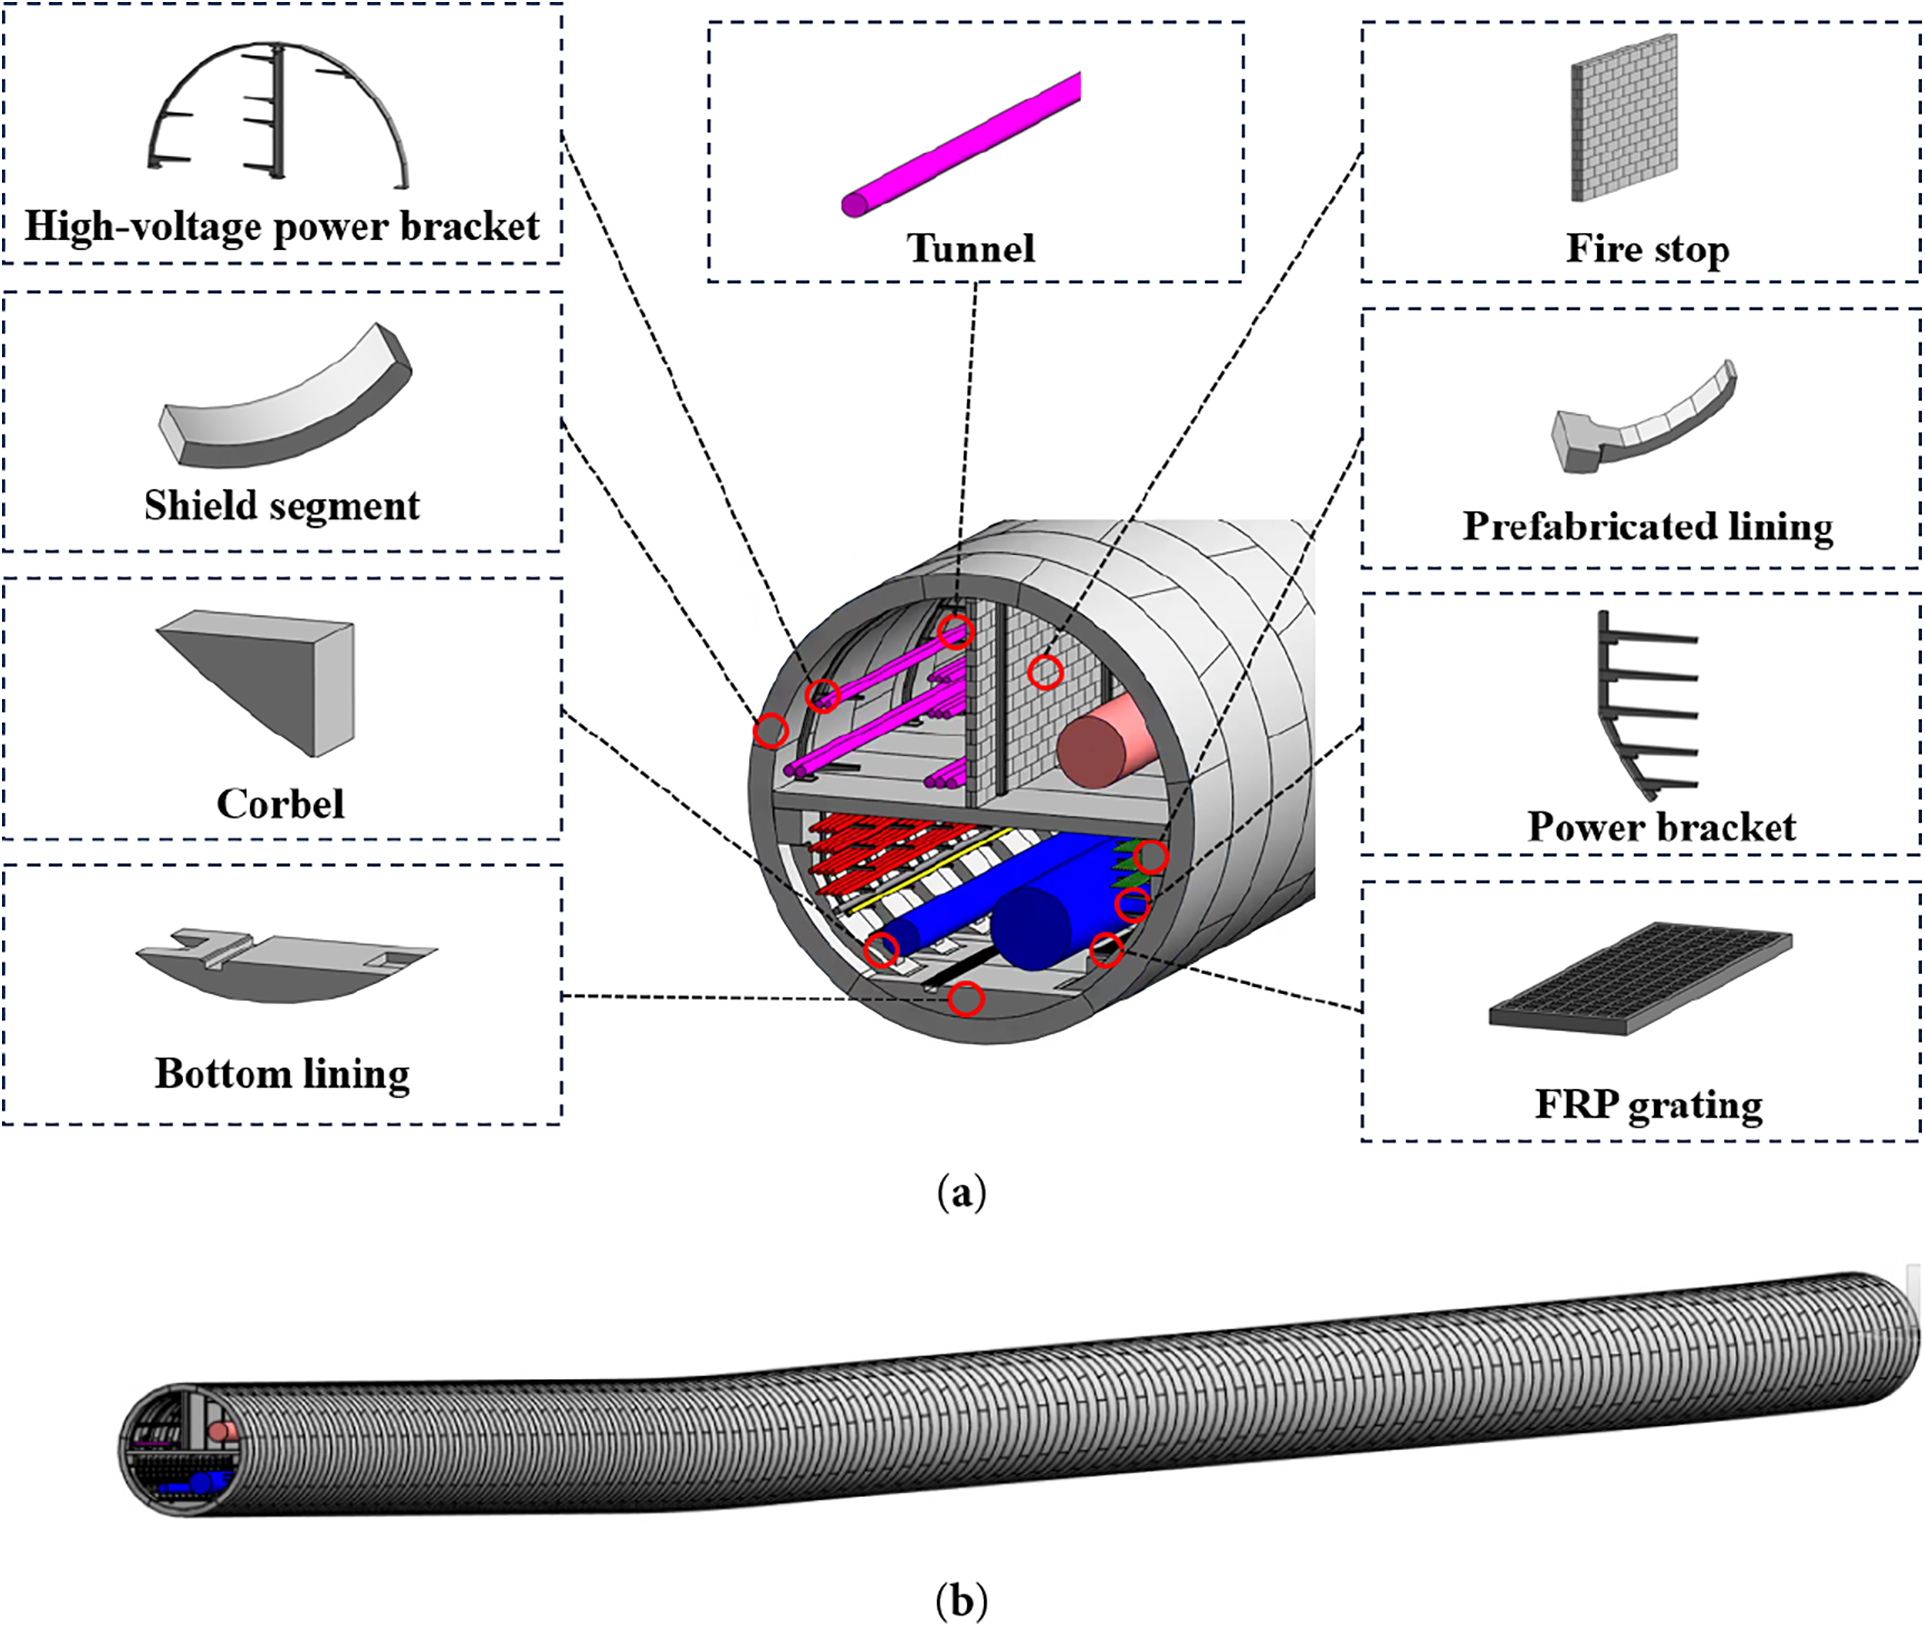
Figure 3: BIM model of the MUTs tunnel. (a) BIM model view of the main structure; (b) Overview Structure BIM Model View
3.2 Displacement Points Monitoring
In Revit, all components are created based on template family files. In the code, the Revit API is utilised to dynamically monitor deformation points, with CSV files serving as the database for storing and managing monitoring point information. A family instance represents each monitoring point in the Revit model. It is uniquely identified through the “detection unit” parameter, which corresponds to the monitoring point information in the database, as shown in Fig. 4.
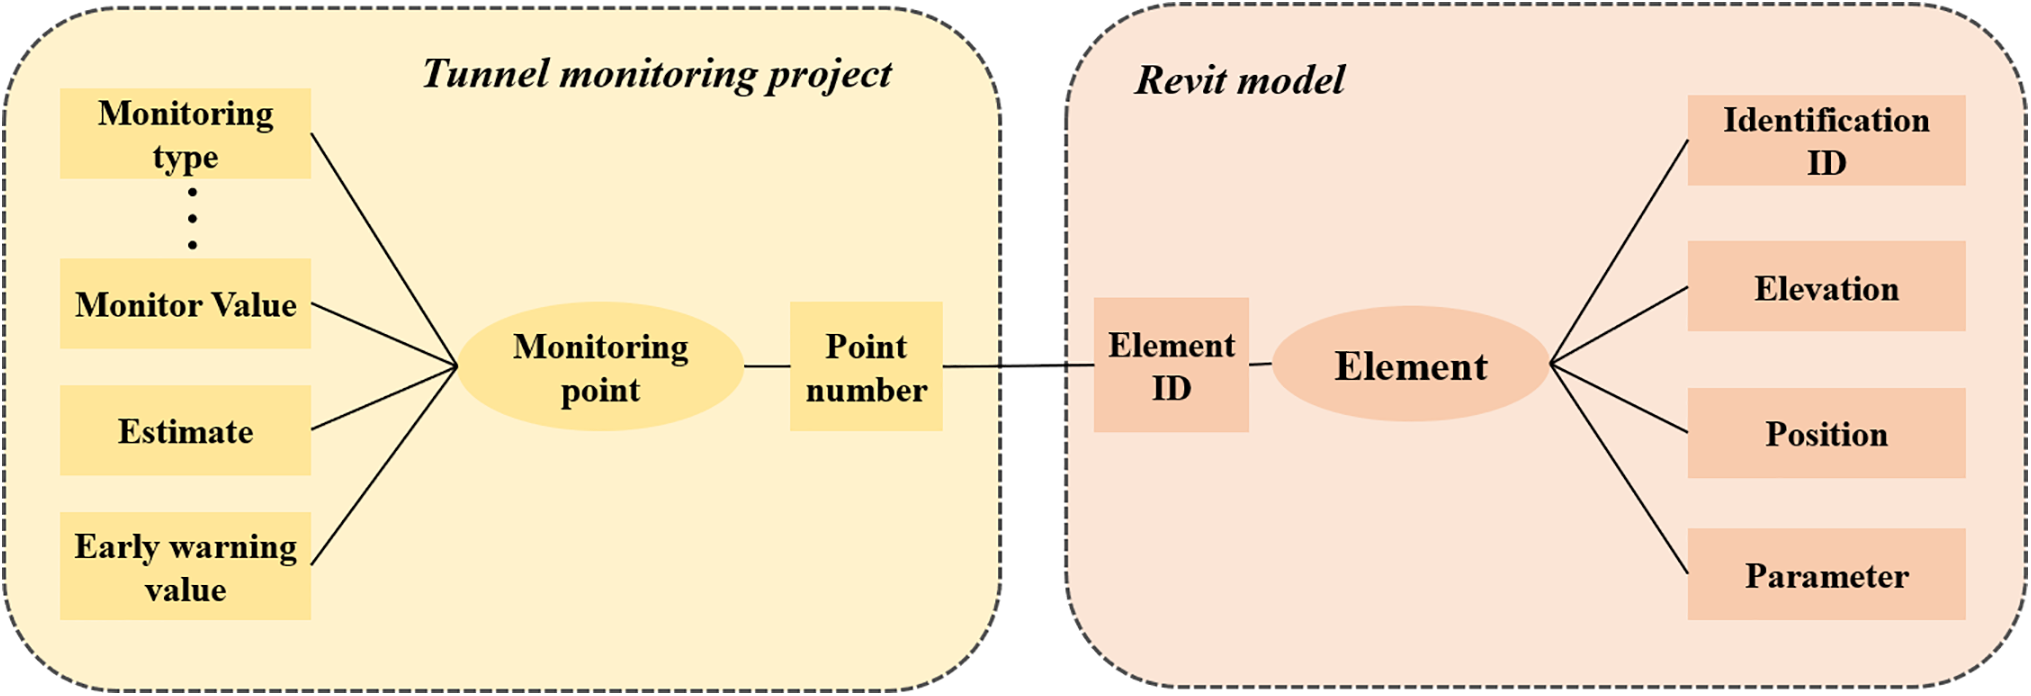
Figure 4: Actual measurement points correspond to Revit model elements
(1) Layout of monitoring points
The monitoring point layout function can be completed in two ways: first, import the measurement points into the corresponding positions of the Revit model based on the monitoring point layout plan. Second, convert the 3D coordinates from external data into the Revit coordinate system format, and then use the coordinate positioning function to precisely lay out the points. Next, select “Place Component” from the project menu, locate and select the displacement monitoring instrument family instance in the left-hand property panel, confirm the installation location in the window, load the monitoring point family instance, and enter the point number name (e.g., JC1, JC2, JC3, etc.) to ensure that each monitoring point in the Revit model corresponds to the ID name in the database. The layout of joint width measurement points and vertical displacement monitoring points is shown in Fig. 5. The layout of deformation monitoring points is based on the actual project conditions and initial simulation results. Since the MUT construction is achieved through segment splicing, the joints between segments are stress concentration points and require close attention in overall tunnel deformation monitoring. Therefore, monitoring points are placed at the deformation joints, and the spacing of displacement monitoring points is determined through a comprehensive consideration of parameters from previous studies.
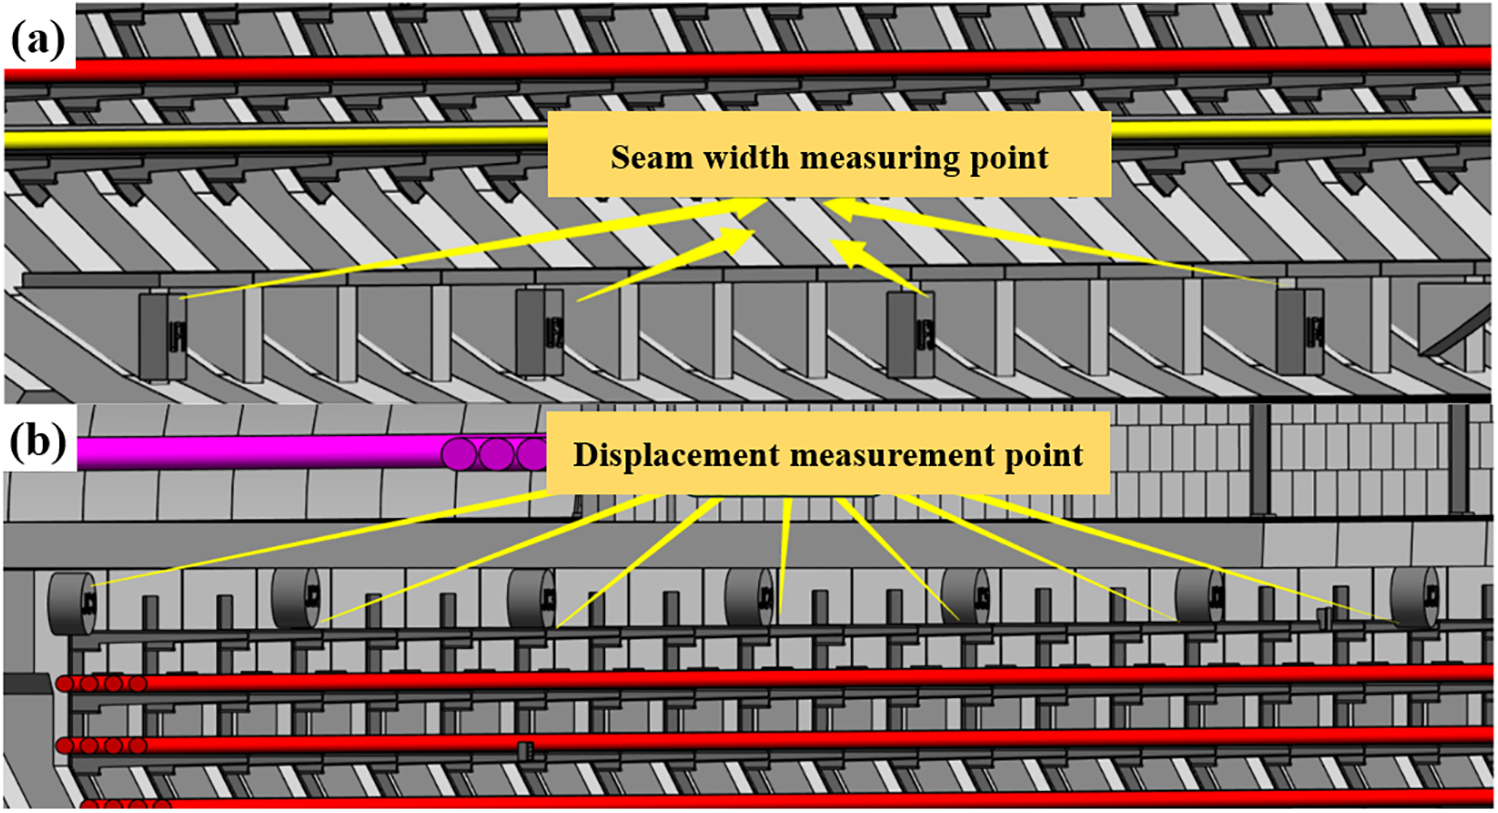
Figure 5: Layout of deformation monitoring points in the BIM model (a) Layout of joint width series (b) Layout of displacement measurement points
4.1 Development Environment Configuration
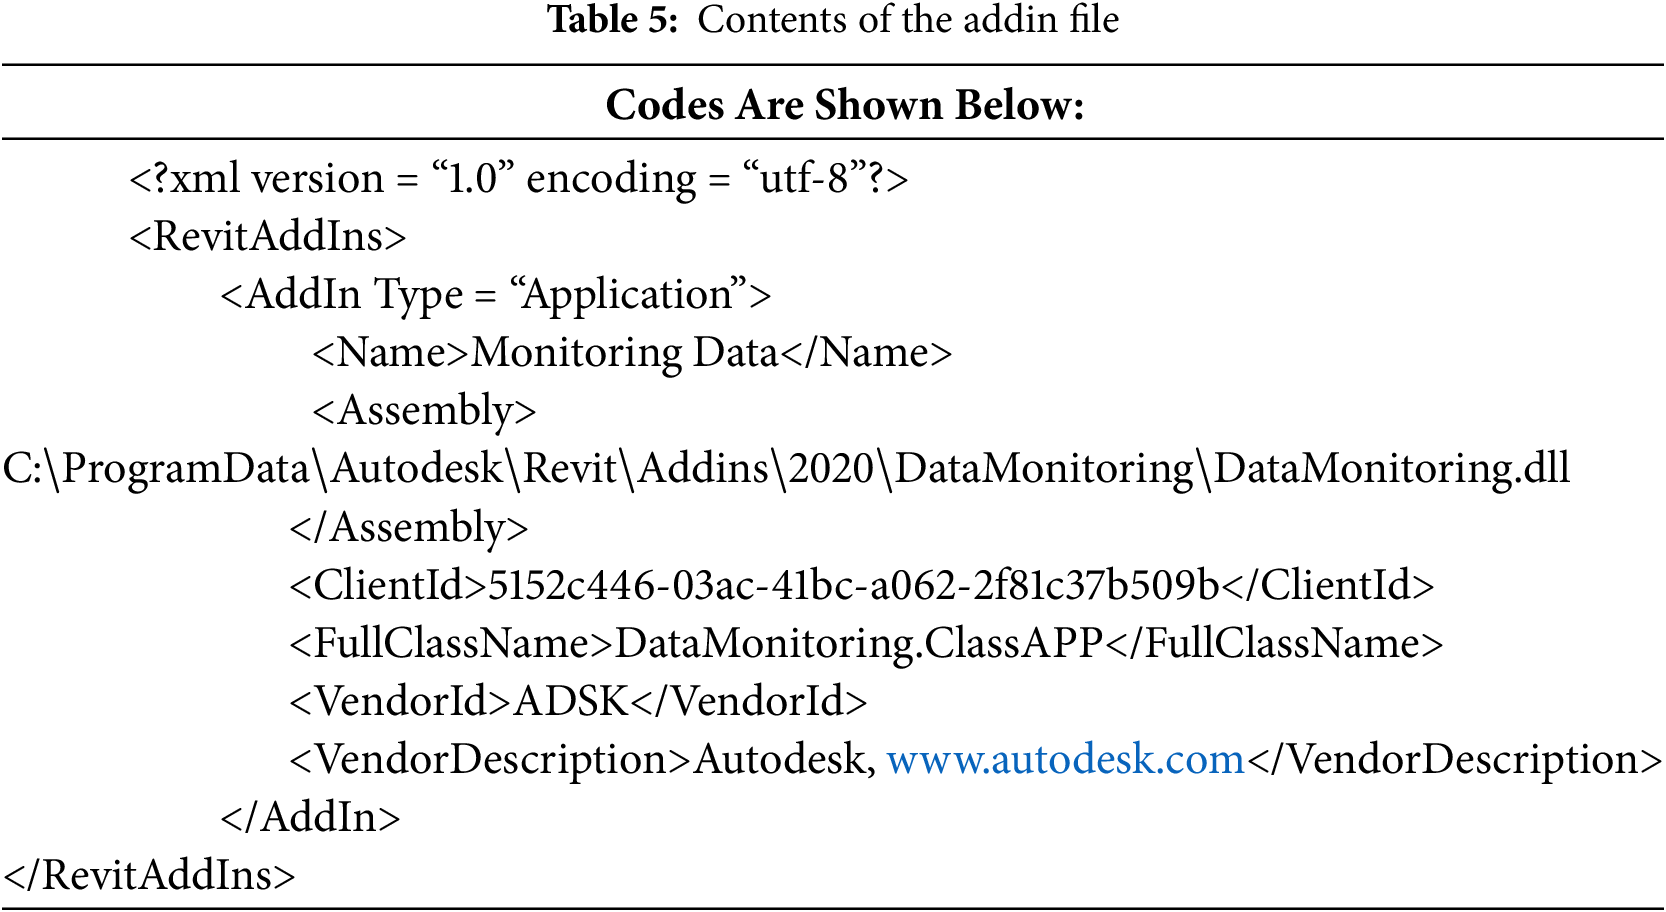
The software development environment used in this paper is Microsoft Visual Studio 2017, which utilises the NET framework and the C# programming language. By editing the addin file, this paper enables specific functions in Revit. Table 5 below provides an overview of the contents of the addin file.
In the safety inspection of MUTs, efficient storage and standardized management of monitoring data are crucial. Based on API compatibility and functional coverage, the CSV external database offers advantages such as cross-platform interaction, historical version maintenance, and risk isolation. It does not require professional database services, reduces deployment complexity, and realizes the integration of lightweight architecture and engineering applications. This module interfaces with the inspection database output interface, categorizing and storing data by measurement point ID. It establishes a structured database comprising “timestamp-measurement point ID-monitoring value” triplets, while linking to predefined measurement point attribute parameters such as coordinate IDs, design thresholds, and warning levels from the Revit model. In this study, the CSV file serves as the intermediate data format. Data is automatically collected by field sensors, and the data logger regularly generates standardized CSV files, saving them to a designated network directory. Each line in the file contains standardized fields: timestamp, sensor ID, and measured value. After the CSV data is automatically monitored, parsed, and verified by a dedicated Windows service, valid data is batch-entered into the database, with sensor ID used as the primary key to link time series data with static attributes. The CSV format is chosen for its compatibility with heterogeneous hardware, system stability, and ease of debugging. Its structured triple format creates a bridge between real-time monitoring data and the Revit BIM model, enabling associated mapping between dynamic data and model parameters via sensor ID. This CSV-based ETL process effectively supports seamless integration of monitoring data and the BIM model.
The main steps of this functional module are as follows:
(1) Settlement data monitoring: Output the settlement deformation monitoring results from the sensor and save them to an external database.
(2) Establish a connection between Revit and the database: Use the NPOI library to process csv files, which does not require a spreadsheet application, to efficiently read and process large amounts of data files, update monitoring data in real time, and dynamically synchronize it to the Revit model.
(3) WPF interface interaction: Open a WPF window in Revit to display measurement point data, and implement dynamic warnings using ExternalEvent and ExecuteEventHandler.
The early warning system comprises core functions, including automatic alarms and the positioning of measurement points, as illustrated in Fig. 6. When the user enables the function, the system traverses the database and analyzes all settlement records to accurately identify abnormal situations. If the monitoring data exceeds the early warning value, the system will trigger the following two response measures:
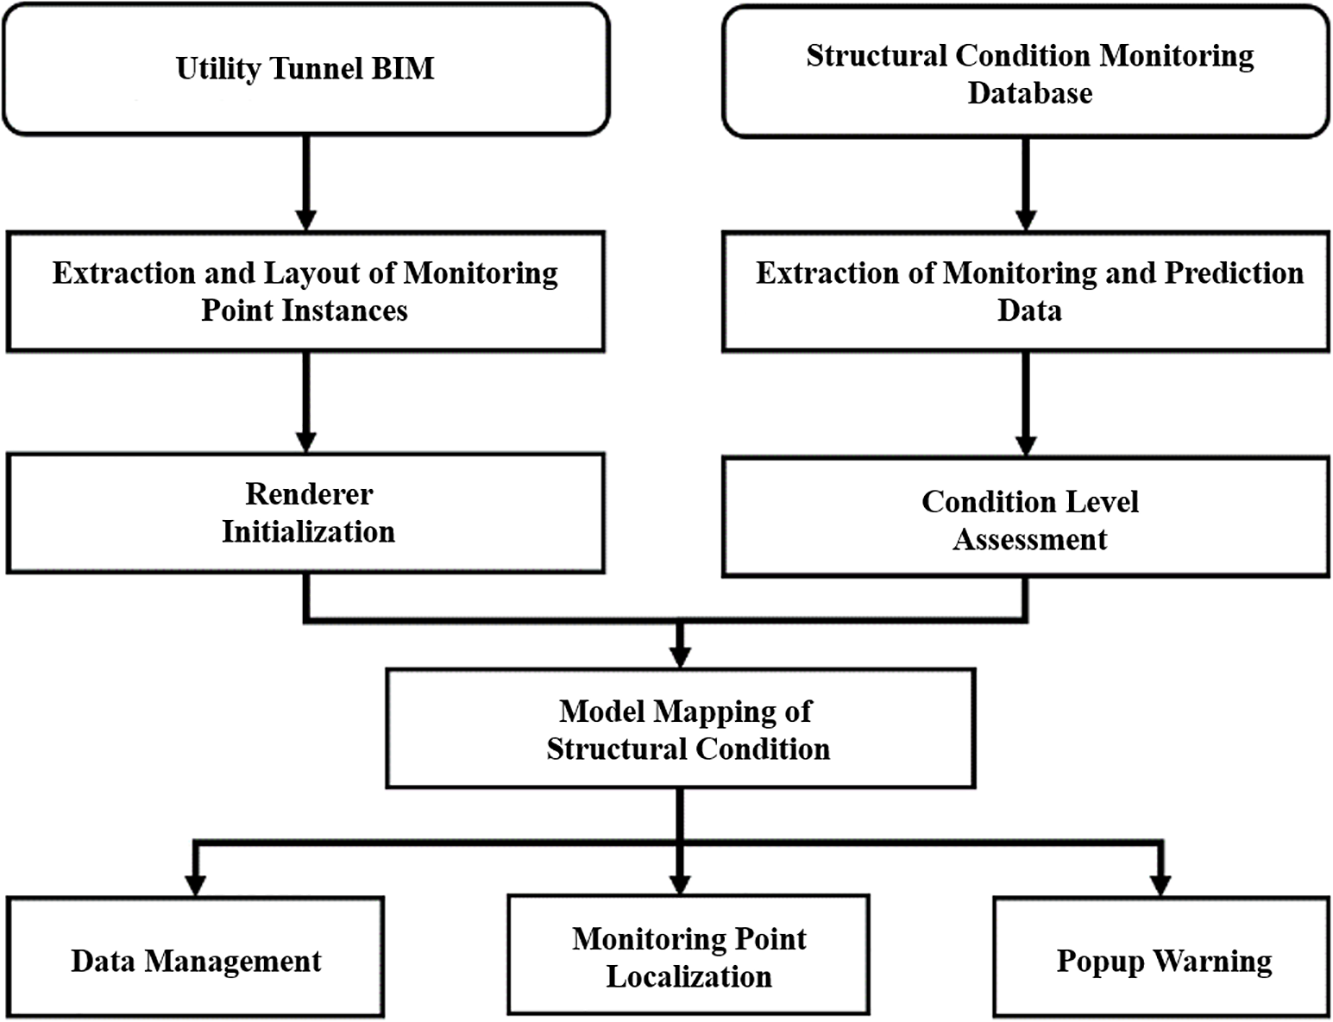
Figure 6: Implementation process of the settlement early warning function module
(1) Pop-up reminder: The system pops up a warning window through the graphical user interface (GUI). The window information includes measurement point displacement data, predicted date, early warning level, and other relevant details, notifying appropriate personnel in real-time of potential future settlement risks. This enables project managers to take necessary response measures in a timely manner.
(2) 3D model positioning: The system will automatically locate dangerous components that exceed the warning value in the 3D model of the MUTs tunnel. Through visualization technology, it intuitively displays their specific locations, helping engineering personnel quickly identify risk areas.
When developing a tunnel monitoring visualization plugin, the choice of graphical interface technology affects data presentation and system performance. The mainstream C# frameworks include WinForm and WPF. Among these, WPF is based on DirectX rendering, supporting hardware acceleration, smooth animations, and complex graphic displays. It also offers high-resolution compatibility and data binding capabilities, making it suitable for monitoring data visualization. The process for developing a WPF interface is as follows:
(1) Create a new WPF application project in the Visual Studio 2017 development environment.
(2) Add a new window (Window) to the project as the interactive interface container.
(3) Use the visual designer to build the monitoring panel and configure control styles.
(4) Implement data templates, animations, and control bindings using XAML to achieve synchronization between monitoring data and the interface.
(5) Write event handlers to support data import, interaction, and Revit API calls.
(6) Use the VS debugger to verify interface logic in real time and ensure data flow synchronization with the UI.
The general technical flow chart for implementing the MUTs early warning function in the article is shown in Fig. 7. It is generally divided into three parts: building the visual model of the MUT on the Revit platform, then redeveloping the Revit plug-in using a programming language to serve as a communication platform between the field sensor data and the digital parameters on the Revit platform. After such a design, data management and import can be performed in the following steps, allowing the BIM platform to assess and issue warnings based on the data.
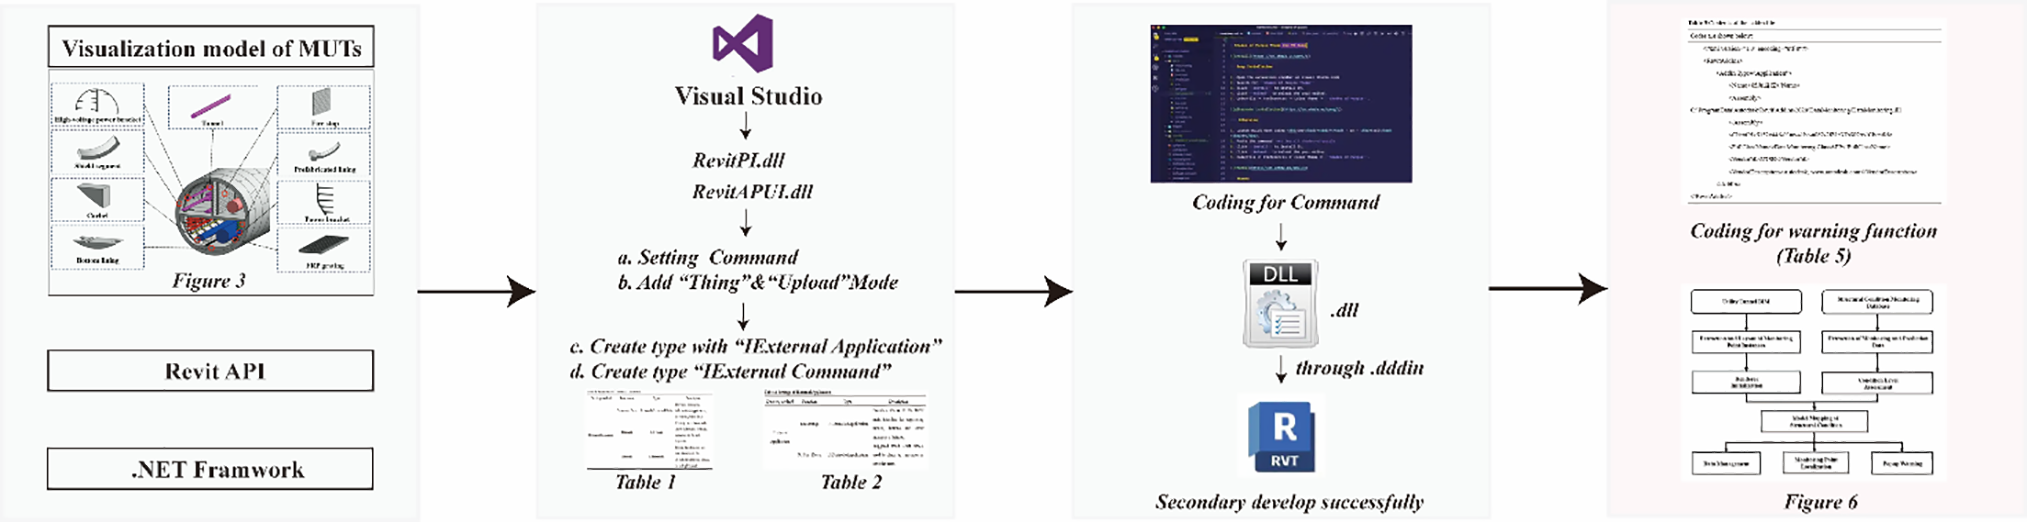
Figure 7: General technical flow chart
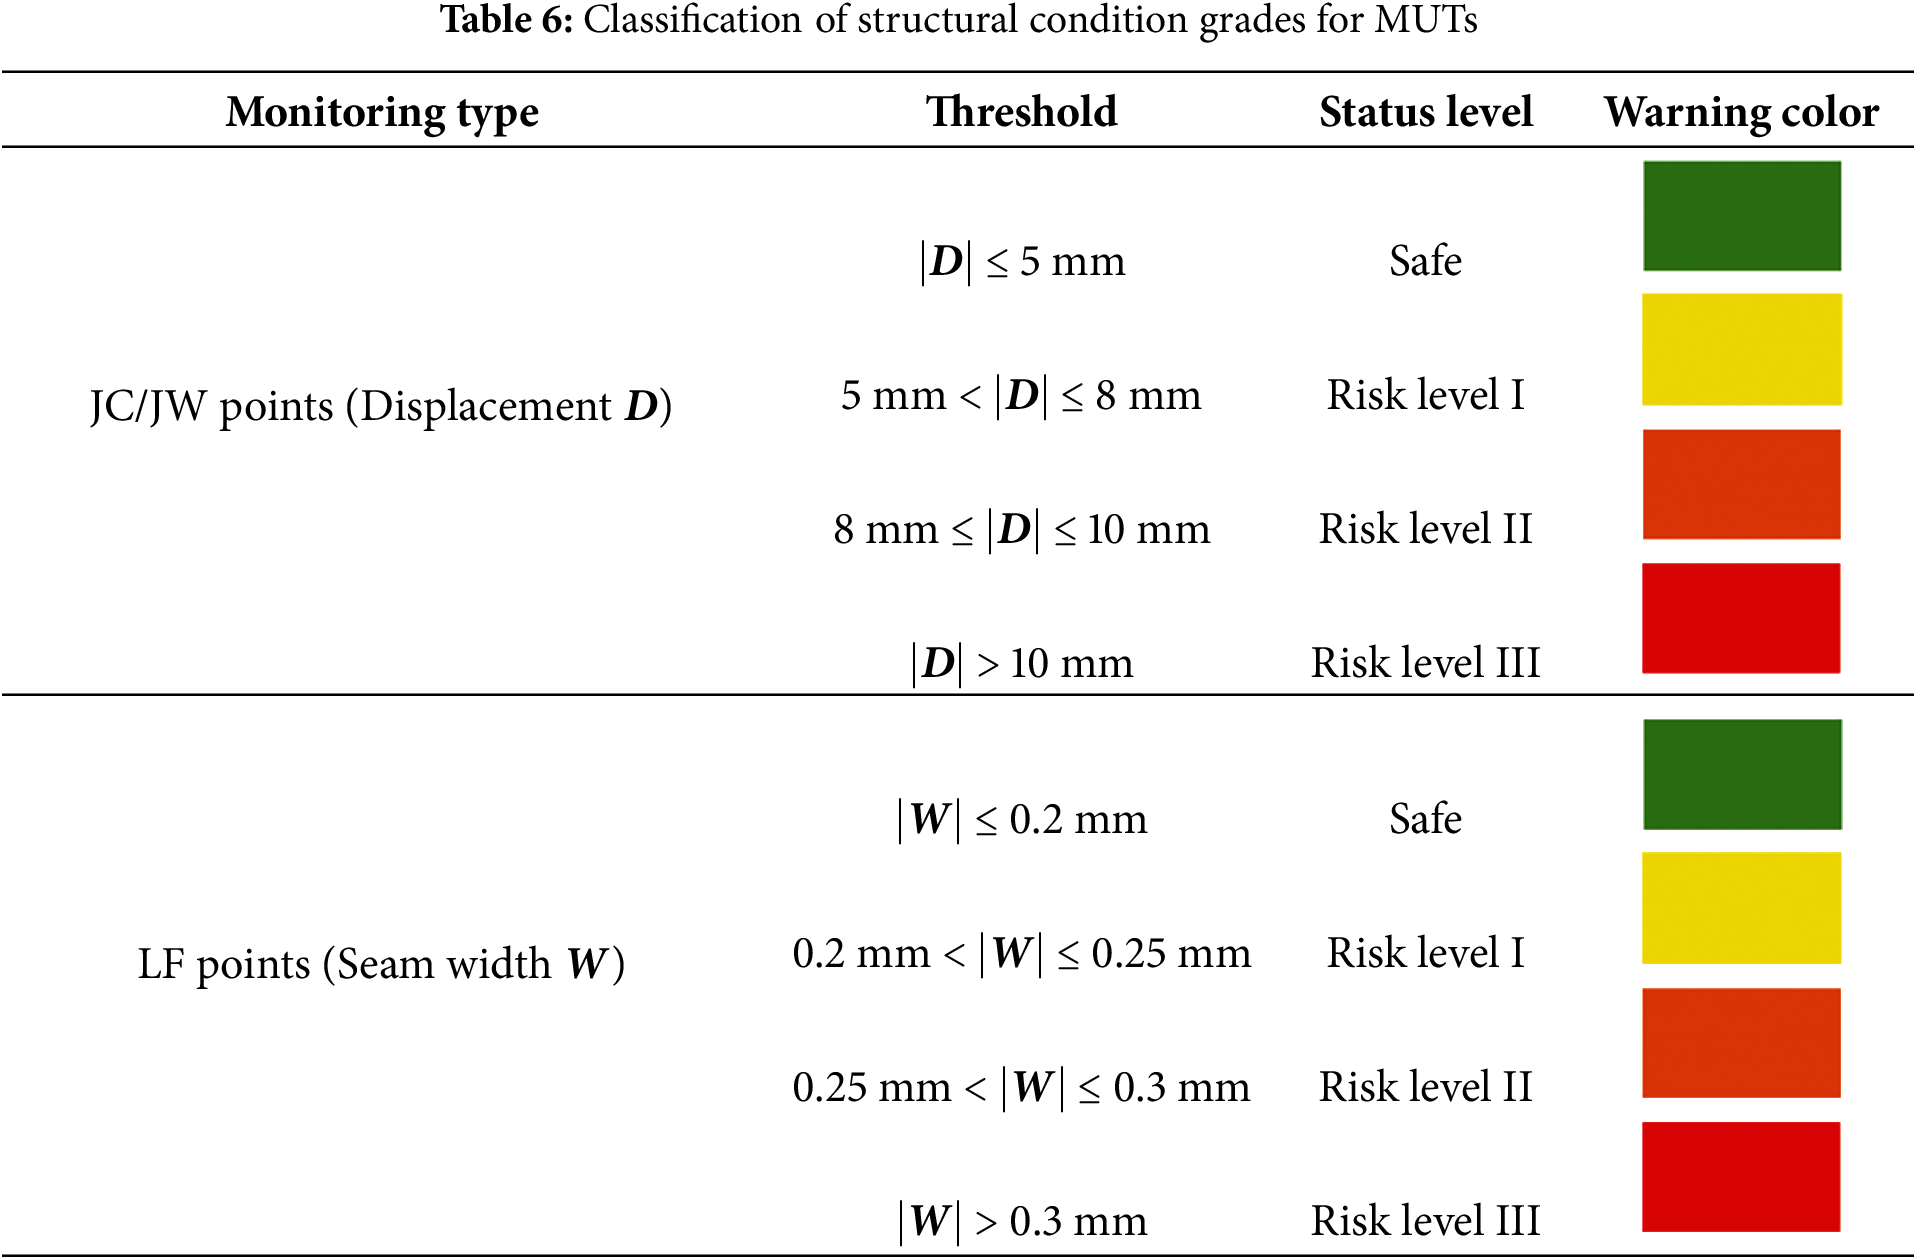
4.5 Example and Model Measurement Point Mapping
Table 6 shows the classification of the structural condition of MUTs. The settlement levels of monitoring points are classified as usual, Level I, Level II, and Level III. The BIM model is used to map the status of measurement points in real-time, and a multi-level colour identification system is employed to visualise early warnings of the structural safety status of tunnels. The early warning views for each early warning level corresponding to the monitoring points are shown below.
The final presentation of the interface design of this paper is shown below:
(1) Double-click the “Data Management” function to display the measurement point settlement data interface as shown in Fig. 8, which displays a structured database constructed with measurement point numbers as indexes, dynamically aggregating the settlement sequence values of each measurement point, and whose data structure contains real-time monitoring values.
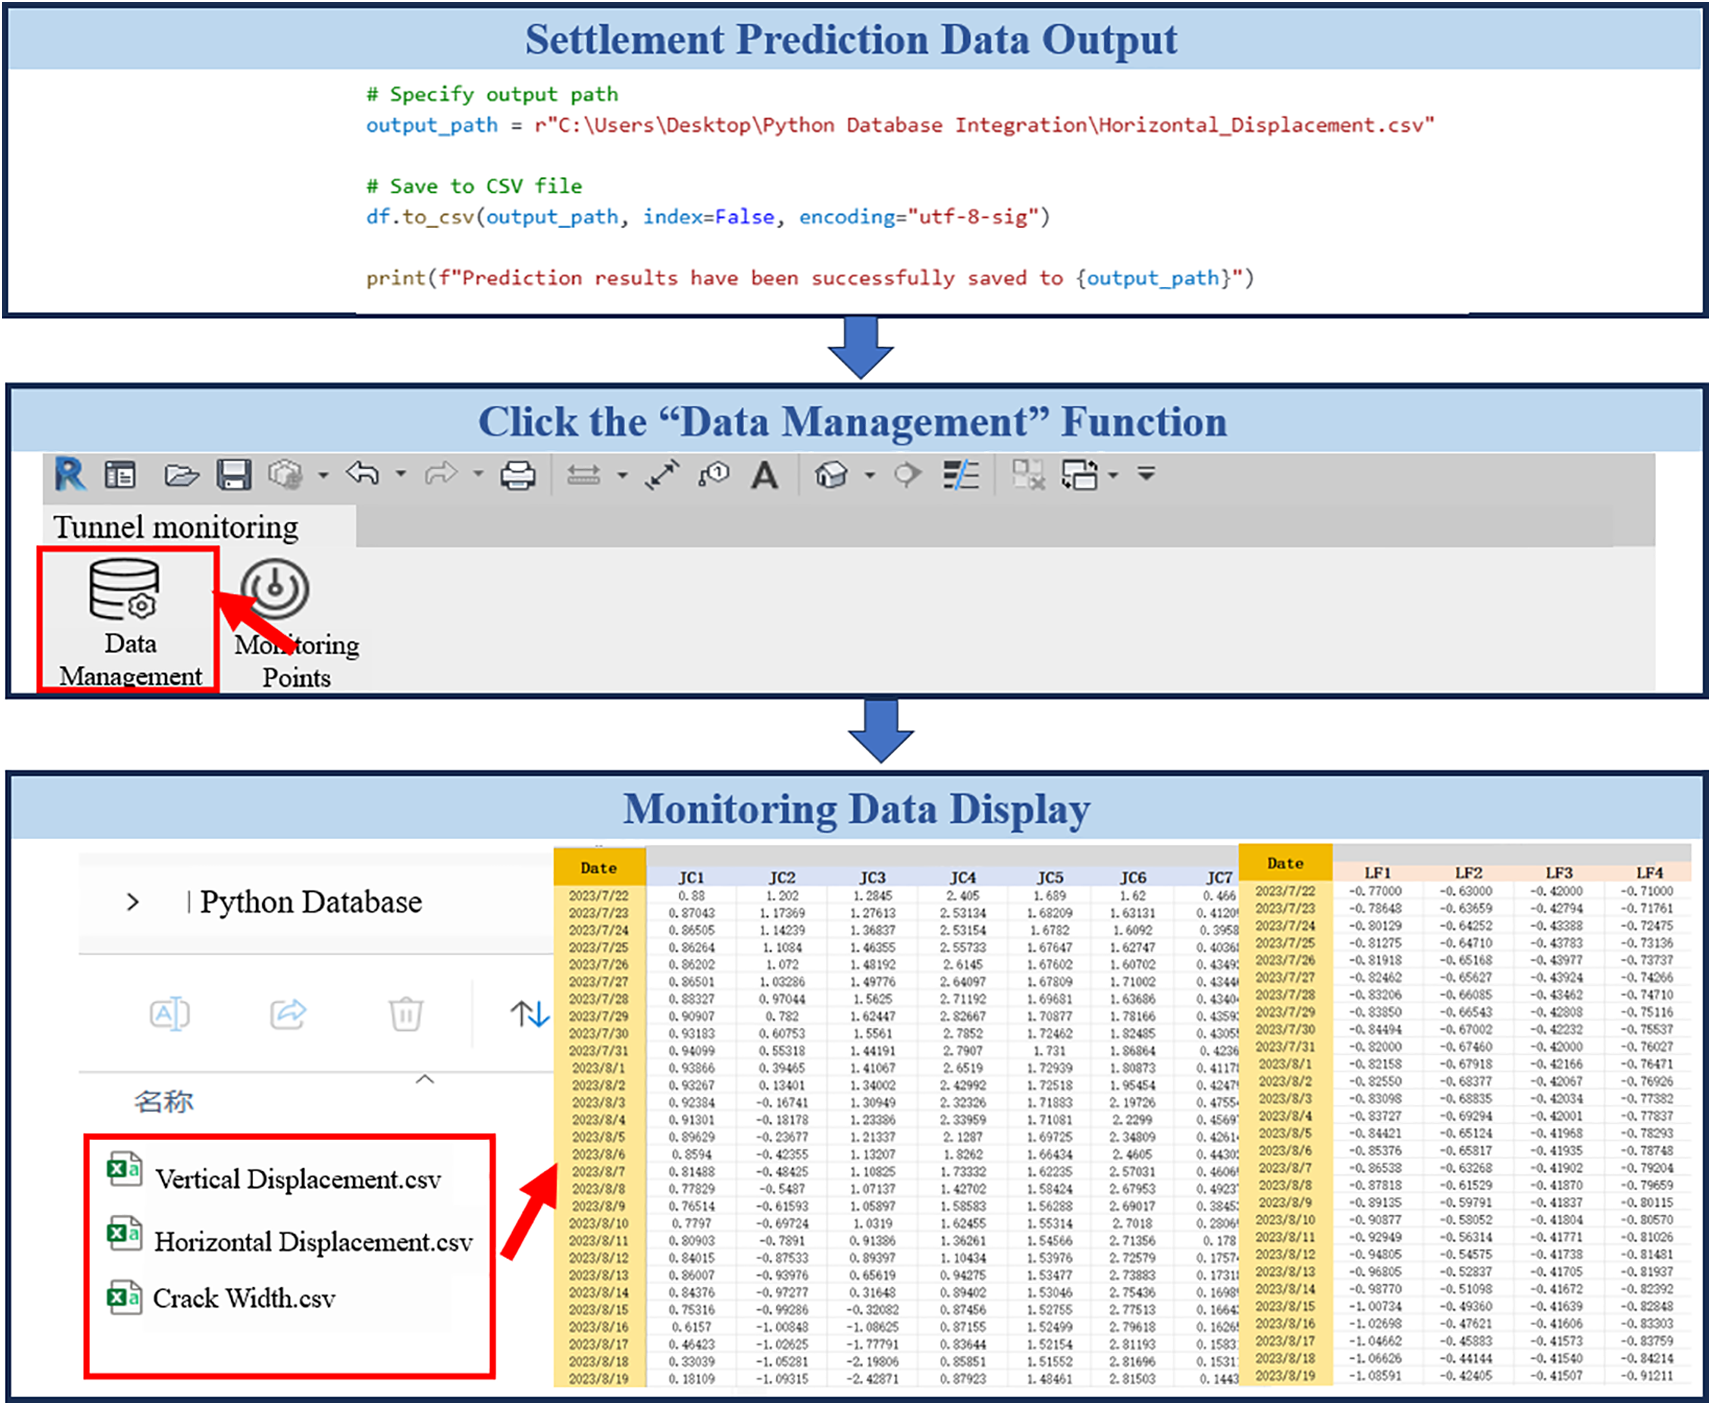
Figure 8: Data management interface
(2) Click “Monitoring Points”. The program automatically parses the type characteristics of all deformation monitoring point families under the current project by calling the database containing deformation data. Users can select target monitoring points and configure warning thresholds through a visual interactive interface. The system retrieves deformation monitoring time-series data tables from the database in real-time, identifies data exceeding thresholds, and simultaneously pushes warning information containing key indicators, such as point numbers, measured values, and timestamps, to the visual monitoring platform, finally displaying it in the developed “Monitoring Point Warning” interactive window.
Selecting 07 January 2024, as the monitoring date and using crack width monitoring point LF1 as an example, the visualization and early warning process is shown in Fig. 9. The system successfully detected a Level III warning for LF1, which matched the measured data exactly, confirming its accuracy. To further assess stability and reliability, additional monitoring points JC1 and JC3 were tested, and the results (Fig. 10) show that the system can accurately identify warning statuses, automatically generate outputs, and map them to specific three-dimensional locations. This enables clear three-dimensional visualization of warnings and facilitates the quick localization of abnormal deformation areas.
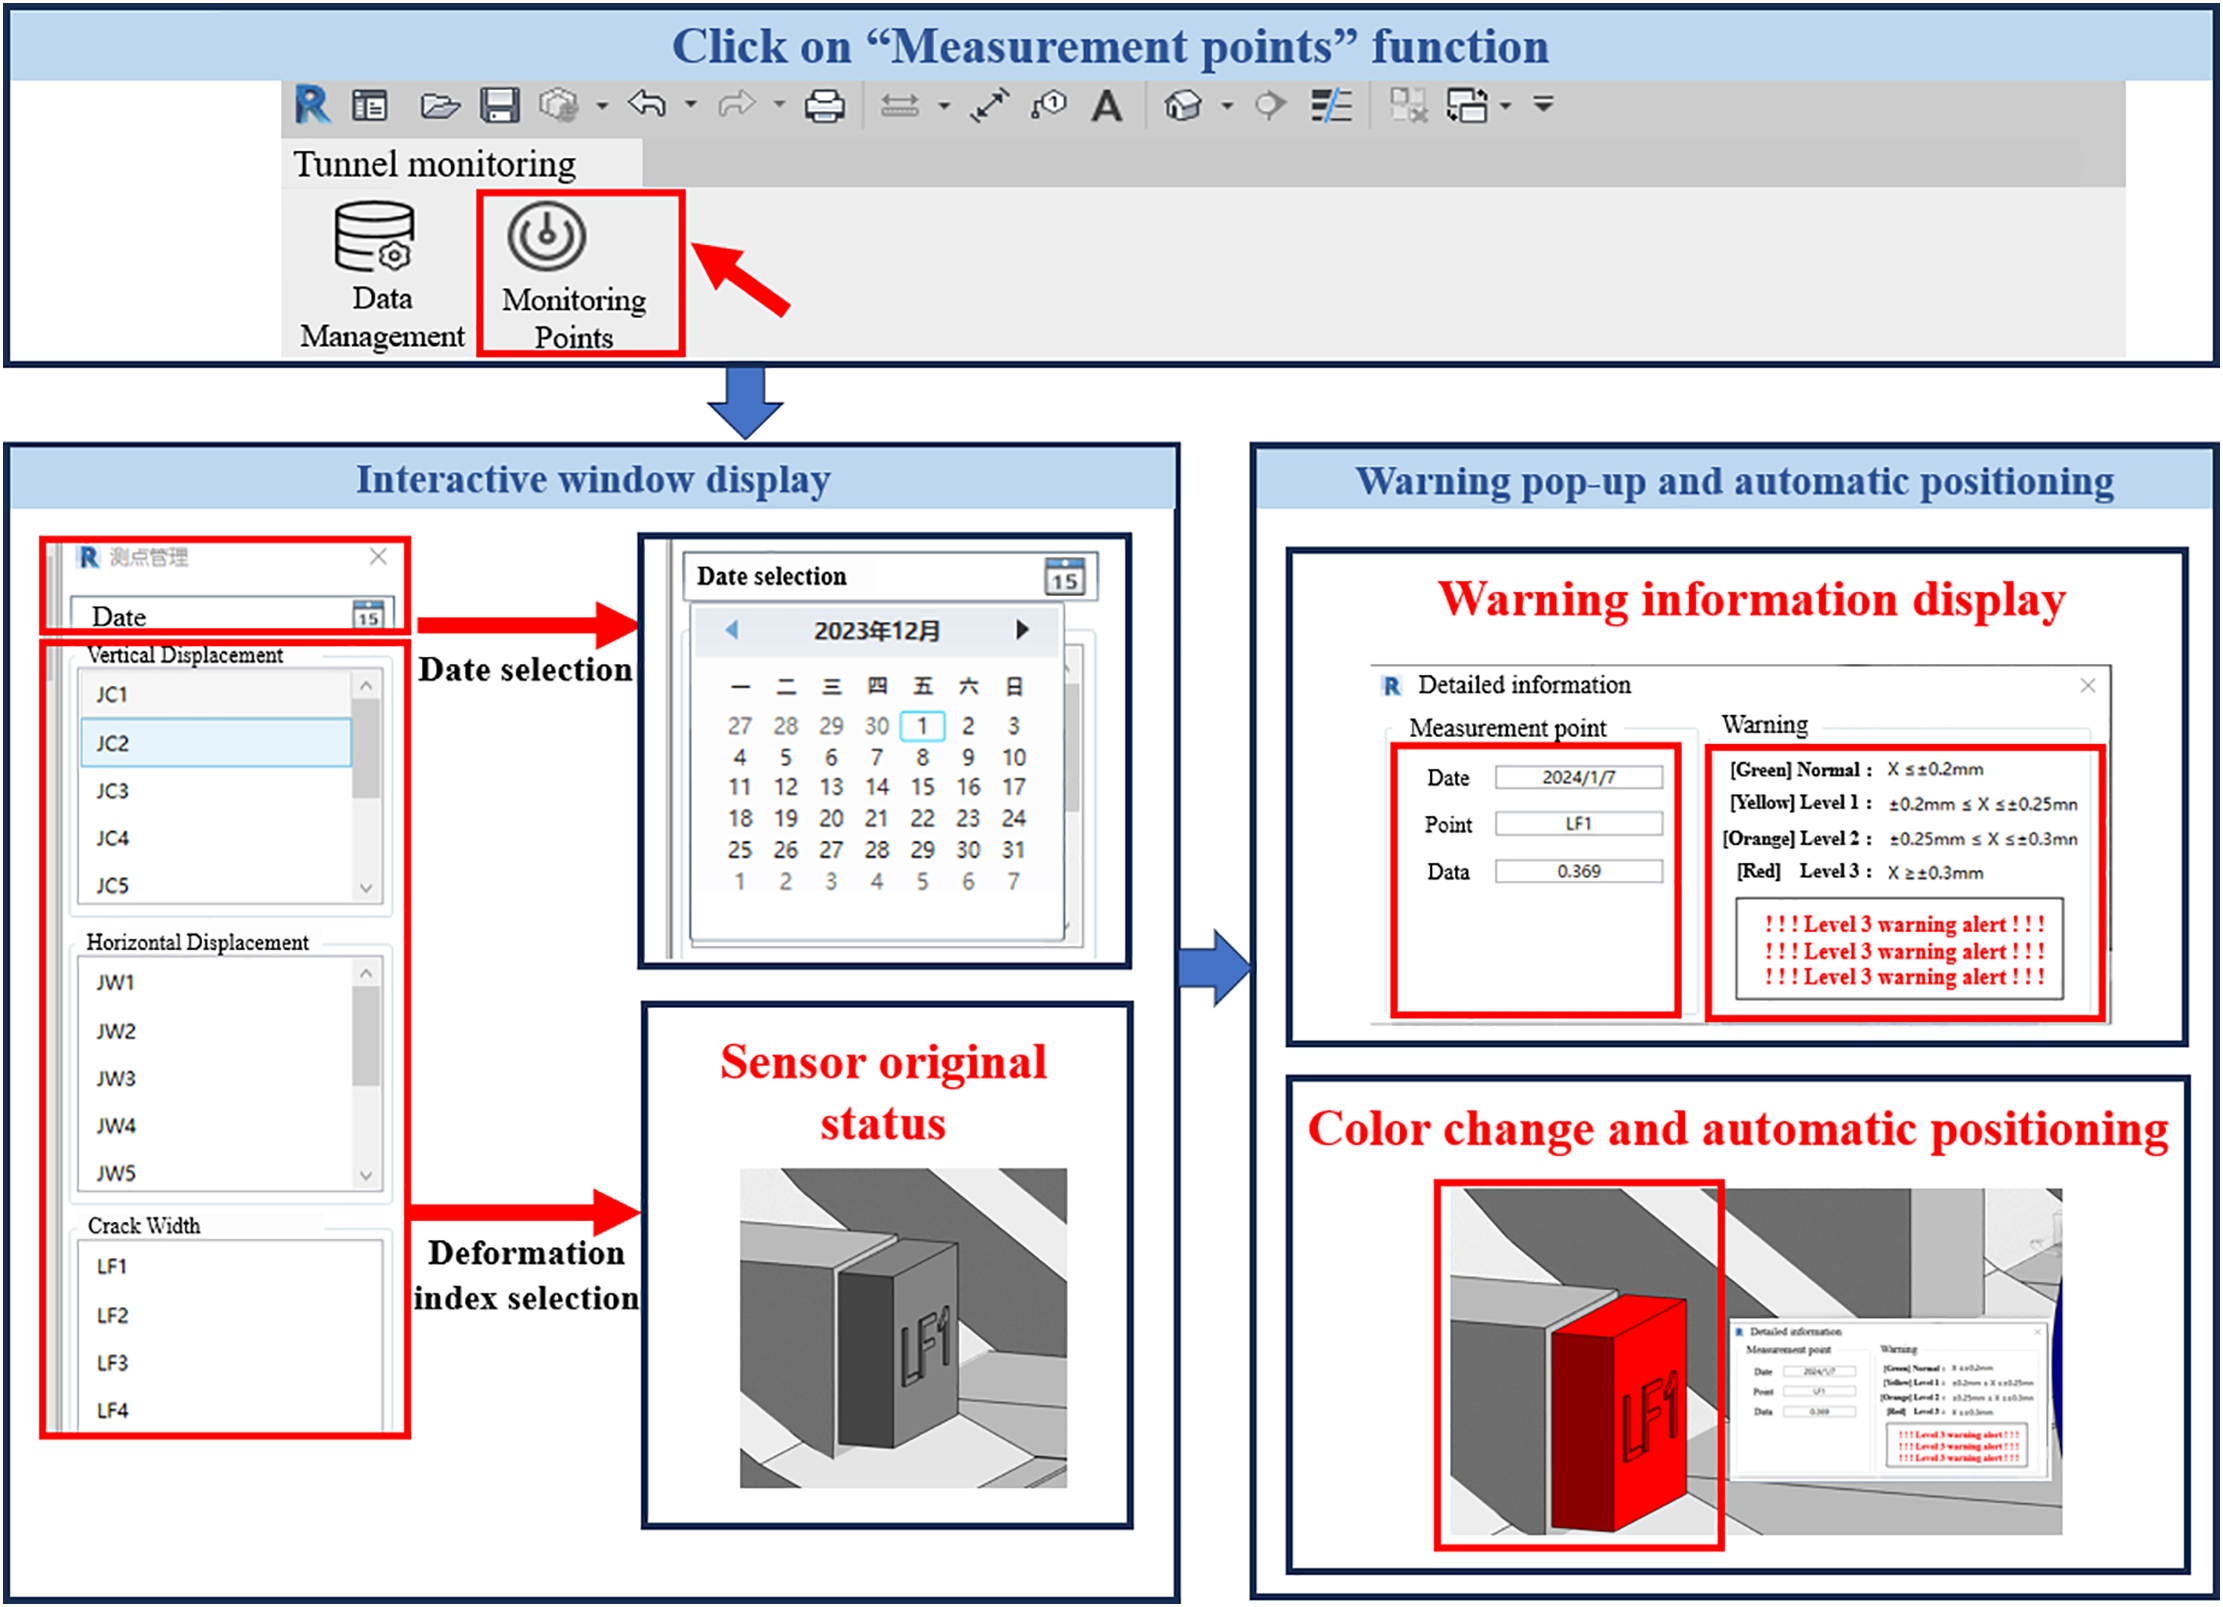
Figure 9: Warning prompt effect of LF1 deformation monitoring points in the BIM model
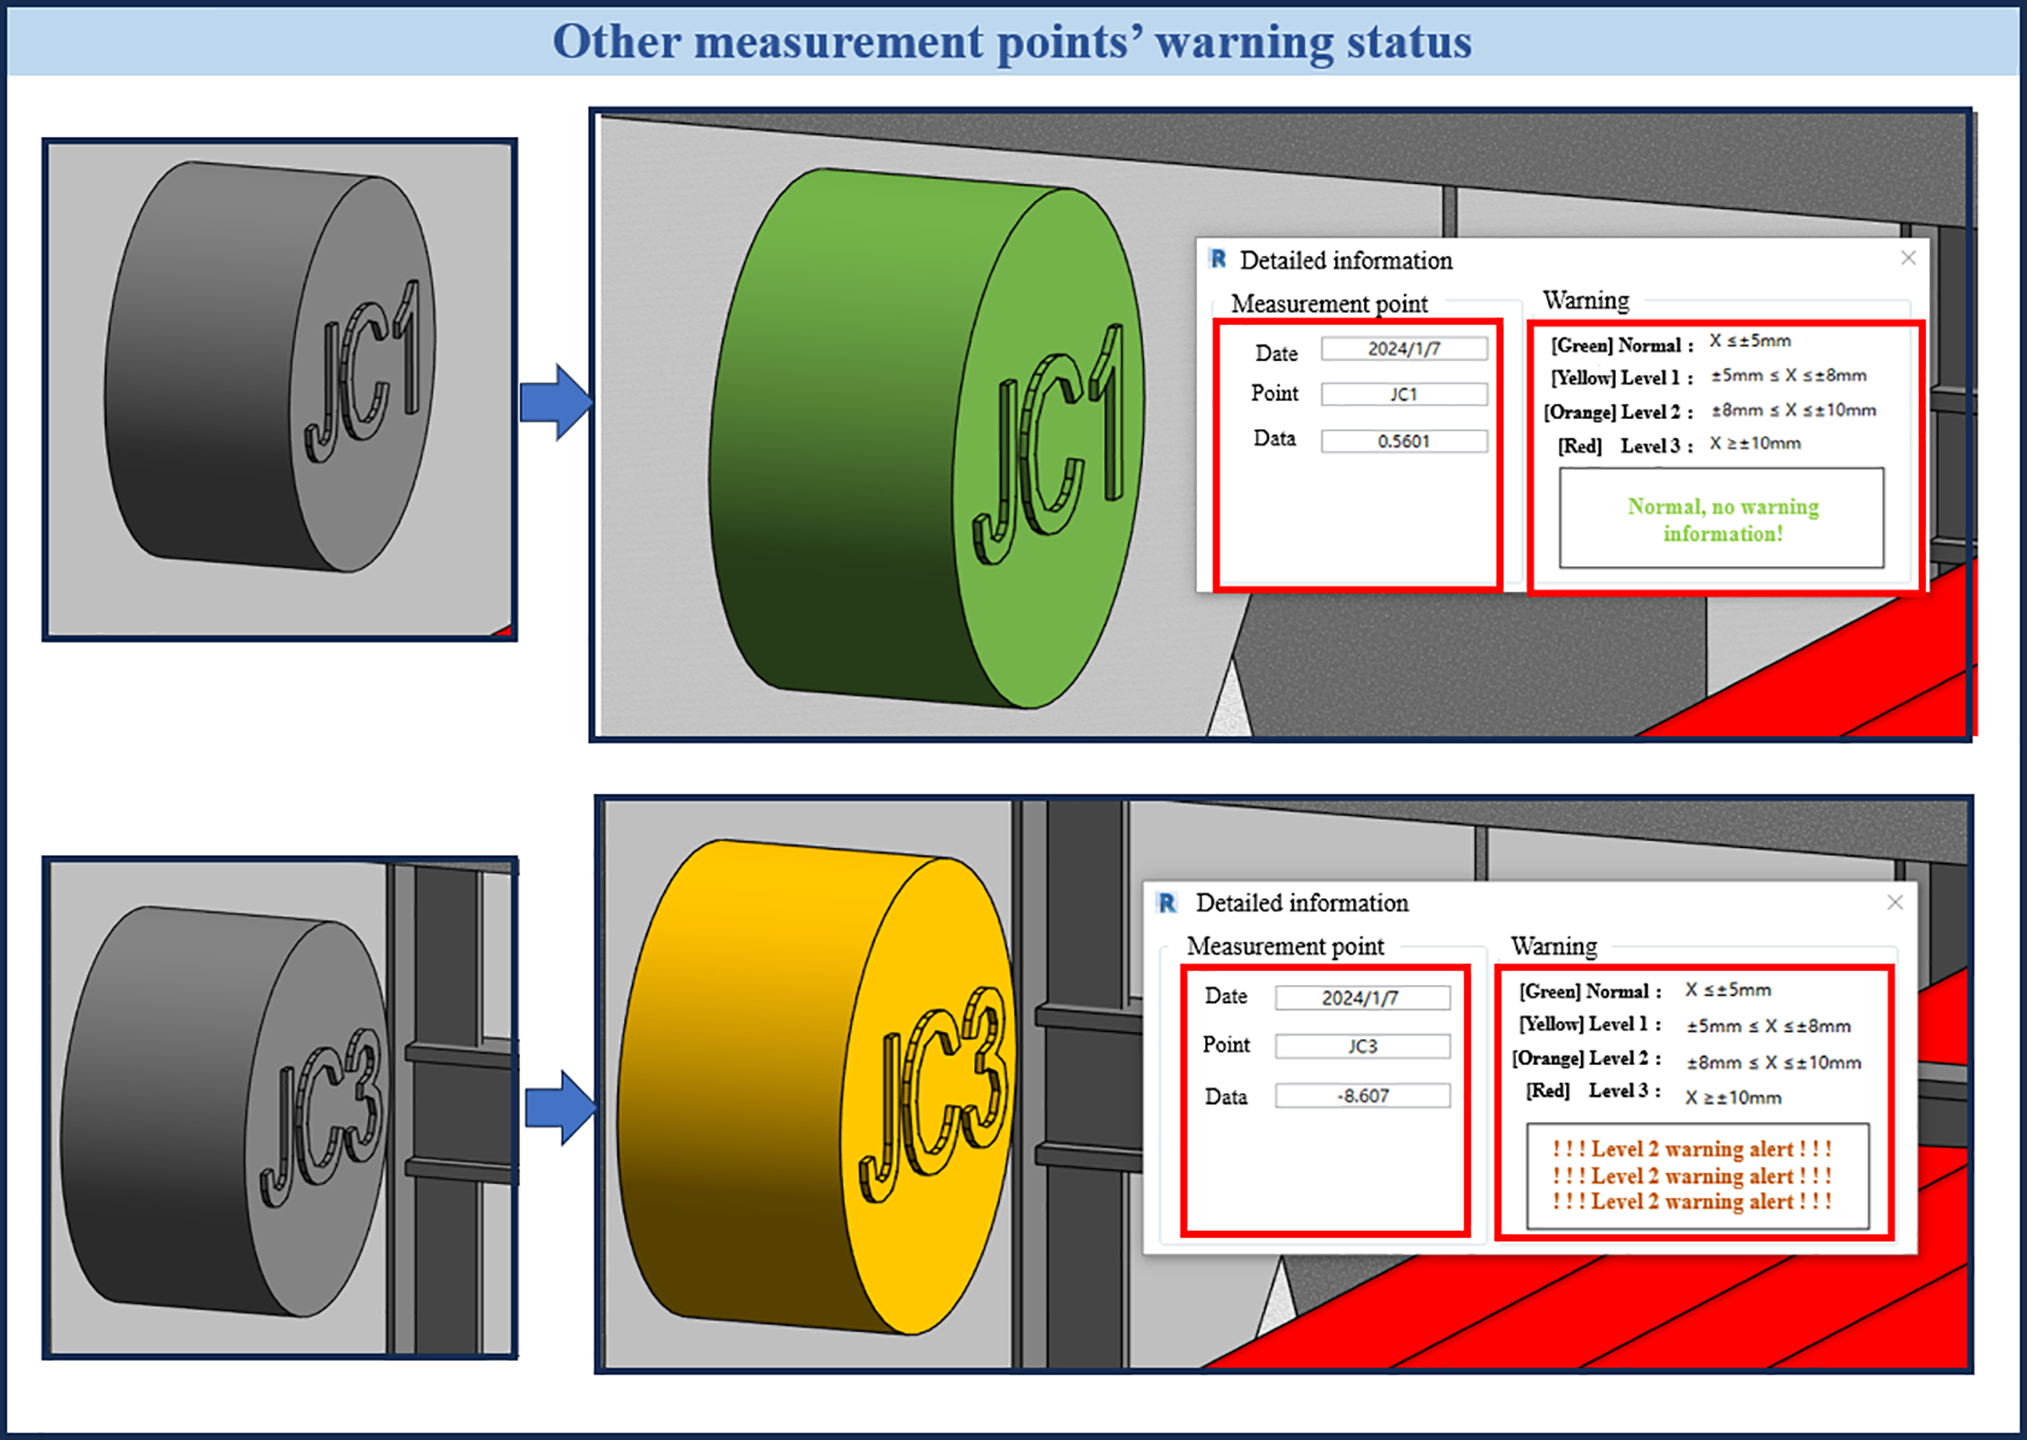
Figure 10: Warning status of other measurement points
Compared to traditional monitoring methods that mainly rely on two-dimensional time history curves or table data [51], the proposed BIM-based system provides spatially explicit visualization, enabling the direct identification of abnormal areas within the tunnel model. Similar visualization studies, such as [52], have incorporated monitoring data into BIM models but often lack automated risk assessment or high-precision spatial positioning. Others, like [53,54], have attempted real-time monitoring integration, but their research did not address the accuracy and timeliness of localization. In contrast, the proposed system achieves automatic spatial positioning with an error within ±1 mm and delivers a warning response within 10 s, representing significant advances in both accuracy and efficiency. These improvements not only validate the feasibility of the project but also showcase the system’s superiority in enhancing the intelligence and timeliness of MUT safety management.
Although the case study at monitoring points showed that the system can accurately identify and localize a Level III warning, this example alone might seem overly idealized if the risks of false alarms or missed alarms are not considered. In real-world conditions, monitoring data are inevitably affected by sensor noise, environmental disturbances, and data transmission delays, which can lead to false warnings or conceal genuine anomalies. The verification using JC1 and JC3 further supports the system’s reliability. However, the current dataset is limited and cannot entirely rule out the possibility of false positives or negatives. Compared to traditional two-dimensional monitoring systems, which often depend on manual interpretation and can lead to delayed or inconsistent warning decisions, the proposed BIM-based approach minimizes these risks by combining spatial localization with time-sequence verification. Still, large-scale and long-term testing will be necessary to measure false alarm accurately and missed alarm rates, representing an essential focus for future research.
This study developed a BIM-based visualization plug-in for MUTs monitoring, integrating monitoring data with 3D BIM models through the Revit platform. A detailed 3D BIM model of a MUT project in Ningbo was created using Revit parametric modeling, with 18 deformation measurement points deployed spatially to monitor two key indicators: displacement and crack width. A parametric model containing these 18 measurement points was built, and a secondary development framework based on C# and the Revit API enabled four core functions: measurement point layout, data integration, visualization analysis, and early warning feedback. The system successfully achieved automatic spatial localization (error < ±1 mm), rapid response (within 10 s), and accurate risk identification, verified by detecting a Level III warning consistent with field data. Compared with traditional two-dimensional monitoring methods, the proposed three-dimensional BIM visualization system offers more accurate, intelligent, and intuitive support for monitoring, operation, and maintenance of MUTs, demonstrating strong engineering applicability and potential for broader adoption in underground infrastructure management.
Acknowledgement: Not applicable.
Funding Statement: The authors wish to acknowledge that they were supported by the Scientific Research Projects of the Education Department of Zhejiang Province (Grant No. Y202454744), the Ningbo Public Welfare Science and Technology Project (Grant No. 2024S077), International Sci-tech Cooperation Projects under the “Innovation Yongjiang 2035” Key R&D Programme (No. 2024H019) and the Ningbo Key R&D Program (Grant No. 2024Z287).
Author Contributions: The authors confirm contribution to the paper as follows: study conception and design: Ping Wu, Jie Zou; data collection: Ping Wu, Jie Zou; analysis and interpretation of results: Yidong Xu, Wangxin Li; draft manuscript preparation: Jie Zou, Wangxin Li. All authors reviewed the results and approved the final version of the manuscript.
Availability of Data and Materials: The data supporting the findings of this study are available from the corresponding author upon reasonable request.
Ethics Approval: Not applicable.
Conflicts of Interest: The authors declare no conflicts of interest to report regarding the present study.
References
1. Genger KT, Hammad A, Oum N. Multi-objective optimization for selecting potential locations of multi-purpose utility tunnels considering agency and social lifecycle costs. Tunn Undergr Space Technol. 2023;140(4):105305. doi:10.1016/j.tust.2023.105305. [Google Scholar] [CrossRef]
2. Genger TK, Luo Y, Hammad A. Multi-criteria spatial analysis for location selection of multi-purpose utility tunnels. Tunn Undergr Space Technol. 2021;115(8):104073. doi:10.1016/j.tust.2021.104073. [Google Scholar] [CrossRef]
3. Alaghbandrad A, Hammad A. Framework for multi-purpose utility tunnel lifecycle cost assessment and cost-sharing. Tunn Undergr Space Technol. 2020;104(3):103528. doi:10.1016/j.tust.2020.103528. [Google Scholar] [CrossRef]
4. Li ZC, Wang GH, Hao JW, Zhou Y, Wang XY, Xuan H, et al. The influence of construction scheme of asymmetric three-cabin utility tunnelling on the surface settlement behaviour. KSCE J Civ Eng. 2021;25(9):3568–82. doi:10.1007/s12205-021-1636-y. [Google Scholar] [CrossRef]
5. Tang XW, Gan PL, Liu W, Zhao Y. Surface settlements induced by tunneling in permeable strata: a case history of Shenzhen Metro. J Zhejiang Univ Sci A. 2017;18(10):757–75. doi:10.1631/jzus.A1600522. [Google Scholar] [CrossRef]
6. Camós C, Molins C, Arnau O. Case study of damage on masonry buildings produced by tunneling induced settlements. Int J Archit Herit. 2014;8(4):602–25. doi:10.1080/15583058.2012.704479. [Google Scholar] [CrossRef]
7. Senthilnath GT, Velu D. Stacked tunnelling induced surface settlements in soft soil—a case study from Singapore. Int J Geoengin Case Hist. 2016;3(3):162–75. [Google Scholar]
8. Wang T, Fan H, Wang K, Wang L, Zhou G. Reliability analysis and risk assessment for settlement of cohesive soil layer induced by undercrossing tunnel excavation. Sustainability. 2024;16(6):2356. doi:10.3390/su16062356. [Google Scholar] [CrossRef]
9. Wang X, Wang M, Jiang R, Xu J, Li B, Wang X, et al. Impact of battery electric vehicles on ventilation design for road tunnels: a review. Tunn Undergr Space Technol. 2023;134:105013. doi:10.1016/j.tust.2023.105013. [Google Scholar] [CrossRef]
10. Wang X, Wang M, Jiang R, Xu J, Li B, Wang X, et al. Structural deformation monitoring during tunnel construction: a review. J Civ Struct Health Monit. 2024;14(3):591–613. doi:10.1007/s13349-023-00741-1. [Google Scholar] [CrossRef]
11. Wang J, Hou X, Deng X, Han H, Zhang L. Application of BIM in tunnel design with compaction pile reinforced foundation carrying carbon assessment based on advanced dynamo visual programming: a case study in China. Sustainability. 2022;14(23):16222. doi:10.3390/su142316222. [Google Scholar] [CrossRef]
12. Cao Y, Gong Z, Li N, Wang Q. How to guarantee the sustainable operation and maintenance of urban utility tunnels? from the perspective of stakeholder and the whole life cycle. Buildings. 2023;13(7):1810. doi:10.3390/buildings13071810. [Google Scholar] [CrossRef]
13. Zhou Z, Zhou Z, Lu C, He C. A tunnel structure health monitoring method based on surface strain monitoring. J Civ Struct Health Monit. 2024;14(5):1339–67. doi:10.1007/s13349-024-00788-8. [Google Scholar] [CrossRef]
14. Zhang Y, Li X. Monitoring and analysis of subway tunnel thermal environment: a case study in Guangzhou, China. Sustain Cities Soc. 2020;55(5):102057. doi:10.1016/j.scs.2020.102057. [Google Scholar] [CrossRef]
15. Hsu WL, Ouyang Z, Dong Z, Wu F, Chiu CY, Liarng RH. Evaluation of procurement of environment monitoring equipment for tunnel construction. Sens Mater. 2022;34(6):2213. doi:10.18494/sam3825. [Google Scholar] [CrossRef]
16. Tichy T, Broz J, Stefan J, Pirnik R. Failure analysis and data-driven maintenance of road tunnel equipment. Results Eng. 2023;18(1):101034. doi:10.1016/j.rineng.2023.101034. [Google Scholar] [CrossRef]
17. Chen MF, Chiu HC, Tseng KS, Yang YC, Chou CY, Jiang JA. An IoT-based temperature monitoring system for underground cable tunnels. In: 2019 IEEE PES GTD Grand International Conference and Exposition Asia (GTD Asia); 2019 Mar 19–23; Bangkok, Thailand. p. 960–4. doi:10.1109/GTDAsia.2019.8715849. [Google Scholar] [CrossRef]
18. Strauss A, Bien J, Neuner H, Harmening C, Seywald C, Österreicher M, et al. Sensing and monitoring in tunnels testing and monitoring methods for the assessment of tunnels. Struct Concr. 2020;21(4):1356–76. doi:10.1002/suco.201900444. [Google Scholar] [CrossRef]
19. Xu P, Wu Y, Ma Z. Prediction of icicles on lining surface in high-speed railway tunnel in severe cold region based on the characteristics of daily temperature fluctuation. Results Eng. 2024;23(2):102627. doi:10.1016/j.rineng.2024.102627. [Google Scholar] [CrossRef]
20. Bjelland H, Njå O, Heskestad AW, Braut GS. Emergency preparedness for tunnel fires—a systems-oriented approach. Saf Sci. 2021;143(2):105408. doi:10.1016/j.ssci.2021.105408. [Google Scholar] [CrossRef]
21. Alvear D, Abreu O, Cuesta A, Alonso V. Decision support system for emergency management: road tunnels. Tunn Undergr Space Technol. 2013;34:13–21. doi:10.1016/j.tust.2012.10.005. [Google Scholar] [CrossRef]
22. Gikas V. Three-dimensional laser scanning for geometry documentation and construction management of highway tunnels during excavation. Sensors. 2012;12(8):11249–70. doi:10.3390/s120811249. [Google Scholar] [PubMed] [CrossRef]
23. Ranaweera K, Ruwanpura J, Fernando S. Automated real-time monitoring system to measure shift production of tunnel construction projects. J Comput Civ Eng. 2013;27(1):68–77. doi:10.1061/(asce)cp.1943-5487.0000199. [Google Scholar] [CrossRef]
24. Zou J, Wu P, Chen J, Fan W, Xu Y. Empowering underground utility tunnel operation and maintenance with data intelligence: risk factors, prospects, and challenges. Struct Durab Health Monit. 2025;19(3):441–71. doi:10.32604/sdhm.2024.058864. [Google Scholar] [CrossRef]
25. Xu G, Guo T, Li A, Zhang H, Wang K, Xu J, et al. Seismic resilience enhancement for building structures: a comprehensive review and outlook. Structures. 2024;59(2):105738. doi:10.1016/j.istruc.2023.105738. [Google Scholar] [CrossRef]
26. Hartmann T, Gao J, Fischer M. Areas of application for 3D and 4D models on construction projects. J Constr Eng Manag. 2008;134(10):776–85. doi:10.1061/(asce)0733-9364(2008)134:10(776). [Google Scholar] [CrossRef]
27. Laakso M, Kiviniemi A. The IFC standard–a review of history, development, and standardization. J Inf Technol Constr. 2012;17:134–61. [Google Scholar]
28. Mata R, Nuñez E, Forcellini D. Seismic resilience of composite moment frames buildings with slender built-up columns. J Build Eng. 2025;111(1):113532. doi:10.1016/j.jobe.2025.113532. [Google Scholar] [CrossRef]
29. Liu W, Guo H, Li H, Li Y. Retracted: using BIM to improve the design and construction of bridge projects: a case study of a long-span steel-box arch bridge project. Int J Adv Rob Syst. 2014;11(8):125. doi:10.5772/61239. [Google Scholar] [CrossRef]
30. Chen W, Tan XY, Yang J. Review of state-of-the-art in structural health monitoring of tunnel engineering. Smart Undergr Eng. 2025;1(1):40–50. doi:10.1016/j.sue.2025.05.004. [Google Scholar] [CrossRef]
31. Wang C, Ding Z, Zhou A, Zhu Z. A fully automated hybrid approach for processing high-frequency surface settlement data. Results Eng. 2025;27(Sep):106560. doi:10.1016/j.rineng.2025.106560. [Google Scholar] [CrossRef]
32. Peduto D, Giangreco C, Venmans AAM. Differential settlements affecting transition zones between bridges and road embankments on soft soils: numerical analysis of maintenance scenarios by multi-source monitoring data assimilation. Transp Geotech. 2020;24(12):100369. doi:10.1016/j.trgeo.2020.100369. [Google Scholar] [CrossRef]
33. Zhuo Y, Gu J, Wang X. Intelligent settlement monitoring system of high-speed railway bridge. J Civ Struct Health Monit. 2019;9(3):307–23. doi:10.1007/s13349-019-00334-x. [Google Scholar] [CrossRef]
34. Li Y, Yang J, Shen X, Ma Y. Application research on construction management of urban underground utility tunnel based on BIM. IOP Conf Ser Earth Environ Sci. 2019;295:42133. [Google Scholar]
35. Song Z, Shi G, Wang J, Wei H, Wang T, Zhou G. Research on management and application of tunnel engineering based on BIM technology. J Civ Eng Manag. 2019;25(8):785–97. doi:10.3846/jcem.2019.11056. [Google Scholar] [CrossRef]
36. Luo S, Yao J, Wang S, Wang Y, Lu G. A sustainable BIM-based multidisciplinary framework for underground pipeline clash detection and analysis. J Clean Prod. 2022;374:133900. doi:10.1016/j.jclepro.2022.133900. [Google Scholar] [CrossRef]
37. Zhu A, Pauwels P, De Vries B. Component-based robot prefabricated construction simulation using IFC-based building information models. Autom Constr. 2023;152:104899. doi:10.1016/j.autcon.2023.104899. [Google Scholar] [CrossRef]
38. Yin J, Luo S, Rui J, Yao J, Zhang F, Fu B, et al. BIM-based detection and optimization of spatial-temporal clashes in underground pipeline construction. Autom Constr. 2024;166(18):105616. doi:10.1016/j.autcon.2024.105616. [Google Scholar] [CrossRef]
39. Li S, Zhang Z, Mei G, Lin D, Yu J, Qiu R, et al. Utilization of BIM in the construction of a submarine tunnel: a case study in Xiamen city, China. J Civ Eng Manag. 2021;27(1):14–26. doi:10.3846/jcem.2021.14098. [Google Scholar] [CrossRef]
40. Tang L, Chen C, Li H, Mak DYY. Developing a BIM GIS–integrated method for urban underground piping management in China: a case study. J Constr Eng Manage. 2022;148(9):5022004. doi:10.1061/(asce)co.1943-7862.0002323. [Google Scholar] [CrossRef]
41. Jiang H, Jiang A. An integrated system for tunnel construction safety control based on BIM-IoT-PSO. J Civ Struct Health Monit. 2024;14(2):269–84. doi:10.1007/s13349-023-00721-5. [Google Scholar] [CrossRef]
42. Wang M, Deng Y, Won J, Cheng JCP. An integrated underground utility management and decision support based on BIM and GIS. Autom Constr. 2019;107:102931. doi:10.1016/j.autcon.2019.102931. [Google Scholar] [CrossRef]
43. Xie P, Chen K, Zhu Y, Luo H. Dynamic parametric modeling of shield tunnel: a WebGL-based framework for assisting shield segment assembly point selection. Tunn Undergr Space Technol. 2023;142:105395. doi:10.1016/j.tust.2023.105395. [Google Scholar] [CrossRef]
44. Huang H, Ruan B, Wu X, Qin Y. Parameterized modeling and safety simulation of shield tunnel based on BIM-FEM automation framework. Autom Constr. 2024;162(3):105362. doi:10.1016/j.autcon.2024.105362. [Google Scholar] [CrossRef]
45. Qiu Y, Wang J, Zhang C, Hua L, Zhou Z. Numerical simulation study on the impact of excavation on existing subway stations based on BIM-FEM framework. Buildings. 2024;14(5):1444. doi:10.3390/buildings14051444. [Google Scholar] [CrossRef]
46. Fabozzi S, Biancardo SA, Veropalumbo R, Bilotta E. I-BIM based approach for geotechnical and numerical modelling of a conventional tunnel excavation. Tunn Undergr Space Technol. 2021;108(6):103723. doi:10.1016/j.tust.2020.103723. [Google Scholar] [CrossRef]
47. Zhu J, Wu P. BIM/GIS data integration from the perspective of information flow. Autom Constr. 2022;136(2):104166. doi:10.1016/j.autcon.2022.104166. [Google Scholar] [CrossRef]
48. Hu X, Olgun G, Assaad RH. An intelligent BIM-enabled digital twin framework for real-time structural health monitoring using wireless IoT sensing, digital signal processing, and structural analysis. Expert Syst Appl. 2024;252(14):124204. doi:10.1016/j.eswa.2024.124204. [Google Scholar] [CrossRef]
49. Jiang F, Ma L, Broyd T, Chen K. Digital twin and its implementations in the civil engineering sector. Autom Constr. 2021;130(2):103838. doi:10.1016/j.autcon.2021.103838. [Google Scholar] [CrossRef]
50. Zhang F, Shen Y, Tan L, Jin R, Han Y. Research on self-adaptive reinforcement plug-in of prefabricated concrete component based on BIM. KSCE J Civ Eng. 2024;28(7):2588–99. doi:10.1007/s12205-024-2450-0. [Google Scholar] [CrossRef]
51. Yin X, Liu H, Chen Y, Wang Y, Al-Hussein M. A BIM-based framework for operation and maintenance of utility tunnels. Tunn Undergr Space Technol. 2020;97(3):103252. doi:10.1016/j.tust.2019.103252. [Google Scholar] [CrossRef]
52. Wang Q, Li J, Yao H, Li Z, Jia X. Research on IFC-based tunnel monitoring information integration and visual warning scheme. Buildings. 2025;15(13):2221. doi:10.3390/buildings15132221. [Google Scholar] [CrossRef]
53. He R, Cheng Y, Wu D, Wang J, Liu G, Wu L. A case study of visualization prediction of deformation of a typical rock tunnel using variable modal decomposition technique, memory networks, and BIM technique. Buildings. 2025;15(4):615. doi:10.3390/buildings15040615. [Google Scholar] [CrossRef]
54. Yang SW, Lee Y, Kim SA. Design and validation of a real-time maintenance monitoring system using BIM and digital twin integration. Buildings. 2025;15(8):1312. doi:10.3390/buildings15081312. [Google Scholar] [CrossRef]
Cite This Article
 Copyright © 2026 The Author(s). Published by Tech Science Press.
This work is licensed under a Creative Commons Attribution 4.0 International License , which permits unrestricted use, distribution, and reproduction in any medium, provided the original work is properly cited.
 Downloads
 Citation Tools