
 Submit a Paper
 Propose a Special lssue
 Open Access
ARTICLE

GPR Image Enhancement and Object Detection-Based Identification for Roadbed Subsurface Defect
1 College of Urban Construction, Hangzhou Polytechnic, Hangzhou, 311402, China
2 Road & Bridge International Co., Ltd., Beijing, 100027, China
3 College of Civil Engineering, Zhejiang University of Technology, Hangzhou, 310014, China
* Corresponding Author: Zhekun Shou. Email:
(This article belongs to the Special Issue: Health Monitoring of Transportation Infrastructure Structure)
Structural Durability & Health Monitoring 2026, 20(1), . https://doi.org/10.32604/sdhm.2025.071300
Received 04 August 2025; Accepted 05 November 2025; Issue published 08 January 2026
 View Full Text
 Download PDF
Abstract
Roadbed disease detection is essential for maintaining road functionality. Ground penetrating radar (GPR) enables non-destructive detection without drilling. However, current identification often relies on manual inspection, which requires extensive experience, suffers from low efficiency, and is highly subjective. As the results are presented as radar images, image processing methods can be applied for fast and objective identification. Deep learning-based approaches now offer a robust solution for automated roadbed disease detection. This study proposes an enhanced Faster Region-based Convolutional Neural Networks (R-CNN) framework integrating ResNet-50 as the backbone and two-dimensional discrete Fourier spectrum transformation (2D-DFT) for frequency-domain feature fusion. A dedicated GPR image dataset comprising 1650 annotated images was constructed and augmented to 6600 images via median filtering, histogram equalization, and binarization. The proposed model segments defect regions, applies binary masking, and fuses frequency-domain features to improve small-target detection under noisy backgrounds. Experimental results show that the improved Faster R-CNN achieves a mean Average Precision (mAP) of 0.92, representing a 0.22 increase over the baseline. Precision improved by 26% while recall remained stable at 87%. The model was further validated on real urban road data, demonstrating robust detection capability even under interference. These findings highlight the potential of combining GPR with deep learning for efficient, non-destructive roadbed health monitoring.Keywords
Urban road collapse is a geological phenomenon in which road surfaces subside downward under the influence of natural or human-induced factors, forming sinkholes or collapse pits on the ground [1]. Non-uniform subgrade settlement [2] results from inadequate control of filler materials [3], improper treatment of wet/soft foundations [4], insufficient compaction of earthwork fill [5], inconsistent compaction standards at fill-excavation junctions, and insufficient backfill compaction behind structural abutments. Excessive pavement loading caused by the increasing prevalence of heavy-duty vehicles, overloading, and overweight vehicles repeatedly compressing the road surface will lead to structural damage and ultimately result in pavement subsidence or collapse [6]. Additionally, aging underground pipelines and leakage from pressurized water pipelines can erode and carry away the subgrade soil, forming cavities that lead to ground collapse [7]. This process involves the gradual loss of foundational support due to water infiltration from deteriorated pipes, ultimately creating voids beneath road surfaces. Such structural weaknesses, if left unaddressed, may culminate in sudden pavement subsidence or collapse. The detection of subsurface voids [8] presents a technical challenge in modern road health monitoring systems, as the subgrade structure remains concealed beneath the pavement surface, and initial void formation within the subgrade often fails to manifest immediately in the pavement structure.
For the inspection of hidden road defects, the primary methods used include core drilling sampling [9], ultrasonic testing [10], laser detection [11], fiber-optic sensing detection [12], ground-penetrating radar detection [13], and others. The core drilling sampling method offers strong intuitiveness and high accuracy, but it is inherently destructive, causing irreversible damage that compromises the integrity of the pavement structure and significantly complicates subsequent road maintenance efforts. Ultrasonic testing does not cause any damage to the roadbed, therefore it does not affect the normal use of the road during inspection. Additionally, ultrasonic waves can penetrate thick roadbed structures, thereby detecting internal defects within the roadbed. However, ultrasonic testing lacks a systematic discrimination method for identifying hidden pavement defects and remains empirically driven, resulting in limited universality and applicability. Laser detection technology offers high measurement accuracy, requires relatively less time, achieves high spatial resolution, and features simple operation with rapid detection speed, enabling the completion of extensive roadbed inspections within a short time frame. Fiber optic sensing detection technology utilizes fiber optic sensors to convert physical quantity changes into optical signals, accomplishes information collection through the optical signals, and ultimately achieves the detection of target physical quantities. This technology is less susceptible to electromagnetic interference and maintains stable, reliable detection performance in complex roadbed environments. However, fiber optic sensing detection entails relatively high equipment and maintenance costs. In extreme weather conditions or harsh environments, the performance of fiber optics may be compromised, resulting in reduced detection accuracy.
The ground-penetrating radar (GPR) is a non-destructive that has high efficiency. Yet, traditional GPR-based subgrade inspection relies on manual interpretation of radar images. Due to radar image interference and inspectors’ lack of experience, this process inevitably suffers from issues such as missed detections, false detections, time-consuming operations, low efficiency, and strong subjectivity, significantly compromising the accuracy of inspection results. In recent years, deep learning-based image recognition methods have rapidly developed, enabling automatic extraction of deep image features through deep neural networks to achieve high recognition accuracy, providing an innovative approach for subgrade void detection.
Among deep learning models, real-time object detection frameworks like YOLO [14] and two-stage detectors like Faster R-CNN [15] have emerged as commonly used frameworks for object detection, balancing speed and accuracy. These frameworks have been successfully leveraged for subgrade void detection, automating the identification of subsurface voids and structural anomalies. Liu et al. [16] demonstrated the integration of YOLO with 3D GPR images for road defect detection, achieving high accuracy in identifying subsurface voids and cracks. Similarly, Qin et al. [17] used a domain-adapted YOLO network to improve target detection in GPR images of tunnel linings, showing that data augmentation and clean image preprocessing significantly improved model generalization. Ren et al. [18] introduced Faster R-CNN as a robust framework for object detection with region proposals, which has since been applied to GPR data. Lei et al. [19] used Faster R-CNN to automatically detect and fit hyperbolas in GPR B-scans, emphasizing that high-resolution and clean images were essential for accurate feature extraction. Moreover, Fang et al. [20] applied Faster R-CNN to roadbed defect detection from GPR data and reported that image artifacts and noise significantly degraded detection performance. These findings reveal that CNN-based detectors critically depend on high-SNR inputs, yet raw GPR B-scans are often corrupted by strong random and coherent noise that mask weak reflections. In the frequency domain, Montiel-Zafra et al. [21] developed a non-local similarity-based method to suppress repetitive background noise in GPR data. Li et al. [22] proposed TID-CycleGAN for GPR image denoising using unpaired data to enhance defect details. Zhang et al. [23] combined wavelet transformer with F-K filtering to separate strong interference from useful GPR signals. Li et al. [24] utilized wavelet transform for pavement layer identification and signal processing in deep learning-based distress detection. He et al. [25] introduced a VMD-based joint time-frequency analysis method to achieve high-resolution time-frequency representations of GPR data. In conclusion, these studies demonstrate that effective denoising is a prerequisite before deploying any deep-learning detector on GPR data.
To enhance the recognition accuracy of deep learning networks for GPR images, necessary denoising to clarify the images is crucial. Additionally, specific improvements to the network model architecture itself represent a complementary strategy worth considering. Zhang et al. [26] first combined ResNet-50 and YOLOv2 to capture hyperbolic signatures of moisture-induced damage in asphalt pavements, while employing an Incremental Random Sampling (IRS) strategy to counteract the limited GPR dataset. To suppress clutter and recover incomplete hyperbolas, Wang et al. [27] designed a cascade CNN that embeds GPR wave-propagation physics; it outperforms HOG, YOLOv3 and Faster R-CNN on the F1 metric and can hallucinate missing feature data when reflections are truncated. Zhang et al. [28] proposed CFFM, a multi-task lane object detection approach that enhances feature representation through cross-layer feature fusion. Chen et al. [29] developed CFG_SI_YOLO, a road marking defect detection network that improves localization accuracy and feature discrimination. Li et al. [30] proposed AIL-YOLO with optimized BM3D for GPR clutter suppression and faster detection; Tess Xianghuan Luo et al. [31] presented CAPW-YOLO with synthetic data augmentation to solve sample shortage; Zhou et al. [32] developed YOLO-LD via GPRMAX3.0-integrated YOLOv7 for tunnel lining inspection. Yao et al. [33] integrated the C2f module with PConv in YOLOv8n, designing a lightweight architecture that reduces downsampling rates and preserves fine details in infrared images. Yu et al. [34] improved YOLOv7 by adopting the α-CIoU loss for bounding box regression and incorporating a polarized self-attention mechanism into the path aggregation network. Xiang et al. [35] introduced a two-layer attention feature pyramid network (TA-FPN) with SODEM to enhance local features of small objects and suppress background interference. Bhanbhro et al. [36] designed a multi-convolutional block attention network (MCBAN) that combines channel and spatial attention for improved small target detection. Rosso et al. [37] combined CNNs with vision transformers for tunnel lining inspection; Liang et al. [38] embedded Bi FPN into YOLOv5 to merge multi-view B/C/D-scans; Wang et al. [39] leveraged a dense GAN to augment GPR B-scans, while an Improved Cycle GAN and VAE-Refine Net [40] were adopted to restore noisy urban GPR images before detection, collectively pushing robustness, accuracy and real-time performance forward. This body of work highlights model architecture refinement as a crucial and effective strategy alongside denoising for advancing GPR image recognition performance.
This article explores how to effectively utilize ground-penetrating radar (GPR) in conjunction with deep learning to accurately identify hidden roadbed loosening defects in complex underground environments. The approach involves creating a dedicated GPR image dataset and enhancing its quality through preprocessing techniques—including median filtering, histogram equalization, binarization, and two-dimensional Fourier spectrum transformation—to suppress clutter and improve defect contrast. To replace subjective visual analysis, the study adapts the Faster R-CNN framework, utilizing a VGG16 backbone and a ResNet-50 backbone. The feature extraction capabilities of these architectures are systematically compared under varying learning rates, loss functions, and optimizers. Recognizing limitations in the original Faster R-CNN concerning small targets and noisy backgrounds, this study introduces further refinements: segmenting defect regions, applying binary masking, and fusing frequency-domain information to enhance the feature maps input to the network. These incremental enhancements are rigorously benchmarked against standard Faster R-CNN configurations. The results demonstrate how targeted preprocessing combined with architectural modifications effectively mitigates the core challenge of interpreting ambiguous, noise-affected GPR imagery for subsurface defect identification.
2 Establishment of Dataset for Subgrade Defects Detection
2.1 GPR Image Acquisition and Annotation
The onsite detection was conducted using the LTD-2600 ground-penetrating radar and the CG270MHz antenna. The ground-penetrating radar system consists of an integrated main unit, antennas, and related accessories. Its fundamental operational principle involves the coordinated operation of transmitting antennas, receiving antennas, and the main unit. During data collection, the control unit first sends control signals to both the transmitter and receiver. Upon receiving the signal, the transmitter emits an electromagnetic pulse wave of specific frequency through the transmitting antenna toward a measurement point on the wall. As this electromagnetic wave propagates through different media, reflection occurs at interfaces where physical properties change (differences in resistivity and permittivity). The reflected waves are captured by the receiving antenna. The control unit and computer subsequently receive these reflected signals transmitted via optical fiber from the receiving antenna. The system records both the amplitude of waveform sequences and the two-way travel time of waves at each measurement point. The depth of reflective interfaces is calculated based on the electromagnetic wave propagation speed within the medium and its two-way travel time. By moving the antenna along the survey line, the control unit collects waveform sequences from all measurement points, forming a complete radar profile record of the entire survey line. Analysis and computation of this radar profile record enable the identification of pavement defects.
The collected radar data was processed through the IDSP7.0 radar data processing and analysis system. Following the initial analysis of the system, a relatively distinct and largely interference-free ground-penetrating radar (GPR) spectrum was achieved through IDSP7. Subsequently, the radar image quality was further enhanced through gain adjustments and background elimination using the IDSP7.0 radar data processing and analysis system. This approach significantly mitigated the risk of false extraction of disease features by the detection model due to the variability and discreteness of subgrade soil. The processed images were then exported at a 15-m interval, forming the raw radar dataset required for the experiment. The collected image is shown in Fig. 1.

Figure 1: IDSP7.0 radar data processing and analysis system
Given that most of the subgrade defects present a non-tight state, only a few show cavity characteristics. The annotation files generated by using labelimg to label the GPR defect images contain the position information and category information of the bounding boxes. Based on practical engineering needs and the characteristics of GPR imagery, this study concentrates on annotating loose defects (leakiness) in roadbeds. We generated XML annotation files that record each bounding box’s position and class label. The resulting dataset comprises 1650 images, within which the “leakiness” class has 2523 labeled instances. Representative annotated samples are shown in Fig. 2.
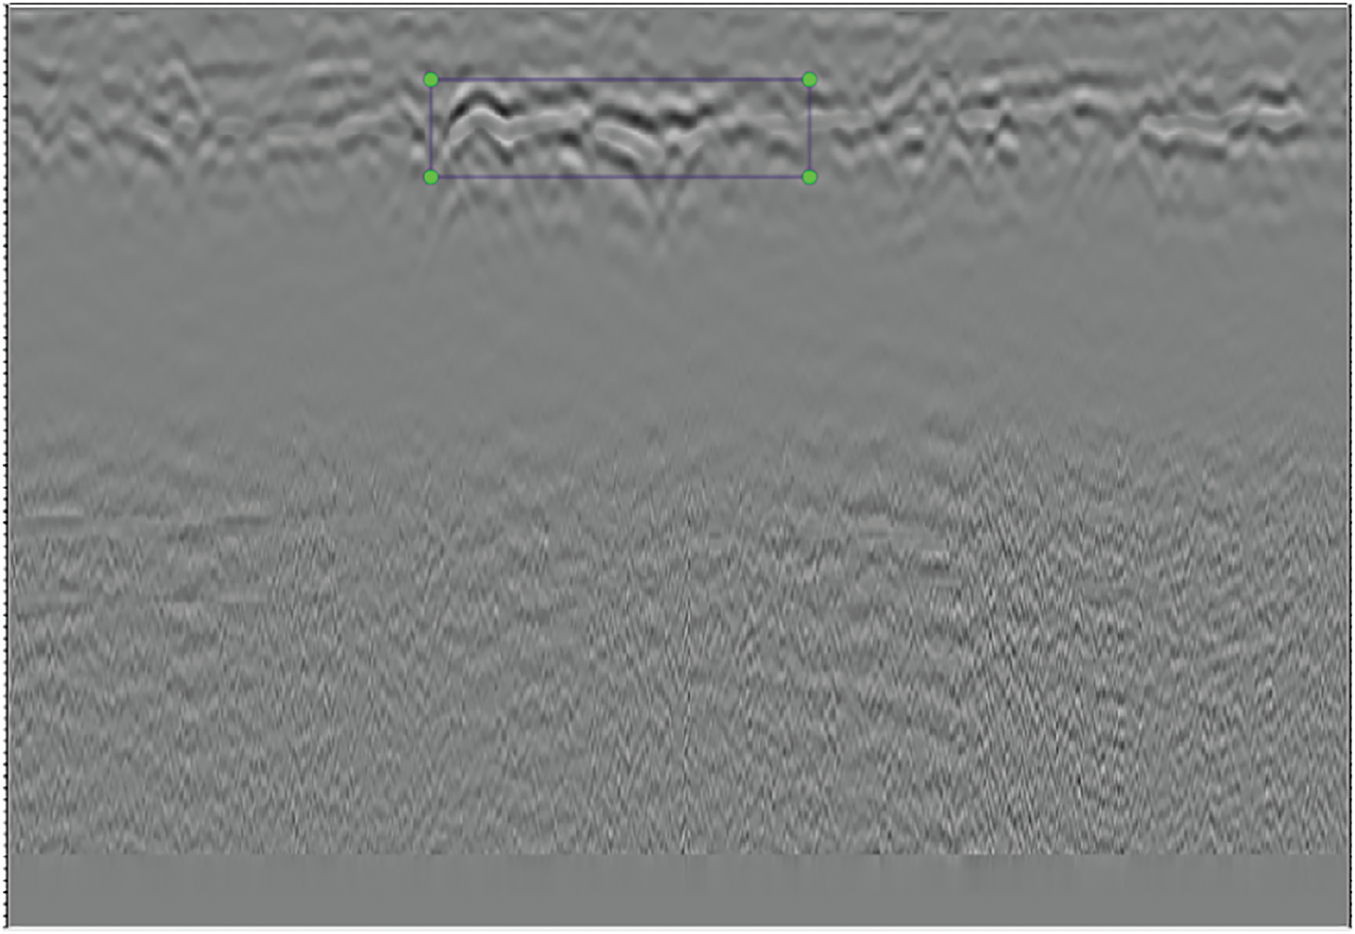
Figure 2: Example of disease labeling in the GPR image
GPR images are affected by background noise due to various reasons. For example, random noise arises from heat generated by electronic components within the radar receiver during operation, while electromagnetic interference also contributes to background noise. Ground clutter is another source: when the ground surface is uneven, loose, or contains metallic objects, electromagnetic waves emitted by the radar reflect and scatter, creating chaotic echo signals. Additionally, when underground media are heterogeneous or exhibit layered structures, electromagnetic waves undergo refraction, reflection, and scattering during propagation, further increasing the complexity of background noise. To mitigate the impact of background noise on the target detection model, this study employs methods such as median filtering, histogram equalization, color temperature adjustment, and Gamma transformation to enhance the contrast of disease features and reduce the influence of random noise.
The noise interference in GPR images exhibits scattered characteristics similar to salt-and-pepper noise. Median filtering can effectively remove randomly distributed and relatively isolated noise points like such salt-and-pepper noise. Median filtering is suitable for two-dimensional image signals without blurring image edges. Moreover, subsequent training using image-enhanced data can achieve good results. Therefore, median filtering is adopted for preprocessing GPR images. As median filtering removes black and white noise points in GPR images, the visual differences between pre-filtered and post-filtered comparison diagrams show only subtle changes, as shown in Fig. 3.
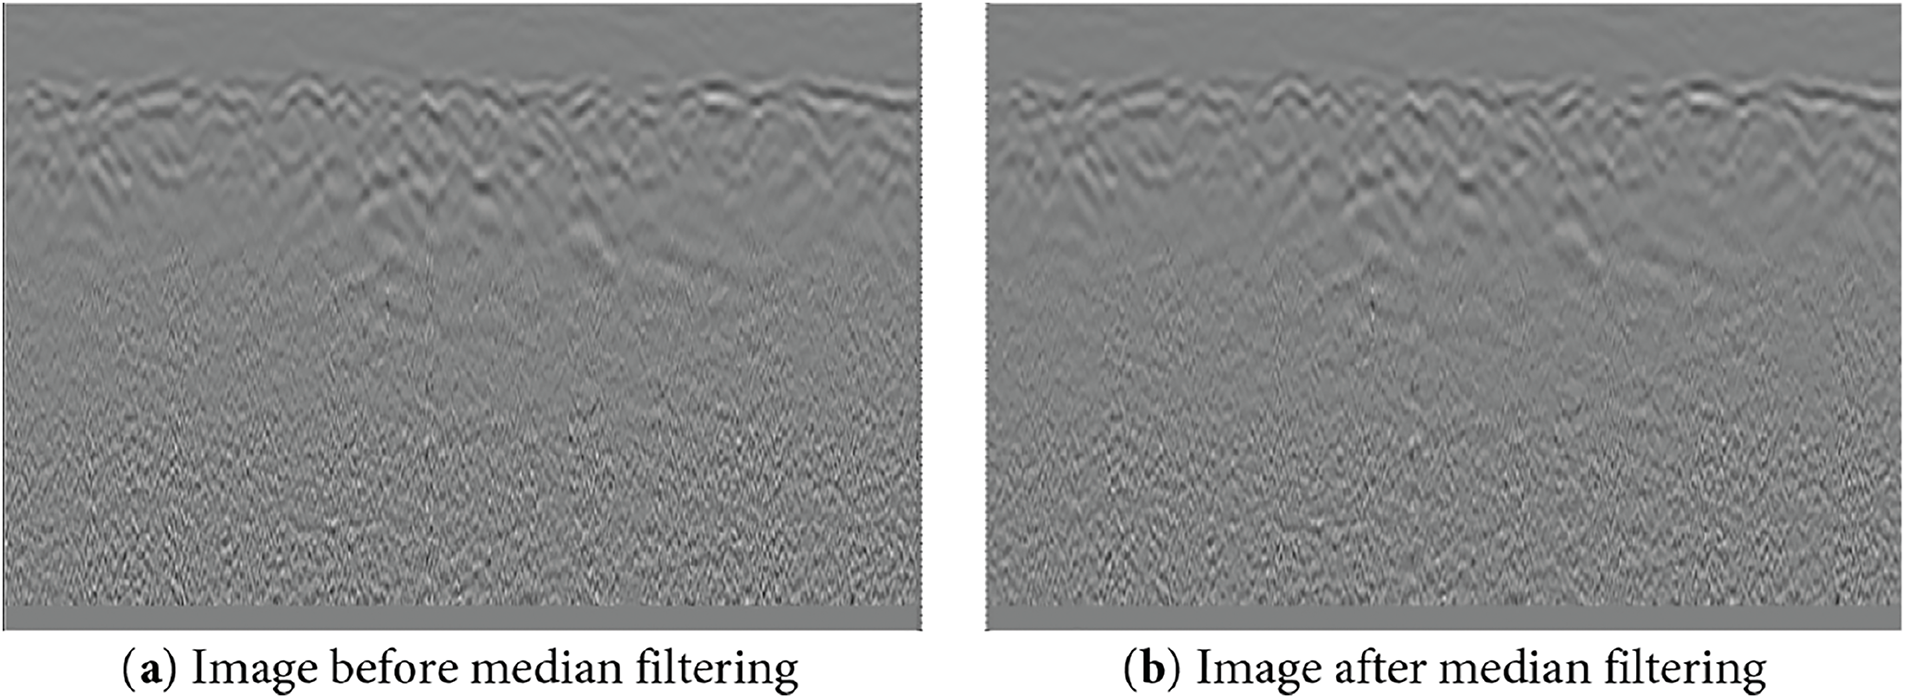
Figure 3: Effects comparison of the median filtering for GPR images
For original GPR images, histogram equalization not only improves visual quality but also enhances the display of structural features related to subgrade defects through equalization processing. In GPR image processing, background noise can degrade image clarity and quality. Histogram equalization effectively suppresses background noise by adjusting the distribution of gray levels, making the image easier to analyze. Additionally, histogram equalization expands the brightness range, allowing better distribution of image brightness across the histogram. This enhances the contrast of localized defect features in radar images without compromising overall contrast. The enhanced results can be seen in Fig. 4.
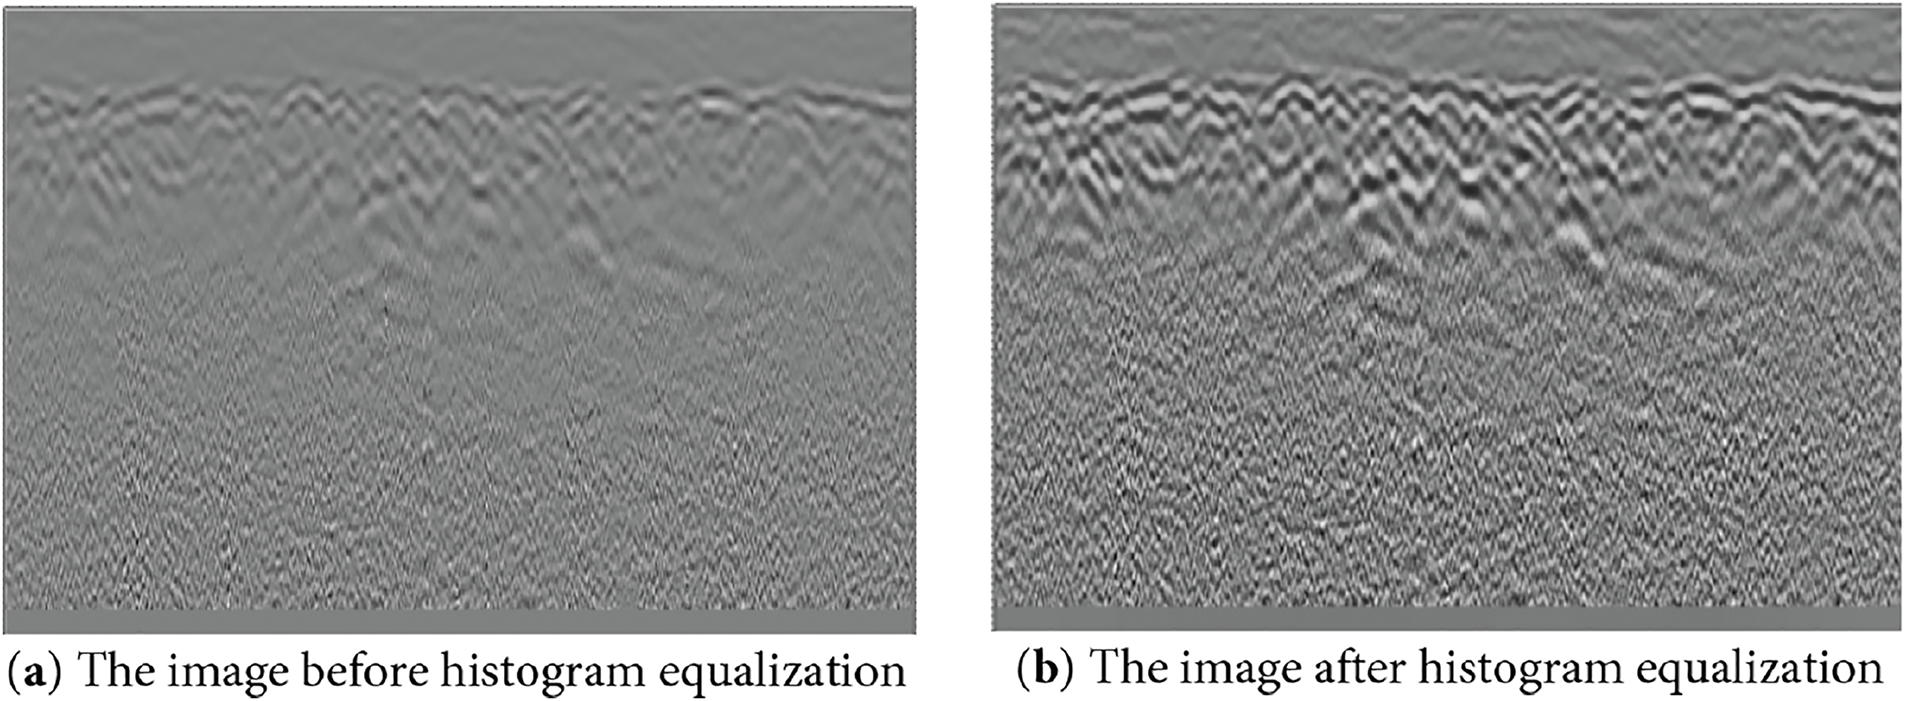
Figure 4: Effects comparison of the histogram equalization for GPR images
Gamma transformation can enhance the feature information in the ground-penetrating radar image. For the gray-scale distribution of different regions in the ground-penetrating radar image, Gamma transformation can perform nonlinear adjustment to improve the contrast of the image and make the target area in the radar image more prominent, facilitating subsequent target recognition and classification. After radar image preprocessing, the radar image dataset is expanded to 6600 images.
In order to verify whether image enhancement is effective, we conducted the initial training on the pre- and post-enhancement image data using YOLOv7 denoting the original dataset and the enhanced dataset as Group 1 and Group 2, respectively. The number of iterations is set to 200, and the optimizer is Adam. The hyperparameters such as the learning rate and loss function of the model are kept the same, the comparison results are shown in Table 1.
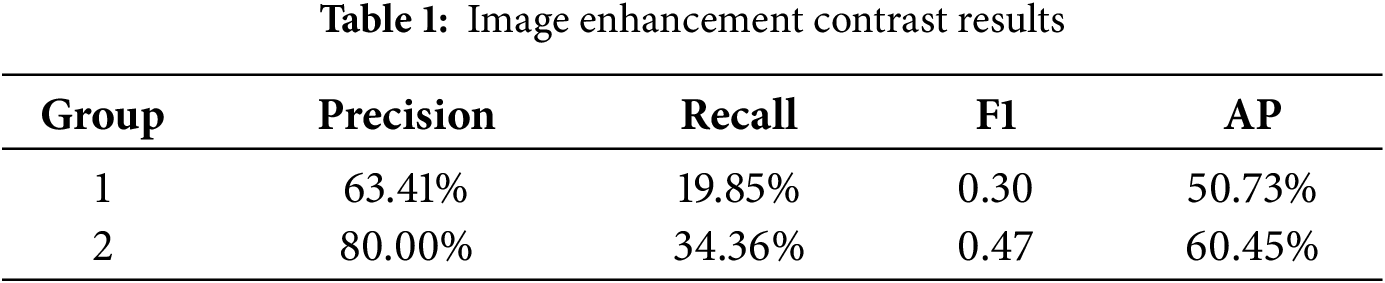
The enhanced image shows an improvement in Precision, Recall, F1, and AP indices. Particularly, the AP index has increased by 19.2%, indicating that the model performance of the dataset has significantly improved after enhancement.
2.3 Faster R-CNN Target Detection Network Model
The Faster R-CNN network model comprises structures such as input, backbone, Region Proposal Networks (RPN), Proposal Layer, RoI Pooling, and Classifier, shown in Fig. 5. Firstly, the input image is resized to fit the model’s requirements. The backbone of the Faster R-CNN model can employ various feature extraction networks, with commonly used ones being VGG, ResNet, among others. The extracted features are shared for subsequent layers, including the Region Proposal Network and fully connected layers. The shared convolutional layers are utilized to extract features from the entire image. The Region Proposal Network (RPN) generates region proposals, which are potential target areas. The candidate boxes generated by RPN are projected onto the feature map to obtain corresponding feature matrices. This layer classifies the features into foreground (positive) and background (negative) using softmax. Anchors are hypothetical boxes of different sizes set on the original image to detect the presence of objects within them. RPN adjusts the anchor boxes’ bounding box offsets to obtain accurate proposals. As a distinguishing feature of Faster R-CNN, RPN directly generates candidate regions, significantly enhancing the speed of generating regions for detection. RPN generates nine pre-set anchor boxes with varying aspect ratios and areas for each location. These nine initial anchors encompass three areas (128 × 128, 256 × 256, 512 × 512) and three aspect ratios (1:1, 1:2, 2:1).
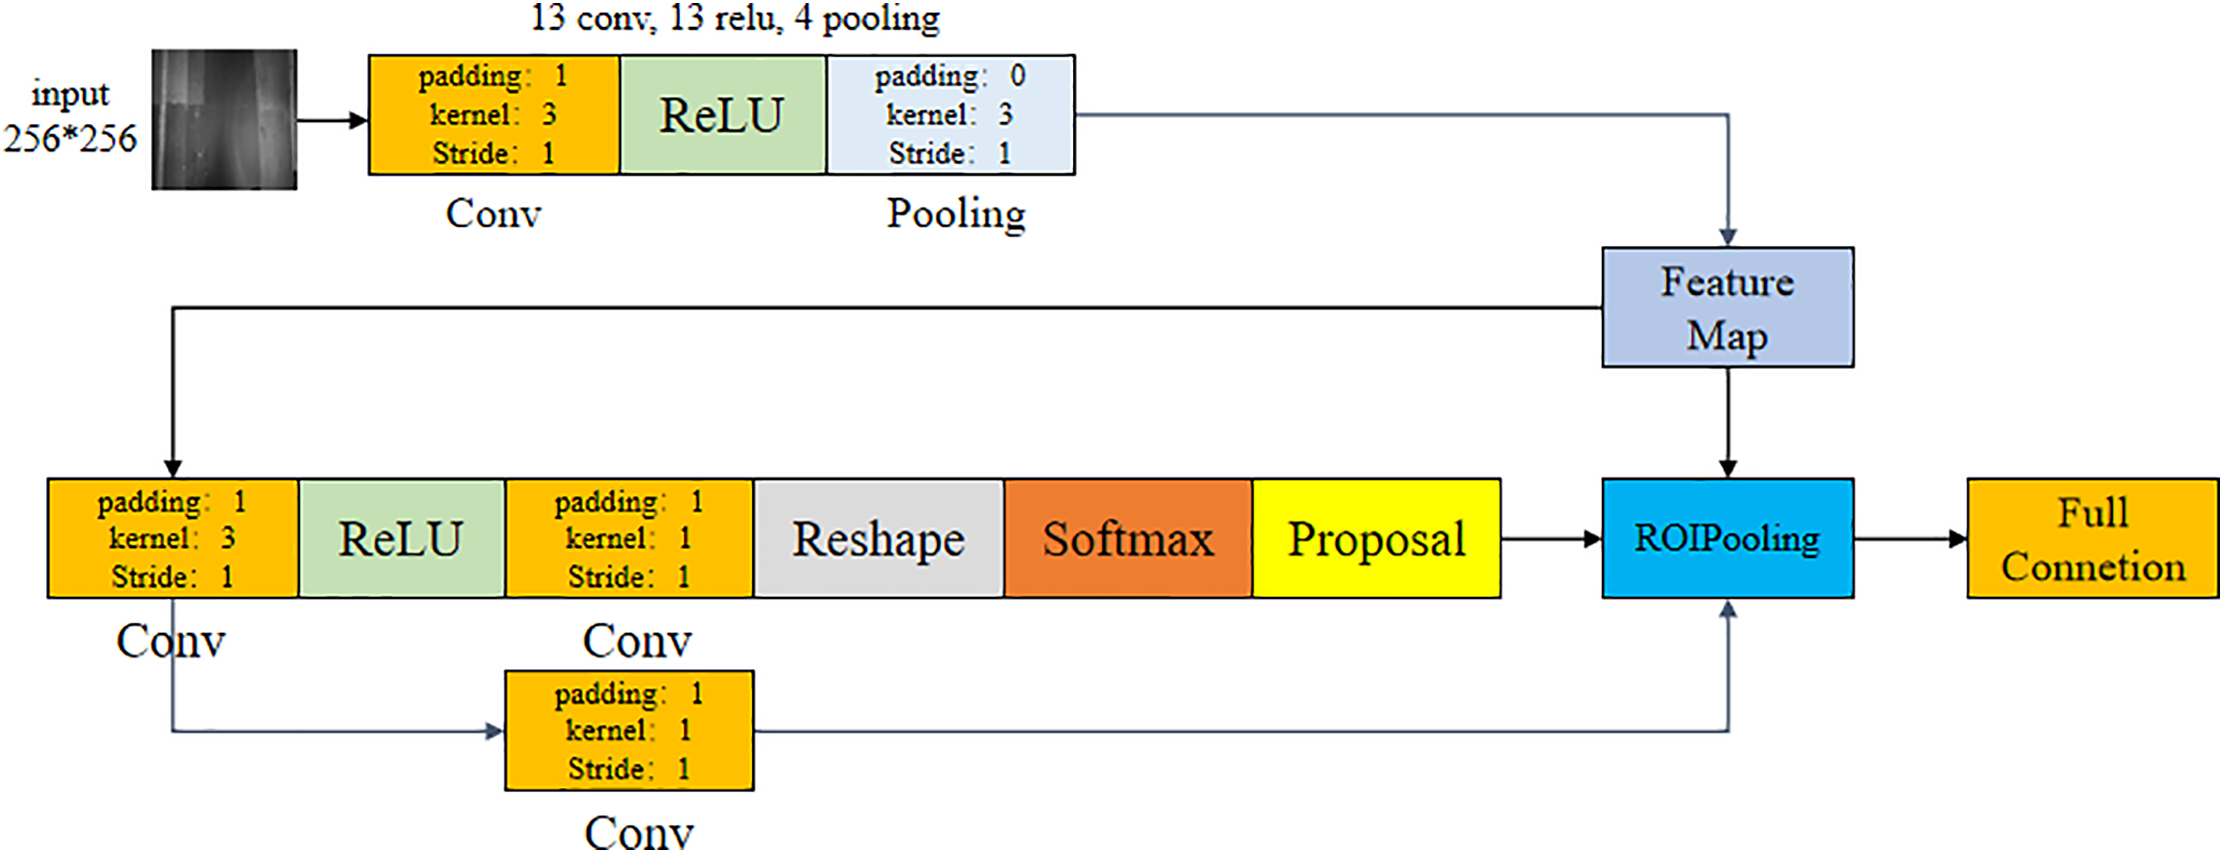
Figure 5: Faster R-CNN object detection network model
The Proposal Layer is responsible for integrating all the computed precise proposals and forwarding them to the subsequent RoI Pooling layer. The Proposal Layer performs post-processing (such as Non-Maximum Suppression, NMS) on the classification and regression results output by the RPN to obtain regions of interest (RoIs) that the network considers contain objects. It also obtains bounding boxes (bboxes) for these regions, but without detailed classification of the object categories. Since the positions and sizes of anchor boxes are preset, and the training samples are limited, the detection results obtained at this stage are not sufficiently accurate. The RoI Pooling layer takes the feature maps as input and resizes each feature matrix to a 7 × 7 feature map. It then extracts features from these combined information and forwards them to the subsequent fully connected layers for determining the object categories. The Classifier, through the fully connected layers, obtains the final probabilities and calculates the categories. Simultaneously, it performs bounding box regression once again to obtain the final precise locations of the detection boxes. The specific identification process is shown in Fig. 6.

Figure 6: The principle of faster R-CNN for object detection
ResNet-50 is a 50-layer deep convolutional neural network known for its residual blocks and skip connections. Each residual block contains two 3 × 3 convolutional layers, and the identity mapping via shortcut connections effectively alleviates the vanishing gradient problem in deep networks. This architecture enables stable training of very deep models. The network ends with global average pooling and a fully connected layer to produce a 1000-dimensional classification output. VGG16 is a classical architecture consisting of 16 convolutional and fully connected layers. It extracts features through repeated stacks of 3 × 3 convolutional layers and 2 × 2 pooling layers, resulting in a simple yet effective design. Classification is performed via three fully connected layers, generating a probability distribution over 1000 classes. Recognized for its uniform and deep structure, VGG16 remains a benchmark model in computer vision due to its strong representational capacity. In this study, VGG16 and ResNet-50 are used as alternative backbone networks for feature extraction in the Faster R-CNN framework. Both architectures are evaluated to determine their suitability for GPR-based defect detection.
2.4 Model Metrics and Parameters
During the process of object detection, numerous prediction bounding boxes are typically generated, each of which carries a confidence score that gauges the degree of certainty that the content within the bounding box represents an object. The higher the confidence score, the more the currently trained model recognizes and trusts the result of that bounding box.
Here, TP stands for True Positives, which are positive samples predicted as positive by the model; TN stands for True Negatives, which are negative samples predicted as negative by the model; FP stands for False Positives, which are negative samples predicted as positive by the model; and FN stands for False Negatives, which are positive samples predicted as negative by the model. The specific relationships are shown in Table 2.
The evaluation metric “Precision” can also be translated as “Accuracy Rate” or “Precision Rate”, emphasizing the ability to accurately identify the target. On the other hand, the evaluation metric “Recall” is also known as “Recall Rate” or “Completeness”, which focuses on the probability of the correct part within the predicted frame.
The evaluation metric AP (Average Precision) is the average of precision values. In the Precision-Recall (PR) curve for evaluation metrics, ‘P’ stands for Precision, and ‘R’ stands for Recall: a two-dimensional curve with Precision and Recall as the vertical and horizontal axes, respectively. Each PR curve corresponds to a threshold value (probability in statistics). By selecting an appropriate threshold, samples can be reasonably classified into positive and negative examples, where samples with probabilities greater than the threshold are considered positive, and those less than the threshold are considered negative. After sample classification, the corresponding Precision and Recall are calculated, resulting in a correspondence curve. In the PR curve, the larger the area enclosed by the curve in the lower left corner and the axes, the better the model performance. The comprehensive evaluation metric mAP (mean Average Precision) refers to the average of the APs of all categories within all images, which can be used in object detection tasks to evaluate the performance of algorithms, thereby measuring the detection extent across multiple classes.
This paper uses a Graphics Processing Unit (GPU) server for training, and its resource allocation is shown in Table 3.
3.2 Training of Object Detection Algorithms
Using the Faster R-CNN algorithm model with VGG16 as the backbone and the Faster R-CNN algorithm model with Resnet-50 as the backbone, we trained three sets of different network models on a dataset of 6600 radar disease images after image enhancement. The dataset is divided into training, validation and testing sets in a ratio of 8:1:1. The number of iterations was set to 200 for both models. We discussed the training results of the same model under the conditions of adjusting hyperparameters such as learning rate = 0.0001, Batchsize = 8, the same loss function, and using the Adam optimizer. These models calculated the evaluation indicators for the features of the dataset, as shown in the curves in the following figure, including the precision-threshold curve, recall-threshold curve, F1-value-threshold curve, PR curve, and mAP curve. The comparison of the training results of the two models is shown in Table 4.
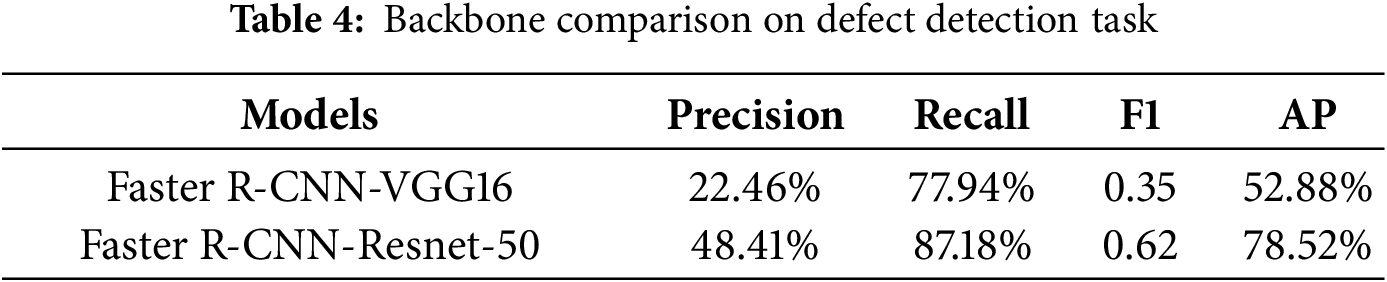
Figs. 7–10 show that the ResNet-50 backbone consistently achieves higher precision across confidence thresholds. Quantitatively, Faster R-CNN-ResNet-50 surpasses Faster R-CNN-VGG16 by 25.95 points in precision, 9.24 points in recall, 0.27 in F1, and 25.64 points in AP. Taken together, these results indicate stronger feature extraction and more reliable detection under noise for the ResNet-50 backbone, supporting its use as the default network in subsequent experiments.
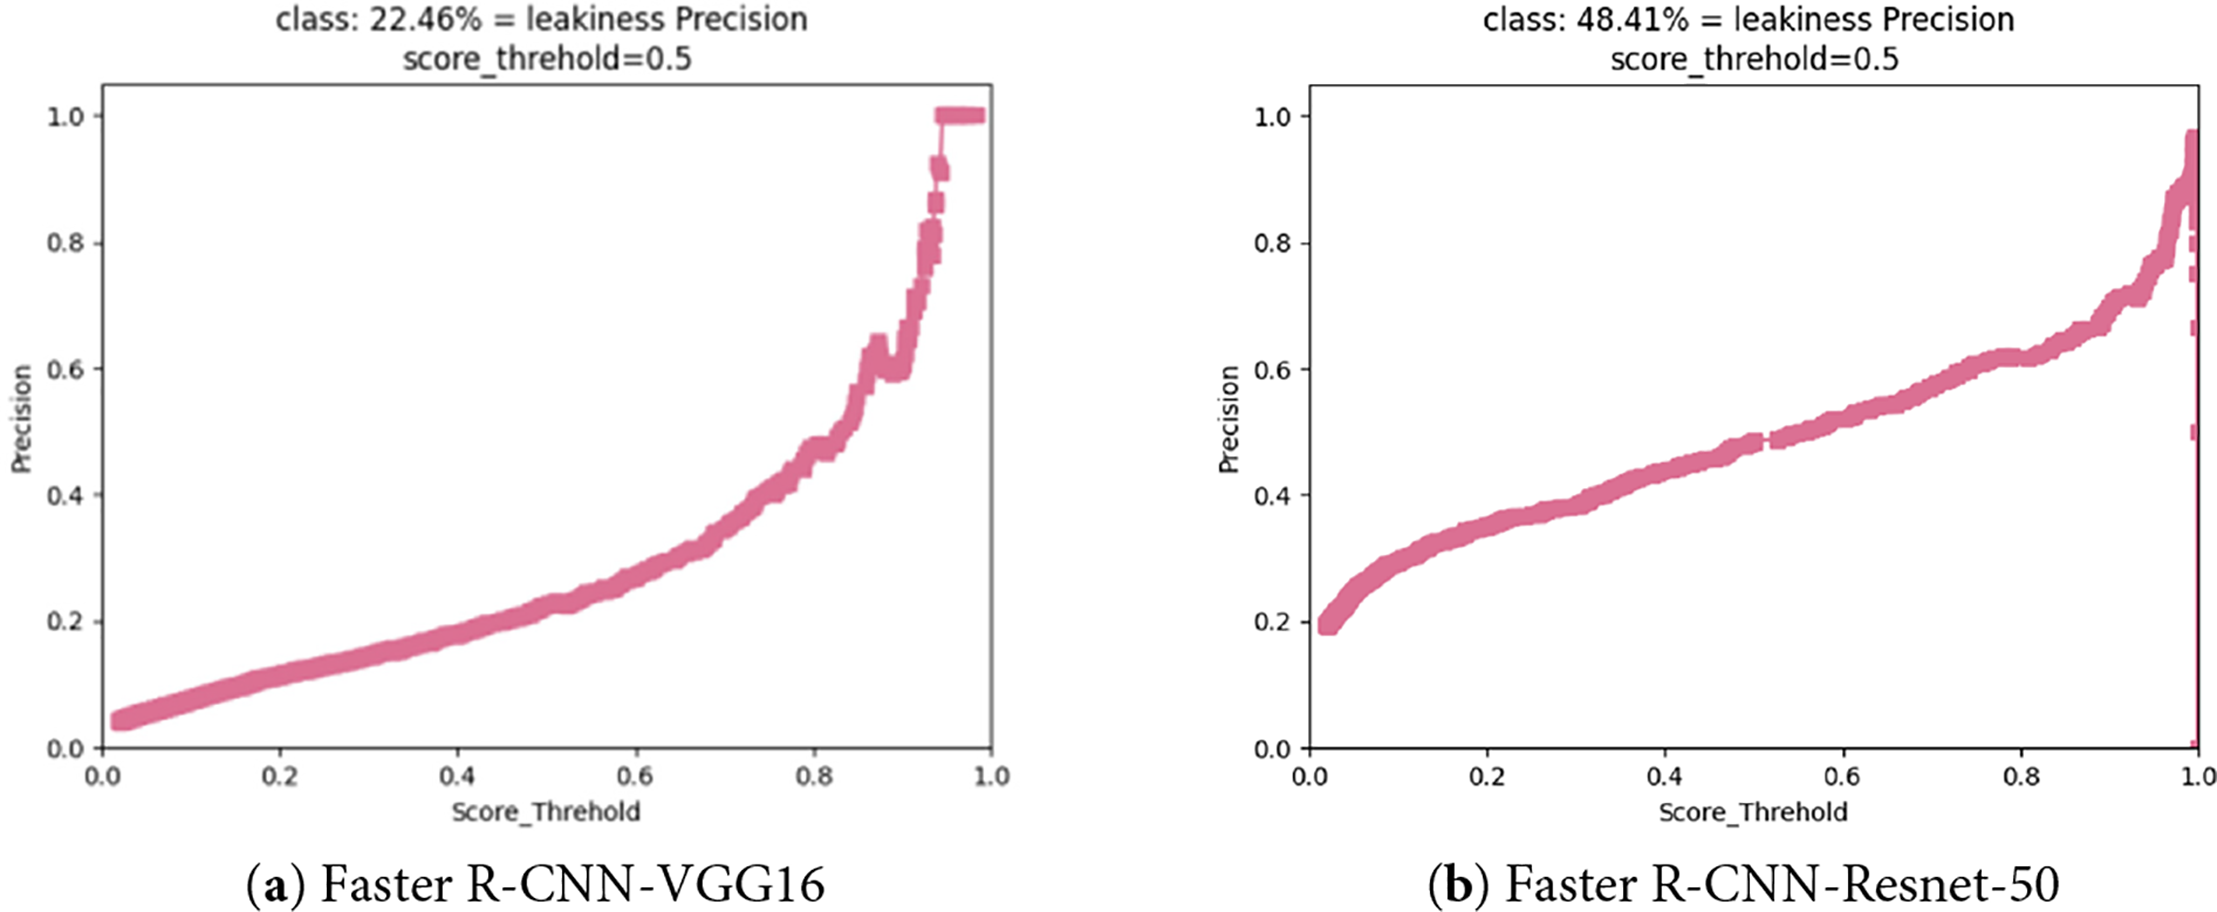
Figure 7: Precision-score-threshold curve
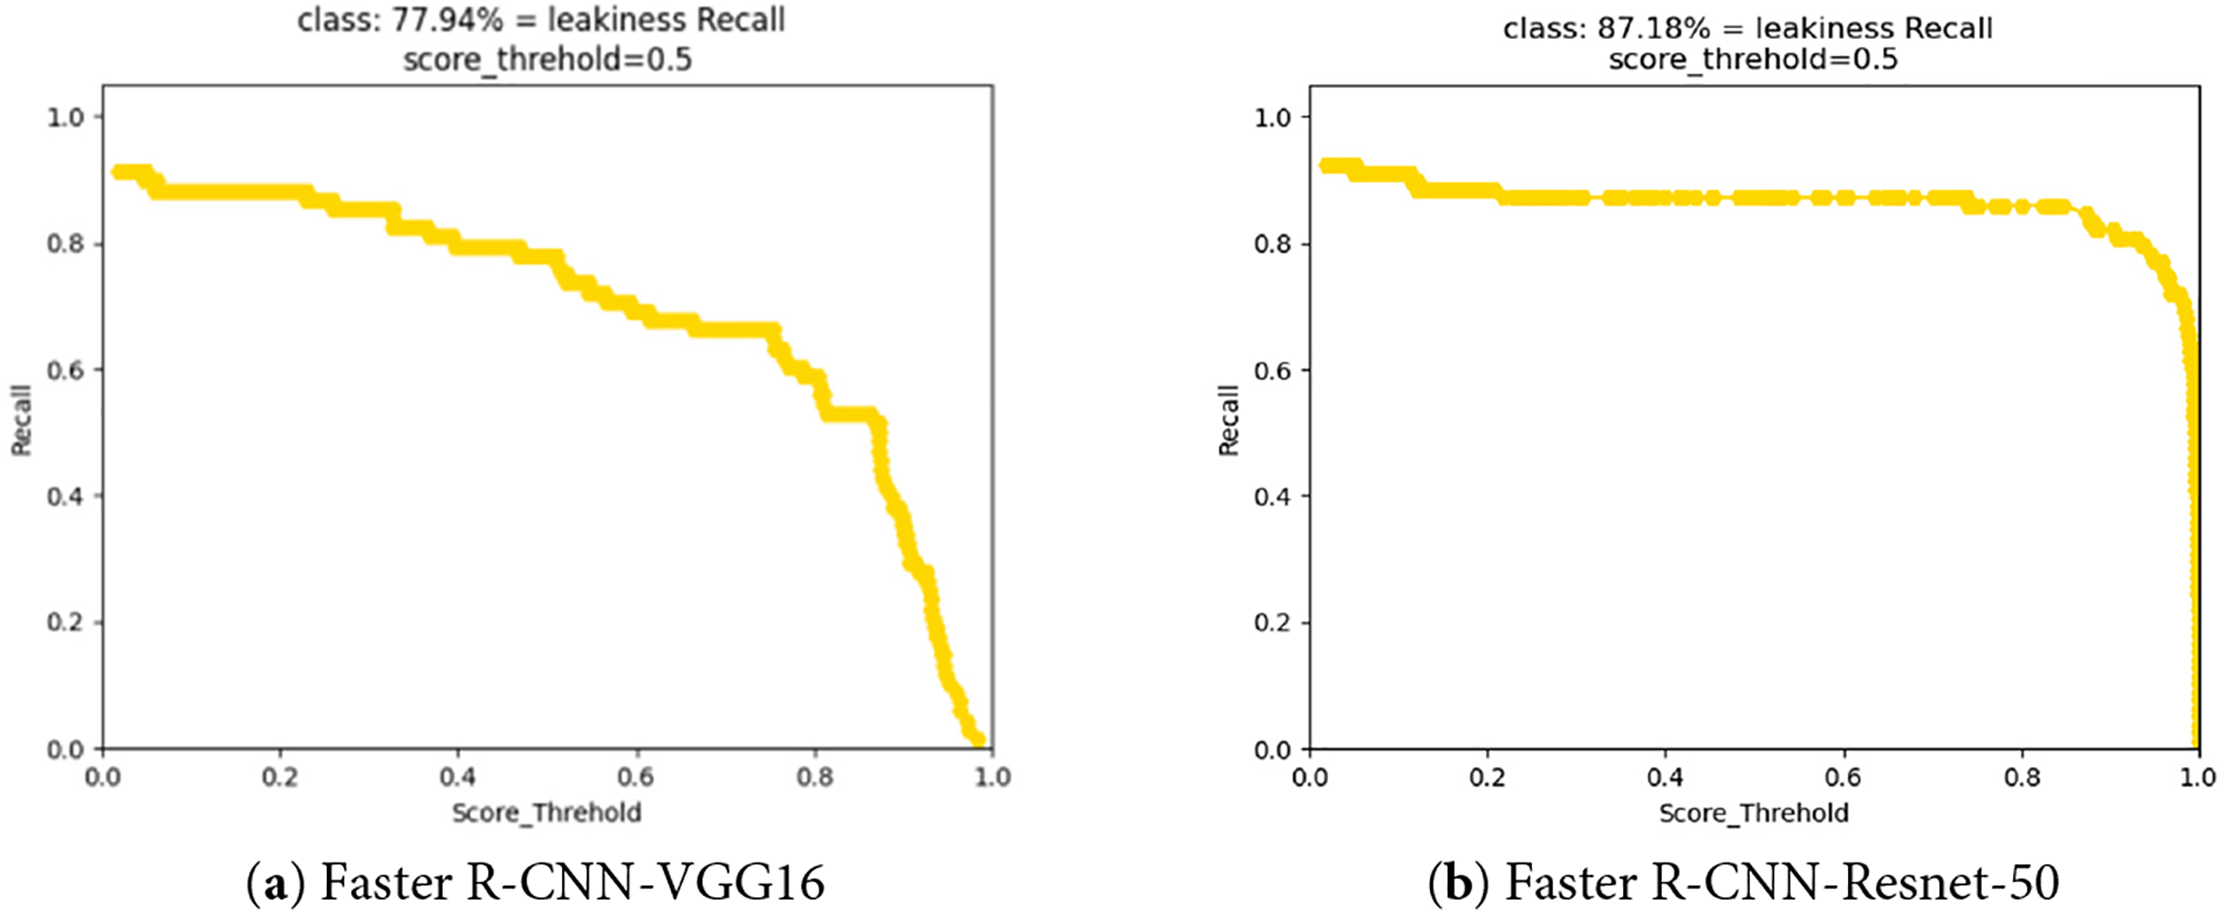
Figure 8: Recall-score-threshold curve
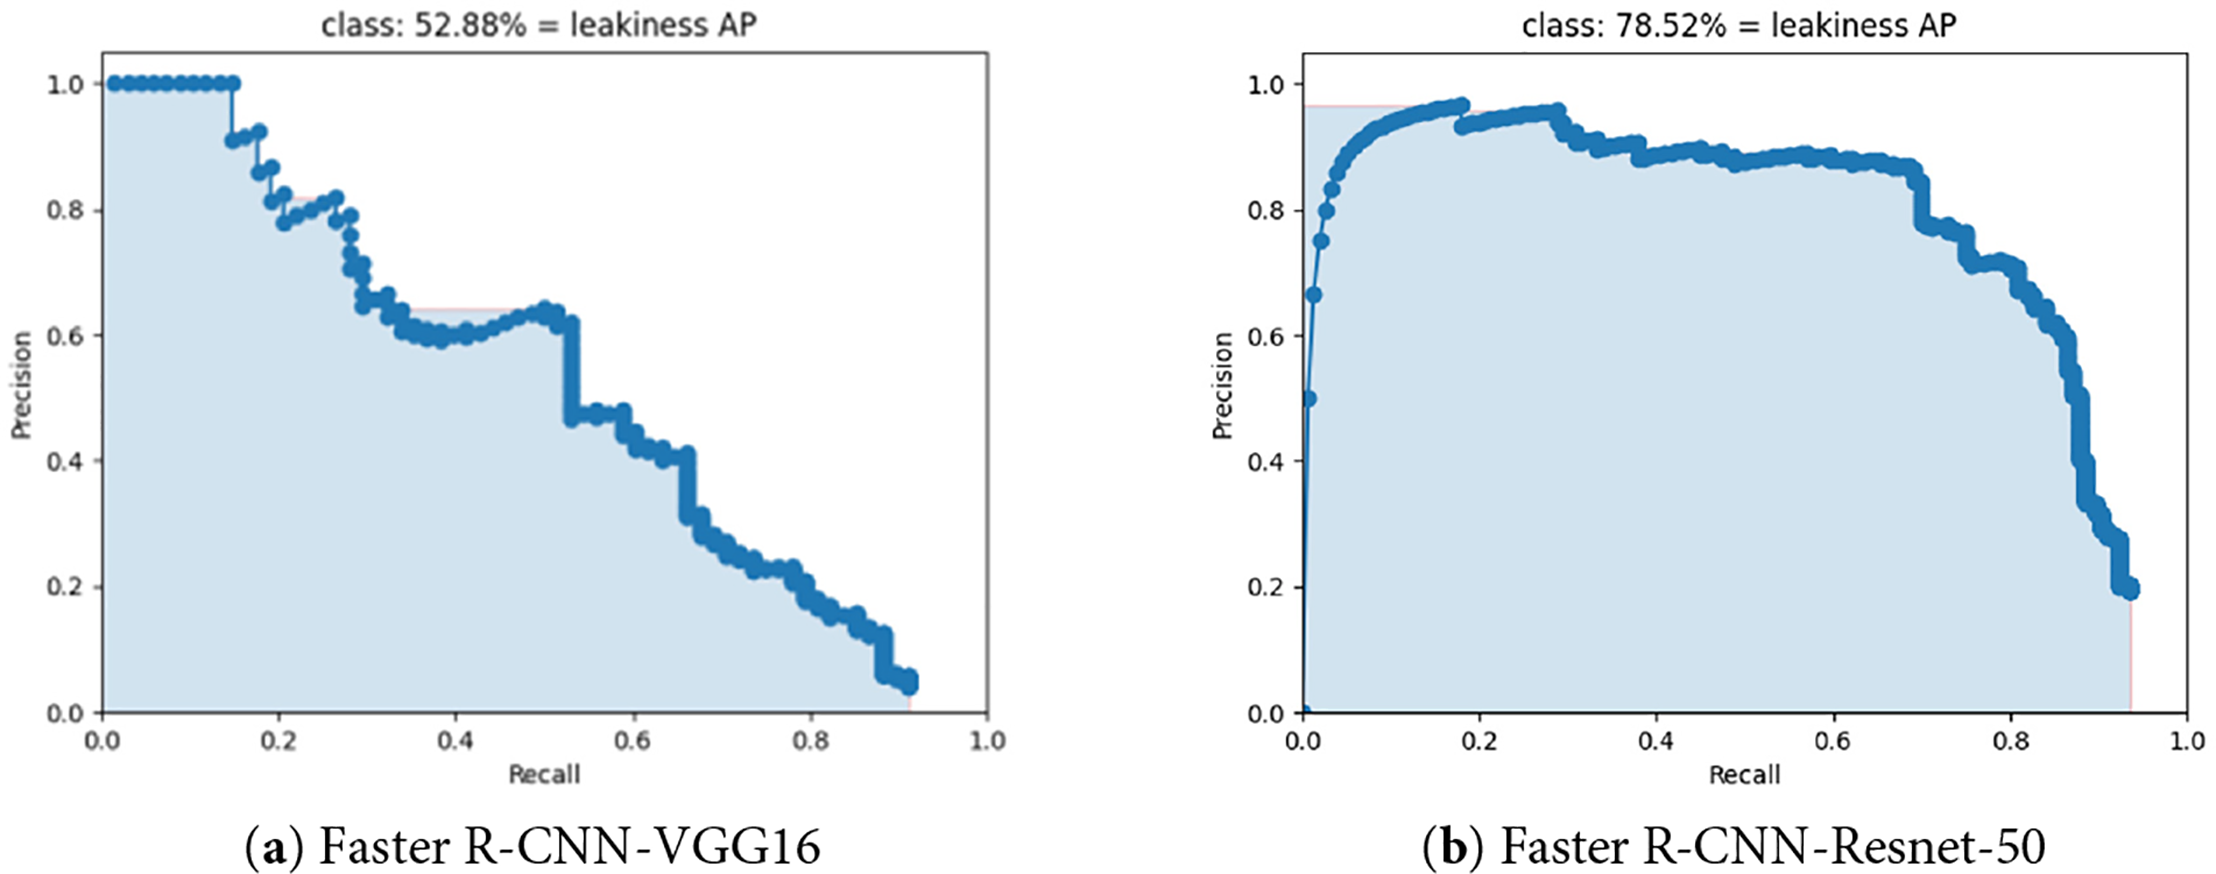
Figure 9: PR curve

Figure 10: mAP curve
Due to the suboptimal performance of the trained network model in object detection training, images containing only subgrade disease features were segmented from the original radar dataset to highlight the radar disease features and minimize the interference from radar noise. Disease segmentation aids in the precise recognition and localization of underground diseases for object detection. Additionally, disease segmentation can enhance the efficiency of subsequent object detection network processing and analysis. After acquiring the ground-penetrating radar (GPR) images, the network model typically requires a series of processing and analysis steps to extract useful feature information. By performing disease segmentation in advance, the focus can be directed towards potential disease-affected areas, avoiding indiscriminate processing of the entire image. This improves the efficiency and accuracy of feature extraction. Therefore, by implementing disease feature segmentation, the detection accuracy can be further enhanced. The image after disease segmentation is shown in Fig. 11.
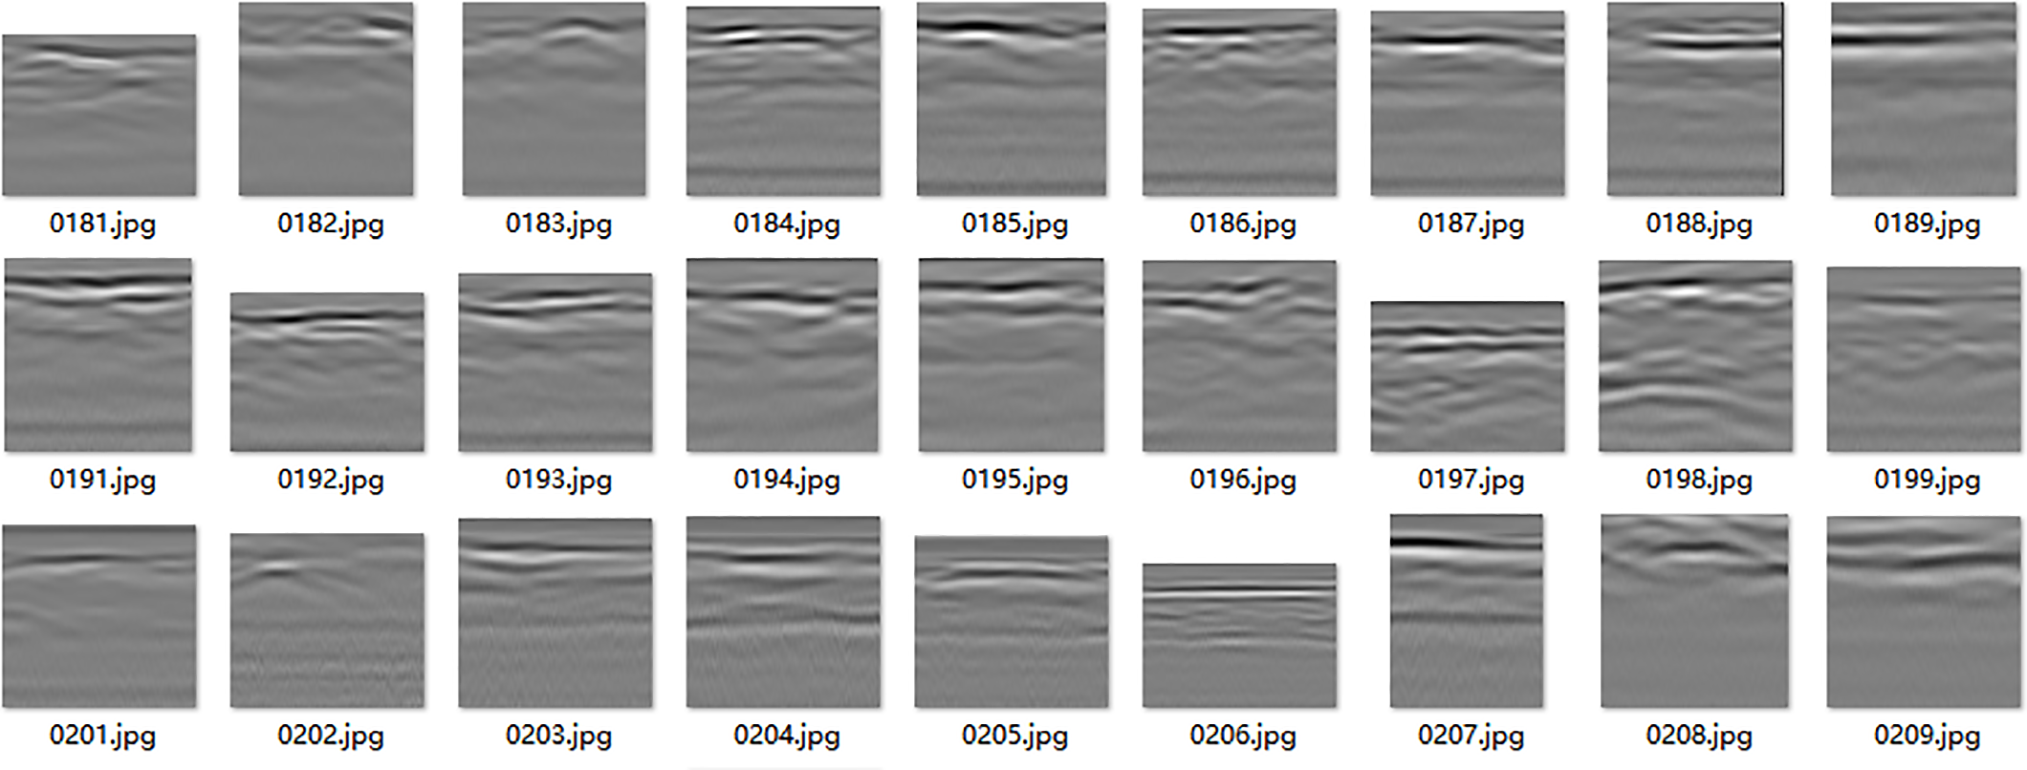
Figure 11: Radar image subgrade disease segmentation processing
Converting the grayscale values of radar images into binary values can facilitate better recognition and analysis of underground structures or disease features. Binarization is applied to the segmentation of radar images, transforming the desired images containing disease features into black-and-white images, providing better support for subsequent image recognition. In this paper, the global threshold binarization method is employed, using the Otsu algorithm to determine the threshold. This algorithm utilizes the maximum inter-class variance to divide the image into foreground and background parts.
Through binarization processing, the contrast between targets such as looseness, and the background in the ground-penetrating radar images becomes more pronounced, thereby enhancing the disease features. The effect of binarization is illustrated in Fig. 12. The binarized image can clearly show the boundaries and shapes of these areas, facilitating subsequent image analysis and interpretation by the object detection network.
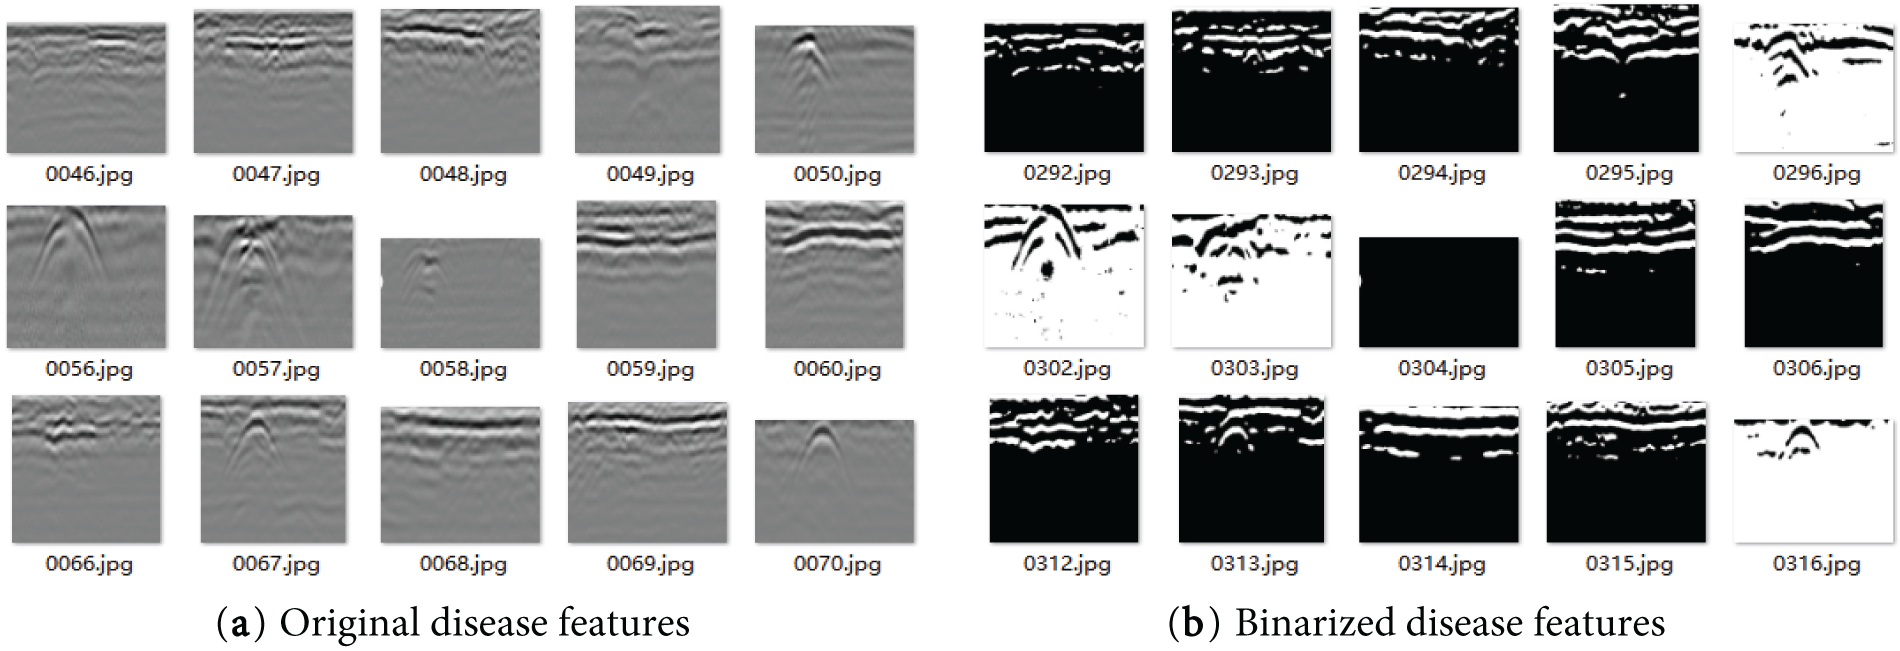
Figure 12: Binary processing of radar disease feature images
After segmenting the disease features and processing the binary disease features, to enhance the detection of weak defect signals in noisy GPR images, we integrate the two-dimensional discrete Fourier transform (2D-DFT) to extract frequency domain features in the improved Faster R-CNN-Resnet-50 target detection model. Each GPR image is divided into non-overlapping blocks of 64 × 64 pixels. A 2D-DFT is applied to each block, and the magnitude spectrum is computed. The resulting frequency map is resized to match the spatial dimensions of the original image and concatenated as an additional input channel. This process highlights periodic patterns and suppresses high-frequency noise, improving the model’s ability to distinguish between defects and clutter. The improvement of the target detection model in the improved evaluation indicators is shown in the figure below, the indicators are compared with those of the unoptimized Faster R-CNN-Resnet-50 as shown in Table 5.
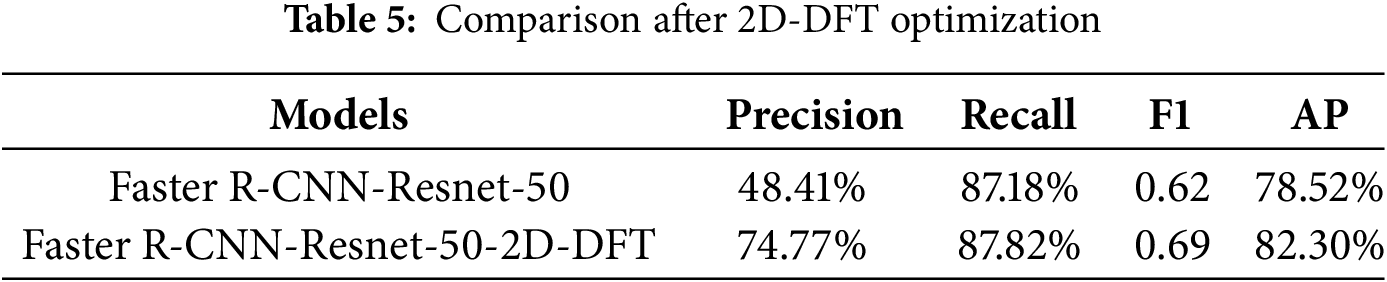
For the case of using ground penetrating radar (GPR) to detect small objects, the actual evaluation metrics of Faster R-CNN perform quite well. Therefore, we focus solely on improving and optimizing Faster R-CNN. By segmenting the radar image’s disease features, binarizing the processed disease features, and incorporating two-dimensional discrete Fourier transform, the network model fuses frequency domain features with two-dimensional image features. This approach significantly optimizes the disease detection and target detection network, resulting in a 26% increase in precision while maintaining a stable recall rate of 87%. Additionally, the average precision increases by 4%, and the mAP metric improves by 0.22 compared to the original Faster R-CNN-Resnet-50 model, reaching 0.92. Figs. 13–16 present various indicators obtained through the training of the model after processing the disease images.
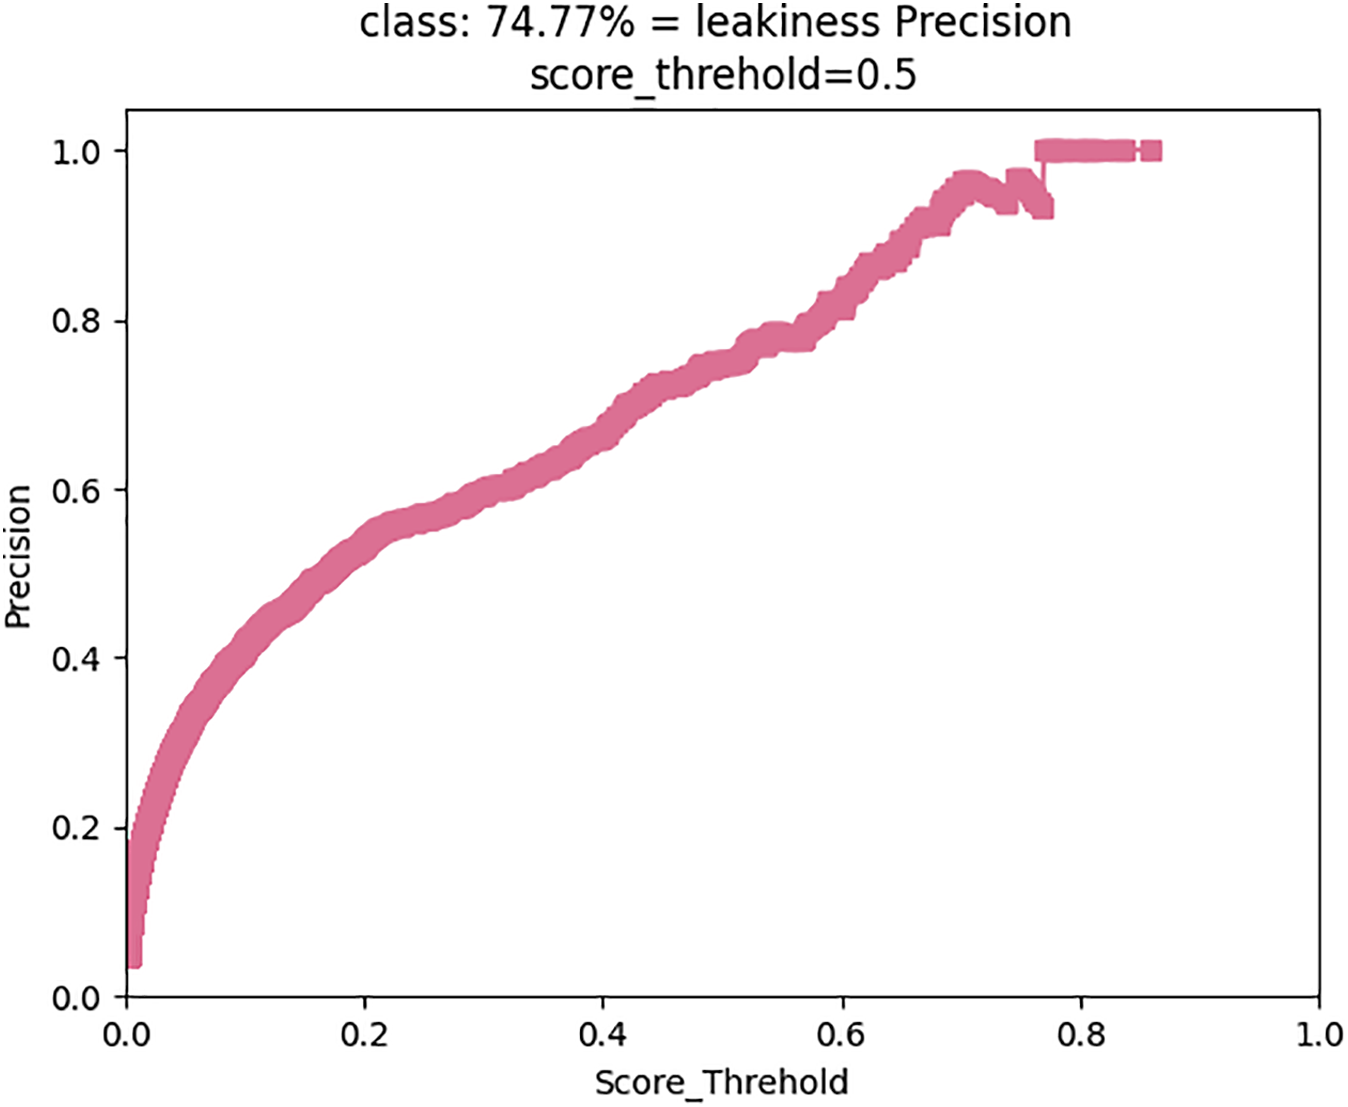
Figure 13: Precision metric after disease feature processing
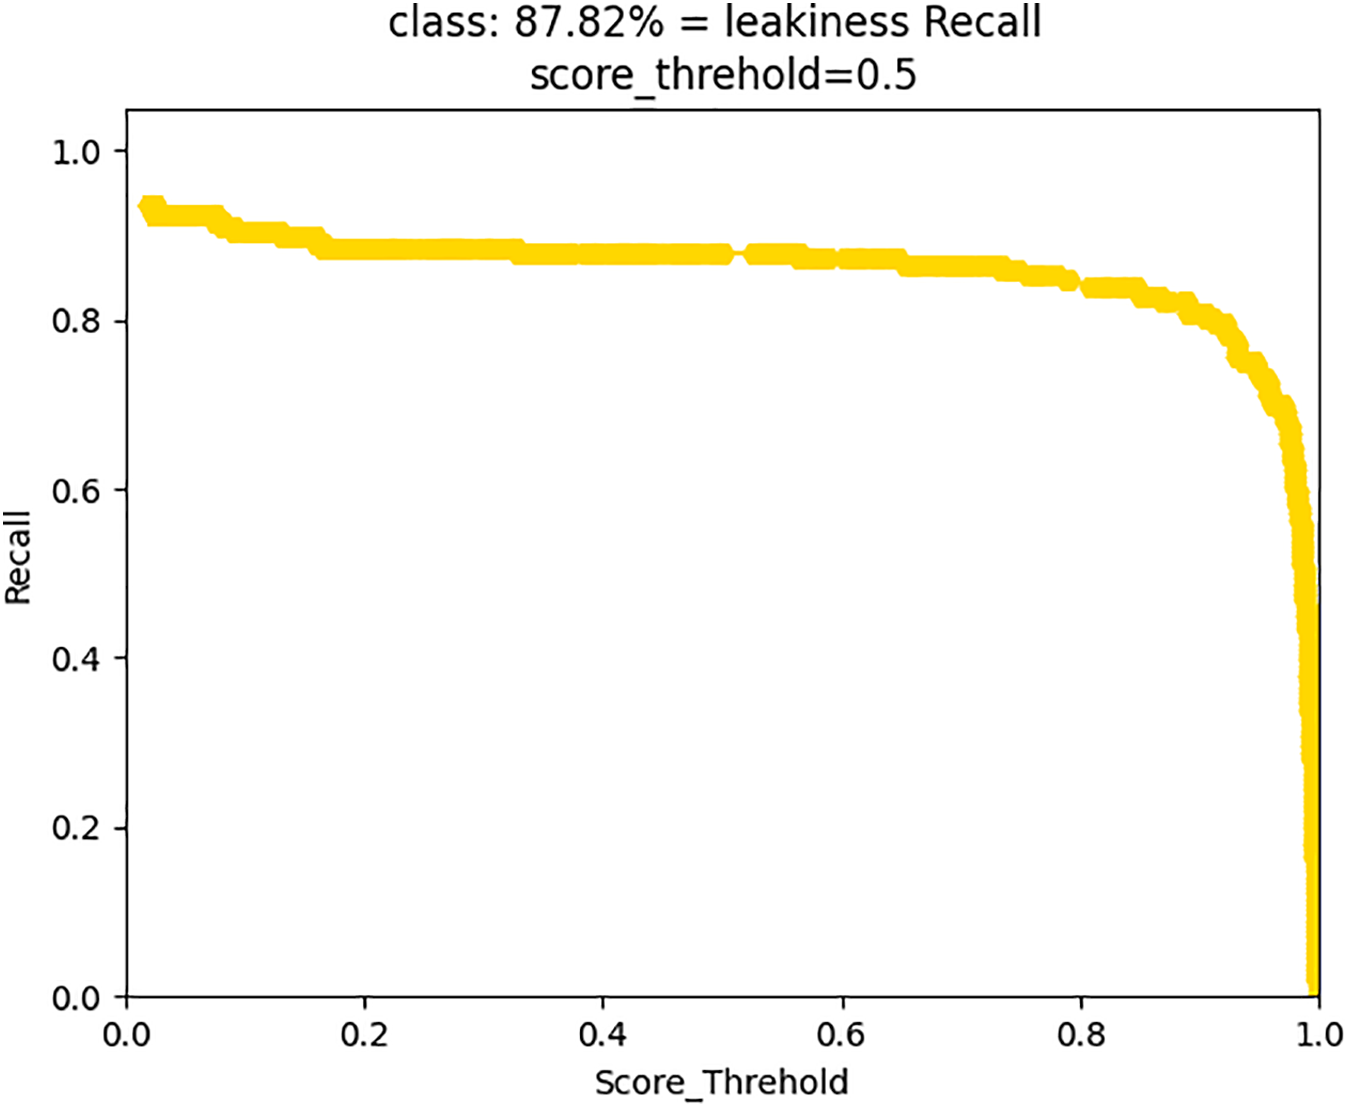
Figure 14: Recall metric after disease feature processing
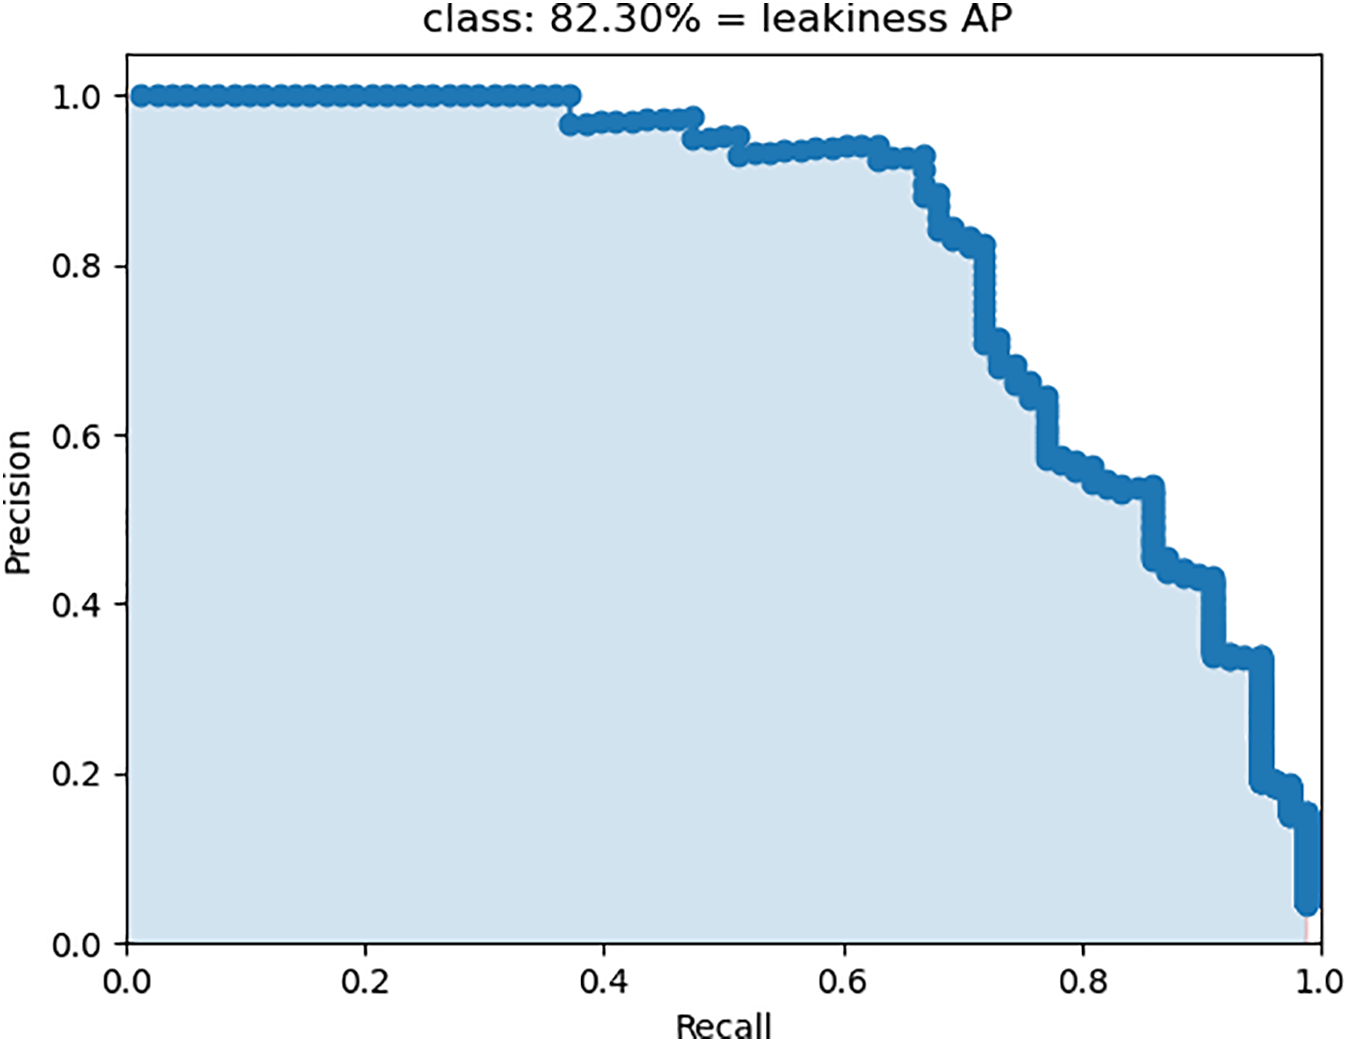
Figure 15: PR curve after disease feature processing
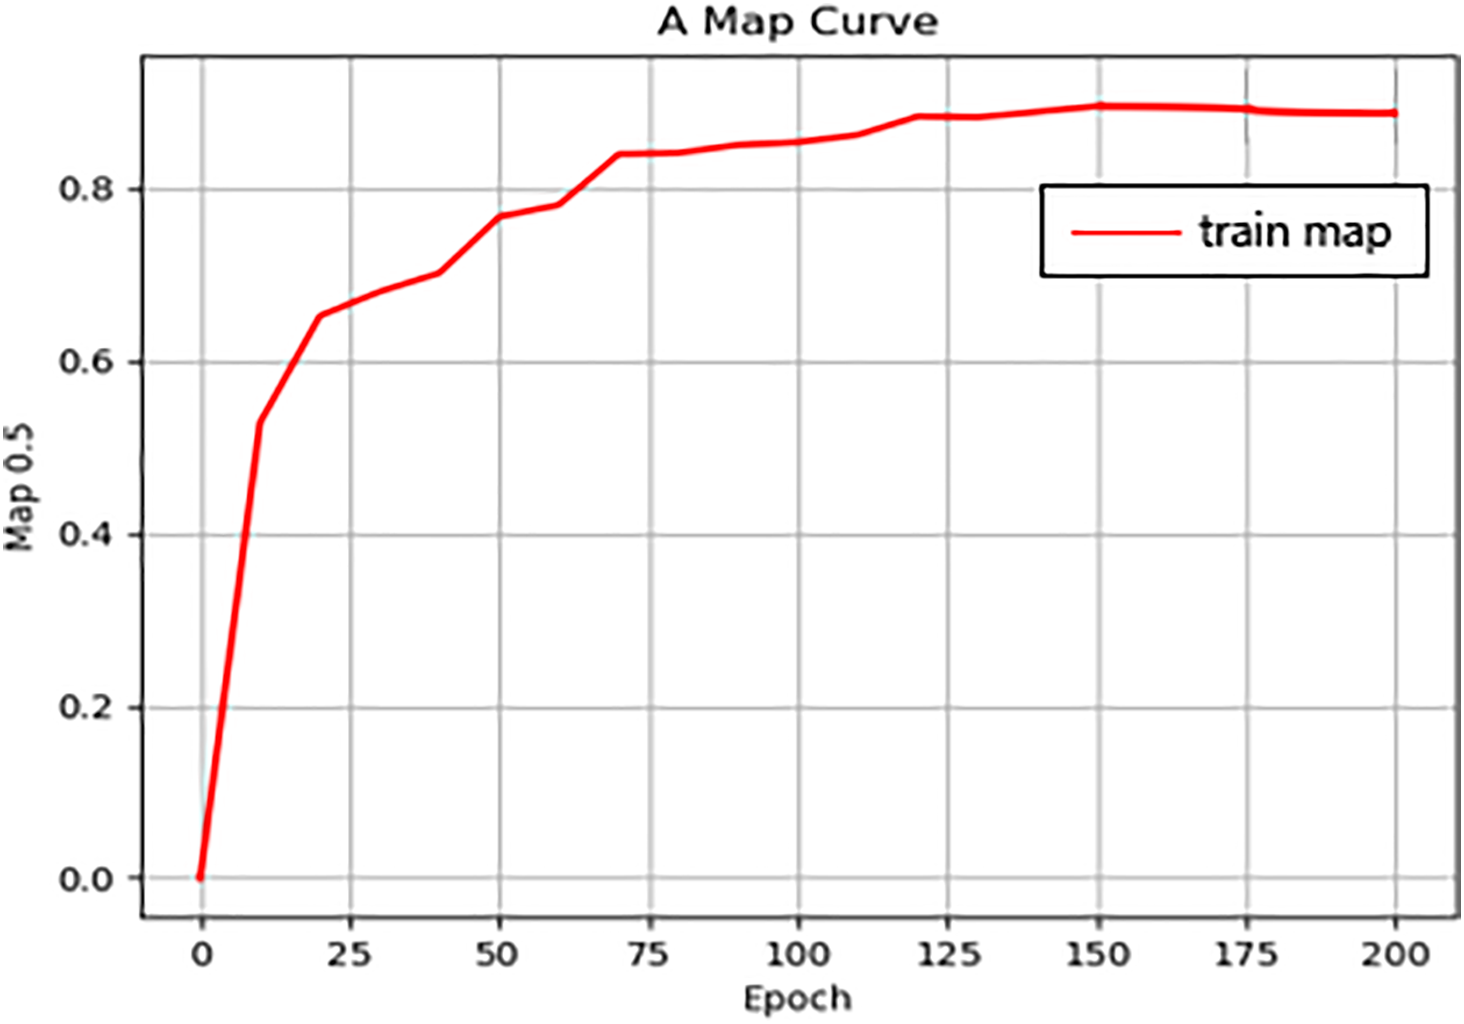
Figure 16: mAP metric after disease feature processing
3.3 Evaluation and Application of Roadbed Loosening Detection
After the development of the deep learning-based study, the GPR detection vehicle was used to inspect the subgrade diseases of actual urban roads, the layout of the detection lines and the inspection site of the road are shown in Fig. 17. A total of eight-channel detection lines are set up, and there is slight ponding on the road surface.
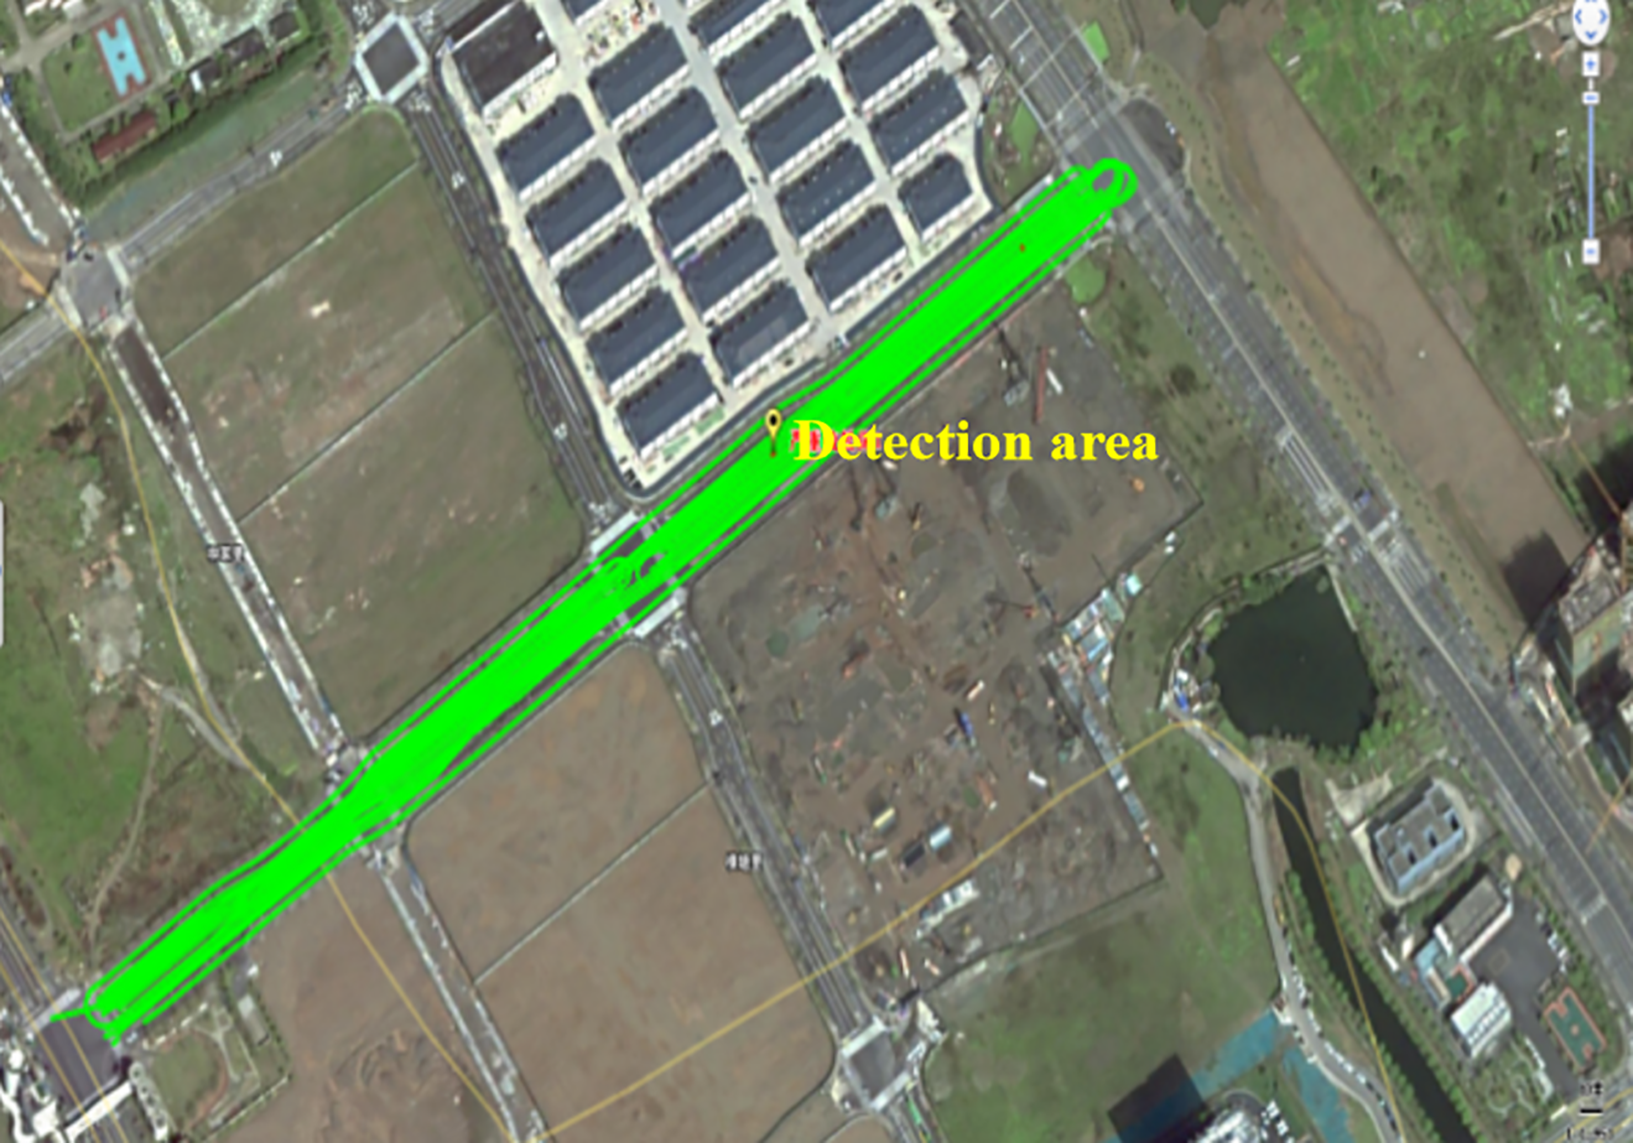
Figure 17: Radar detection line
After the preliminary processing of the two-dimensional GPR images, the software outputs the radar spectrogram for recognition by the trained target detection model. A total of 50 GPR images were collected for testing in this study. During the identification process, since the radar images were not very clear, the image features of some diseases were not obvious. To reduce false detections and omissions, and to screen out the results with low confidence levels, the confidence threshold was set at 0.5 in this study. Eventually, 16 images were identified, among which 10 were completely correct, accounting for 62.5%. Fig. 18 presents an example of typical recognition results. For image (a), the radar echo of the damage area was clear and has distinct contrast with other area of the image. The detected damage area was quite close to the ground-truth. In the image (b), a region with shallow echo waves was mistakenly recognized as the damage area. Comprehensively, the proposed model can detect most of the damage area, while some motifs can still cause errors.
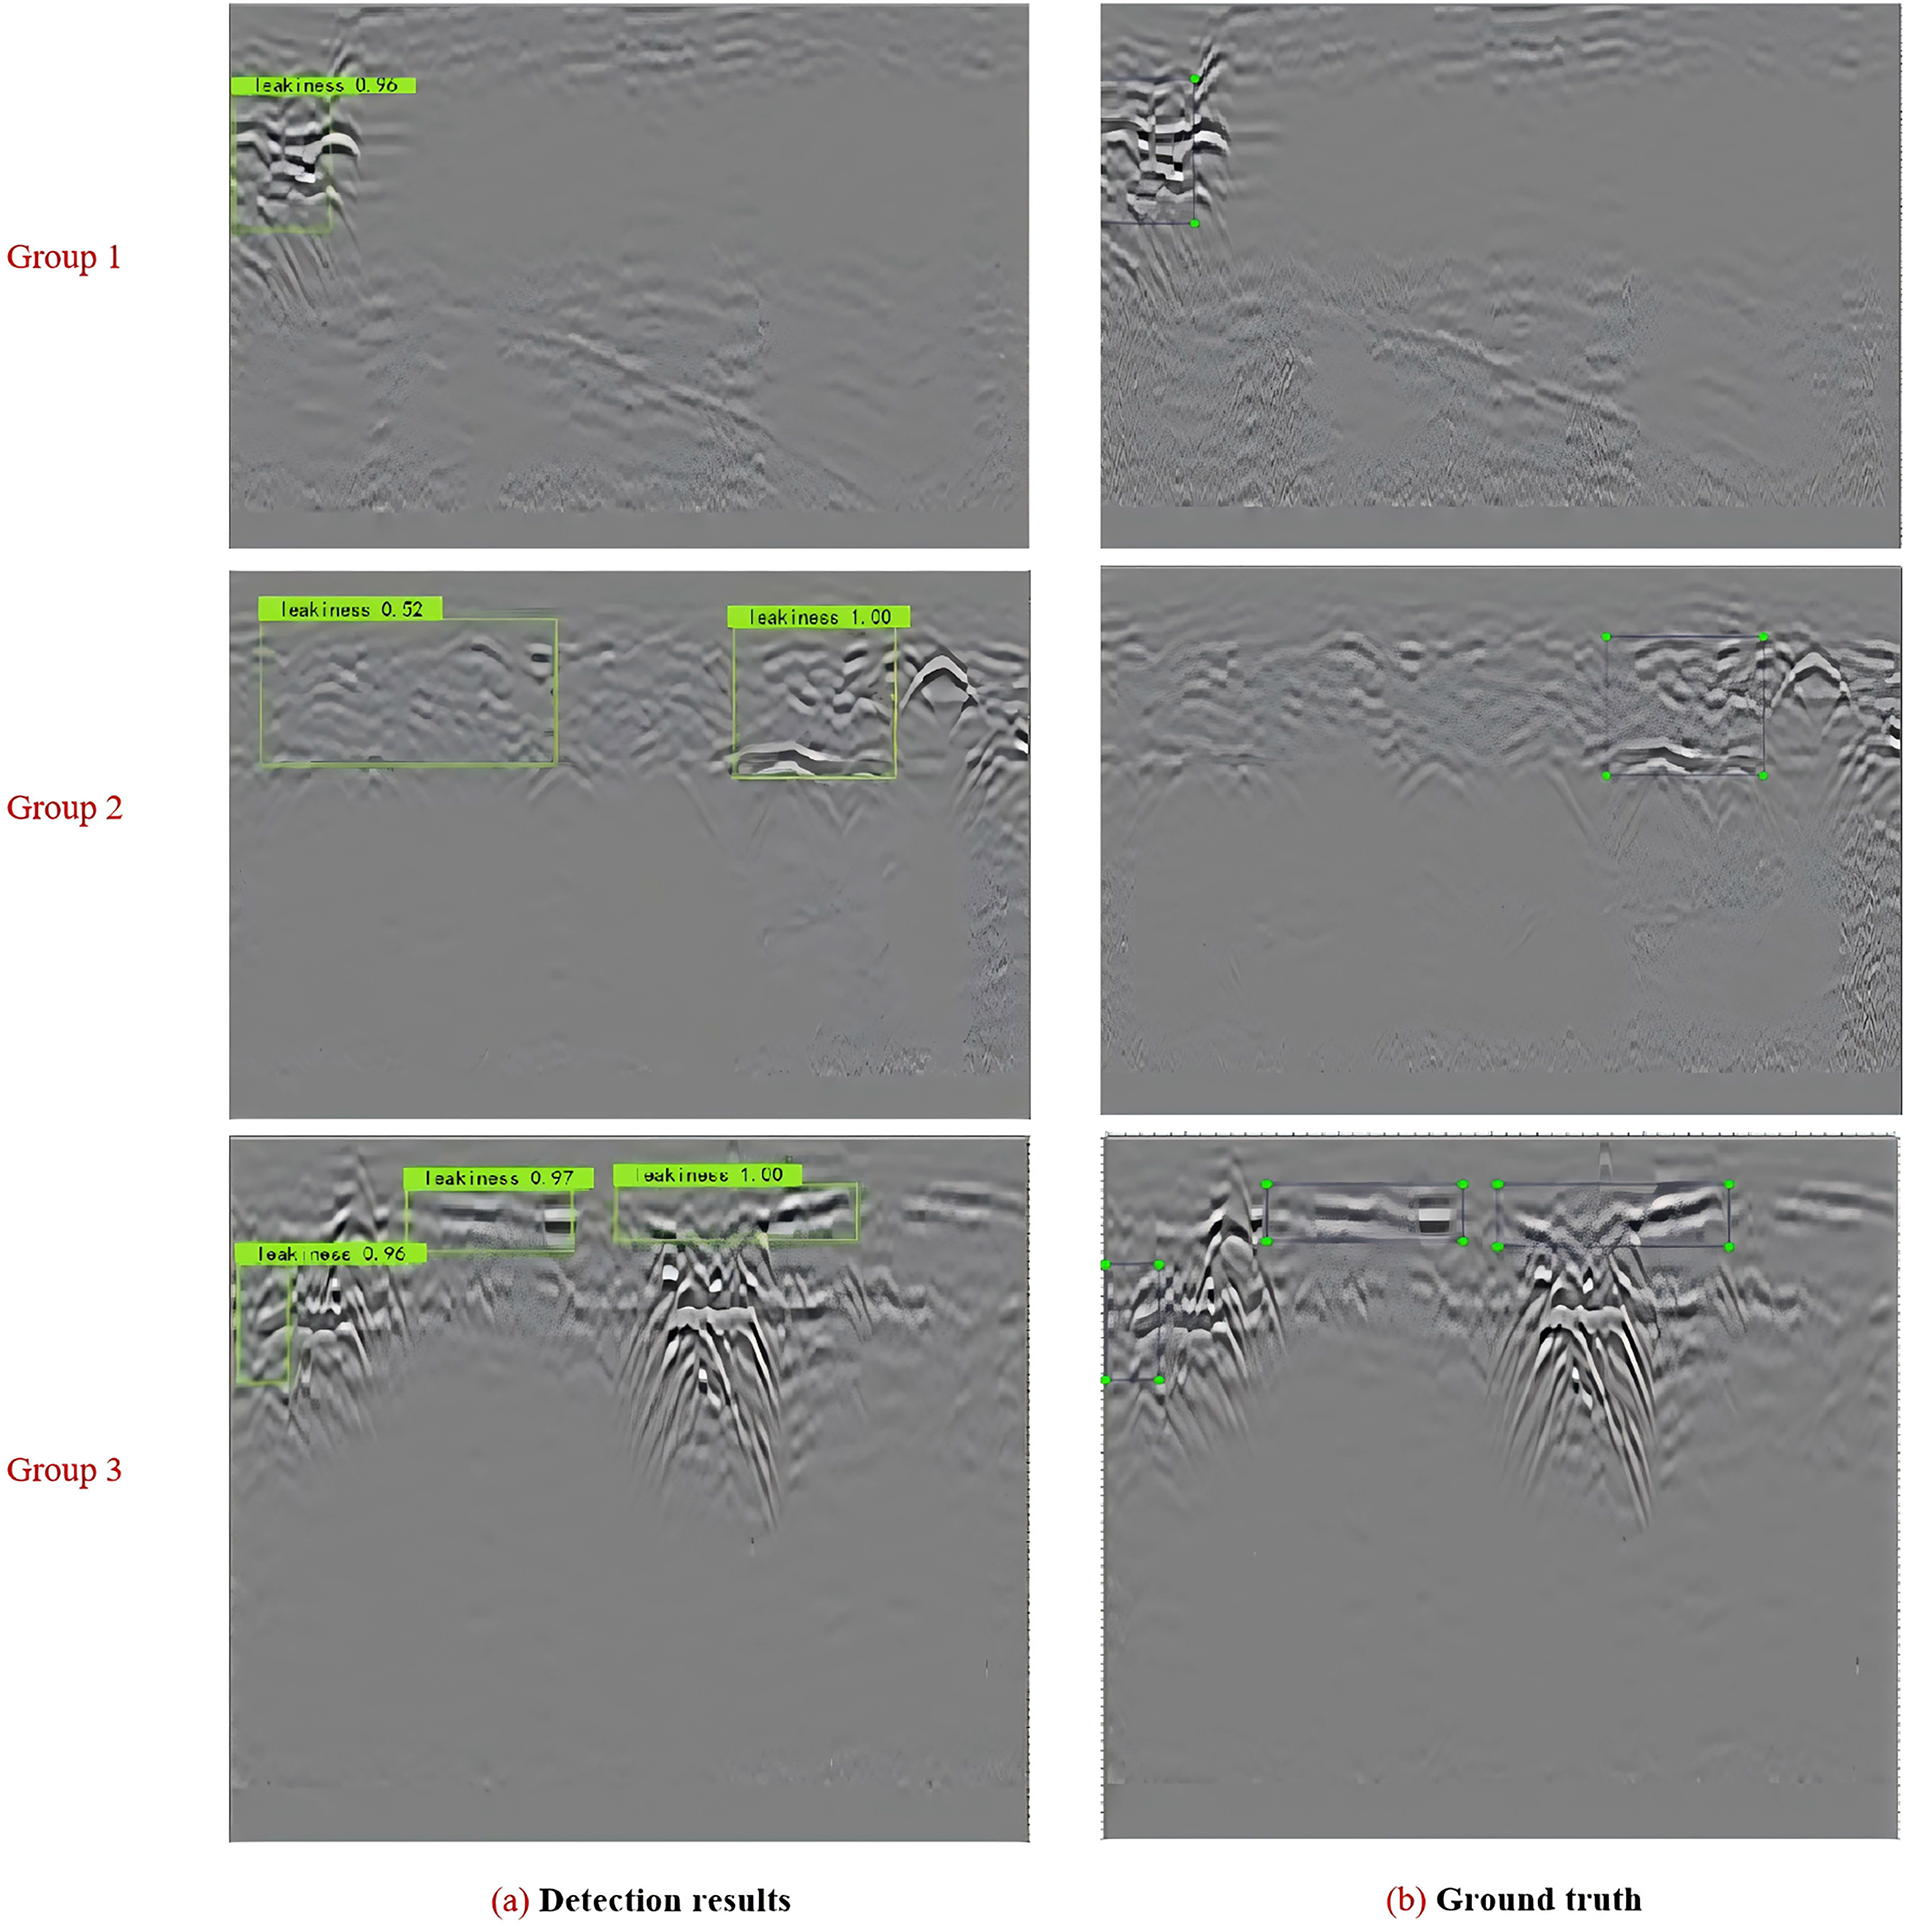
Figure 18: Case 1 identification of loose soil disease
This study proposes a deep learning and multiple image processing-based method to detect damage to the road subgrade. Faster R-CNN was used for subgrade-damage detection, and we applied median filtering, histogram equalization, and binarization to suppress noise artifacts and improve the contrast between the damage and the background. The main conclusions are listed below.
(i) Subgrade images were acquired using a GPR-equipped inspection vehicle, yielding a dataset of over 1650 annotated samples. Most annotations correspond to loosened (non-compaction) defects, with fewer cases of severe non-compaction and water-rich conditions. Although the dataset has been established, it remains class-imbalanced with limited category diversity. To address this, weakly supervised detectors such as WSDDN, could generate batch pseudo-boxes from image-level labels to expand minority classes and mitigate imbalance rapidly.
(ii) After replacing the backbone network with ResNet-50, adding disease segmentation and binary masks, and introducing 2D-DFT frequency domain channels, the model showed a significant improvement compared to the original model that only changed the backbone network to VGG16. The final model achieved an AP of 82.30%, an increase of 29.4% over VGG16, and an F1 score of 0.62, an increase of 27%. The PR curves and mAP trends in Figs. 13–16 also confirm this improvement, indicating that the joint structural and frequency-domain strategy markedly enhances the detection of hidden roadbed defects. In future work, a lightweight Efficient Channel Attention (ECA) attention mechanism can be embedded in the detection head to adaptively recalibrate channel weights and strengthen weak hyperbolic features.
(iii) After the training process, the model was deployed on field-project images and detected most subgrade defects; however, shallow reflections still triggered errors. Future work can construct a 3D GPR dataset that combines B-scans, C-scans, and D-scans and feeds them into a 3D-CNN or Transformer, leveraging multi-dimensional information to reduce such errors.
The GPR and deep learning-based methods offer an efficient method to detect subgrade damage. However, the subsurface contains numerous unknown reflectors that generate backscattered echoes, and effective noise suppression still requires further study. Promising directions include expanding and refining damage datasets with more precise annotations and improving damage–background contrast.
Acknowledgement: Not applicable.
Funding Statement: The work described in this paper was jointly supported by the Second Batch of Key Textbook Construction Projects of “14th Five-Year Plan” of Zhejiang Vocational Colleges (SZDJC-2412).
Author Contributions: Conceptualization: Zhuangqiang Wen and Zhekun Shou. Methodology: Zhuangqiang Wen and Zhekun Shou. Validation: Zhekun Shou and Min Zhang. Investigation: Min Zhang and Zhekun Shou. Data curation: Min Zhang. Writing—original draft preparation: Zhuangqiang Wen and Zhekun Shou. Writing—review and editing: Zhekun Shou and Min Zhang. All authors reviewed the results and approved the final version of the manuscript.
Availability of Data and Materials: The data used and/or analyzed during the current study are available from the corresponding author upon reasonable request.
Ethics Approval: Not applicable.
Conflicts of Interest: The authors declare no conflicts of interest to report regarding the present study.
References
1. Hu Q, Zhang Q, Liu W, Wang F, Che D, Ma M. Mitigation of urban road collapses based on machine learning via integrating susceptibility assessment and geophysical detection validation. Int J Disaster Risk Reduct. 2024;111:104667. doi:10.1016/j.ijdrr.2024.104667. [Google Scholar] [CrossRef]
2. Wang Z, Zhu J, Ma T. Review on monitoring of pavement subgrade settlement: influencing factor, measurement and advancement. Measurement. 2024;237:115225. doi:10.1016/j.measurement.2024.115225. [Google Scholar] [CrossRef]
3. Ye Y, Cai D, Yao J, Wei S, Yan H, Chen F. Review on dynamic modulus of coarse-grained soil filling for high-speed railway subgrade. Transp Geotech. 2021;27:100421. doi:10.1016/j.trgeo.2020.100421. [Google Scholar] [CrossRef]
4. Wang J, Ying H, Fu HT, Song LF, Ni JF, Gao ZY. Field experiment and numerical simulation of the dynamic responses of rigid pipes in soft soil foundations under traffic loading. Structures. 2025;75:108739. doi:10.1016/j.istruc.2025.108739. [Google Scholar] [CrossRef]
5. Deng N, An Z, Hao J, Zhang Q. Few shot intelligent assessment method for compaction quality of earthwork considering uncertainty. Expert Syst Appl. 2024;256:125000. doi:10.1016/j.eswa.2024.125000. [Google Scholar] [CrossRef]
6. Lu Z, Yao HL, Wu WP, Cheng P. Dynamic stress and deformation of a layered road structure under vehicle traffic loads: experimental measurements and numerical calculations. Soil Dyn Earthq Eng. 2012;39:100–12. doi:10.1016/j.soildyn.2012.03.002. [Google Scholar] [CrossRef]
7. Tan K, Zhang T, Zhu W, Yang D, Lin D, Wang H, et al. Innovative high-strength, high-permeability concrete for large-scale applications in permeable sub-grade of highway tunnel. Case Stud Constr Mater. 2024;20:e02977. doi:10.1016/j.cscm.2024.e02977. [Google Scholar] [CrossRef]
8. Li H, Zhang J, Ye M, Wang Q, Wei M, Zhang Z, et al. High-accuracy intelligent detection of centimeter-level voids in cement pavement via ground-penetrating radar. Measurement. 2025;256:118354. doi:10.1016/j.measurement.2025.118354. [Google Scholar] [CrossRef]
9. Liu W, Luo R, Xiao M, Chen Y. Intelligent detection of hidden distresses in asphalt pavement based on GPR and deep learning algorithm. Constr Build Mater. 2024;416:135089. doi:10.1016/j.conbuildmat.2024.135089. [Google Scholar] [CrossRef]
10. Azar L, Rivenson Y, Stern A. Machine learning-based automated defect detection in multi-channel phased-array ultrasonic data. J Nondestruct Eval. 2021;40(1):1–15. doi:10.1007/s10921-021-00796-4. [Google Scholar] [CrossRef]
11. Chang JR, Chang KT, Chen DH. Application of 3D laser scanning on measuring pavement roughness. J Test Eval. 2006;34(2):83–91. doi:10.1520/jte13178. [Google Scholar] [CrossRef]
12. Wang HP, Liu WQ, Zhou Z, Liu X, Wei XF, Li Y. Design of flexible raw material encapsulated optical fiber sensor for asphalt concrete pavement monitoring. Highway. 2014;59(1):205–9. (In Chinese). [Google Scholar]
13. Liang X, Yu X, Chen C, Jin Y, Huang J. Automatic classification of pavement distress using 3D ground-penetrating radar and deep convolutional neural network. IEEE Trans Intell Transp Syst. 2022;23(11):22269–77. doi:10.1109/TITS.2022.3197712. [Google Scholar] [CrossRef]
14. Redmon J, Divvala S, Girshick R, Farhadi A. You only look once: unified, real-time object detection. In: Proceedings of the 2016 IEEE Conference on Computer Vision and Pattern Recognition (CVPR); 2016 Jun 27–30; Las Vegas, NV, USA. p. 779–88. doi:10.1109/CVPR.2016.91. [Google Scholar] [CrossRef]
15. Girshick R. Fast R-CNN. In: Proceedings of the 2015 IEEE International Conference on Computer Vision (ICCV); 2015 Dec 7–13; Santiago, Chile. p. 1440–48. doi:10.1109/iccv.2015.169. [Google Scholar] [CrossRef]
16. Liu Z, Wu W, Gu X, Li S, Wang L, Zhang T. Application of combining YOLO models and 3D GPR images in road detection and maintenance. Remote Sens. 2021;13(6):1081. doi:10.3390/rs13061081. [Google Scholar] [CrossRef]
17. Qin H, Zhang D, Tang Y, Wang Y. Automatic recognition of tunnel lining elements from GPR images using deep convolutional networks with data augmentation. Autom Constr. 2021;130:103830. doi:10.1016/j.autcon.2021.103830. [Google Scholar] [CrossRef]
18. Ren S, He K, Girshick R, Sun J. Faster R-CNN: towards real-time object detection with region proposal networks. IEEE Trans Pattern Anal Mach Intell. 2017;39(6):1137–49. doi:10.1109/TPAMI.2016.2577031. [Google Scholar] [PubMed] [CrossRef]
19. Lei W, Hou F, Xi J, Tan Q, Xu M, Jiang X, et al. Automatic hyperbola detection and fitting in GPR B-scan image. Autom Constr. 2019;106:102839. doi:10.1016/j.autcon.2019.102839. [Google Scholar] [CrossRef]
20. Fang Z, Shi Z, Wang X, Chen W. Roadbed defect detection from ground penetrating radar B-scan data using Faster RCNN. IOP Conf Ser Earth Environ Sci. 2021;660(1):012020. doi:10.1088/1755-1315/660/1/012020. [Google Scholar] [CrossRef]
21. Montiel-Zafra V, Canadas-Quesada FJ, Vera-Candeas P, Ruiz-Reyes N, Rey J, Martinez J. A novel method to remove GPR background noise based on the similarity of non-neighboring regions. J Appl Geophys. 2017;144:188–203. doi:10.1016/j.jappgeo.2017.07.010. [Google Scholar] [CrossRef]
22. Li S, Zhou S, Lu W, Zhou Z. GPR image denoising based on unpaired data: enhancing defect detection inside tunnels by TID-CycleGAN. Constr Build Mater. 2025;475:141179. doi:10.1016/j.conbuildmat.2025.141179. [Google Scholar] [CrossRef]
23. Zhang L, Ling T, Yu B, Huang F, Zhang S. Intensive interferences processing for GPR signal based on the wavelet transform and F-K filtering. J Appl Geophys. 2021;186:104273. doi:10.1016/j.jappgeo.2021.104273. [Google Scholar] [CrossRef]
24. Li Y, Liu C, Yue G, Gao Q, Du Y. Deep learning-based pavement subsurface distress detection via ground penetrating radar data. Autom Constr. 2022;142:104516. doi:10.1016/j.autcon.2022.104516. [Google Scholar] [CrossRef]
25. He W, Hao T, Ke H, Zheng W, Lin K. Joint time-frequency analysis of ground pene-trating radar data based on variational mode decomposition. J Appl Geophys. 2020;181:104146. doi:10.1016/j.jappgeo.2020.104146. [Google Scholar] [CrossRef]
26. Zhang J, Yang X, Li W, Zhang S, Jia Y. Automatic detection of moisture damages in asphalt pavements from GPR data with deep CNN and IRS method. Autom Constr. 2020;113:103119. doi:10.1016/j.autcon.2020.103119. [Google Scholar] [CrossRef]
27. Wang H, Zhang C, Liu X, Chen J. Cascade CNN with GPR physical prior for clutter suppression and hyperbola completion. IEEE Trans Geosci Remote Sens. 2024;62:1–15. [Google Scholar]
28. Zhang Y, Zheng Y, Tu Z, Wu C, Zhang T. CFFM: multi-task lane object detection method based on cross-layer feature fusion. Expert Syst Appl. 2024;257:125051. doi:10.1016/j.eswa.2024.125051. [Google Scholar] [CrossRef]
29. Chen T, Dai J, Dong B, Zhang T, Xu W, Wang Z. Road marking defect detection based on CFG_SI_YOLO network. Digit Signal Process. 2024;153:104614. doi:10.1016/j.dsp.2024.104614. [Google Scholar] [CrossRef]
30. Li H, Zhang J, Ye M, Cheng Z, Wu C, Tian Y. Automated detection of multi-scale voids in airport runways with clutter suppression method from 3D GPR data. Constr Build Mater. 2025;492:142779. doi:10.1016/j.conbuildmat.2025.142779. [Google Scholar] [CrossRef]
31. Luo TX, Zhou Y, Zheng Q, Hou F, Lin C. Lightweight deep learning model for identifying tunnel lining defects based on GPR data. Autom Constr. 2024;165:105506. doi:10.1016/j.autcon.2024.105506. [Google Scholar] [CrossRef]
32. Zhou Z, Zhou S, Li S, Li H, Yang H. Tunnel lining quality detection based on the YOLO-LD algorithm. Constr Build Mater. 2024;449:138240. doi:10.1016/j.conbuildmat.2024.138240. [Google Scholar] [CrossRef]
33. Yao J, Xu S, Huang F, Su C. Improved lightweight infrared road target detection method based on YOLOv8. Infrared Phys Technol. 2024;141:105497. doi:10.1016/j.infrared.2024.105497. [Google Scholar] [CrossRef]
34. Yu Q, Xu X, Xia P, Xu S, Wang H, Rodić A, et al. YOLOv7-tiny road target detection algorithm based on attention mechanism. Procedia Comput Sci. 2024;250:95–100. doi:10.1016/j.procs.2024.11.014. [Google Scholar] [CrossRef]
35. Xiang S, Ma J, Shang Q, Wang X, Chen D. Two-layer attention feature pyramid network for small object detection. Comput Model Eng Sci. 2024;141(1):713–31. doi:10.32604/cmes.2024.052759. [Google Scholar] [CrossRef]
36. Bhanbhro H, Hooi YK, Zakaria MNB, Kusakunniran W, Amur ZH. MCBAN: a small object detection multi-convolutional block attention network. Comput Mater Continua. 2024;81(2):2243–59. doi:10.32604/cmc.2024.052138. [Google Scholar] [CrossRef]
37. Rosso MM, Marasco G, Aiello S, Aloisio A, Chiaia B, Marano GC. Convolutional networks and transformers for intelligent road tunnel investigations. Comput Struct. 2023;275:106918. doi:10.1016/j.compstruc.2022.106918. [Google Scholar] [CrossRef]
38. Liang X, Zhang Q, Wang H. Multi-view BCD-scan fusion YOLOv5-BiFPN for GPR pavement distress Detection. IEEE Trans Intell Transp Syst. 2022;23:22269–77. [Google Scholar]
39. Wang B, Chen P, Zhang G. Simulation of GPR B-scan data based on dense generative adversarial network. IEEE J Sel Top Appl Earth Obs Remote Sens. 2023;16:3938–44. doi:10.1109/jstars.2023.3267482. [Google Scholar] [CrossRef]
40. Alzubaidi L, Chlaib HK, Fadhel MA, Chen Y, Bai J, Albahri AS, et al. Reliable deep learning framework for the ground penetrating radar data to locate the horizontal variation in levee soil compaction. Eng Appl Artif Intell. 2024;129:107627. doi:10.1016/j.engappai.2023.107627. [Google Scholar] [CrossRef]
Cite This Article
 Copyright © 2026 The Author(s). Published by Tech Science Press.
This work is licensed under a Creative Commons Attribution 4.0 International License , which permits unrestricted use, distribution, and reproduction in any medium, provided the original work is properly cited.
 Downloads
 Citation Tools