
 Submit a Paper
 Propose a Special lssue
 Open Access
ARTICLE

Numerical Investigation of the Characteristics of Wind Loads on Offshore Photovoltaic (PV) Panels over Uneven Bottom Boundary
1 College of Civil Engineering, Zhejiang University of Technology, Hangzhou, 310023, China
2 School of Ocean Engineering, Harbin Institute of Technology, Weihai, Weihai, 264209, China
3 China Construction Eighth Engineering Division Co., Ltd., Shanghai, 200135, China
4 China Construction Eighth Bureau General Contracting Construction Co., Ltd., Shanghai, 201204, China
5 School of Civil Engineering and Architecture, Xinjiang University, Urumqi, 830047, China
* Corresponding Author: Qinghe Fang. Email:
Structural Durability & Health Monitoring 2026, 20(2), 3 https://doi.org/10.32604/sdhm.2025.072871
Received 05 September 2025; Accepted 23 October 2025; Issue published 31 March 2026
 View Full Text
 Download PDF
Abstract
This study presents a systematic numerical analysis of wind loads on offshore photovoltaic (PV) panels. A computational fluid dynamics (CFD) model, incorporating a free-surface wave boundary condition, is developed and validated against experimental data. Parametric investigations quantify the effects of wind speed, panel tilt angle, clearance, and wave characteristics on the aerodynamic coefficients (drag, lift, and moment). Results indicate that all force coefficients increase with wind speed, with the lift coefficient being most sensitive to wave action. While a larger tilt angle intensifies airflow disturbance and amplifies the coefficients, this effect is more pronounced over flat ground than above a wavy surface. As clearance increases, the drag coefficient fluctuates before rising, the lift coefficient exhibits a trough-shaped response, and the moment coefficient increases monotonically, with values consistently higher over waves. Furthermore, the aerodynamic coefficients generally decrease with greater wave height. The maximum wind load occurs directly above the wave trough, and the aerodynamic force coefficient varies non-monotonically with wave position, first decreasing and then increasing. These findings offer practical guidance for the structural design and safety assurance of offshore PV systems.Keywords
To meet the enormous global energy demand and diminish reliance on fossil energy sources, solar power has become increasingly popular all over the world. According to the International Energy Agency (IEA) 2024 report, renewable sources are expected to satisfy nearly half of global electricity demand by 2030 [1]. Due to spatial limitations and the geographical distribution of power load centers, offshore photovoltaic (PV) is becoming an increasingly vital sector in the solar power industry. The fishery-photovoltaic or wind-photovoltaic multi-energy complementary systems are installed regularly [2]. PV systems installed over water would benefit from extended effective insolation due to the unobstructed expanse of open water and the additional irradiance provided by water-surface reflections, yielding approximately 13% more electricity than comparable land-based arrays [3]. Offshore PV systems are generally divided into two categories: pile-mounted systems, which are employed in shallow waters (typically less than 3 m depth), and floating platforms, which are preferred for water depth greater than 5 m [4]. However, offshore PV systems confront significant challenges in wind-load design due to wind-wave interactions which would amplify loading complexity. Existing studies show that the nonlinear and correlation effects of wind and waves would significantly affect the aerodynamic responses of coastal bridge [5]. Yin et al. [6] further revealed that the dynamic motion of the water surface during wave propagation is one of the key factors inducing wind field modifications and generating this coupling effect. The effect of water surface undulations on the aerodynamic loads is an issue particularly critical for photovoltaic (PV) systems due to their low-weight and lightly-damping dynamic nature.
Extensive investigations have characterized wind-load behavior on PV panels. Zhao et al. [7] experimentally quantified the peak pressure coefficients on solar arrays, revealing that downstream panels generally experienced up to 50% higher mean suction compared to upstream panels due to the influence of row spacing and tilt angle. Ma et al. [8] and Xu et al. [9], using rigid-model wind-tunnel tests, proposed a load-distribution model that incorporates panel inclination and wind-induced bending moments. Experimental work by Choi et al. [10] revealed that modules in the first and last rows of an array experience the highest drag and lift coefficients. Numerical simulations conducted by Agarwal et al. [11] corroborated this finding and further demonstrated significant aerodynamic forces under gusty conditions. To account for nonlinear fluid-structure interactions, Liu et al. [12] introduced a modified wind-vibration coefficient that transforms traditional linear superposition into a nonlinear coupling formulation. Jandova and Janda [13] further reported that inter-row spacing less than 1.5 times the panel height can reduce downstream wind loads by 40%–60%. Despite these advances, most existing studies overlook the moderating influence of wave-induced airflow at the free surface, limiting their relevance to offshore PV applications.
Recent studies of wind-wave coupling have advanced the understanding of offshore PV aerodynamics. Reference [14] found that the wave angle is crucial, as the resulting pontoon roll motion dynamically changes the PV panel’s effective angle of attack relative to the wind, directly leading to a significant periodic variation in the lift coefficient and surface pressure distribution. Song et al. [15] employed Computational Fluid Dynamics (CFD) to simulate floating PV platforms under simultaneous wave and wind action, revealing that wave nonlinearity markedly alters both drag and lift forces. Zhang et al. [16] investigated isolated wave-boundary effects on aerodynamic coefficients, observing a characteristic decrease-then-increase trend as wave crests approach. Buckles et al. [17] showed that large-amplitude waves shift the turbulent boundary-layer separation point downstream and intensify vortex formation. Using large-eddy simulation, Hao et al. [18] demonstrated that the undulating free-surface significantly modifies the wind-speed profile and engenders a more complex turbulent structure. Finally, numerical analysis conducted by Fu et al. [19] revealed wind-wave coupling significantly increases the surge motion and mooring forces of offshore floating photovoltaic systems at low frequencies. These findings underscore the necessity of integrated wind-wave modeling to predict aerodynamic loads on offshore PV installations accurately.
The moving wave bottom boundary would influence the wind loads as well as the structural response of offshore structures, such as offshore PV and offshore wind turbines. It is reported that the aerodynamic forces of PV panels are highly related to the amplitude of the pitch motion and the phase lag between the pitch and the heave motions [20]. The fluid-structure interaction plays an important role for the dynamics of offshore PV. A study of offshore wind turbine reveals the importance of considering the flexibility of the blades and tower to understand aeroelastic responses [21]. It is necessary to consider the fluid-structure interaction to capture the complex response of offshore structures, especially for extreme typhoon conditions [22]. Different with offshore wind turbines, the pile-supported offshore PV panels do not directly contact the seawater, which means that ocean waves only serve as the aerodynamic boundary for the panels. The blockage effects induced by water surface fluctuations could influence the aerodynamic loads on PV panels.
Although a number of research have been conducted on wind loads for various types of photovoltaic panels (e.g., roof-mounted, ground-mounted, flexible cable-supported, and tracking PV arrays), only limited studies have focused on the blockage effects induced by water surface fluctuations beneath the panels. To investigate the wind loads on offshore photovoltaic panels, the ocean waves is simplified as a static wavy boundary to reduce the complexity of numerical simulation. The PV panels were assumed as a rigid plate, because only the wind loads were concerned in this study. In this study, the blockage effect of free surface fluctuation on wind loads acting on PV modules installed over water area is investigated numerically. The water free-surface fluctuations were simplified as uneven terrain with a solitary wave shape above the flat bottom to save computational resources. The remainder of this paper is organized as follows. Section 2 describes the numerical model, including the governing equations, model configuration, and validation. Section 3 employs the validated model to systematically investigate the effects of wind speed, panel tilt angle, clearance, wave height, and wave phase on wind load characteristics. Finally, the key findings and their engineering implications are summarized at the end of this paper.
The flow field is assumed to be incompressible and governed by the Reynolds-Averaged Navier-Stokes (RANS) equations. The continuity and momentum equations are expressed as
where u represents the time-averaged velocity vector, describing the mean motion of the fluid flow, p denotes the time-averaged static pressure, ρ is the constant fluid density, ν is the molecular kinematic viscosity, which characterizes the fluid’s inherent resistance to shear due to molecular diffusion, νt is the eddy viscosity, a key concept in turbulence modeling that quantifies the enhanced momentum transfer caused by turbulent eddies, and f represents external body forces per unit mass, such as gravity, which drive or influence the flow.
To close the RANS equations, the Shear Stress Transport (SST) k-ω turbulence model proposed by Menter is employed due to its superior performance in resolving near-wall flow and separating shear layers. The SST model blends the standard k-ω model near the wall with the k-ε model in the far field through a blending function.
The transport equations for the turbulent kinetic energy k and the specific dissipation rate ω are given by
In the above equations, Pk represents the production of turbulent kinetic energy, νt is the turbulent eddy viscosity defined as
where S is the magnitude of the strain rate tensor, and F1, F2 are blending functions. The model constants α1, β1, β*, σk, and σω follow Menter [23]’s standard SST formulation.
2.2 Numerical Model Configuration
The numerical model was developed using the commercial CFD software ANSYS FLUENT. As shown in Fig. 1a, the computational domain measures 20.0 m in length, 20.0 m in width, and 11.0 m in height. The model solves the full flow field using the governing equations described above. In this study, the linear wave theory is utilized to descript the profile of static wavy ground, as shown as:
where H denote the wave height, k0 is the wavenumber, x0 is the distance from wave peak to the front edge of PV panel, and φ0 is the initial phase.
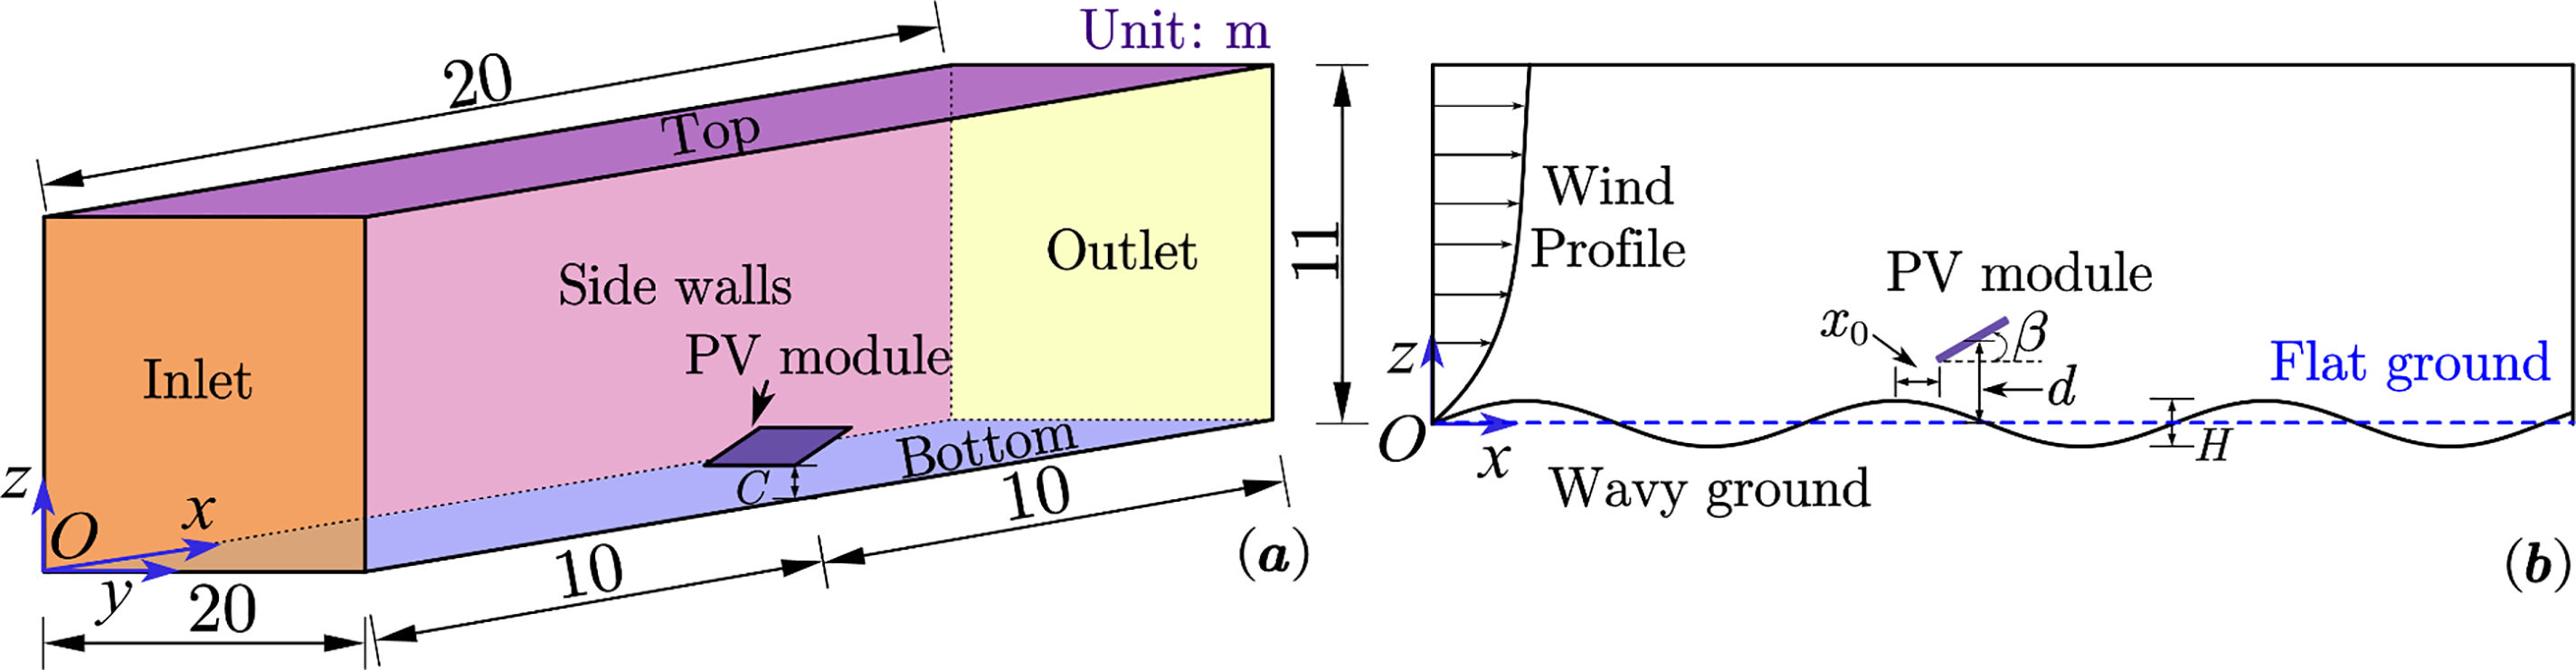
Figure 1: Diagrammatic sketch of the numerical model (a) dimensions of the computational domain and (b) front view of the numerical model
The geometrical configuration of the numerical model was established referring to the experimental tests conducted at the Wind Tunnel Laboratory of Shijiazhuang Tiedao University [24]. A Cartesian coordinate system was adopted, with the x-axis representing the panel’s spanwise direction and the z-axis representing the vertical direction. The inlet boundary was set 10 m upstream of the panel and defined as a velocity inlet with a non-uniform wind profile. A pressure outlet was placed 10 m downstream to allow free outflow. Vertically, the domain extends up to 11 m, with the top boundary representing the atmospheric boundary layer. The PV module was simplified as a flat aluminum plate with dimensions of 820 mm in width, 2480 mm in length, and 10 mm in thickness, as shown in Fig. 1b.
The numerical model is validated under two conditions, with the flat ground case serving as the first. As shown in Fig. 2a, a single PV panel is placed above a flat surface, and PV tilt angle is set to 30°. In Fig. 2b, the 3D view of the model with flat ground is shown. In this study, wind and turbulence parameters are specified as defined by the following expressions:
where Uref is the reference wind speed at the reference height zref = 10 m, α1 = 0.12 is the power-law exponent for offshore conditions, I is the turbulence intensity, Cμ = 0.09 is an empirical constant, l(z) is the turbulence length scale in meters. It is noteworthy that Uref is set as 12 m/s in the both flat ground and obstructed ground below.
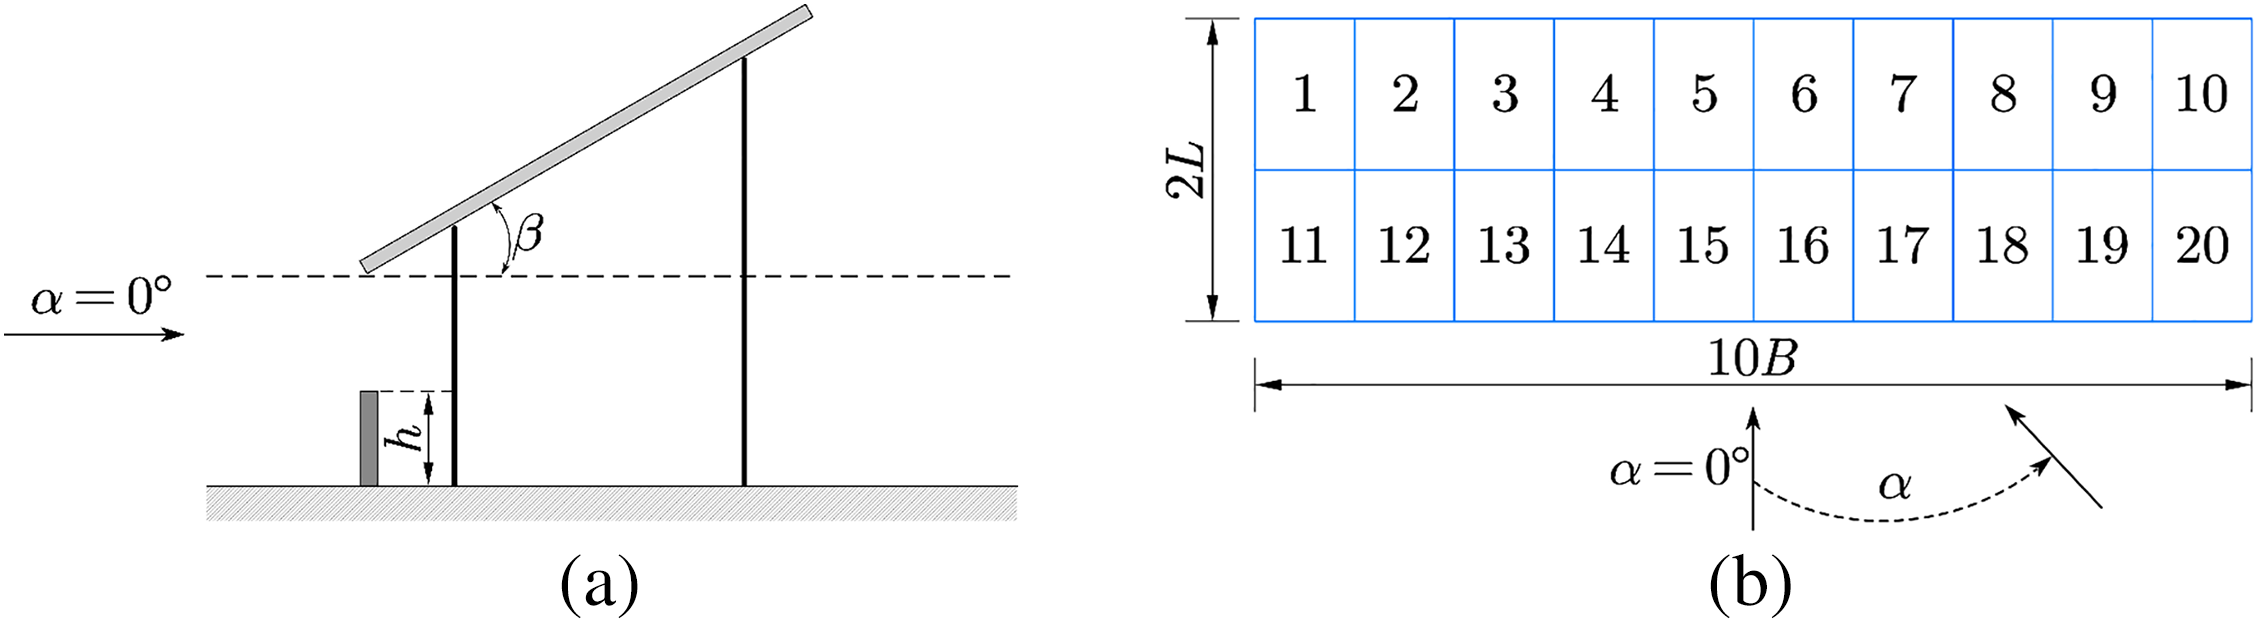
Figure 2: Obstructed ground setup adapted in Ma et al. [24]. (a) Elevation view of the obstructed PV panel. (b) Plan view of a single PV panel
The wind tunnel test of PV panel with bottom flow obstruction conducted by Ma et al. [25] was employed to validate the present numerical model. A diagrammatic sketch of the experiment is shown in Fig. 2. The distance from the toe of PV panel to the ground fixed at 0.5 m. Two clearance conditions are considered: unobstructed (0 × C) and highly obstructed (0.45 × C), as shown in Fig. 2a. The corresponding plan view of a single panel are shown in Fig. 2b. For clarity, the model parameters are listed in Table 1.
Fig. 3 shows good agreement between the simulated and theoretical wind speed profiles. This confirms that the inlet boundary condition accurately reproduces the expected wind field. After initialization, the pressure coefficients quickly reach their maximum and stabilize within two seconds.
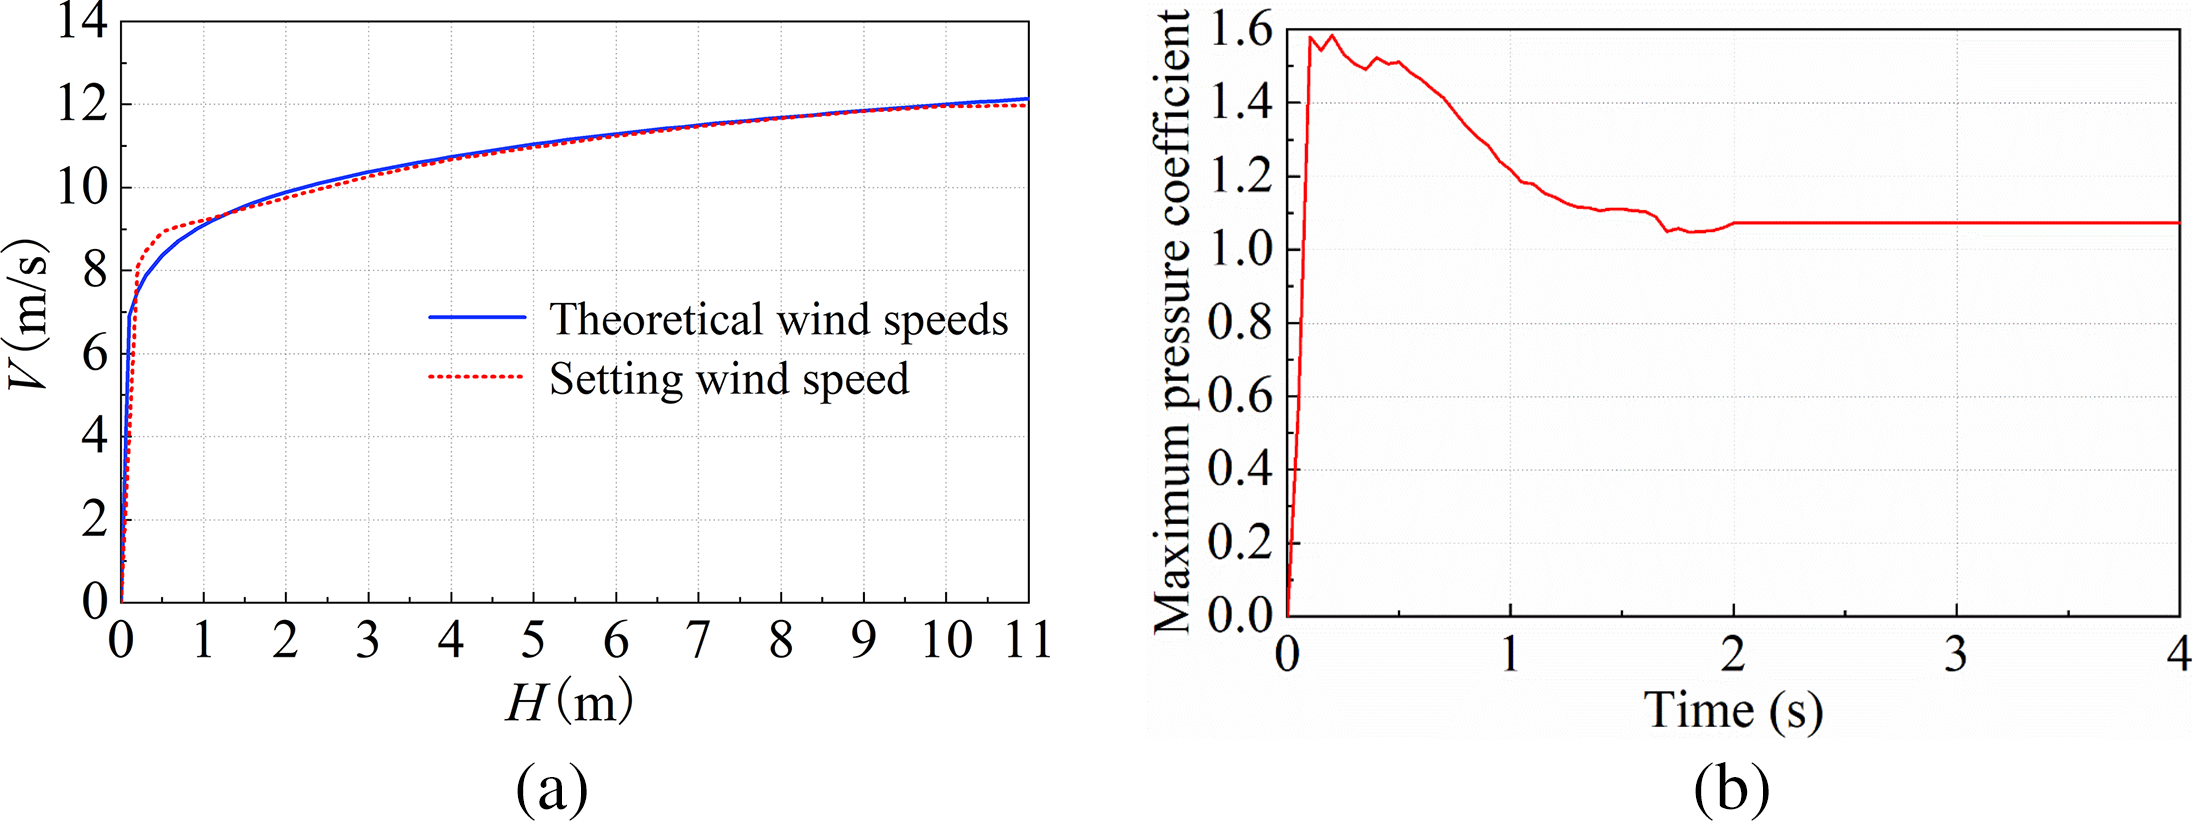
Figure 3: Validation of inlet wind profile and pressure coefficient. (a) Wind speed comparison. (b) Time series of maximum pressure coefficient
Fig. 4 illustrates the distribution of the pressure coefficient on the windward surface of the PV panel under flat ground conditions. The numerical results closely match the experimental data, revealing maximum positive pressure along the panel toe and negative pressure near the top. Fig. 5 makes comparison of mean pressure coefficient values with wind incidence angles changing from 0° to 180°. The numerical results closely follow the experimental data, showing a clear decline in the pressure coefficient as the incidence angle θ increases. At a wind incidence angle θ = 0° and panel tilt β = 30°, the numerical model accurately captures both the magnitude and spatial distribution of the pressure coefficient on the windward surface. For all wind angles, the maximum deviation remains below 5%, which means the numerical model is reliable to capture wind loads on PV panel located over flat ground.
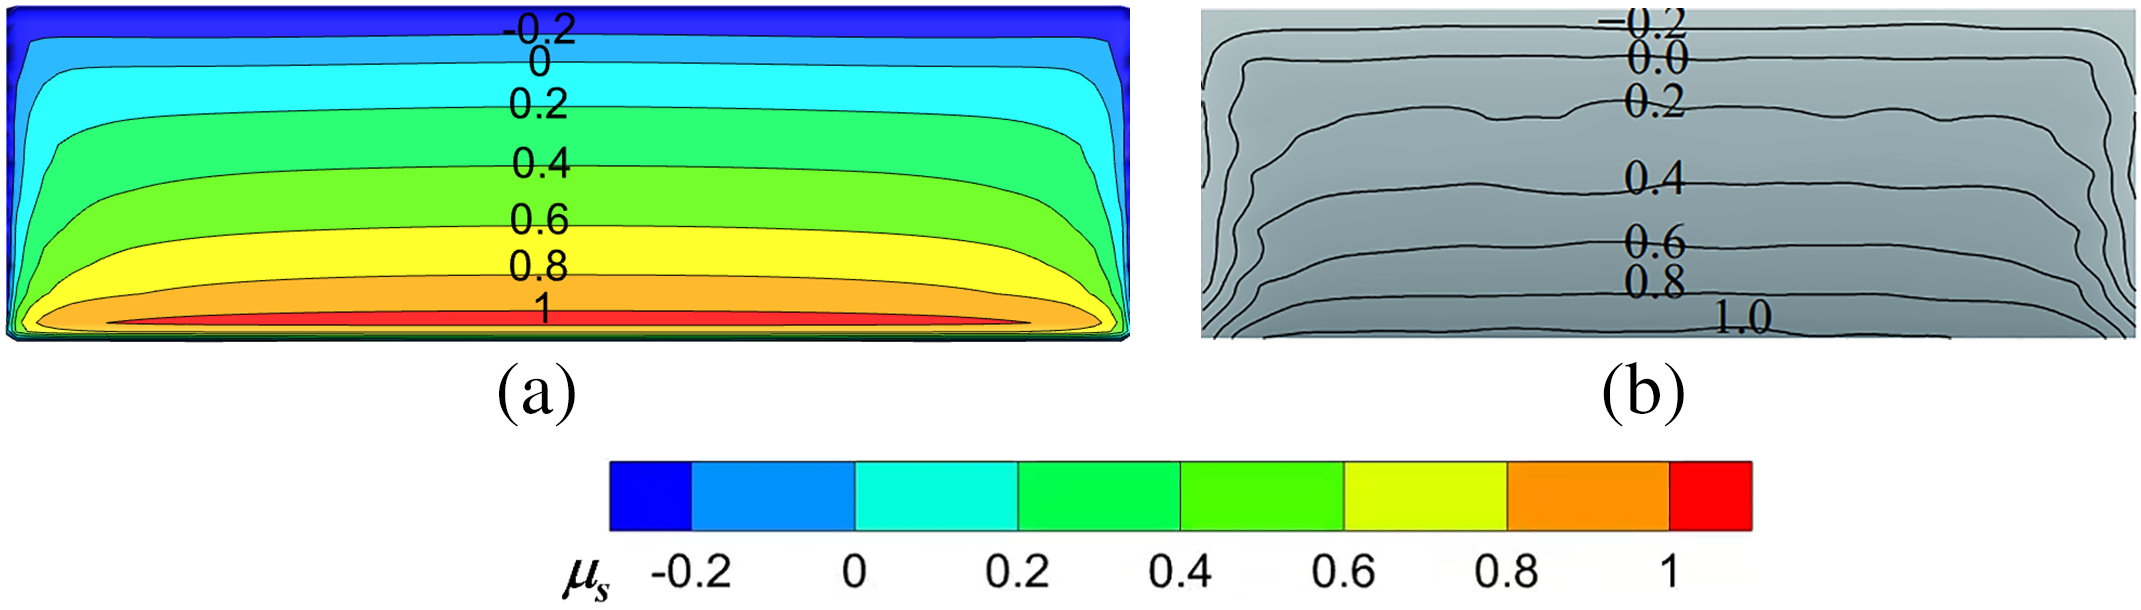
Figure 4: Comparison of pressure coefficients on PV panel on flat ground. (a) Numerical results. (b) Experimental results [24]
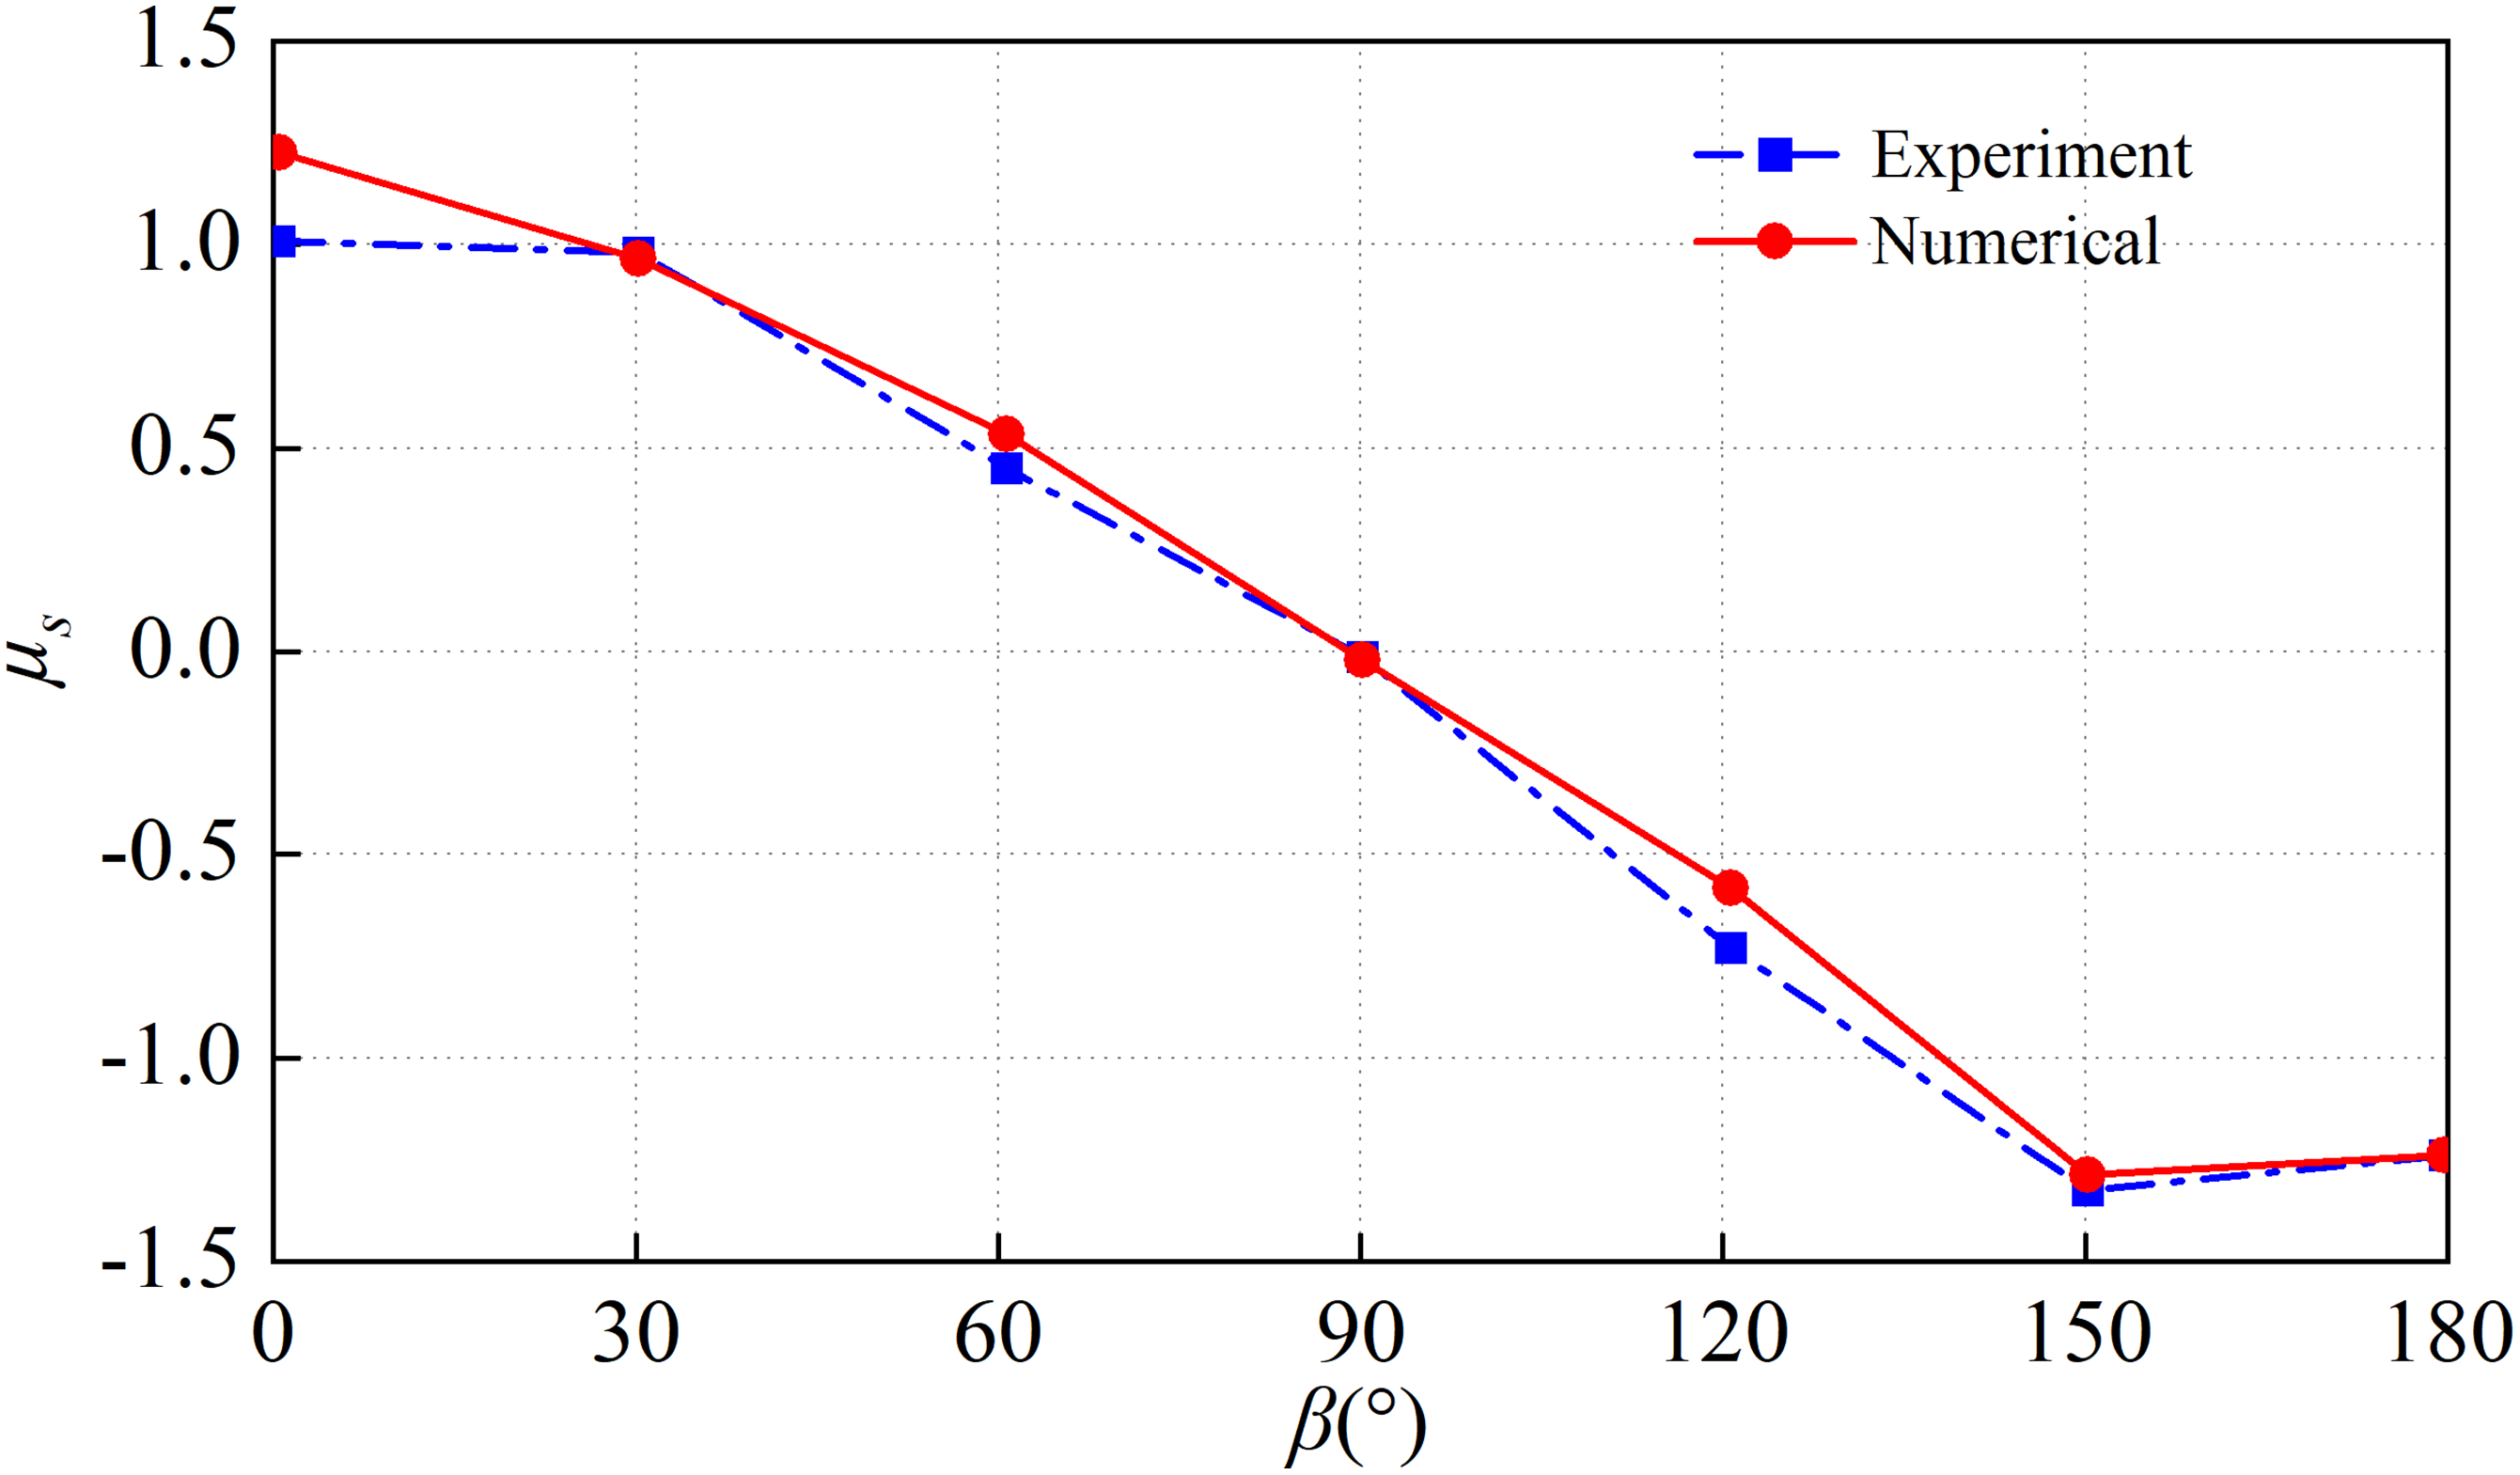
Figure 5: Pressure coefficients under different wind angles
Fig. 6 presents the comparison of the pressure coefficients on the windward side of PV panel over the obstructed ground with obstruction height h/C = 0 and h/C = 0.45. It can be seen that the simulated pressure coefficient agrees well with experimental value, which validates the reliability of the numerical methodology for wind loads on PV panel located over uneven ground.
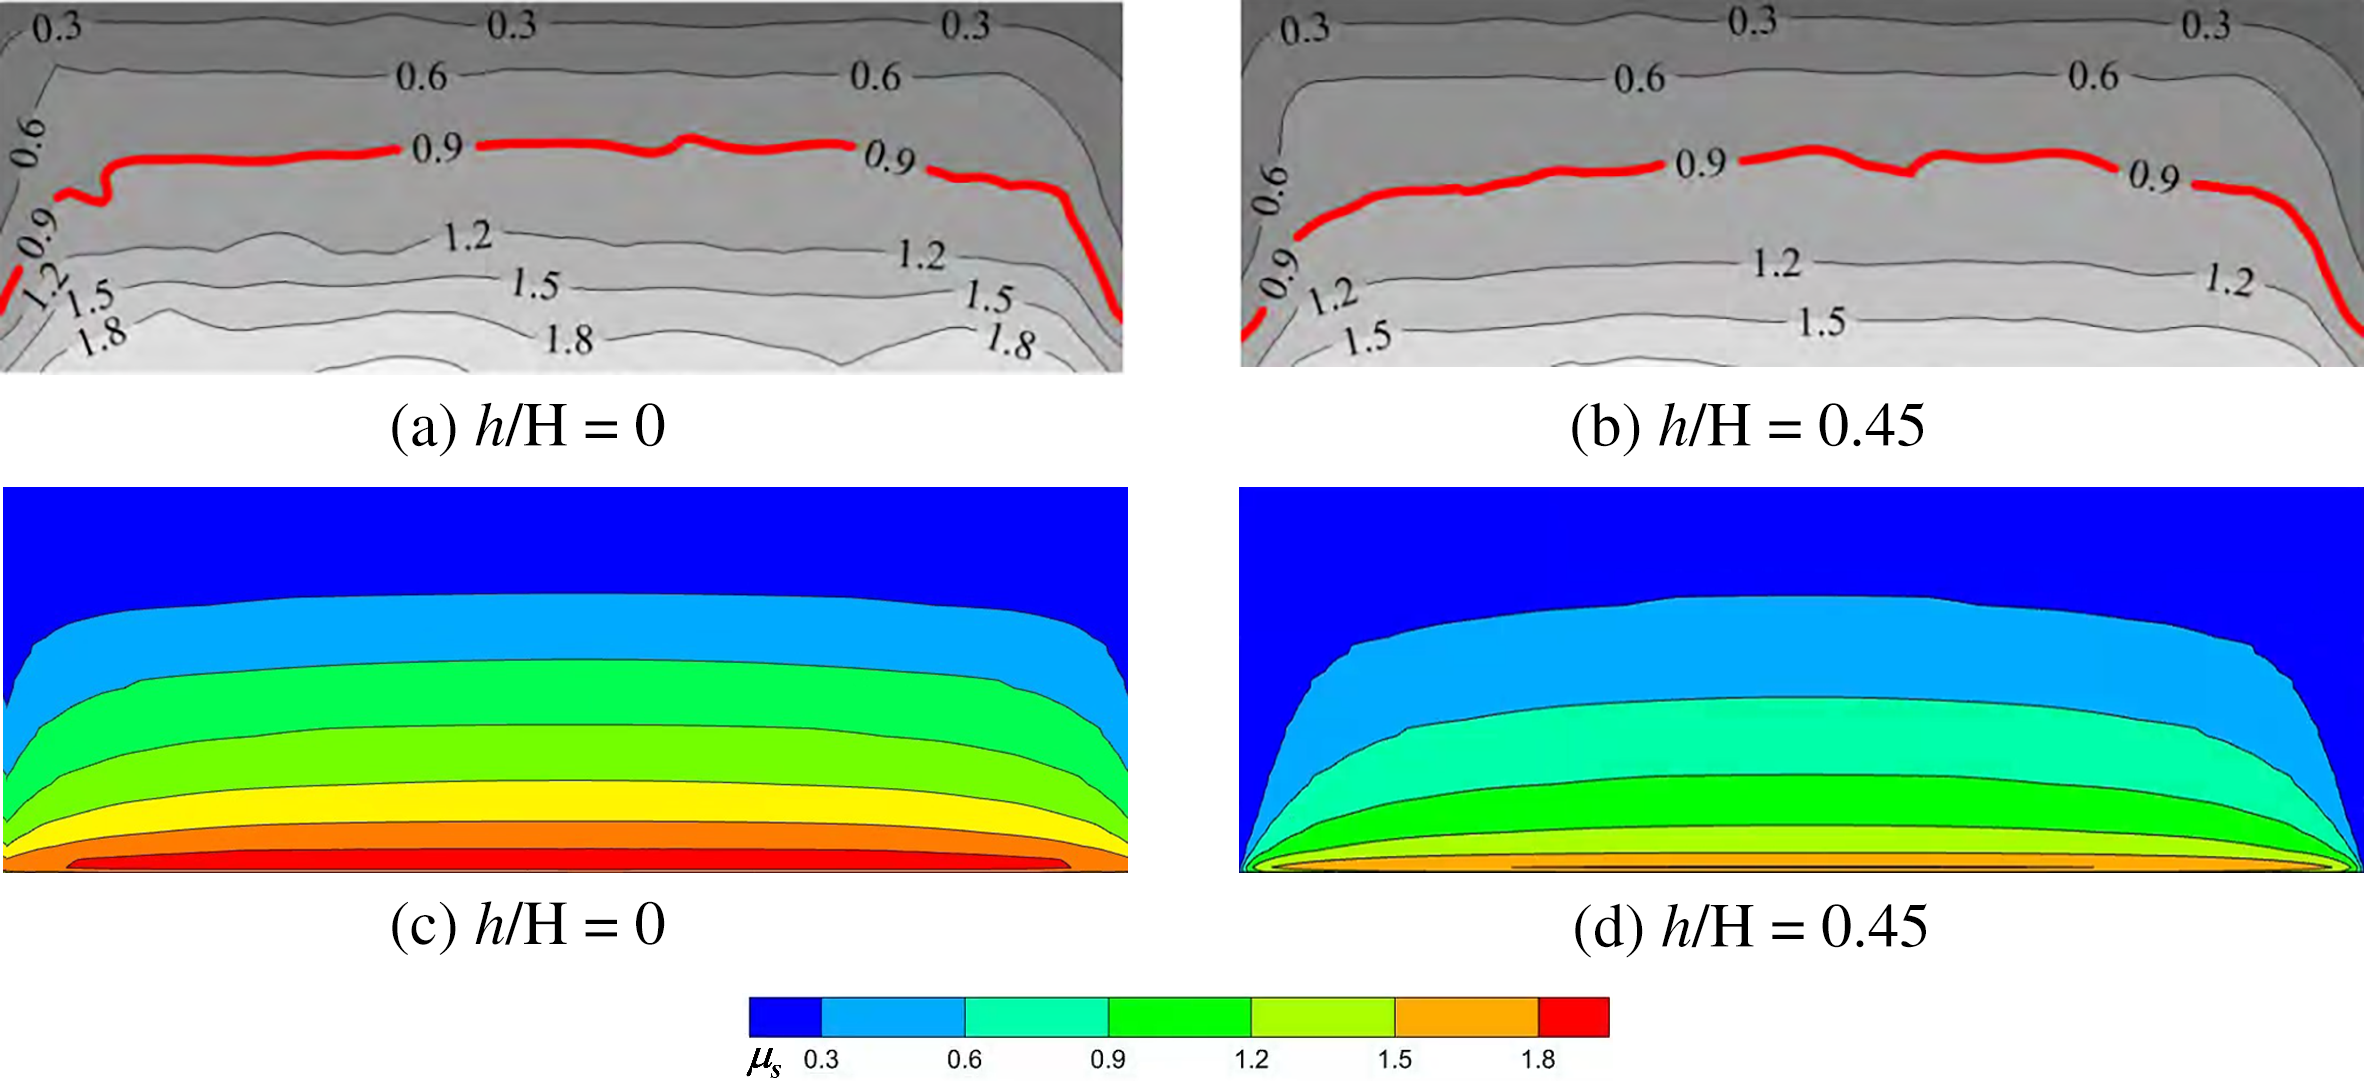
Figure 6: Comparison of pressure coefficients on PV panel on obstructed ground: (a,b) experimental results [24]; (c,d) the presented model in this study
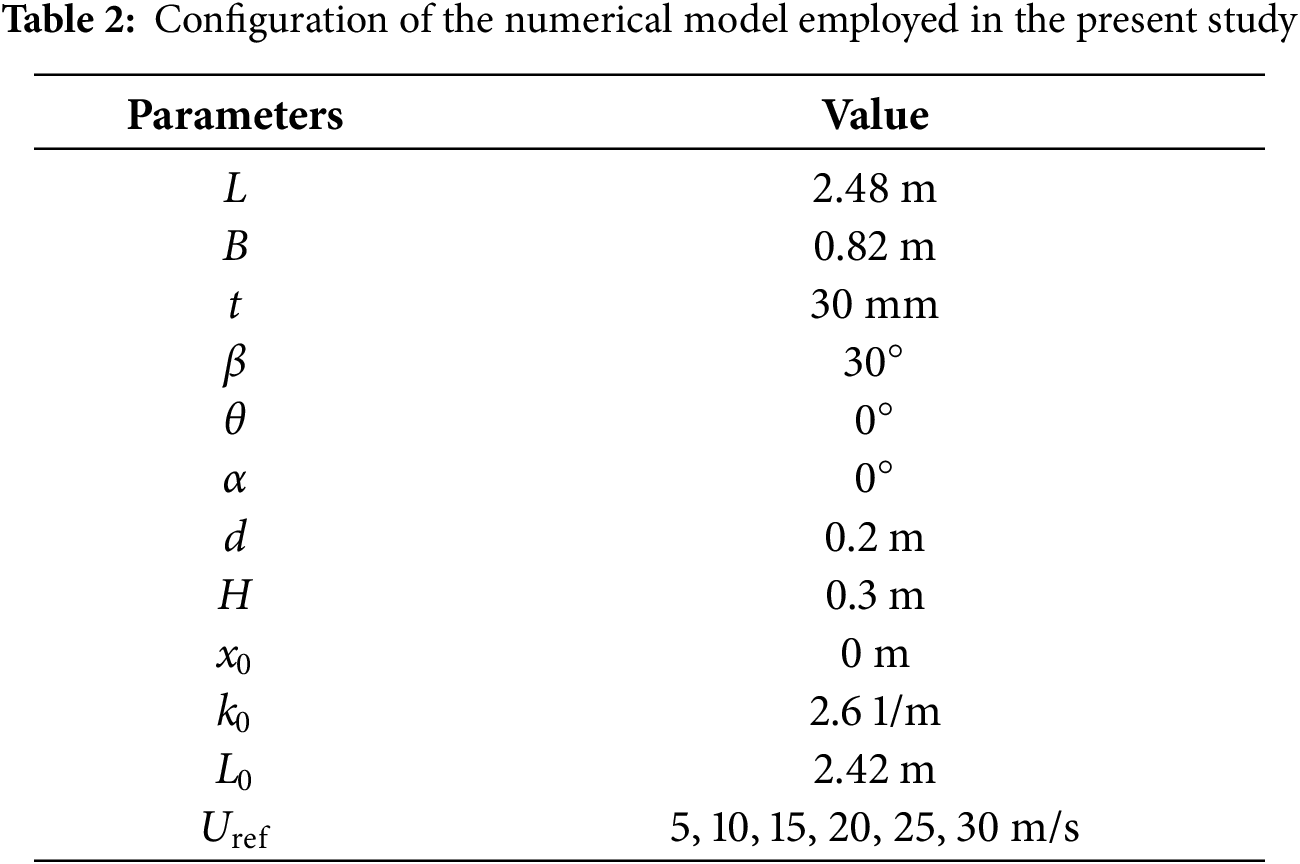
A comprehensive numerical investigation was conducted to analyze the influencing factors of wind load on photovoltaic panels. The numerical simulation was conducted on a single PV panel with 2.48 m in length, 0.82 m in width, and 30 mm thickness.
Fig. 7 indicates the numerical results of the wind field at Uref = 30 m/s, which confirms the correct implementation of the wind profile. More parameters of the configuration of the numerical model can be found in Table 2.
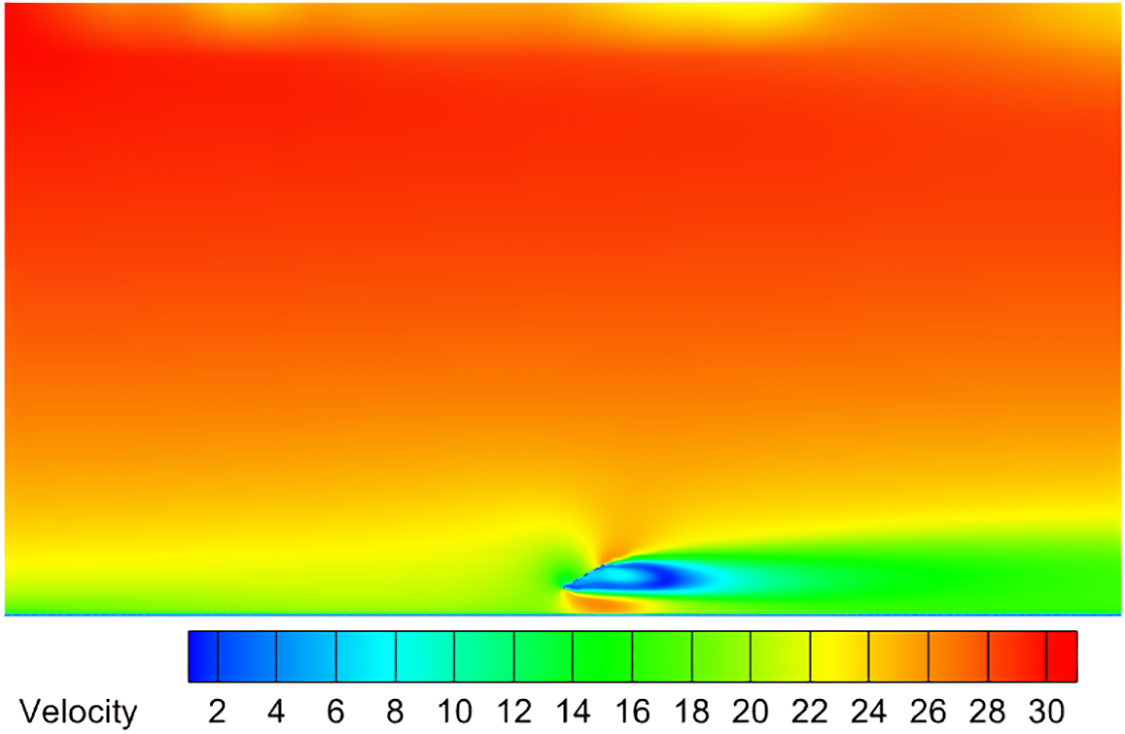
Figure 7: The velocity field of the wind over the PV panel placed on the flat ground
The assessment of wind loads on PV panels, based on aerodynamic force and pressure coefficients, reveals distinct behaviors across different wind speeds and terrain conditions. Fig. 8 demonstrates that while drag, lift, and moment coefficients generally escalate with wind speed, their rates and patterns of increase are terrain-dependent. On flat ground, the drag coefficient climbs steadily, likely tied to Reynolds number effects. Under wavy conditions, this trend is moderated at higher speeds (above 20 m/s), suggesting a slight load mitigation effect from the dynamic wave interface. The lift coefficient follows a roughly quadratic growth on flat terrain, which is significantly enhanced by wave-induced flow disturbances that reshape the panel’s pressure field. The moment coefficient, though increasing only modestly on flat ground, exhibits superimposed oscillations in the presence of waves, indicative of a complex coupling between aerodynamic and wave-induced forces.
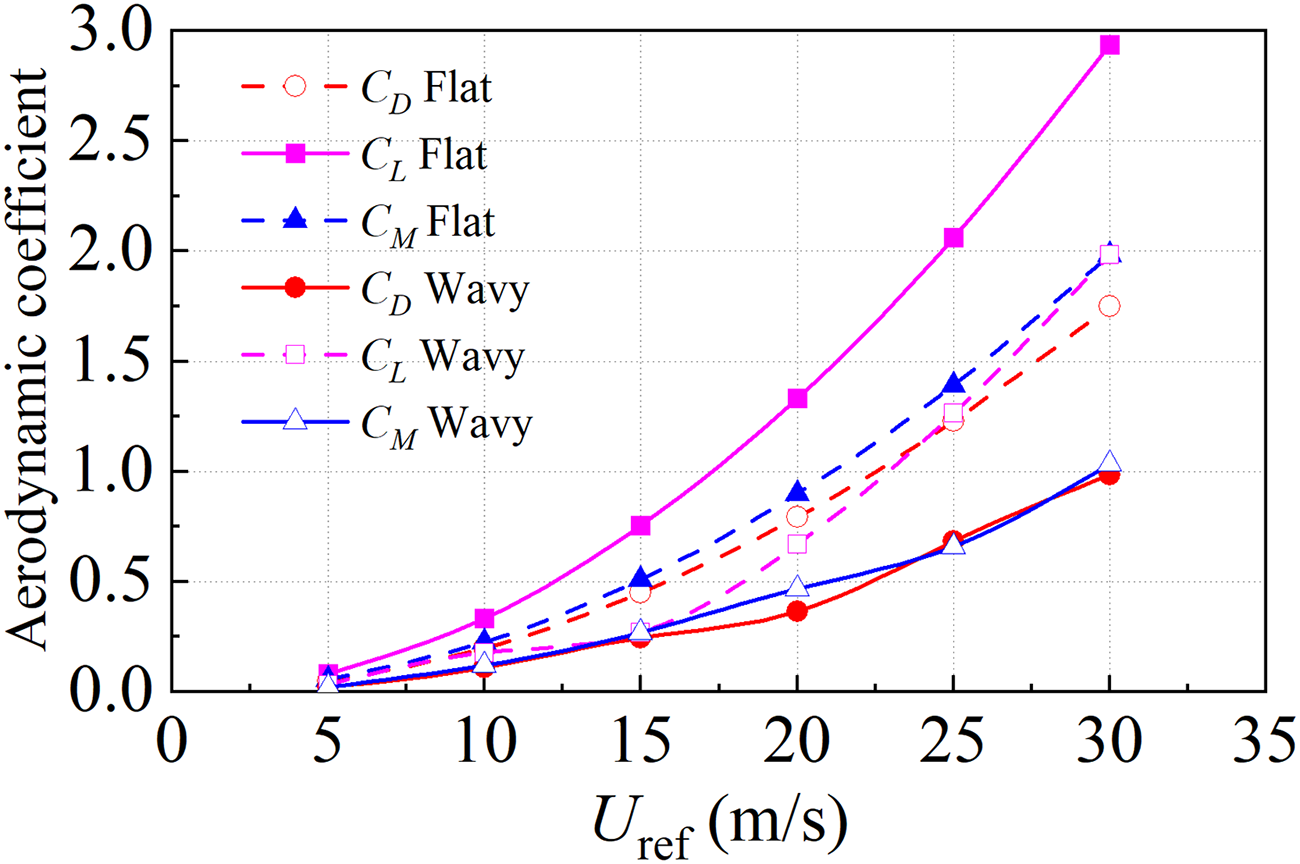
Figure 8: Aerodynamic coefficients about different Uref
Fig. 9 illustrates the variation of the mean pressure coefficient (
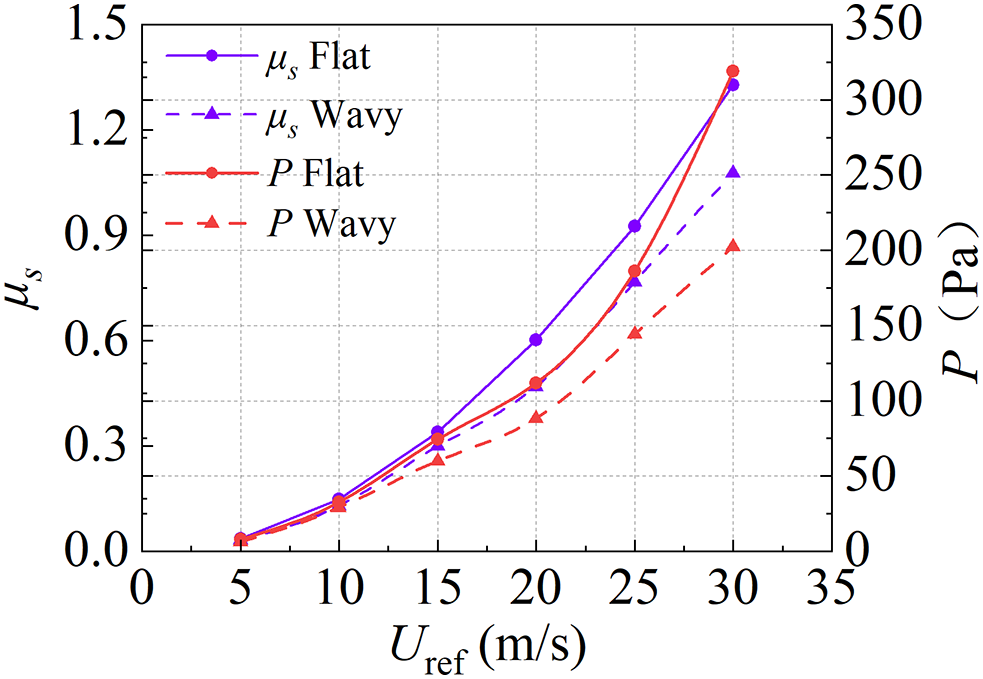
Figure 9: Pressure coefficients about different Uref
3.2 The Effect of Panel Tilt Angle
Although the tilt angle (β) of a PV panel is crucial for optimizing solar energy yield, its effect on aerodynamic loads is equally paramount for structural design. This study systematically examines how β influences the aerodynamic pressure, drag, lift, and moment coefficients. All data correspond to steady-state values after full flow stabilization. Given that extreme values inadequately represent surface pressure distribution, the analysis encompasses eight distinct tilt angles and two lower-interface conditions: flat ground and static wavy ground.
Fig. 10 presents a contour analysis of the pressure coefficient on the windward surface under flat ground conditions for different tilt angles. For β = 5° and 10°, the incoming flow remains nearly parallel to the panel face. This causes smooth streamlines, minimal disturbance and separation, which results in a nearly uniform pressure field, low drag forces, and low shape-coefficient values. As β increases above 10°, flow separation becomes more pronounced: vortical structures develop, separation zones expand, and the drag coefficient rises steadily. Between β = 15° and 20°, the panel meets the flow at a steeper angle. This creates strong flow disturbances, larger separation regions, and intensified vortices. As a result, the pressure coefficient increases significantly due to greater pressure differences. When β reaches 25° to 35°, separation intensifies further, local pressure gradients become extreme, additional bluff-body surfaces are exposed. And in the meantime, the drag coefficient reaches its maximum, which drives the pressure coefficient to peak values.
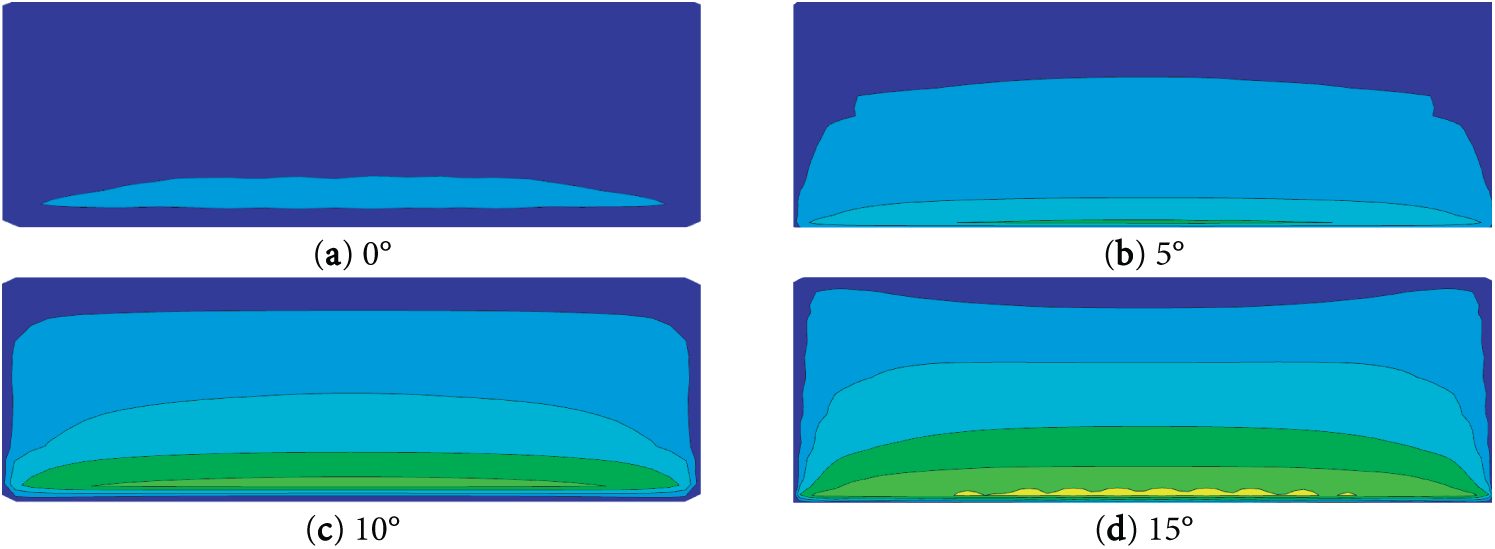
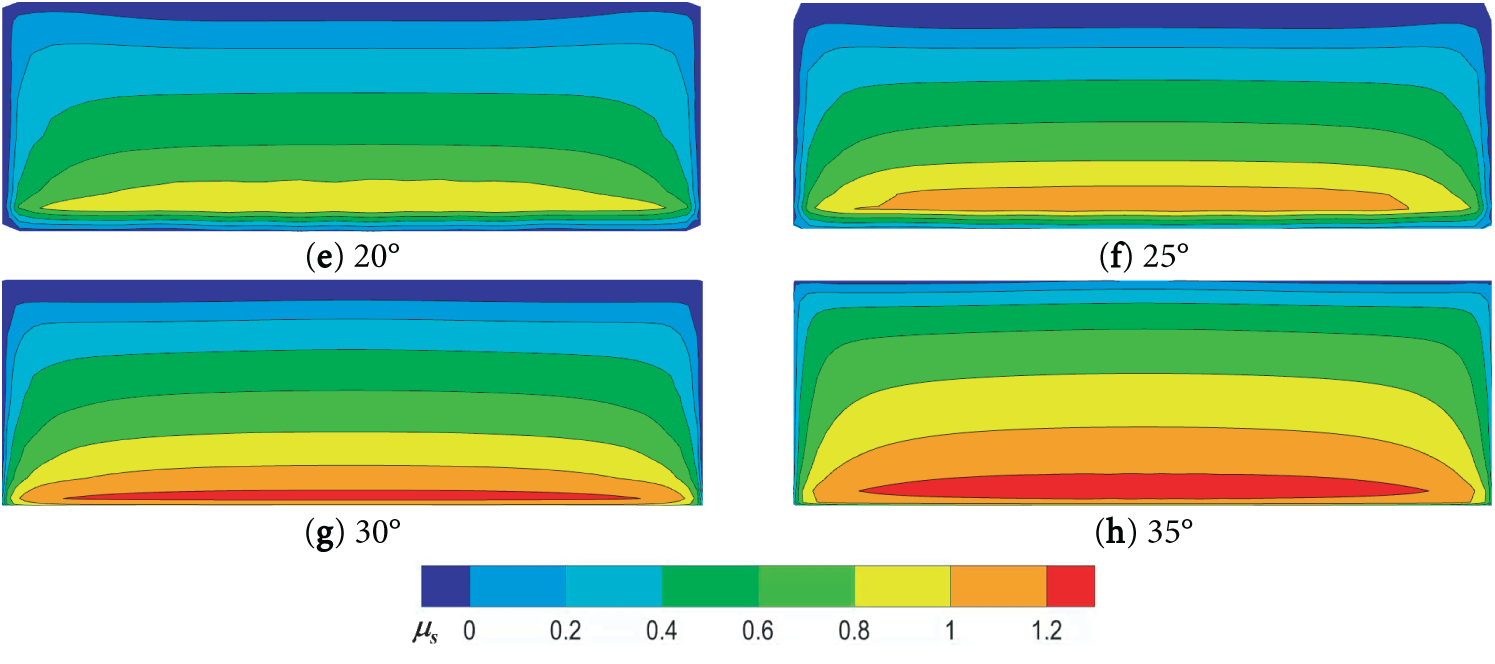
Figure 10: The distribution of pressure coefficients under flat ground condition
Fig. 11 illustrates the pressure coefficient on the windward panel surface locating over static wavy ground conditions, revealing how uneven bottom boundary alter pressure distribution and flow separation. Compared to the flat ground, the wavy terrain generates more pronounced variations in the pressure coefficient. This is attributed to complex vortices and enhanced turbulence formed as wind passes over wave crests, which dissipate kinetic energy and create multidirectional pressure components that partially cancel each other out, thereby reducing the net effective force.
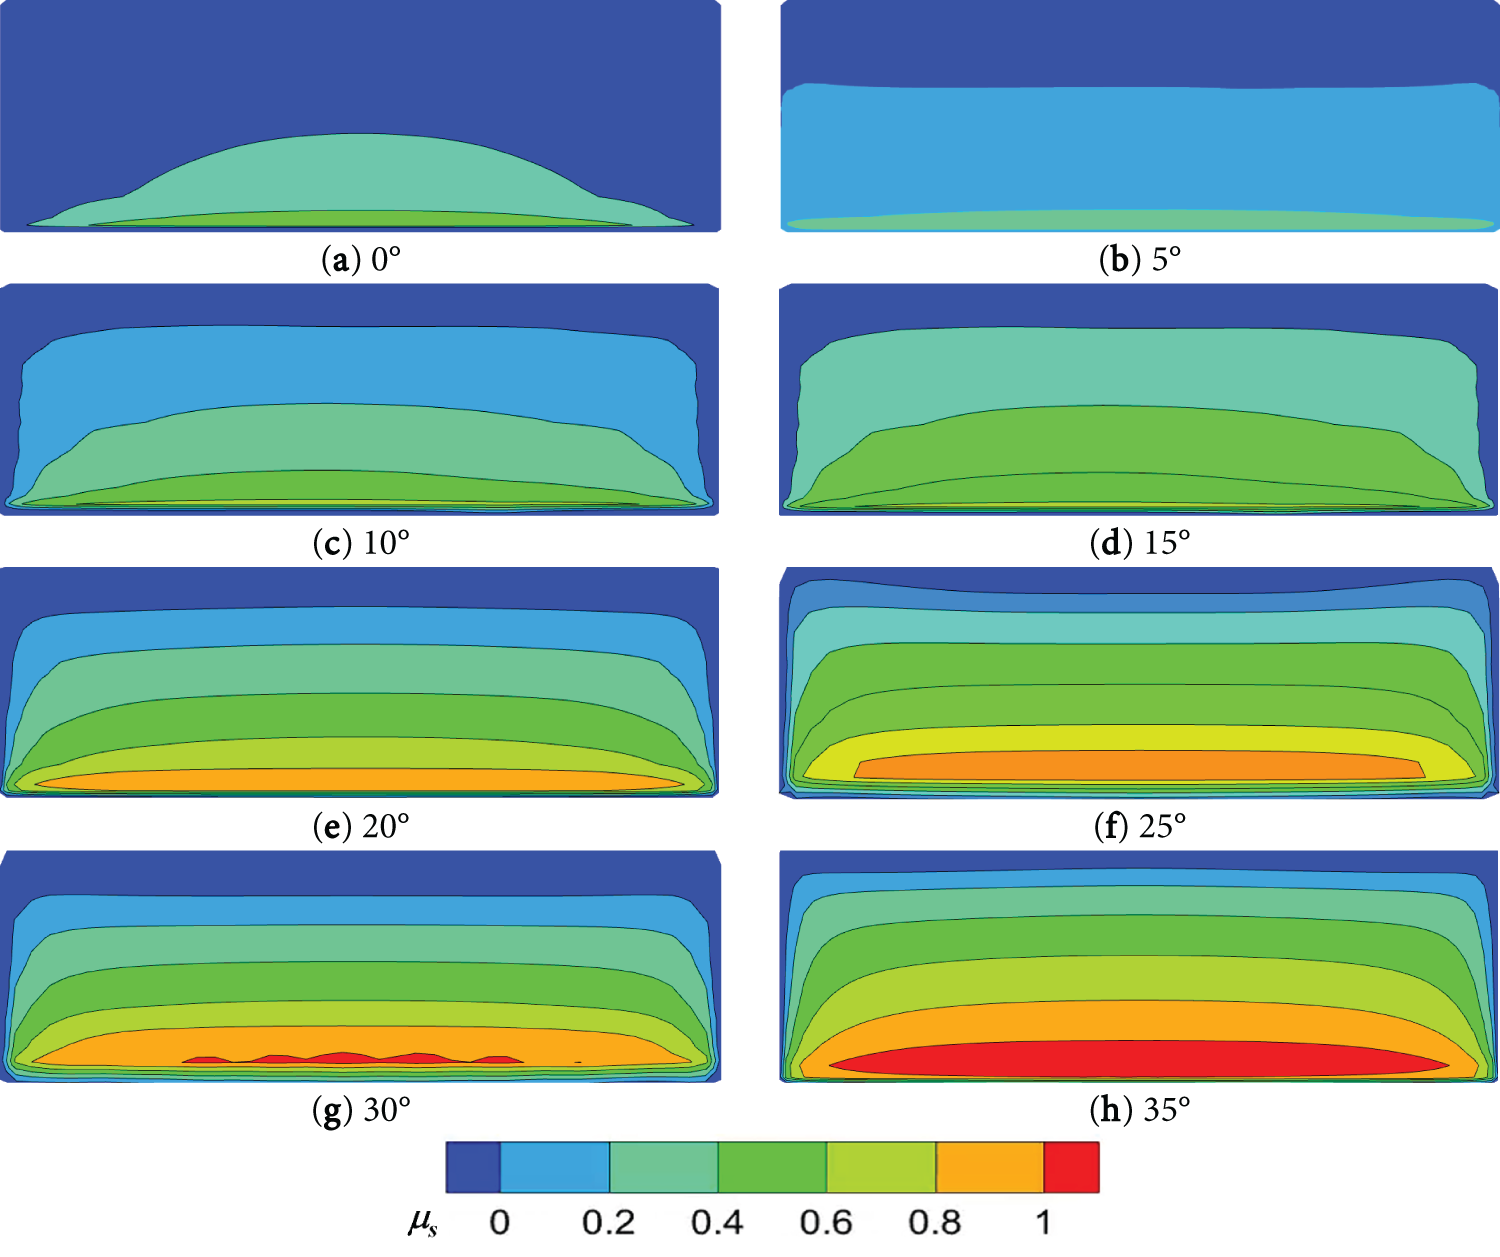
Figure 11: The distribution of pressure coefficients under wavy ground condition
The pressure coefficient increases with the tilt angle (β) in both scenarios, but key differences emerge. At low inclinations (β = 5°–15°), the mean coefficient for wavy ground (0.2–0.4) slightly exceeds that of flat ground (0–0.2). At higher angles (β = 25°–35°), the flat ground case reaches a peak of approximately 1.2 while the wavy ground case peaks at only 1.0. This indicates that waves mitigate extreme pressure increases. The reduction becomes more significant at larger tilt angles; at β = 35°, the maximum coefficient under wave conditions is 1.03—about 20% lower than that observed on flat ground, demonstrating that wave action effectively lowers peak pressure concentrations.
Fig. 12 illustrates the variation of aerodynamic coefficients with panel tilt angle β. The drag coefficient increases steadily as β rises from 5° to 35°. This is due to the more irregular interaction between the incoming flow and the panel surface, which encourages flow separation and vortex formation. The lift coefficient also grows with β, rising sharply once β exceeds 20°. This suggests that steeper panel angles create larger pressure differences, generating more lift. The moment coefficient increases with β as well, indicating stronger overturning effects that impact structural stability. The trends are similar for both wavy and flat ground conditions. However, the drag coefficient is consistently higher on flat ground than over waves. With β increases, the lift and moment coefficients grow faster on flat ground and reach higher peak values than under wave conditions.
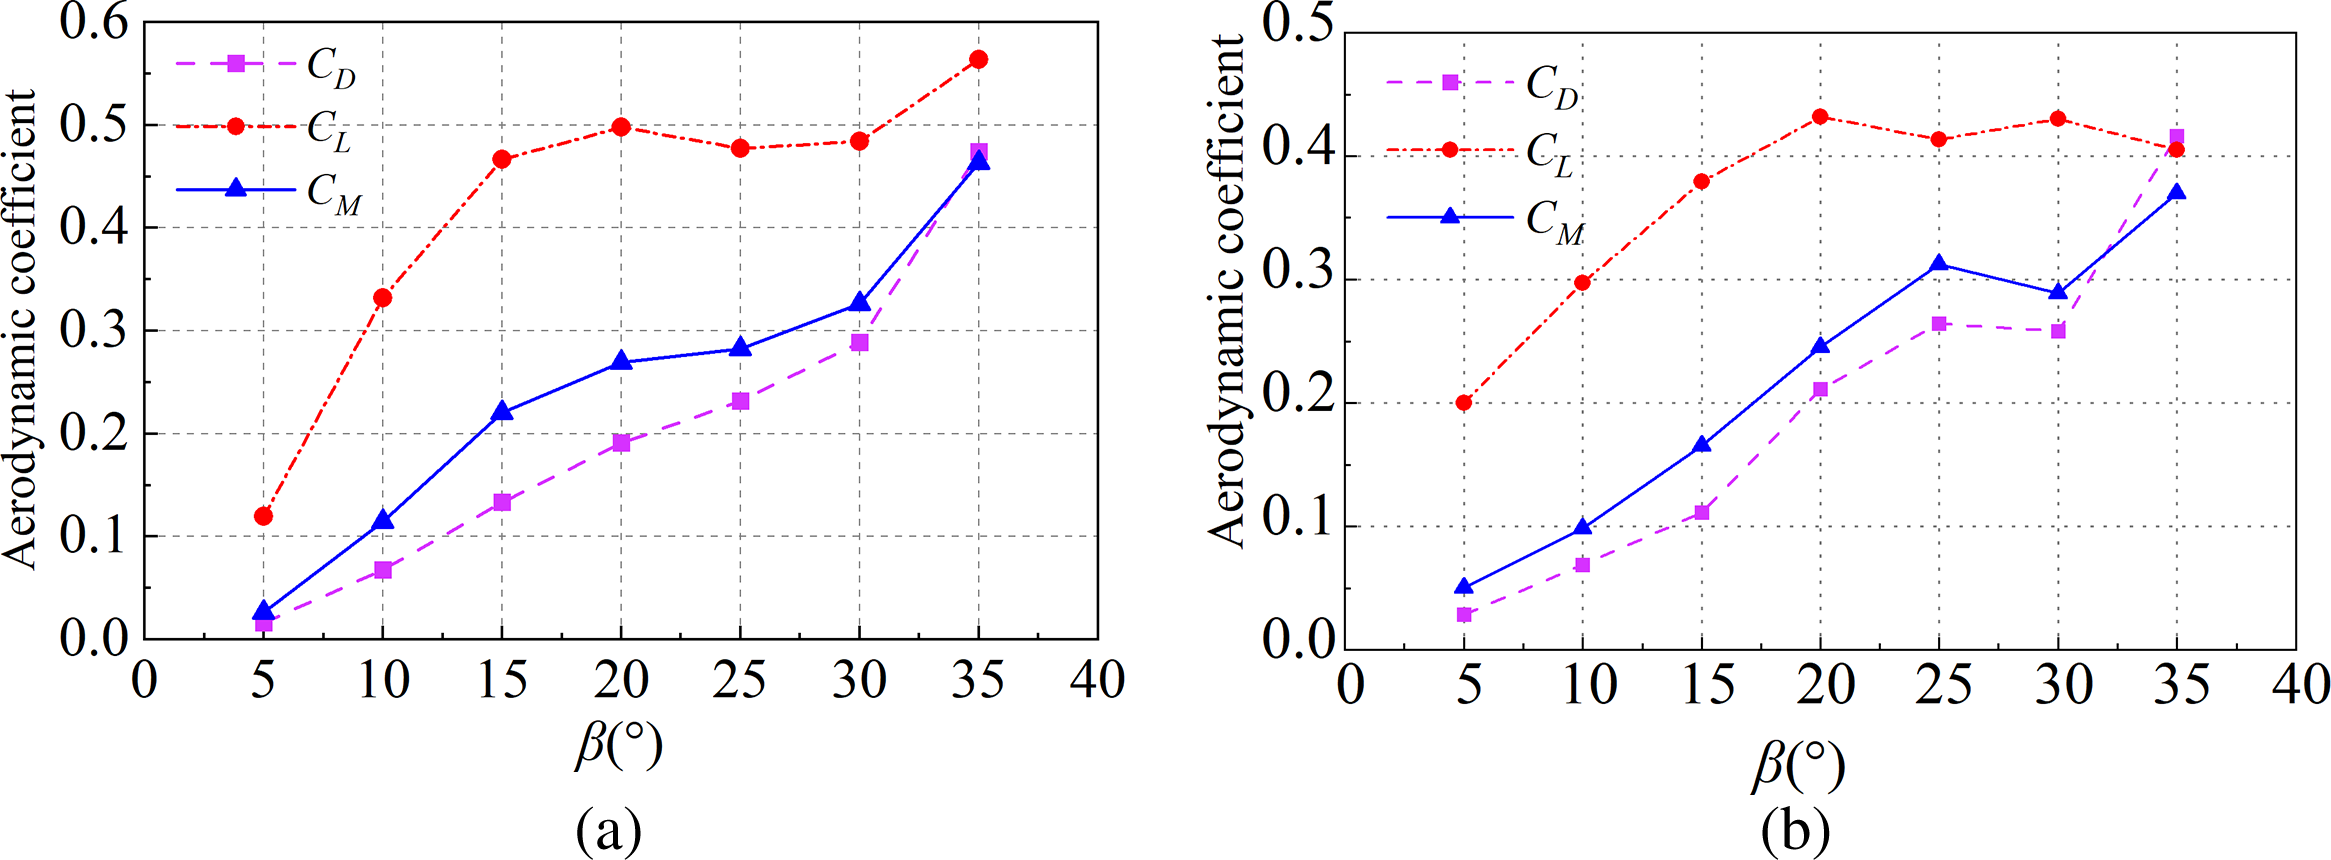
Figure 12: Aerodynamic coefficients about different tilt angle. (a) Flat ground. (b) Static wavy ground
The clearance beneath photovoltaic panels is a critical parameter in evaluating wind loads. This section investigates the influence of clearance on the aerodynamic force and pressure coefficients of PV panels. Fig. 13 shows cloud maps of the pressure coefficient on the windward surface for six clearance values (C = 0.20, 0.25, 0.30, 0.35, 0.40, and 0.45 m). Fig. 13 reveals that an increased ground clearance height induces higher pressure on the panel’s leading edge. This occurs because larger clearances permit the development of more intricate flow patterns, including recirculation zones and vortex structures. These phenomena, combined with the effect of higher incoming wind velocities, generate localized pressure peaks and suction regions, thereby amplifying the overall pressure coefficient.
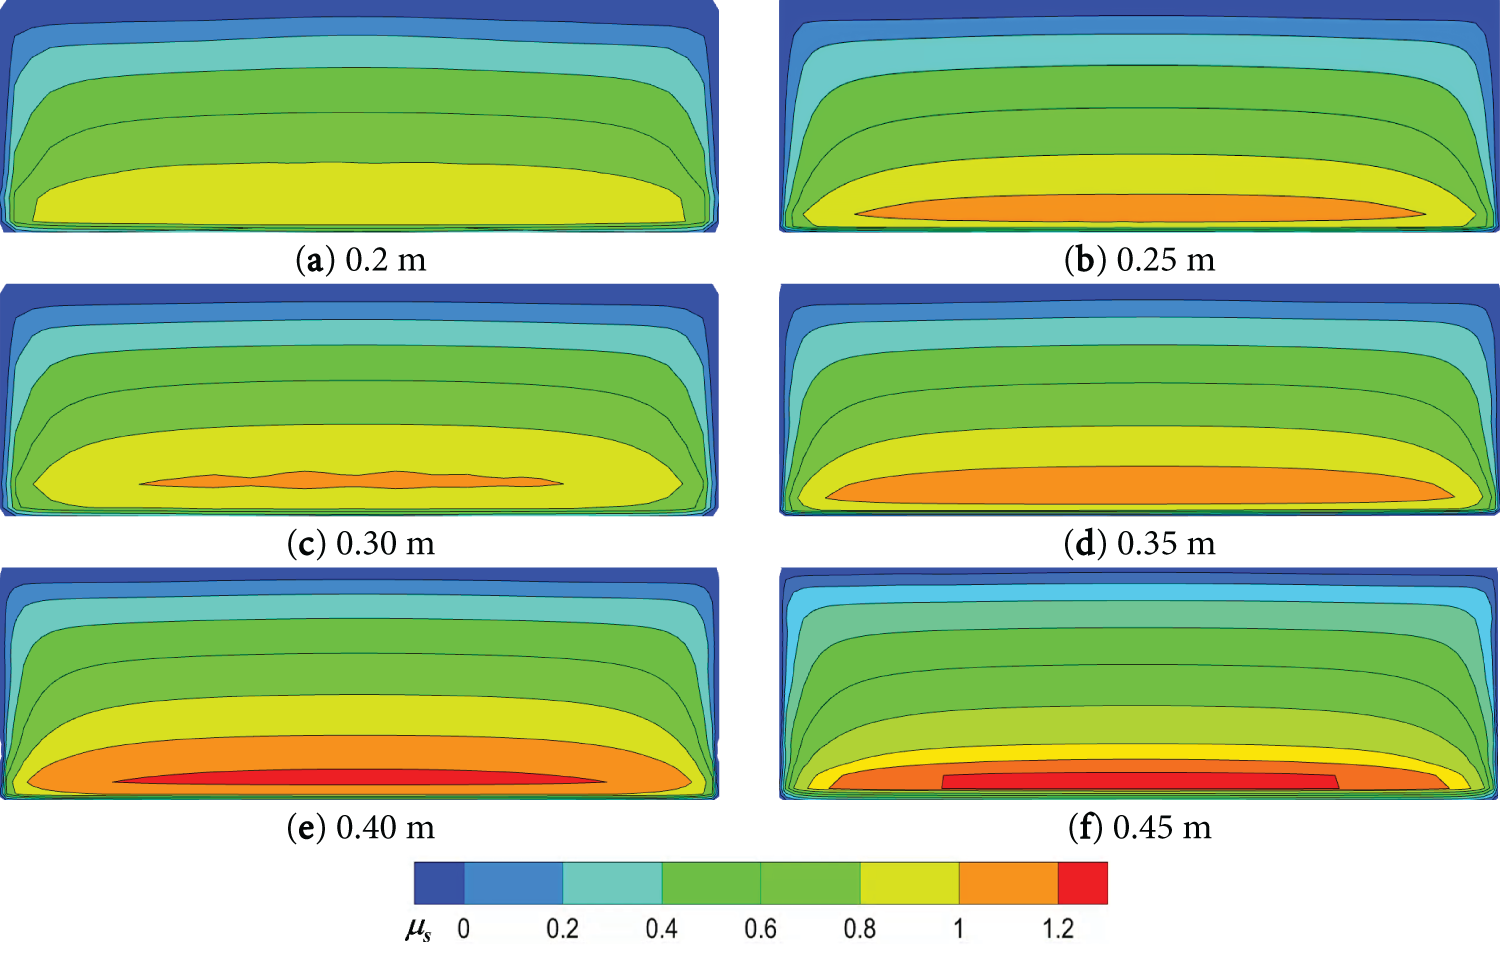
Figure 13: The distribution of pressure coefficients for flat ground condition with different clearances
Fig. 14 presents contour maps of the aerodynamic pressure coefficient under static wavy ground conditions for varying clearance heights. A comparative analysis with flat ground reveals that while the pressure coefficient increases with clearance in both flat and wavy scenarios, but its values and spatial distribution differ significantly. At small clearances (0.20–0.35 m), the wavy-ground contours are more diffuse with gradual transitions, whereas flat-ground contours exhibit sharper gradients and clearer stratification. As clearance increases to 0.40–0.50 m, the pressure distribution under wavy conditions becomes concentrated within a defined zone (0.8–1.0), in contrast to the broader dispersion and higher values (up to 1.2) observed on flat ground. These findings indicate that both the morphology and clearance height collectively dictate the windward pressure pattern.
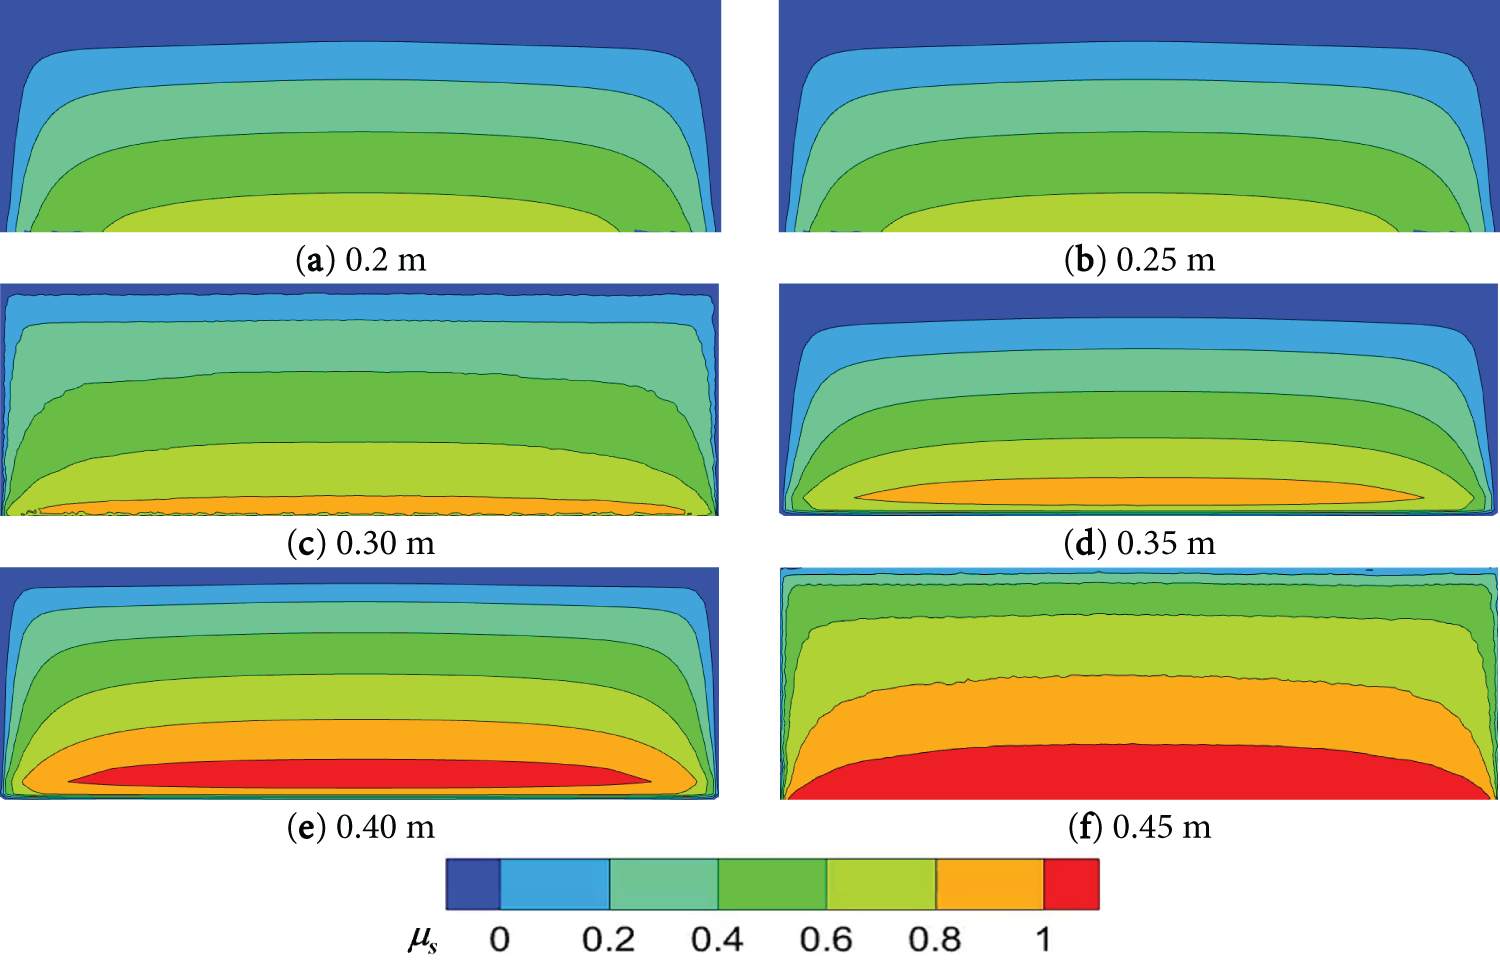
Figure 14: The distribution of pressure coefficients for static wavy ground condition with different clearances
A comparative analysis of aerodynamic coefficients under wavy and flat ground conditions across varying clearances (C = 0.2~0.5 m) is shown in Fig. 15. Fig. 15a illustrates the trends under wavy ground conditions. The drag coefficient initially decreases with increasing clearance at low heights, but reverses this trend and begins to rise beyond a certain point, suggesting that confined near-ground flow initially intensifies drag, while modified flow structures at greater heights lead to its renewed increase. The lift coefficient shows a slight decrease at very low clearances before climbing markedly as clearance increases. Meanwhile, the moment coefficient rises steadily with clearance, indicating that larger clearances amplify the wind-induced overturning moment on the panels. As shown in Fig. 15b, the evolution of these coefficients differs notably under flat ground conditions. The drag coefficient exhibits minor fluctuations followed by a general increase. Specifically, in the low-clearance range (C < 0.3 m), CD fluctuates more for flat ground condition, while the wavy ground produces a smoother variation. For clearances between 0.2 and 0.35 m, the CD on flat ground is slightly higher overall than on wavy ground. However, once clearance exceeds 0.35 m, the CD under wavy conditions surpasses that under flat conditions, and the difference widens progressively. The lift coefficient CL on the flat surface is slightly lower than on wavy ground when C < 0.3 m, but exceeds it across most of the 0.3–0.5 m range. In both scenarios, CL rises continuously with clearance. The moment coefficient CM increases more slowly on flat ground between 0.2 and 0.3 m. It should be noted that CM remains consistently lower on flat ground than on the static wavy interface across the entire clearance range.
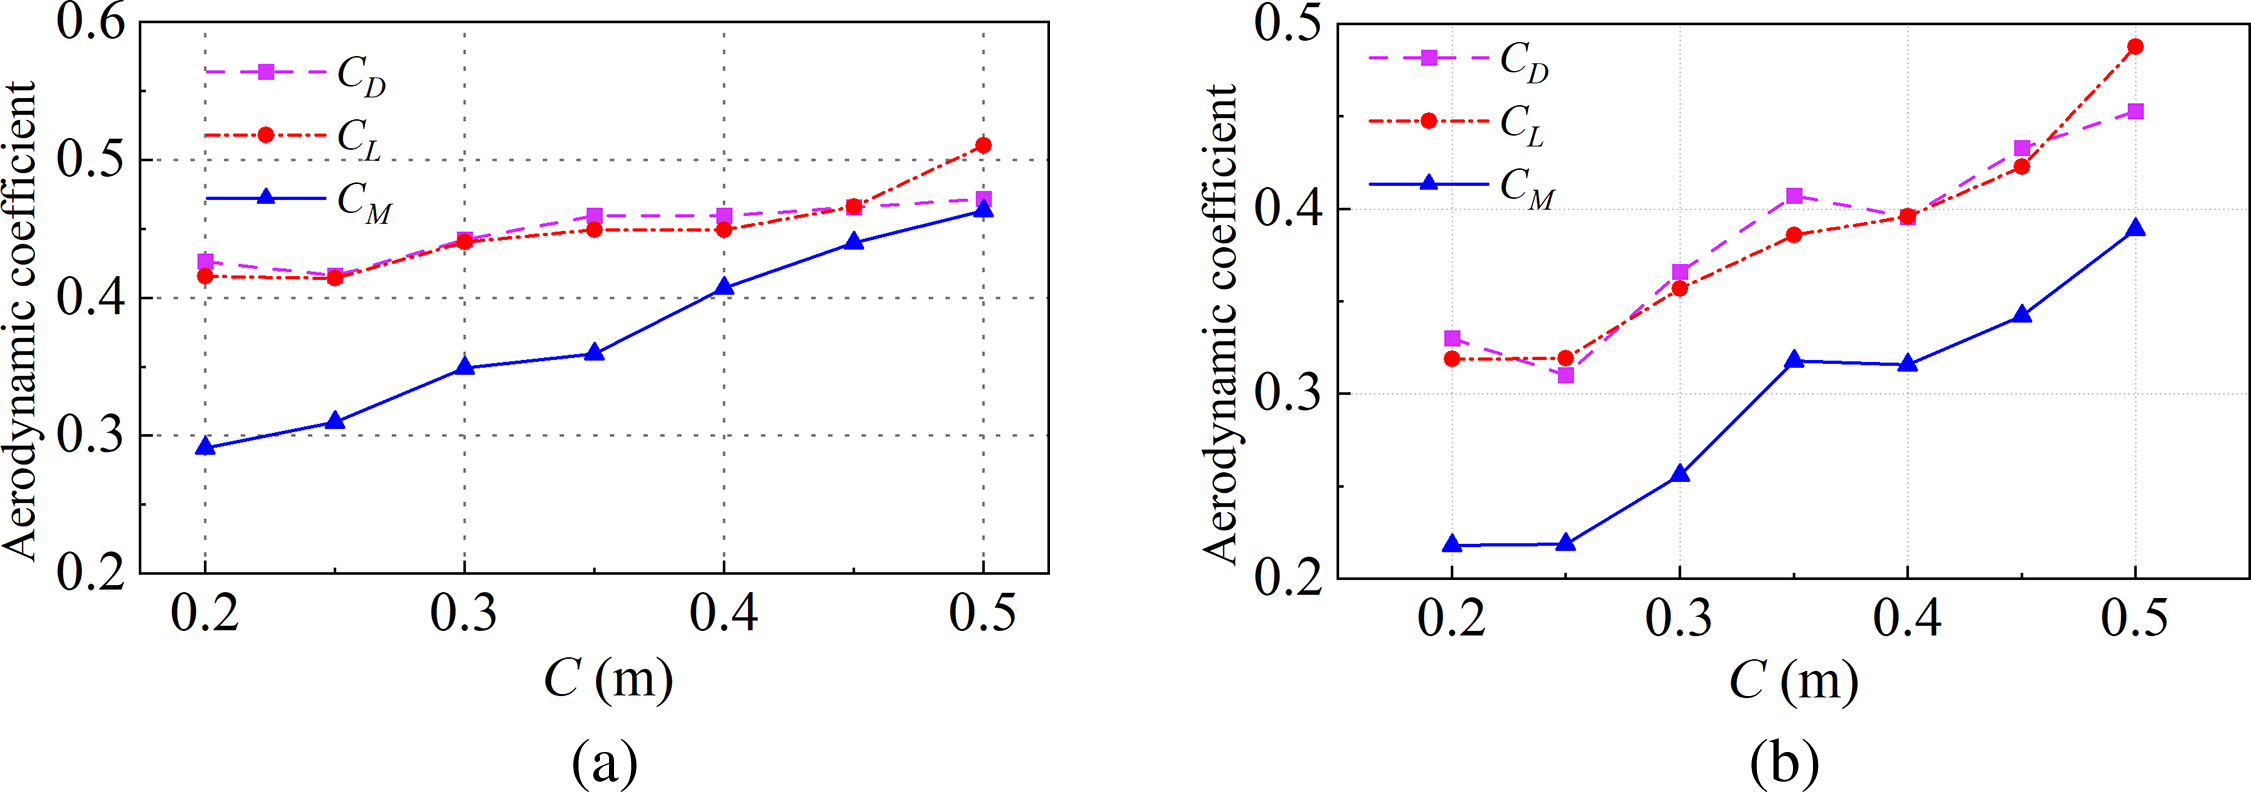
Figure 15: Aerodynamic coefficient of PV panel with different clearances over different bottom boundary. (a) Flat ground. (b) Wavy ground
The influence of wave height on the unsteady characteristics of wind loading is investigated by analyzing the aerodynamic pressure and force coefficients under six wave heights (H = 0 to 0.5 m). Increasing wave height induces rapid fluctuations in local air pressure, enhancing the variability of aerodynamic forces. Surface undulations generate additional vortices and turbulence, which fundamentally modify the wind-load distribution on the panel’s windward side. As illustrated in Fig. 16, the aerodynamic pressure coefficient on the windward surface generally decreases with increasing wave height, with values ranging from approximately 0 to 1. Visually, high-value regions of the coefficient contract, while low-value areas expand. The load distribution shifts from being concentrated at the bottom to more uniform across the panel, indicating that wave height alters the spatial pattern of wind loading. This occurs because higher waves enhance airflow disturbance, generating more complex vortices and turbulence that disrupt the incoming flow. Furthermore, increased wave height physically obstructs more airflow from directly impinging on the panel, reducing the effective wind speed and surface pressure on the windward side, thereby lowering the overall pressure coefficient.
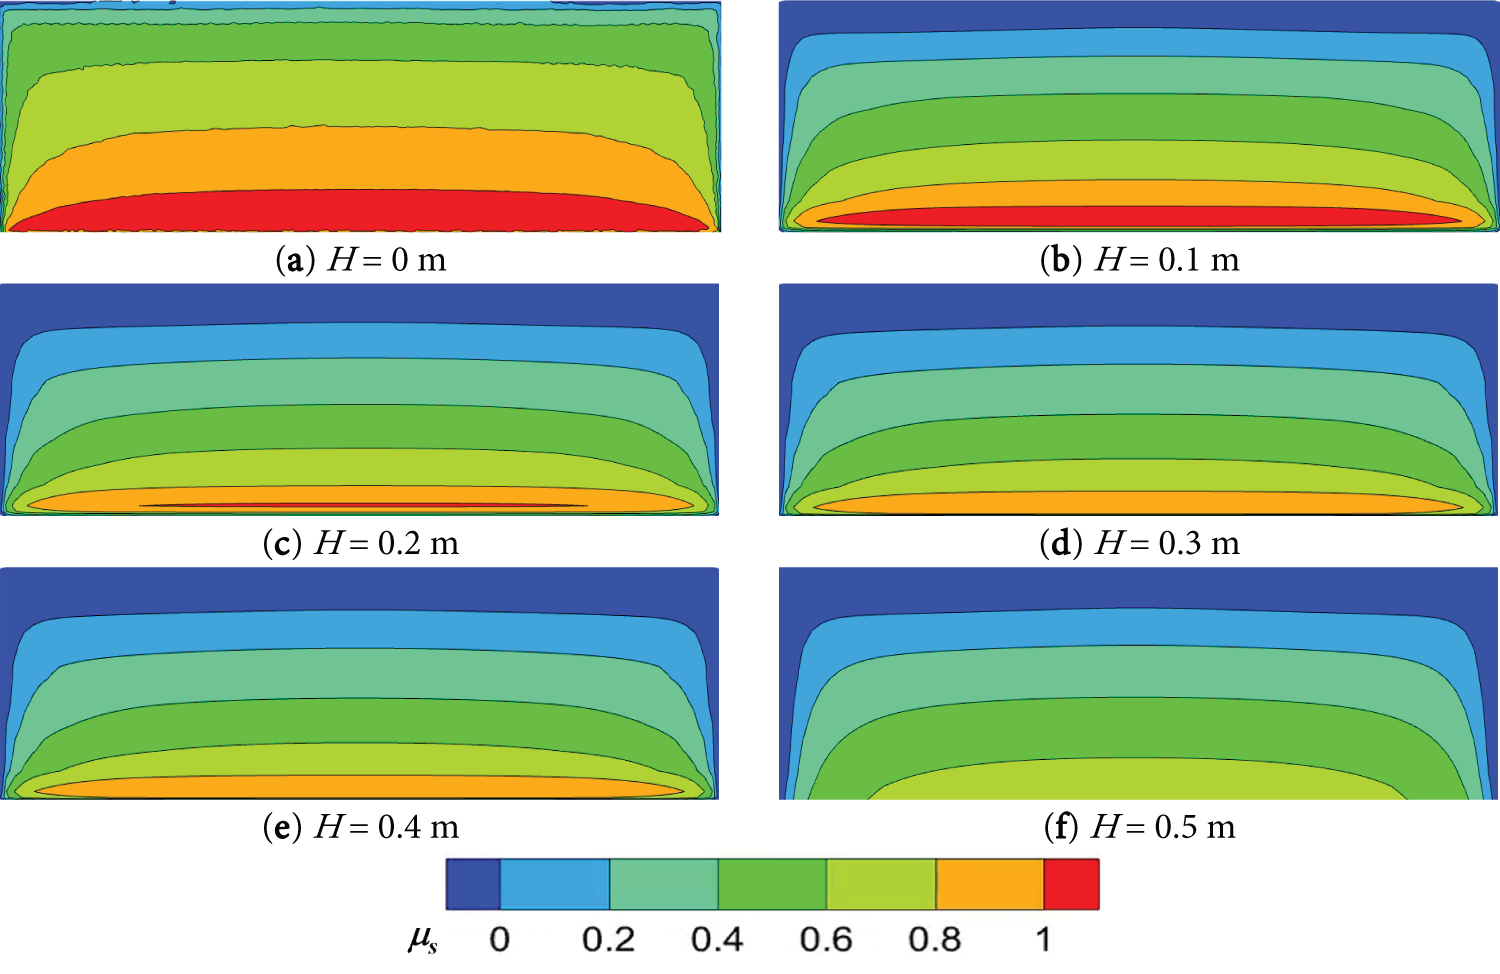
Figure 16: The distribution of pressure coefficients varying with wave height
The corresponding trends for the force coefficients are shown in Fig. 17. All three coefficients—drag, lift, and moment—exhibit a continuous decline as wave height increases from 0 to 0.5 m. The drag coefficient decreases rapidly at low wave heights (0–0.1 m), after which the rate of decline gradually slows. The lift coefficient shows a more uniform decreasing trend without obvious transitional stages. The moment coefficient decreases rapidly initially before slowing at higher wave heights. Quantitatively, the coefficients are at their maxima: CD ≈ 0.48, CL ≈ 0.52, and CM ≈ 0.47 at H = 0 m which means the flat bottom condition. By H = 0.5 m, those coefficients decrease to approximately 0.18, 0.33, and 0.22, respectively. The total reduction is greatest for CD and is smallest for CL, indicating that wave height has the most pronounced effect on drag and the least on lift.
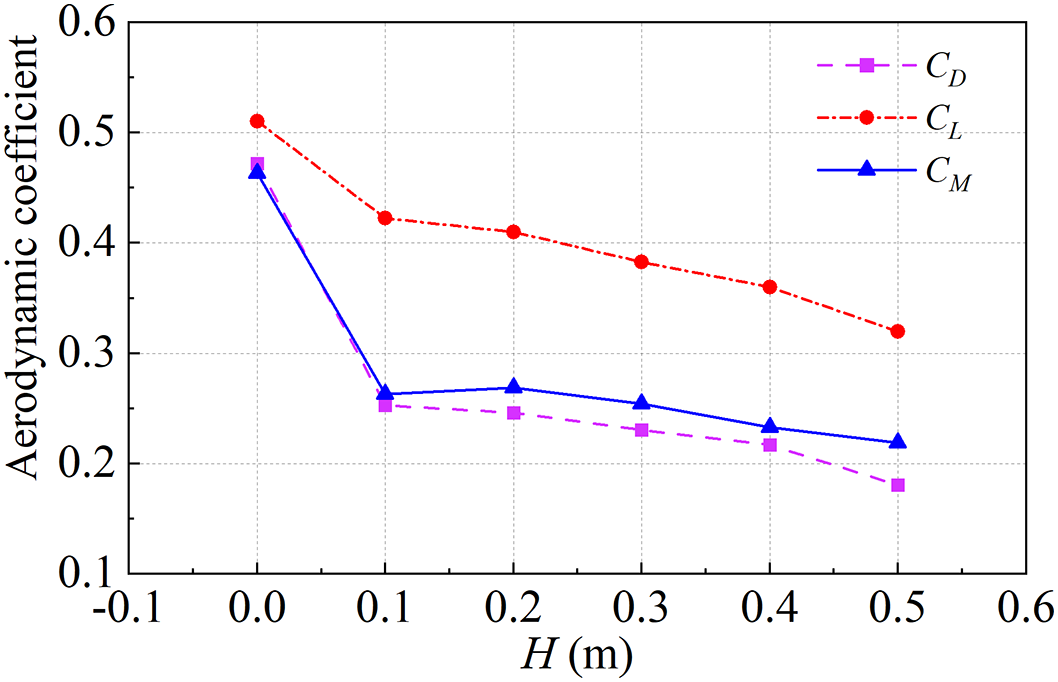
Figure 17: Aerodynamic coefficient varying with wave height
Following the analysis of wave height, this study further examines the influence of wave phase—defined by the horizontal distance of the PV panel from the wave crest (x0 = −3, −2, −1, 0, 1, 2 m)—on wind load characteristics. Given that the pressure coefficient contour plots (Fig. 18) do not reveal an obvious visual pattern, the phase-dependent variation is quantified in Fig. 19a by tracking the maximum pressure coefficient over the panel (μs,max) at each phase position over a wave with 6.0 m wave length.
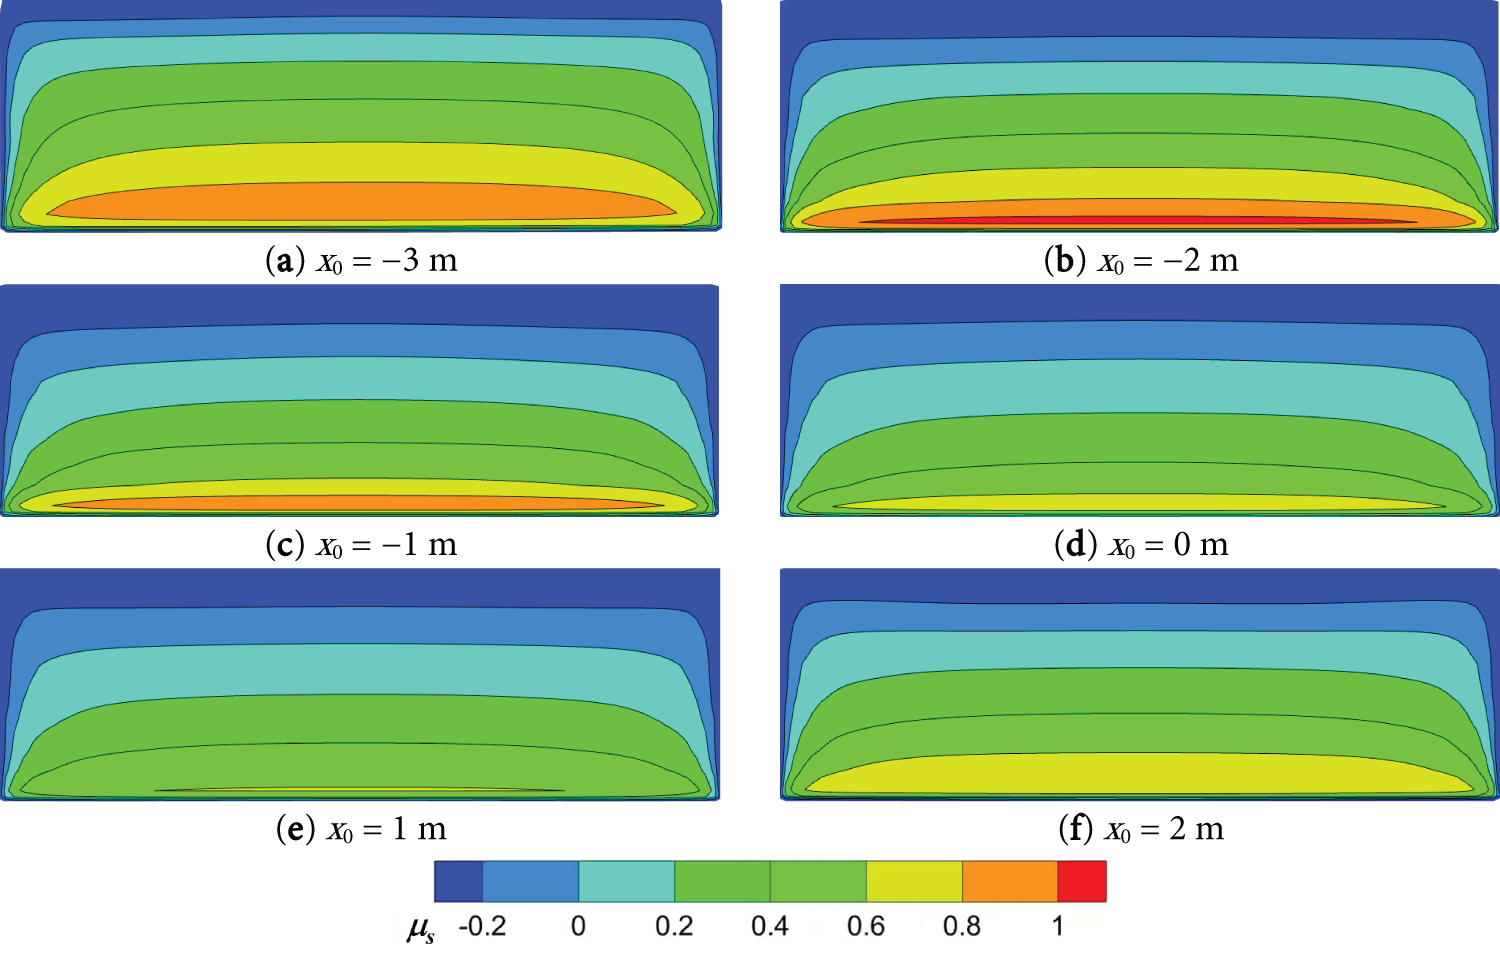
Figure 18: The distribution of pressure coefficients varying with wave phases
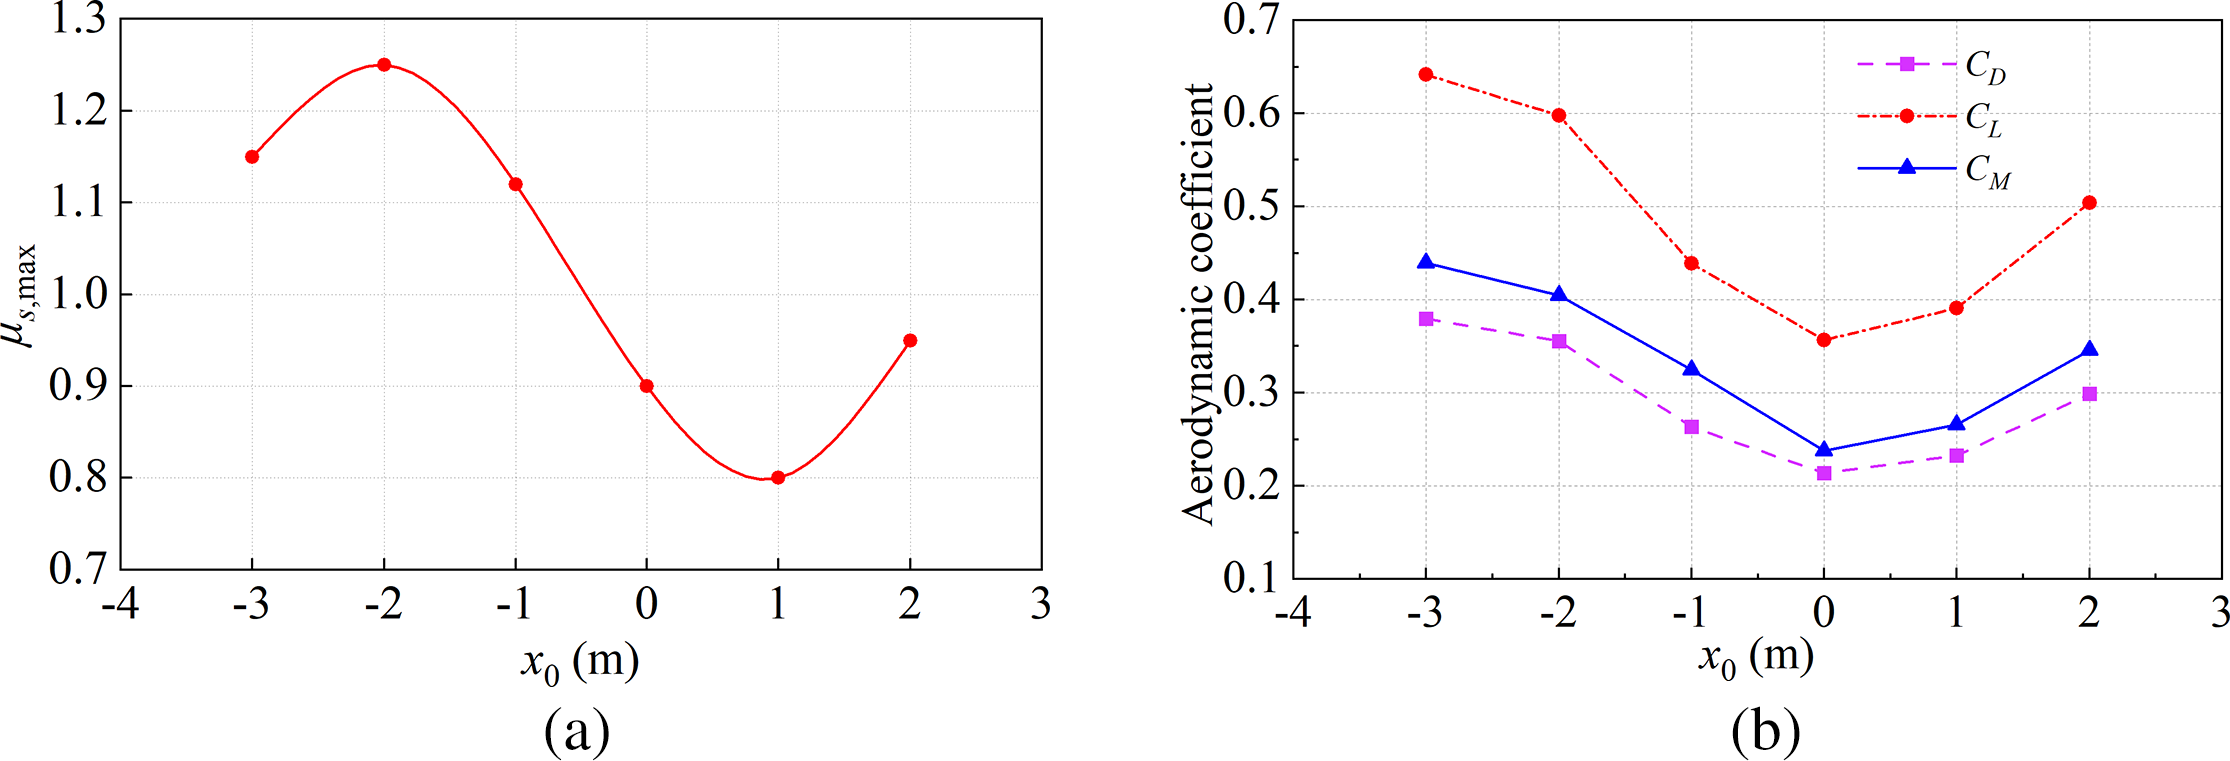
Figure 19: Pressure and aerodynamic coefficients about the wave phases. (a) Pressure coefficients. (b) Aerodynamic coefficients
As shown in Fig. 19a, the maximum pressure coefficient exhibits an approximately sinusoidal variation with wave phase. It increases markedly from x0 = −3 to −2 m, peaking at about 1.25 when the panel is situated directly above the wave trough, where windward loading is most concentrated. From x0 = −2 to 1 m, the coefficient declines steadily, reaching a minimum of approximately 0.8 at x0 = 1 m, indicating a significant reduction in wind load away from the trough. As the phase shifts further from x0 = 1 to 2 m, the coefficient partially recovers to about 0.95, though it remains below the initial peak. This sinusoidal pattern underscores how the relative position between the panel and the wave crest governs the wind pressure distribution: airflow is amplified near the wave peak, while it is attenuated elsewhere. These phase-induced variations confirm that wave morphology significantly modulates the effective wind load on offshore PV modules, with the most severe loading conditions occurring when panels are positioned above the wave trough.
This study systematically investigated the wind load characteristics of offshore photovoltaic panels using a validated numerical model that incorporates free-surface wave effects. The principal findings are as follows:
(1) All three aerodynamic force coefficients increase with wind speed. The lift coefficient is most sensitive to speed under wave conditions. Both the pressure coefficient and wind pressure remain lower in the presence of waves compared to flat terrain, with the difference widening at higher speeds, demonstrating the attenuating effect of wave interference on effective wind loads.
(2) Increasing the tilt angle (β) intensifies flow separation and vortex formation, leading to a rise in all aerodynamic coefficients. The rate of increase is more pronounced over flat ground. At β = 35°, the maximum pressure coefficient under wave conditions is approximately 20% lower than on flat ground, highlighting the significant load-reducing effect of waves at steep inclinations.
(3) The influence of ground clearance is multifaceted. The pressure coefficient rises consistently with height. The drag coefficient exhibits initial oscillations at low clearances before increasing, while the lift coefficient shows a slight initial decrease followed by a steady rise. The moment coefficient increases monotonically, with values consistently higher under wavy conditions. In the mid-to-high clearance range, high-pressure zones are more extensive and irregular over flat ground, underscoring the combined role of interface morphology and panel elevation in shaping windward pressure patterns.
(4) Increasing wave height reduces both the pressure coefficient and the three aerodynamic force coefficients. Wind load is maximized when panels are positioned directly above the wave trough (x0 = −2 m) and diminishes with distance from the crest. All force coefficients exhibit a sinusoidal-like variation with wave phase, decreasing initially and then increasing, which confirms the regulatory role of nonlinear wave-air interactions on the wind load.
The findings of this study offer direct implications for the development of structural health monitoring systems for offshore PV farms. The critical load conditions are identified, which means the pressure or strain sensors can be strategically placed. It is recommended to install sensors near the leading edge and central windward surface of panels with large tilt angles (e.g., β > 25°) and elevated clearances (e.g., C > 0.35 m), especially those located near wave troughs. This targeted monitoring approach enables real-time detection of extreme aerodynamic loads and supports early warning for potential structural failures.
These findings provide valuable guidance for the structural design of offshore PV support systems, enabling optimized configurations for enhanced wind resistance and operational safety. Future work should focus on incorporating more sophisticated fluid-structure interaction (FSI) models to capture the dynamic response of PV panels under combined wind and wave loads. Specifically, the time-changing wave surface should be considered, rather than static wavy terrain. Furthermore, the flexibility and vibration characteristics of the PV panels and their support structures must be integrated into the analysis. Such high-fidelity modeling will significantly improve the accuracy of load predictions and provide a comprehensive basis for the structural optimization and long-term reliability assessment of offshore PV systems.
Acknowledgement: I am sincerely grateful to the members of my thesis committee for their constructive feedback, critical comments, and valuable advice during the proposal defense and final examination.
Funding Statement: This study was financially supported by China Postdoctoral Science Foundation (Grant No. 2024M752865), Postdoctoral Fellowship Program of CPSF (Grant No. GZC20241531), Shandong Provincial Higher Education Institutions Youth Plan Team (2022KJ081), the Double First-Class Discipline Construction Fund Project of Harbin Institute of Technology at Weihai (2023SYLCB04), and the Open Funding of the Research Center of Civil, Hydraulic and Power Engineering of Xizang (XZA202405CHP2002B).
Author Contributions: The authors confirm contribution to the paper as follows: Conceptualization, Yu Shen and Qinghe Fang; methodology, Yu Shen, Yi Liu, and Qinghe Fang; software, Yu Shen and Yi Liu; validation, Yu Shen, Liuyang Li, and Kaiming Pan; formal analysis, Yu Shen and Yi Liu; investigation, Yu Shen and Yi Liu; resources, Qinghe Fang and Hanchen Zhang; data curation, Yi Liu and Yu Shen; writing—original draft preparation, Yu Shen and Yi Liu; writing—review and editing, Yu Shen, Qinghe Fang, Hanchen Zhang, Liuyang Li, and Kaiming Pan; visualization, Yi Liu and Yu Shen; supervision, Qinghe Fang; project administration, Yu Shen; funding acquisition, Yu Shen and Qinghe Fang. All authors reviewed the results and approved the final version of the manuscript.
Availability of Data and Materials: The data that support the findings of this study are available from the corresponding author, Qinghe Fang, upon reasonable request.
Ethics Approval: Not applicable.
Conflicts of Interest: The authors declared no potential conflicts of interest with respect to the research, authorship, and publication of this article.
References
1. Li W, Zhou LL, Gan J, Wu WG. Finite element analysis of photovoltaic floating body based on design wave method. In: Proceedings of the 28th International Ocean and Polar Engineering Conference; 2018 Jun 10–15; Sapporo, Japan. [Google Scholar]
2. Ren Y, Yao X, Liu D, Qiao R, Zhang L, Zhang K, et al. Optimal design of hydro-wind-PV multi-energy complementary systems considering smooth power output. Sustain Energy Technol Assess. 2022;50:101832. doi:10.1016/j.seta.2021.101832. [Google Scholar] [CrossRef]
3. Ma C, Liu Z. Water-surface photovoltaics: performance, utilization, and interactions with water eco-environment. Renew Sustain Energy Rev. 2022;167:112823. doi:10.1016/j.rser.2022.112823. [Google Scholar] [CrossRef]
4. Chen M, Jiang Y, Zhou Y, Li CB, Tang Y, Chen Z, et al. Advancing the efficient computation of flexible interconnected multi-floater photovoltaic platforms by coupled hydrodynamic-structural model. Phys Fluids. 2025;37(3):037167. doi:10.1063/5.0266597. [Google Scholar] [CrossRef]
5. Chen H, Fang C, Li Y. Nonlinear buffeting responses of a coastal long-span bridge under the coupled wind, wave and current loads. Ocean Eng. 2024;293:116661. doi:10.1016/j.oceaneng.2023.116661. [Google Scholar] [CrossRef]
6. Yin RT, Zhu B, Yuan SW, Li JN, Yang ZY, Yang ZY. Dynamic analyses of long-span cable-stayed and suspension cooperative system bridge under combined actions of wind and regular wave loads. Appl Ocean Res. 2023;138:103683. doi:10.1016/j.apor.2023.103683. [Google Scholar] [CrossRef]
7. Zhao Y, Yang Y, Zhang H, Li M. Experimental investigation of wind loads on solar arrays with varying row configurations and tilt angles. Renew Energy. 2025;242:122440. doi:10.1016/j.renene.2025.122440. [Google Scholar] [CrossRef]
8. Ma W, Zhao L, Cárdenas-Rondón JA, Gómez-Ortega O, Kang X, Wang H. Experimental study on the interference effects of torsional aerodynamic instability in single-axis solar tracker arrays. Renew Energy. 2025;248:123125. doi:10.1016/j.renene.2025.123125. [Google Scholar] [CrossRef]
9. Xu A, Ma W, Yang W, Li M, Tan Y, Zou C, et al. Study on the wind load and wind-induced interference effect of photovoltaic (PV) arrays on two-dimensional hillsides. Sol Energy. 2024;278:112790. doi:10.1016/j.solener.2024.112790. [Google Scholar] [CrossRef]
10. Choi SM, Lee GR, Park CD, Cho SH, Lim BJ. Wind load on the solar panel array of a floating photovoltaic system under extreme hurricane conditions. Sustain Energy Technol Assess. 2021;48:101616. doi:10.1016/j.seta.2021.101616. [Google Scholar] [CrossRef]
11. Agarwal A, Irtaza H, Zameel A. Numerical study of lift and drag coefficients on a ground-mounted photo-voltaic solar panel. Mater Today Proc. 2017;4(9):9822–7. doi:10.1016/j.matpr.2017.06.274. [Google Scholar] [CrossRef]
12. Liu T, Mi H, Ai Y, Zhang H, Zhou D, Zhou L. Wind load interference mechanisms for inclined angle and gap spacing of photovoltaic panels. Phys Fluids. 2025;37(2):023623. doi:10.1063/5.0249576. [Google Scholar] [CrossRef]
13. Jandova K, Janda M. Wind effect simulation on photovoltaic modules. ECS Trans. 2018;87(1):411–3. doi:10.1149/08701.0411ecst. [Google Scholar] [CrossRef]
14. Su KC, Chung PH, Yang RY. Numerical simulation of wind loads on an offshore PV panel: the effect of wave angle. J Mech. 2020;37:53–62. doi:10.1093/jom/ufaa010. [Google Scholar] [CrossRef]
15. Song J, Imani H, Yue J, Yang S. Hydrodynamic characteristics of floating photovoltaic systems under ocean loads. J Mar Sci Eng. 2023;11(9):1813. doi:10.3390/jmse11091813. [Google Scholar] [CrossRef]
16. Zhang J, Zhu B, Kang A, Yin R, Li X, Huang B. Experimental and numerical investigation of wave-current forces on coastal bridge superstructures with box girders. Adv Struct Eng. 2020;23(7):1438–53. doi:10.1177/1369433219894238. [Google Scholar] [CrossRef]
17. Buckles J, Hanratty TJ, Adrian RJ. Turbulent flow over large-amplitude wavy surfaces. J Fluid Mech. 1984;140:27–44. doi:10.1017/s0022112084000495. [Google Scholar] [CrossRef]
18. Hao X, Li T, Cao T, Shen L. Simulation-based study of wind—wave interactions under various sea conditions. J Hydrodyn. 2019;31(6):1148–52. doi:10.1007/s42241-019-0088-z. [Google Scholar] [CrossRef]
19. Fu J, Zhao YP, Jia GC, Ma C, Shu JQ, Sun YQ. Numerical study on wave-wind coupling effects on hydrodynamics and light capture performance of offshore multi-body floating photovoltaic system. Ocean Eng. 2025;323:120593. doi:10.1016/j.oceaneng.2025.120593. [Google Scholar] [CrossRef]
20. Zhang M, Yang D, Du J, Xu K, Yuan W. Aerodynamic effects of an offshore floating photovoltaic platform undergoing pitch and heave motions. Ocean Eng. 2024;310:118753. doi:10.1016/j.oceaneng.2024.118753. [Google Scholar] [CrossRef]
21. Zhang D, Liu Z, Li W, Zhang J, Cheng L, Hu G. Fluid-structure interaction analysis of wind turbine aerodynamic loads and aeroelastic responses considering blade and tower flexibility. Eng Struct. 2024;301:117289. doi:10.1016/j.engstruct.2023.117289. [Google Scholar] [CrossRef]
22. Zhang D, Zhong X, Wei K, Zheng S, Li C, Hu G, et al. On structural loads and responses of monopile offshore wind turbines under typhoons: numerical case study of Super Typhoon Chan-hom. Case Stud Constr Mater. 2025;23:e05031. doi:10.1016/j.cscm.2025.e05031. [Google Scholar] [CrossRef]
23. Menter F. Zonal two equation k-w turbulence models for aerodynamic flows. In: 23rd Fluid Dynamics, Plasmadynamics, and Lasers Conference. Orlando, FL, USA: AIAA; 1993. doi:10.2514/6.1993-2906. [Google Scholar] [CrossRef]
24. Ma WY, Ma CC, Wang CY, Han XL, Gao F. Wind tunnel experimental study on the wind load interference effect of solar panel arrays. J Exp Fluid Mech. 2021;35(4):19–25. (In Chinese). [Google Scholar]
25. Ma WY, Chai XB, Liu QK, Xing KY, Liu XB. Study on effect of bottom flow obstruction on wind load of solar photovoltaic panels. Build Struct. 2019;49(2):129–34. (In Chinese). doi:10.19701/j.jzjg.2019.02.023. [Google Scholar] [CrossRef]
Cite This Article
 Copyright © 2026 The Author(s). Published by Tech Science Press.
This work is licensed under a Creative Commons Attribution 4.0 International License , which permits unrestricted use, distribution, and reproduction in any medium, provided the original work is properly cited.
 Downloads
 Citation Tools