
 Submit a Paper
 Propose a Special lssue
 Open Access
ARTICLE

The Use of EDX to Detect Causes of Unachieved Concrete Quality in Batching Plant Models
1 Civil Engineering Department, Faculty of Engineering, University of Lampung, Bandar Lampung, Indonesia
2 Chemistry Department, Faculty of Mathematics and Natural Sciences, University of Lampung, Bandar Lampung, Indonesia
* Corresponding Author: Supriyanto. Email:
Structural Durability & Health Monitoring 2026, 20(2), 8 https://doi.org/10.32604/sdhm.2026.073449
Received 18 September 2025; Accepted 11 December 2025; Issue published 31 March 2026
 View Full Text
 Download PDF
Abstract
This study investigates the impact of Type D additive, Plastiment 83 AM, on the compressive strength and microstructure of Portland Composite Cement (PCC) concrete with a target compressive strength of 18.7 MPa, utilizing a mixing, stirring, and treatment model that simulates batching plant conditions. The study investigated additive dosages of 0%, 0.15%, 0.25%, 0.35%, and 0.40%, with stirring durations of 15 min, 2, 4, 6, and 6.5 h. Compressive strength tests were conducted at the ages of 7, 14, 28, 56, and 90 days on cylindrical specimens, and at 24 h for setting time tests. Microstructural analysis using Energy Dispersive X-ray Spectroscopy (EDX) was performed at 56 days of age. The results showed that the optimal dosage was 0.15%, combined with the addition of Plastiment 83 AM 0.10% at 2 h of stirring, which achieved the highest compressive strength of 20.5 MPa at 90 days. A reduction in compressive strength of the setting time samples from the initial value to 24 h was observed in mixtures stirred for 6 and 6.5 h. A decrease in compressive strength was also observed in both mixtures between 56 and 90 days. EDX analysis revealed different chemical compositions in each mix. At a stirring duration of 6 and 6.5 h, Plastiment 83 AM dosages of 0.35% and 0.40% showed the presence of Magnesium (Mg) and Aluminium (Al) (at 6 h) and Al and phosphorus (at 6.5 h). The presence of inhibited the hydration process, resulting in a very small increase in compressive strength from 14 to 28 days. Magnesium reduced the compressive strength to 75%, and phosphorus to 63% of the target compressive strength.Keywords
Concrete is a fundamental material in modern construction due to its durability, strength, and adaptability. Composed of cement, aggregates, water, and additives, concrete can be engineered to meet a wide range of structural and environmental requirements. One of the primary indicators of concrete quality is its compressive strength, which is typically measured through a 28-day pressure test using a cylindrical test specimen. In large-scale construction projects, concrete is commonly supplied as ready-mix from batching plants, which streamlines production, transportation, and placement. In addition to practicality, users expect ready-made concrete to meet performance requirements in terms of strength and durability. However, concrete delivered from a batching plant may require a long travel time to reach the foundry site, especially in remote or highland areas. Delays in the pouring process can occur, especially when waiting for equipment such as concrete buckets, tower cranes, or concrete pump trucks, all of which require adequate preparation time. During transportation and staging before placement, the mixer truck drum must rotate continuously at a specified speed to prevent premature setting of the concrete.
The speed of the spin affects the hydration process. The rotation speed of cement mixer trucks is generally categorized into low (16 rpm), medium (23 rpm), and high (32 rpm) [1]. According to, the recommended drum speed is approximately 8–12 revolutions per minute (rpm), which is considered a very low speed. Standard [2] stipulates that the concrete mixture in a mixer truck must undergo 70–100 revolutions at the mixing speed specified by the manufacturer. If homogeneity is not achieved within 100 revolutions, the mixture is deemed unacceptable. At a speed of 8–12 rpm, completing 70–100 revolutions takes about 5.8–12.5 min, a relatively short duration compared to the total transportation time required to deliver fresh concrete from the batching plant to the project site.
Higher rotational speeds have the potential to cause clumping and undesirable microstructural changes [1]. The weight of the concrete mixture influences the rotational speed—the heavier the mixture, the slower the rotation, and the greater the force required to rotate the drum. An increase in concrete weight of approximately 10,000 kg results in an increase in hydraulic oil pressure of about 10 bar [3]. Adjusting the drum speed from 5 to 20 rpm results in a 22% increase in hydraulic oil pressure, whereas changes in mix design contribute minimally [3]. Therefore, both the mixture weight and rotational speed significantly affect the operational load on batching equipment.
A rotational speed of 25 rpm has been reported to increase the compressive strength by 5.8% compared with the control concrete. However, at higher speeds—35 and 50 rpm—the compressive strength decreases [4]. At moderate speeds, a longer mixing duration generally enhances compressive strength, although it tends to reduce the slump value [5].
Insufficient stirring results in incomplete particle bonding, while excessive mixing time reduces bonding efficiency [6]. Prolonged stirring tends to lower the moisture content, making it essential to maintain adequate moisture to ensure proper hydration and workability [7]. This finding is consistent with, which reported that excessive mixing time leads to a loss of plasticity. Prolonged stirring also decreases concrete density and electrical resistivity per mixing hour, indicating increased porosity and higher susceptibility to chemical attack, as well as reduced compressive strength. Changes in electrical resistivity may arise from alterations in the chemical composition of the mix, which also affects its plasticity and density. The loss of plasticity makes the mixture more prone to cracking. Experimental results indicate that continuous rotation for up to 7 h can maintain—or even slightly improve—the compressive strength of PC-40 cement, whereas PC-32 and PC-LF types exhibit a decline in strength after 8 h. Mixing for 10 min produces the highest compressive strength of 17.021 MPa [8], although [6] reported an optimal mixing duration of approximately 7.5 min. When concrete is mixed for 5, 90, and 180 min, both compressive and tensile strength decrease, while permeability increases [9] Therefore, the optimal mixing duration depends on the constituent materials used in the concrete mix.
Prolonged stirring also contributes to a gradual increase in pH, which influences the microstructure and chemical stability of concrete. A high pH environment provides excellent protection for embedded reinforcement and enhances corrosion resistance [10]. Under high pH conditions, relatively insoluble calcium hydrates such as C–S–H, C–H, and C–A–S–H remain in stable equilibrium. However, excessively high pH can also be detrimental, leading to alkali–silica reaction (ASR), increased porosity, and moisture-induced damage. When the moisture content exceeds 30%, calcium becomes more susceptible to leaching, resulting in porous concrete [11]. Consequently, concrete exposed to humid environments faces a higher risk of porosity compared to concrete in drier conditions.
During transportation to the construction site, water or water-reducing additives may be added with the buyer’s consent. However, additional materials should not be used as partial cement substitutes without the buyer’s written approval [12]. Consequently, many critical decisions lie in the hands of buyers, although not all possess adequate knowledge of concrete technology. Moreover, compliance with ASTM C94 does not necessarily ensure the suitability of such additives for reinforced concrete applications [13]. This emphasizes the need for further research on ready-mix concrete, which can provide valuable insights and technical guidance for both manufacturers and consumers.
From a batching plant perspective, quality control is influenced by several key factors, including material supply and selection, equipment maintenance, production and transportation systems, mixer capacity, mixing duration, drum rotation speed, and additive dosage and timing. These factors directly affect the durability and safety of construction structures [14].
One of the main parameters for evaluating the workability of fresh concrete is the slump value. High-performance concrete (HPC) typically exhibits lower slump values than normal concrete due to its reduced water-to-cement ratio. Slump is also affected by transportation time from the batching plant to the casting site [15] and by mixing energy or stirring power [16]. To maintain the required slump, additives such as plasticizers, retarders, or additional water are introduced at specific intervals. Accurate timing and dosage are essential to ensure both the concrete’s workability and its ultimate strength performance.
Chemical admixtures are widely used to enhance the workability, compressive strength, and durability of concrete mixtures [17]. High-quality concrete is concrete with a minimum fc′ of 41.4 MPa. According to [18], high-quality concrete is defined as having a minimum design compressive strength (fc′) of 41.4 MPa. High-strength concrete (HSC) typically requires a very low water-cement ratio, which makes placement difficult and necessitates the use of plasticizers. However, not only HSC but also normal concrete (NC)—with a compressive strength ranging from 17 to 41.4 MPa—requires admixtures, especially for projects involving long-distance transportation or special performance requirements. NC is commonly used in a variety of structures, including high-rise buildings, bridges, rigid pavements, foundations, retaining walls, and hydraulic structures. Even in projects utilizing HSC, NC is frequently used in secondary or non-critical sections. Therefore, research on ready-mix NC is particularly important. The effectiveness of additives depends on the interaction between the admixture and the concrete’s constituent materials. The performance of ready-mix concrete should be re-evaluated at six months of age in addition to the standard 28-day test. Suppose the six-month compressive strength does not reach at least 100% of the reference strength. In that case, the mixture’s temporary conformity with standards must be revoked, and all users should be notified immediately [19].
Plasticizers and retarders are among the most commonly used admixtures in ready-mix concrete. Additives that possess both properties are classified as Type D admixtures [19]. These admixtures improve workability by reducing water demand and delaying setting time, thereby providing more time for placement and finishing operations [20,21]. Type D admixtures enhance cement hydration, forming denser microstructures with reduced porosity and higher compressive strength [22]. Research by [23] on Type D and F admixtures reported improved formwork removal time and reduced drying duration, identifying 0.3% as the optimal Type D dosage [24]. Furthermore, higher doses of certain Type D admixtures, such as Plastiment-VZ, have been linked to further increases in compressive strength [25].
However, excessive use of Type D admixtures can lead to material segregation, increased porosity, and decreased compressive strength [26]. This highlights the importance of accurate dosing and the optimal mixing duration to achieve optimal concrete performance. Overdosing can also impair the cohesiveness of the mix and disrupt the hydration process, ultimately resulting in structural deficiencies [27].
In Indonesia, one of the most widely used Type D admixtures is Plastiment 83 AM. As a plasticizer-retarder, it contains carbon polyhydroxy salts that enhance hydration, reduce segregation, and improve workability—particularly beneficial during long-distance transportation, which often requires extended mixing times. Its molecular structure, rich in hydroxyl functional groups, interacts synergistically with cement particles to promote uniform hydration and superior performance [28].
From the discussion above, it is clear that numerous factors influence the quality of concrete produced in batching plants. The mixing speed and duration, type and dosage of additives, time and method of additive incorporation, and cement type all play crucial roles in determining the concrete’s strength and durability. The hydration and pozzolanic reactions that alter the constituent materials at specific stages may be disrupted by chemical admixtures, as well as by variations in mixing speed and duration. These disruptions can yield either positive or negative effects on the final concrete performance. Adverse effects are sometimes only identified after the structure has been in service for some time [29]. Concrete damage resulting from improper batching plant operations is often visible in building structures and rigid pavements (Fig. 1).
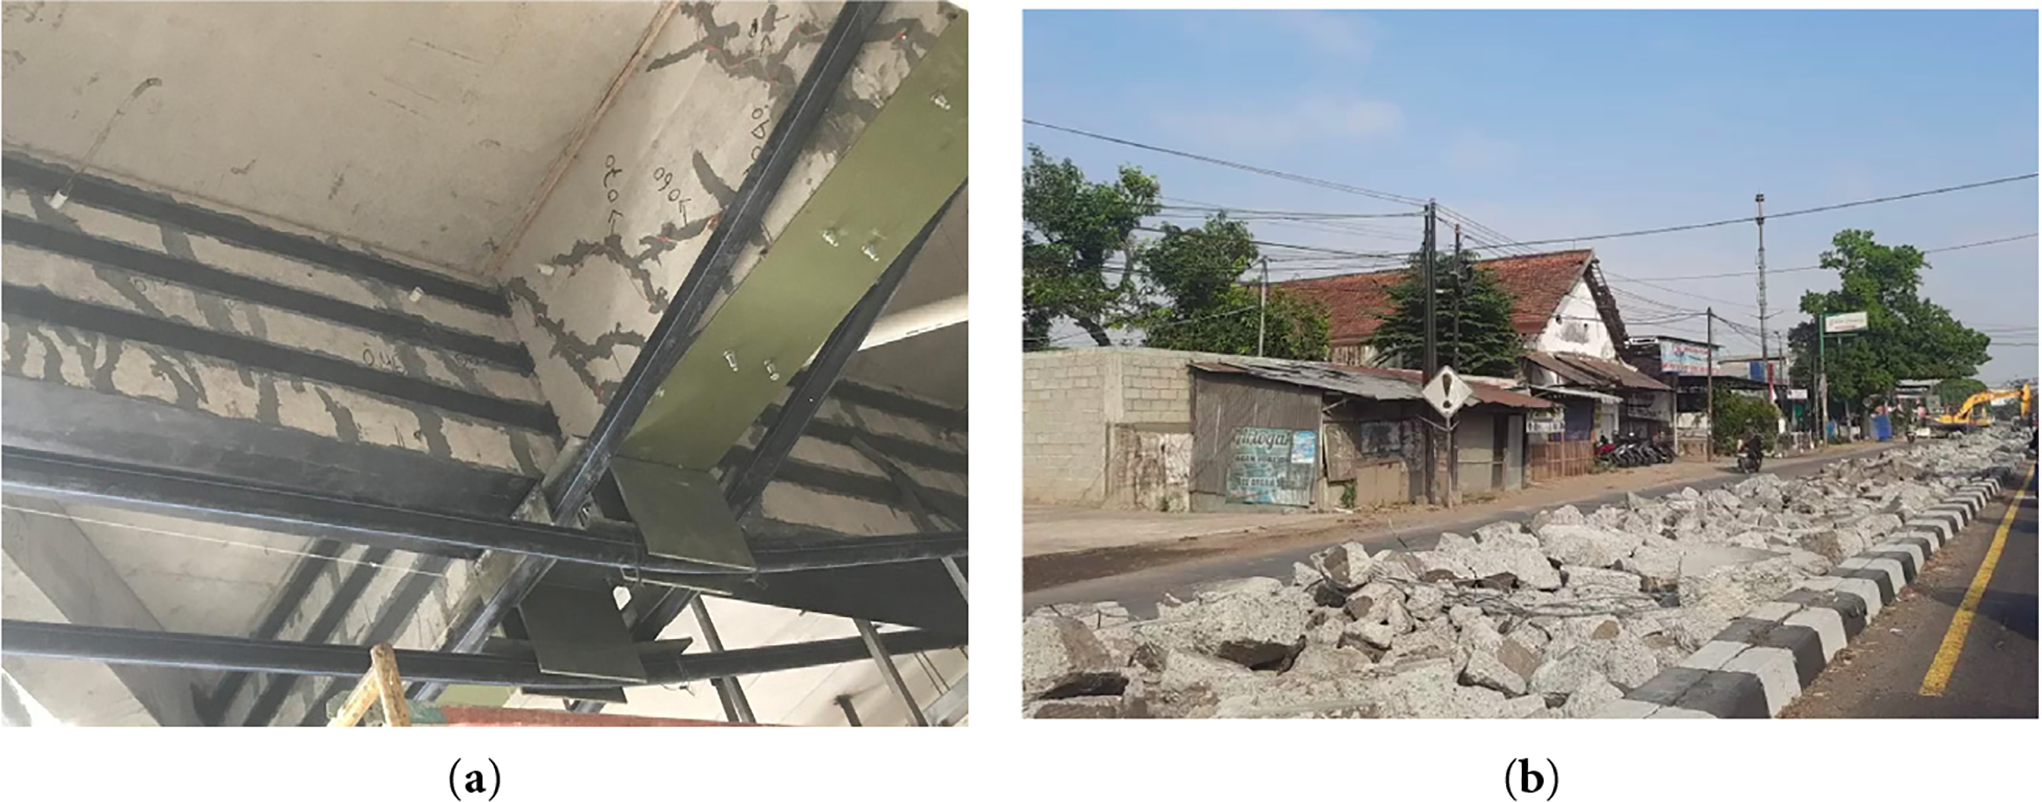
Figure 1: Concrete damage due to batching plant production: (a) Building structures, (b) Road pavements
Construction that fails to meet quality standards generates construction waste, primarily from demolition or rework activities. This waste may consist of concrete, steel, or timber. When concrete from a batching plant must be dismantled or reconstructed, it results in substantial financial losses and project delays, directly affecting profitability and productivity—essential components of national economic development. Beyond economic implications, poor-quality concrete also poses serious environmental and safety risks. A large quantity of concrete waste serves as a tangible indicator of production inefficiency and poor quality control. In many regions, improper waste management leads to high disposal costs without corresponding recovery value. In Brazil, various techniques have been implemented to manage and characterize concrete waste, including physical and chemical assessments. Physical analyses include granulometry, density, porosity, and scanning electron microscopy (SEM), while chemical–mineralogical characterizations utilize X-ray fluorescence (XRF), X-ray diffraction (XRD), specific surface area analysis, thermogravimetric analysis (TGA), SEM, and energy dispersive spectroscopy (EDS).
A recent survey in Egypt gathered insights from professionals involved in batching plant operations and construction projects. The study identified 19 significant factors, categorized into four major groups—labor, management, materials, and health, safety, and equipment—that influence the quality of concrete production. The findings highlight that concrete productivity strongly depends on Overall Equipment Effectiveness (OEE). Consequently, evaluating batching plant performance remains a complex challenge for plant managers and engineers due to numerous uncertainties and operational risks [30].
In Aceh Besar Regency, Indonesia, several companies supply ready-mix concrete, including PT. A, PT. B, PT. C, and PT. D. Although these companies are certified under ISO 9001:2015, their product quality often fails to meet required standards. Survey findings reveal that for PT. A, the main problem lies in the organizational context for PT. B., improvements are required in both organizational and planning aspects, and for PT. D, project planning is identified as a key concern [31]. The root causes of product inconsistency remain unclear; without identifying these causes, corrective actions cannot effectively resolve the issues.
Given that modern concrete production involves the use of admixtures and extended mixing durations, it is crucial to understand the microstructure of the concrete matrix to identify the causes of material degradation accurately. Several uncertainties complicate this analysis, including the effects of mixing duration and speed, as well as temperature and humidity, and the timing, dosage, and compatibility of chemical additives with cementitious materials. These factors introduce significant complexity, forming one of the main challenges addressed in this study. To analyze such complexities, advanced microstructural characterization techniques are required. For instance, the primary hydration and contamination processes in concrete can be elucidated by analyzing calcium (Ca), silicon (Si), aluminum (Al), and sulfur (S) using energy-dispersive X-ray spectroscopy (EDX). Similarly, XRD, EDX, and infrared spectroscopy (IR) have been applied to examine solid solutions between thaumasite and ettringite, providing insights into sulfate attack mechanisms.
SEM–EDX analysis can detect hydration products such as calcium hydroxide (CH), ettringite (AFt), calcium silicate hydrate (C–S–H), and calcium aluminate hydrate (CAH) in non-carbonated concrete, as well as calcium carbonate (CaCO3) formed during carbonation [32]. Microstructural and chemical analyses using SEM, EDX, and FTIR, as demonstrated by [33], have shown a strong correlation between increased compressive strength and greater C–S–H formation, along with reduced CH content in concrete containing 10% metakaolin as a partial cement replacement—particularly when treated with magnetized water.
The combined use of EDX and LA–ICP–MS has also been employed to analyze the spatial distribution and concentration of major and trace elements within the Portland cement phases [34]. Furthermore, EDX analysis of concrete incorporating 3% red sand has identified the presence of oxygen (O), calcium (Ca), silicon (Si), and iron (Fe) as key constituents [35].
From the studies reviewed above, it can be concluded that maintaining the quality of concrete produced by batching plants remains a significant challenge worldwide. This indicates that existing research has not yet fully addressed the root causes of quality variation, particularly from a microstructural perspective. The novelty of this study lies in identifying the causes of failure to achieve standard-quality normal concrete within batching plant systems through microstructural investigation. The results of this research are expected to provide significant scientific breakthroughs and contribute practical benefits to the batching plant industry by enhancing concrete quality control and production reliability, and this is the purpose of this research.
This research was conducted experimentally on normal concrete with a target compressive strength of 18.7 MPa. The study simulated the actual practices commonly applied in batching plants in Lampung, Indonesia, including material selection, mixing system, stirring speed and duration, and the type, dosage, and timing of additive application.
The determination of aggregate sources, concrete quality, and additive types and applications was based on a survey of four batching plants (out of six operating) in Lampung, Indonesia. The materials used in this study include PPC (Pozzolan Portland Cement) brand Merah Putih, a coarse aggregate of 10–20 mm size sourced from PT. Source Batu Berkah, Ketibung, South Lampung, and used by 50% batching plants in the region of Lampung, and fine aggregates sourced from Sungai Gunung Sugih, Central Lampung, Indonesia, used by 100% of the surveyed batching plants. The use of PCC complies with Indonesian National Standard (SNI) requirements. According to [36], this type of cement is classified as IP-U, which indicates that it is suitable for general use. All materials used in this study meet the specifications set by [37].
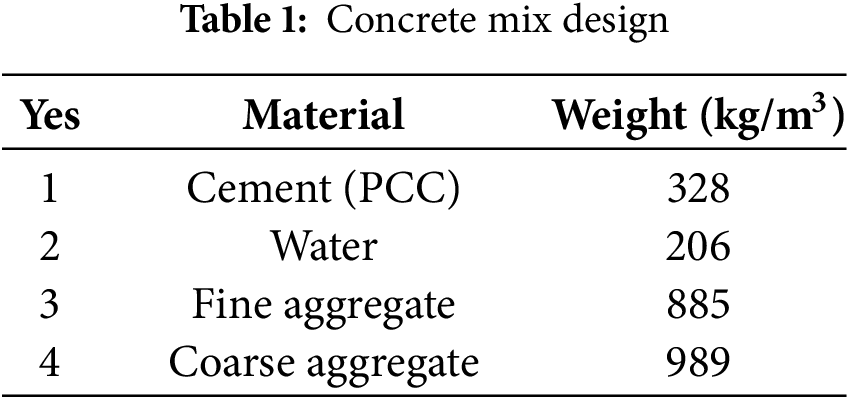
The concrete mix plan is arranged according to [38], as summarized in Table 1.
The Type D additive used in this study was Plastiment 83 AM, a new product from Sika. This admixture is relatively affordable and is widely used by batching plants in Lampung to produce concrete with a compressive strength of less than 250 kg/cm2. The target compressive strength for this study was 18.7 MPa (approximately 190 kg/cm2). The water-to-cement ratio (w/c) employed was 0.63, which is below the maximum limit of 0.70 as recommended in. The mixer used in this research had a capacity of 500 L and was equipped with adjustable rotational speed control, allowing for the simulation of various batching plant mixing conditions.
2.2.1 Mixer Rotation and Additives
The mixing speed depends on the mixer model. Generally, concrete mixer trucks operate at 24–32 revolutions per minute (rpm), while standard truck mixers rotate at 13–20 rpm. Previous studies have reported that 25 rpm represents an optimal mixing speed [4]. In this study, the mixer truck was operated at 24–30 rpm, which falls within the standard operational range and approximates the optimal speed.
In field conditions, the delivery of concrete to remote areas often exceeds two hours of travel time, even though [39] stipulates that fresh concrete should be delivered within 2 h by mixer truck, or within 1 h if transported using a non-mixer vehicle. To simulate such field conditions, mixing in this study was carried out for 2, 4, 6, and 6.5 h, as shown in Table 2.
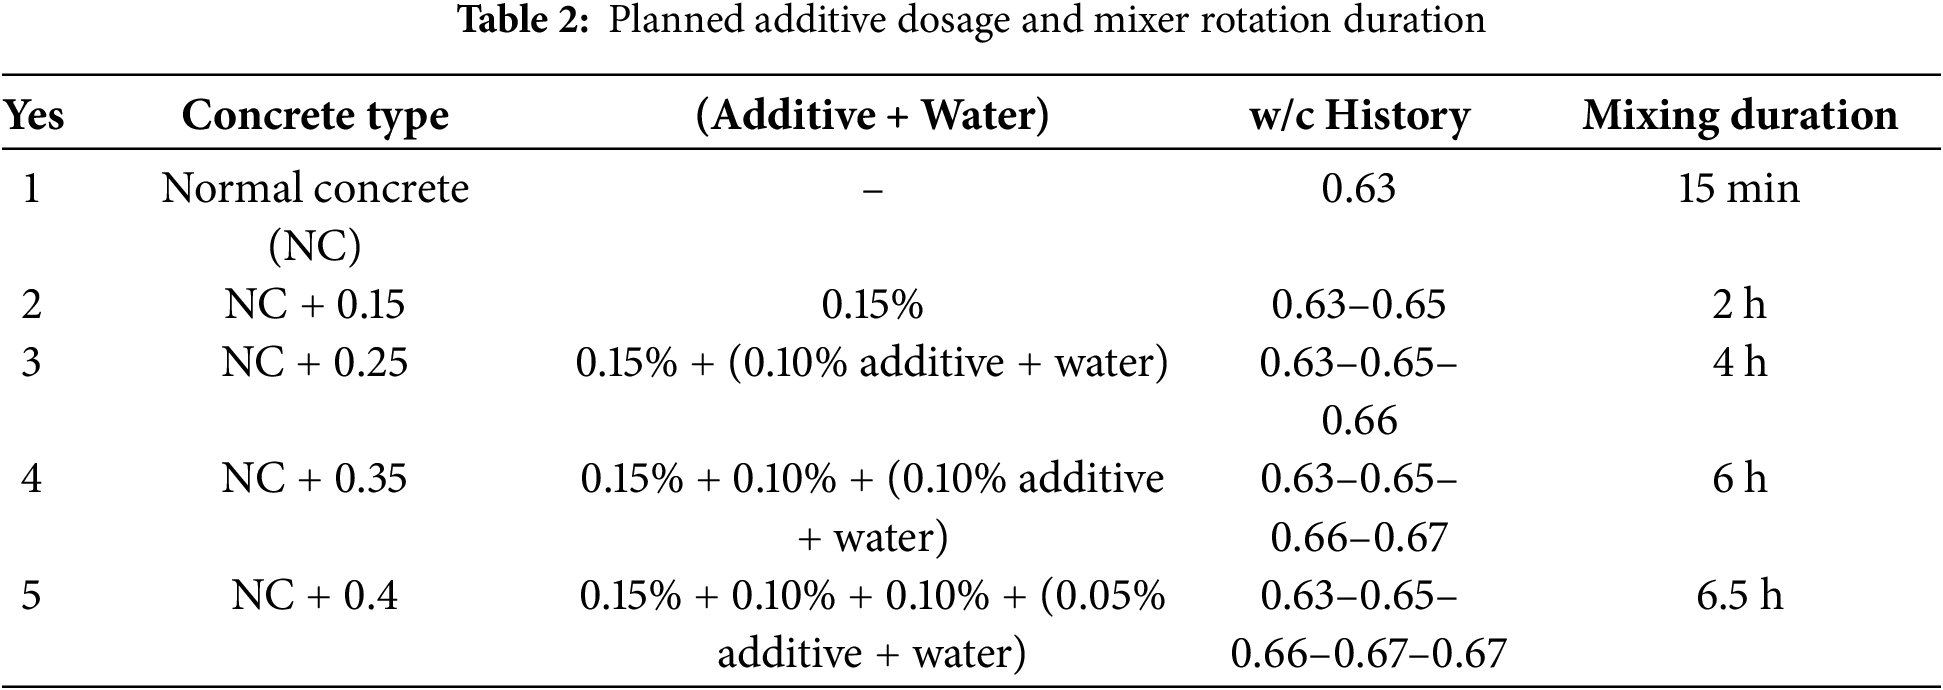
The addition of additives was performed gradually. To ensure uniform distribution, the additive was first diluted with water before being introduced into the mixer, following standard field procedures as summarized in Table 2. According to, the addition of water and admixtures is permitted as long as it does not compromise the quality of the concrete. Water was added as required to meet slump requirements [13]. The majority of batching plant products in Lampung are designed to achieve a slump value of 12–15 cm. For slump values greater than 100 mm, the permissible tolerance is ±40 mm. This slump range is categorized as a typical slump [13]. The addition of water slightly increases the water-to-cement (w/c) ratio at each stage; however, the ratio remained below 0.7, thus satisfying the requirements stated in SNI 7656:2012.
The effect of Plastiment 83 AM and stirring duration on the setting time was investigated. The concrete mixtures listed in Table 2 were sieved through a 4.75 mm sieve and cast into cube molds, with one cube for each treatment type. The cubes were tested to determine the initial setting time, as described in SNI 7656:2012, regarding the water-cement ratio factor in concrete production with water-cement ratio adjustment additives, which must be carried out as desired, using a penetrometer. Concrete was considered to have reached its initial setting time when its compressive strength reached 3.5 MPa. Compressive testing on the cubes was carried out after 24 h, as the hydration reaction rate is highest during the first 24 h.
2.2.3 Curing and Compressive Strength
Concrete mixtures listed in Table 2 were poured into cylindrical molds measuring 15 cm in diameter and 30 cm in height. For each variation, 15 cylinders were prepared for compressive strength testing at the ages of 7, 14, 28, 56, and 90 days, using three specimens per age group. The molds were removed after 24 h of casting, and the samples were stored in unprotected conditions to replicate typical project-site environments. Curing procedures followed standard field practices, as outlined below:
1. After casting, the concrete was left undisturbed for 4–6 h, depending on surface conditions, to prevent premature damage from exposure to water or curing materials.
2. On the first day, the concrete surface was sprayed with water for 10 min every hour over 7 h to maintain surface moisture.
3. From the second day onward, watering was carried out three times daily—morning, noon, and afternoon—for a duration of 7 days.
After curing, the test specimens were stored in a protected area, similar to field conditions, where the concrete surface is covered by subsequent structural layers, until the testing period. The compressive strength tests were conducted using a Universal Testing Machine (UTM) at the Materials and Construction Laboratory of the University of Lampung. Crack patterns from each compression test were recorded and analyzed.
2.2.4 Microstructures Analysis
Microstructural analysis was conducted to examine the effect of Plastiment 83 AM dosage and mixing duration on concrete properties. Testing was performed using Energy Dispersive X-ray Spectroscopy (EDX) on samples aged 56 days for all mixture types (as shown in Table 2). For each condition, one representative specimen was prepared from fragments of three cylindrical samples, with approximately 2.5 g of material taken from each cylinder. The fragments were ground into fine particles (~75 μm) for EDX testing. The analysis was carried out at the Integrated Laboratory and Center for Technological Innovation, University of Lampung, Indonesia.
Compressive Strength Data Analysis
Compressive strength data for each concrete age and mixture variation were analyzed using Dixon’s criteria to detect outliers, followed by repeated ANOVA at a 10% significance level to ensure data reliability [40]. Strength development trends over time were examined to identify slower growth patterns, which were further analyzed to determine possible causative factors. Failure patterns from the compressive tests were compared with the standard concrete failure mode [41], and the degree of brittleness was evaluated. Cracked specimens were further examined to assess matrix integrity, identify weak zones, and observe the behavior of aggregate detachment.
EDX Data Analysis
Energy Dispersive X-ray (EDX) analysis was used to determine the chemical elements present in each concrete sample. The potential influence of these detected elements on the performance of concrete, particularly in terms of compressive strength and durability, was thoroughly analyzed.
Integrated Analysis: Compressive Strength, Failure Pattern, and EDX
A comprehensive analysis was conducted to investigate the relationship between elemental composition (as determined by EDX results), compressive strength values, and failure patterns observed during mechanical testing. This integrated approach was employed to identify factors contributing to the reduction in strength or abnormal cracking behavior in the specimens.
The overall research methodology and sequence of experimental activities are summarized in the flowchart shown in Fig. 2.
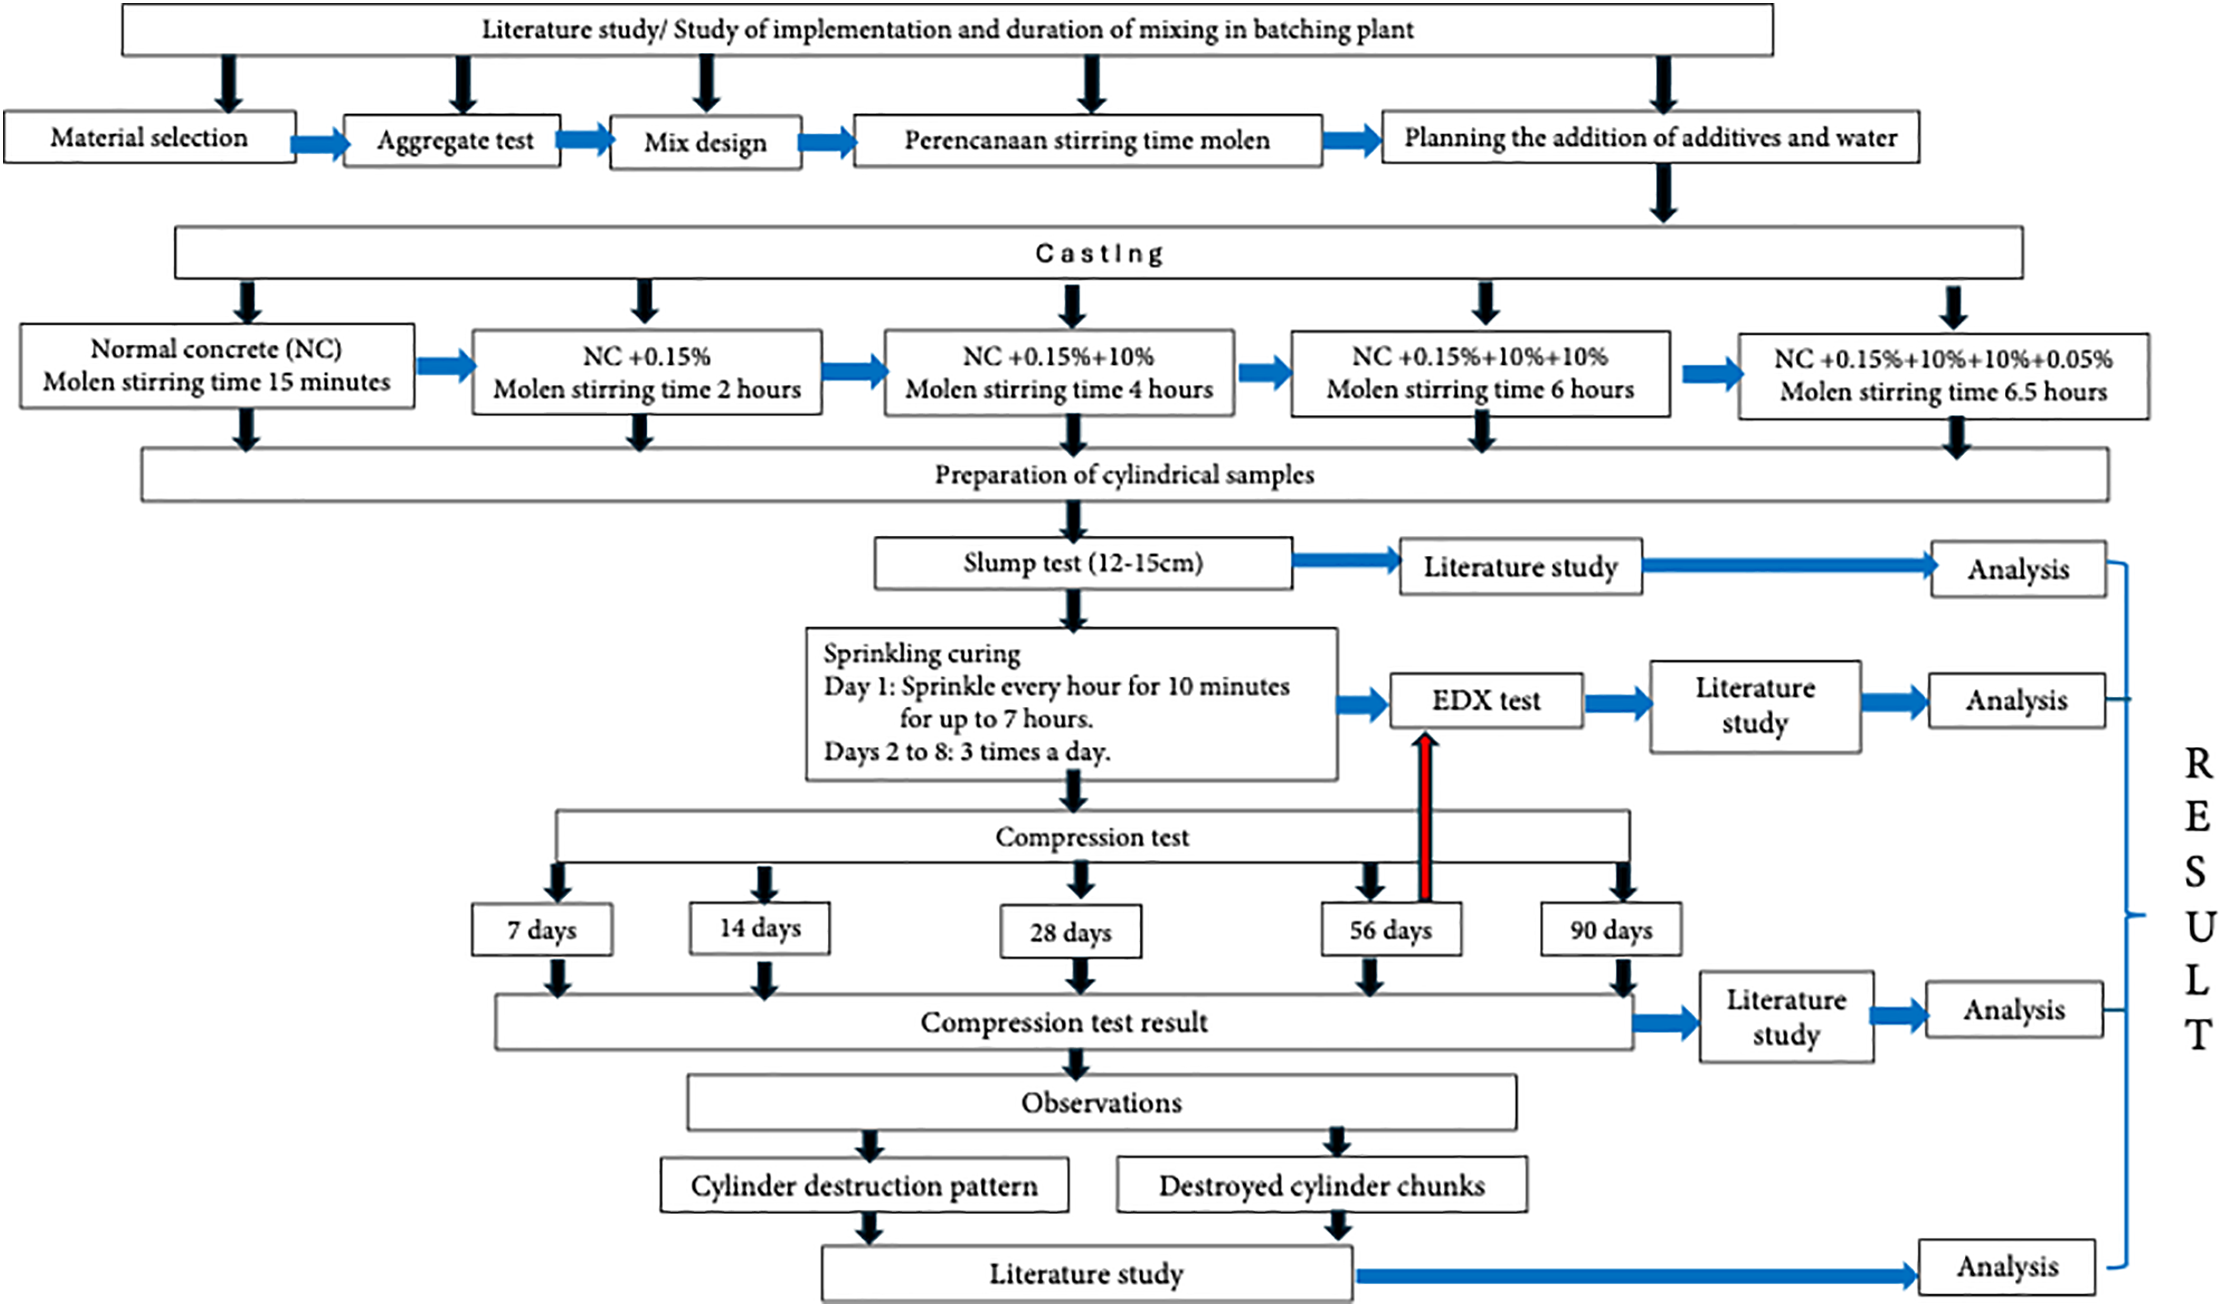
Figure 2: Research flowchart
Based on the mixing system described in Table 2, variations in the water-to-cement ratio (w/c) and slump values were observed. The results are illustrated in Fig. 3.
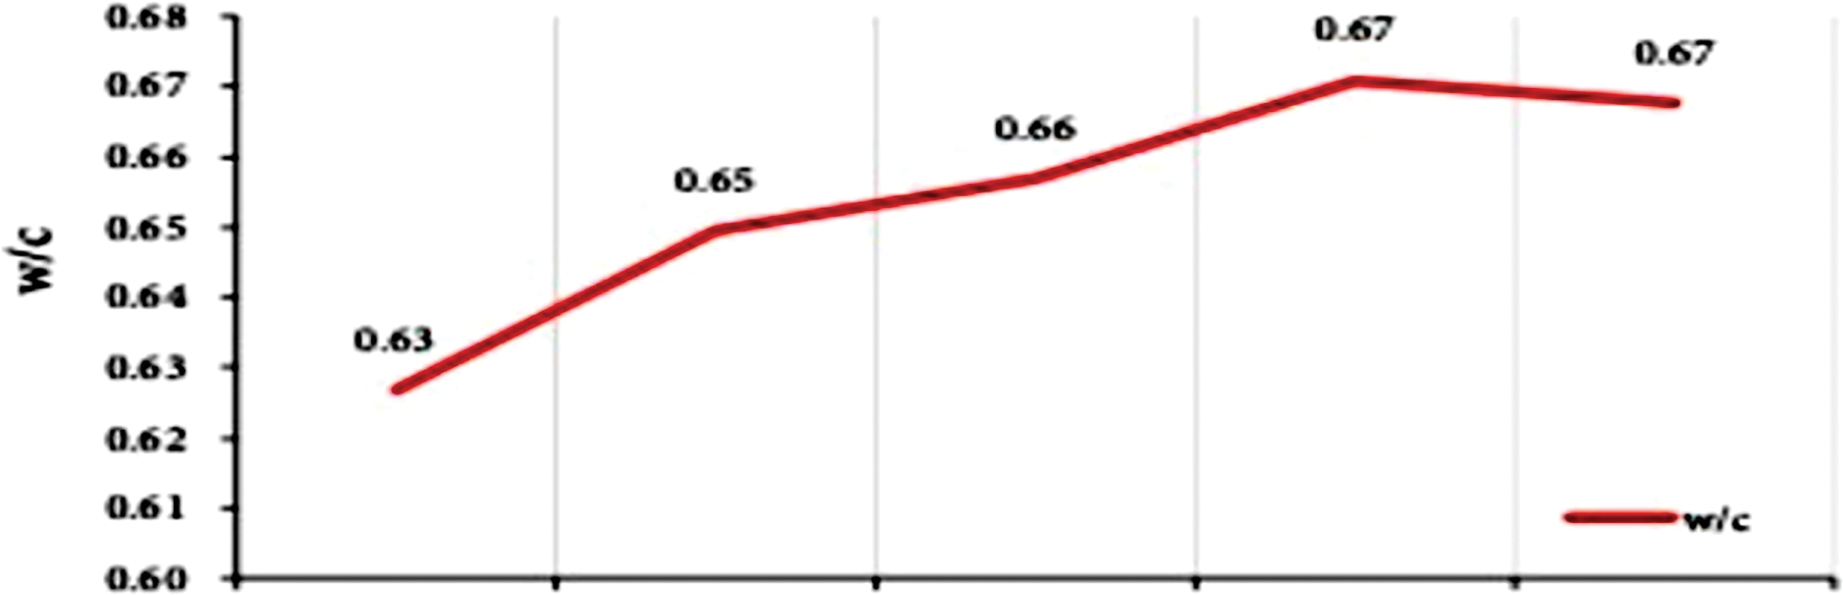
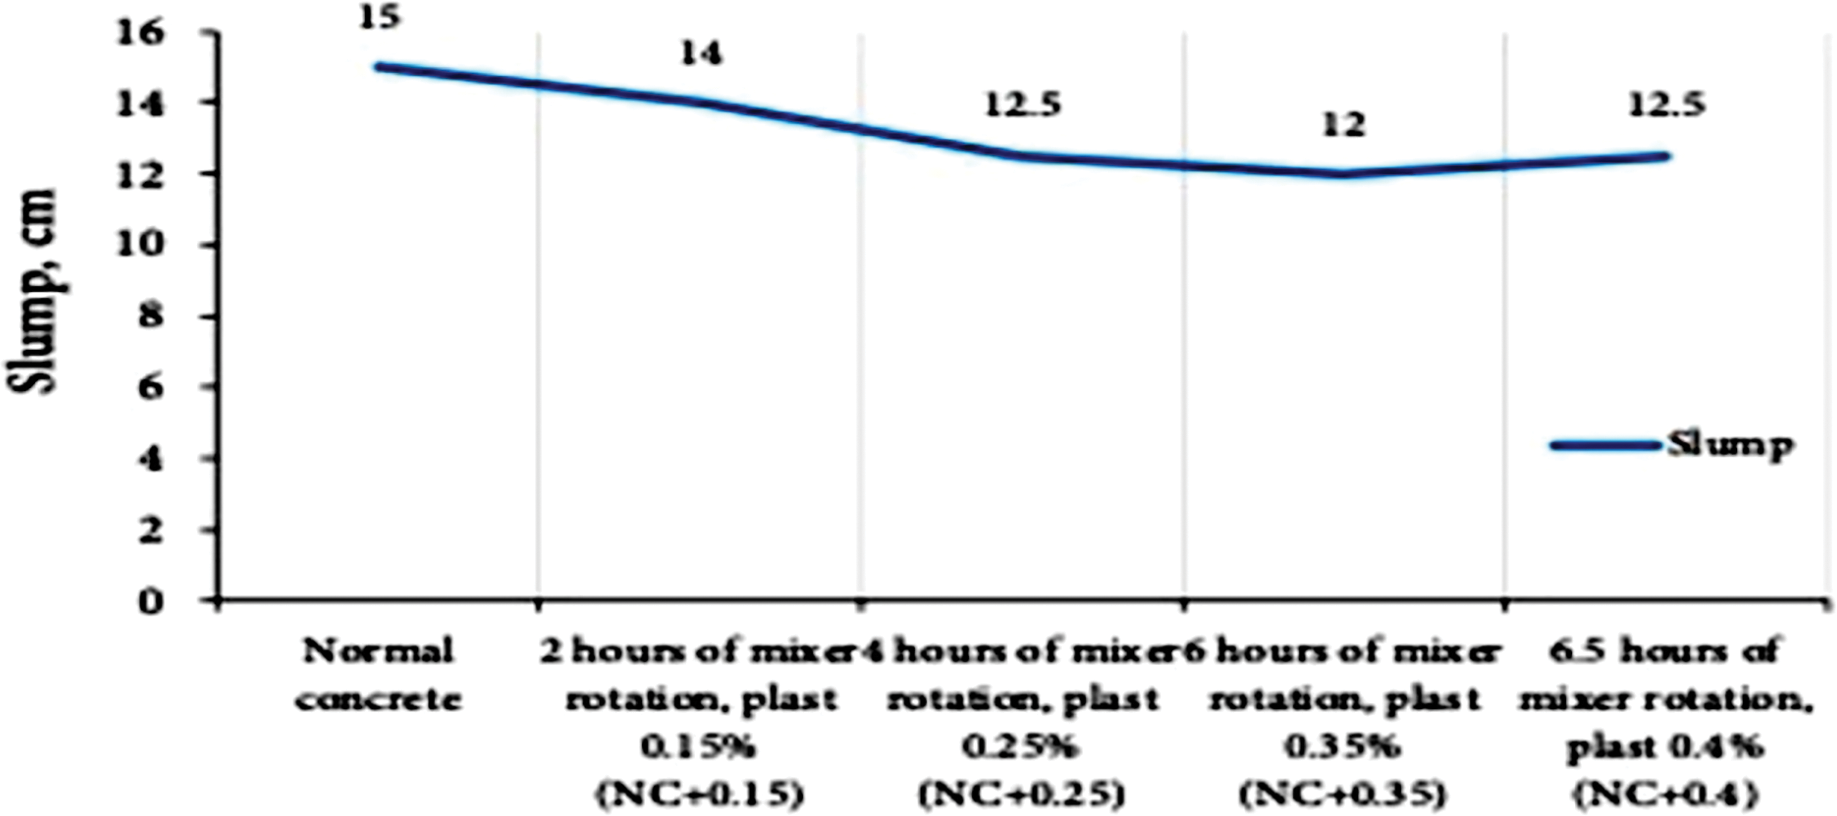
Figure 3: Variation of water-to-cement ratio (w/c) and slump
The addition of Plastiment 83 AM and water, combined with increased mixing duration, influenced the slump value. As shown in Fig. 3, the resulting slump values met the requirements for fresh concrete to be properly placed and compacted.
The effects of Plastiment 83 AM dosage and mixing duration on the initial setting time and compressive strength of the concrete at 24 h are presented in Figs. 4 and 5.
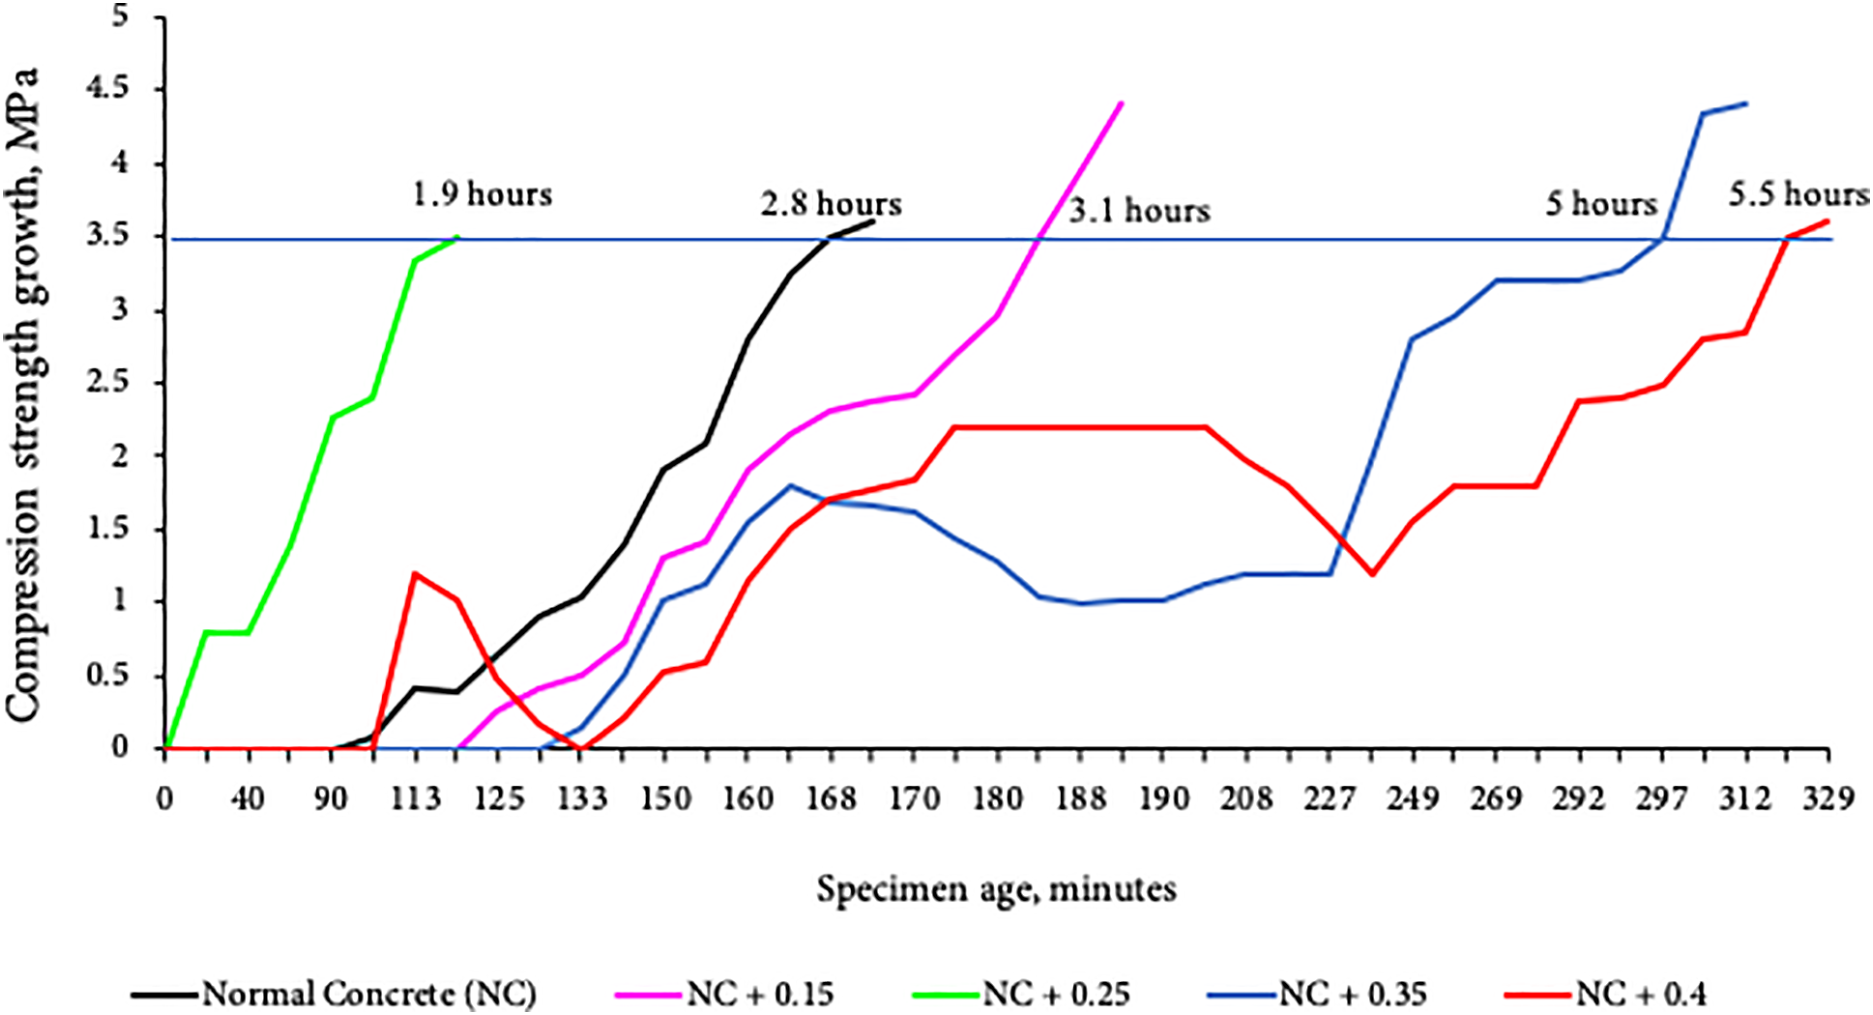
Figure 4: Initial hardening time of concrete mixtures
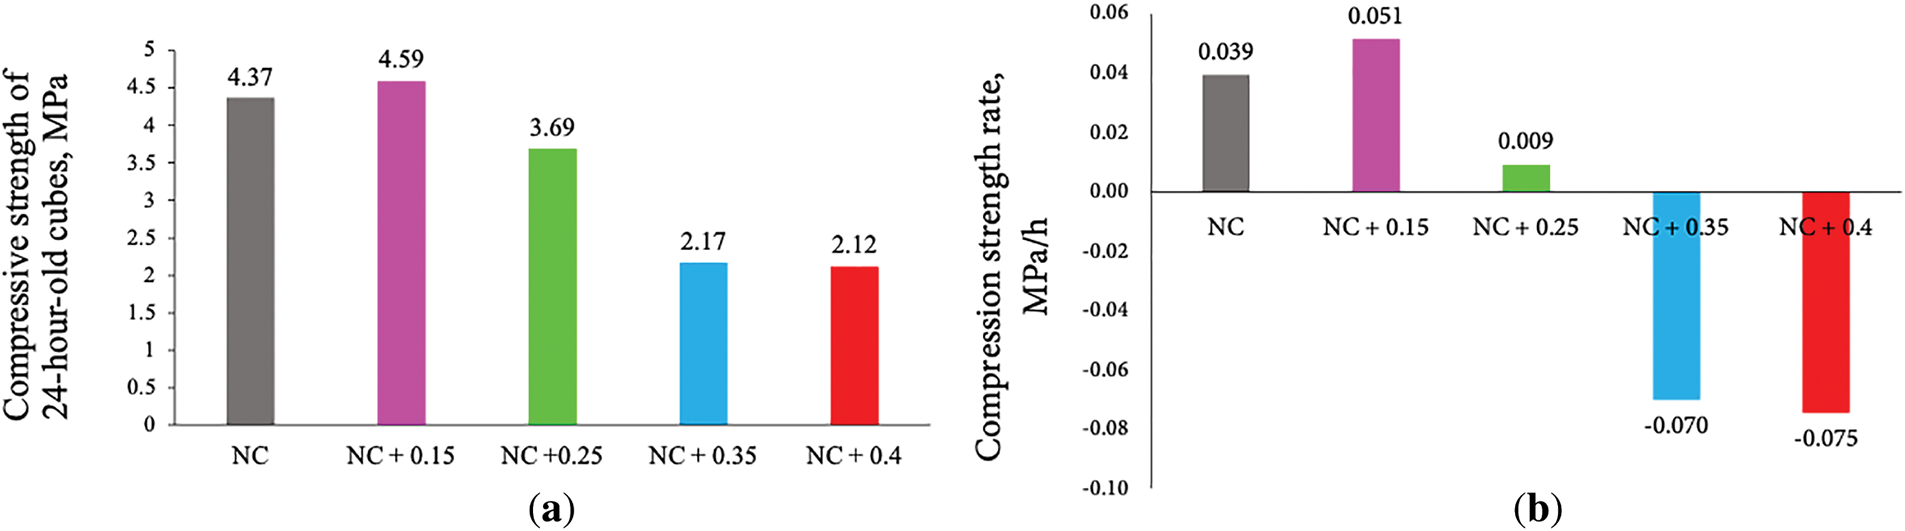
Figure 5: (a) Compressive strength of concrete at 24-h setting time, (b) Growth rate of compressive strength from initial setting to 24 h
Concrete should be poured before reaching the initial hardening time, allowing at least 30 min for placement. A relatively linear increase in compressive strength was observed for NC, NC + 0.15, and NC + 0.25 mixtures. However, mixtures containing 0.35% and 0.40% Plastiment exhibited irregular increases in compressive strength. In some cases, the strength decreased before increasing again (Fig. 4). This indicates that excessive additive dosage and prolonged mixing can weaken the bond structure temporarily due to disruption of the hydration process.
At NC + 0.35 and NC + 0.4, where Plastiment 83AM was added with mixing times of 6 and 6.5 h respectively, the compressive strength became complex with the formation of several folds (Fig. 4). This phenomenon occurred for approximately 220 min. This means that the addition of Plastiment 83AM and the mixing time indicate a change in the reaction pathway. The reaction proceeds with the formation of several transient products that disappear immediately.
The compressive strength of cube specimens at 24 h for mixtures containing 0.35% and 0.40% Plastiment (with mixing durations of 6 and 6.5 h) decreased to approximately 3.5 MPa, equivalent to the initial setting strength (Fig. 5a). Consequently, the growth rate of compressive strength in these mixtures became negative (Fig. 5b). The highest compressive strength and growth rate were obtained in the NC + 0.15 mixture, indicating that this dosage achieved the most effective hydration and early-age strength development.
3.1.3 Compressive Strength Development
The compressive strength development of concrete with various additive dosages and mixing durations is shown in Fig. 6.
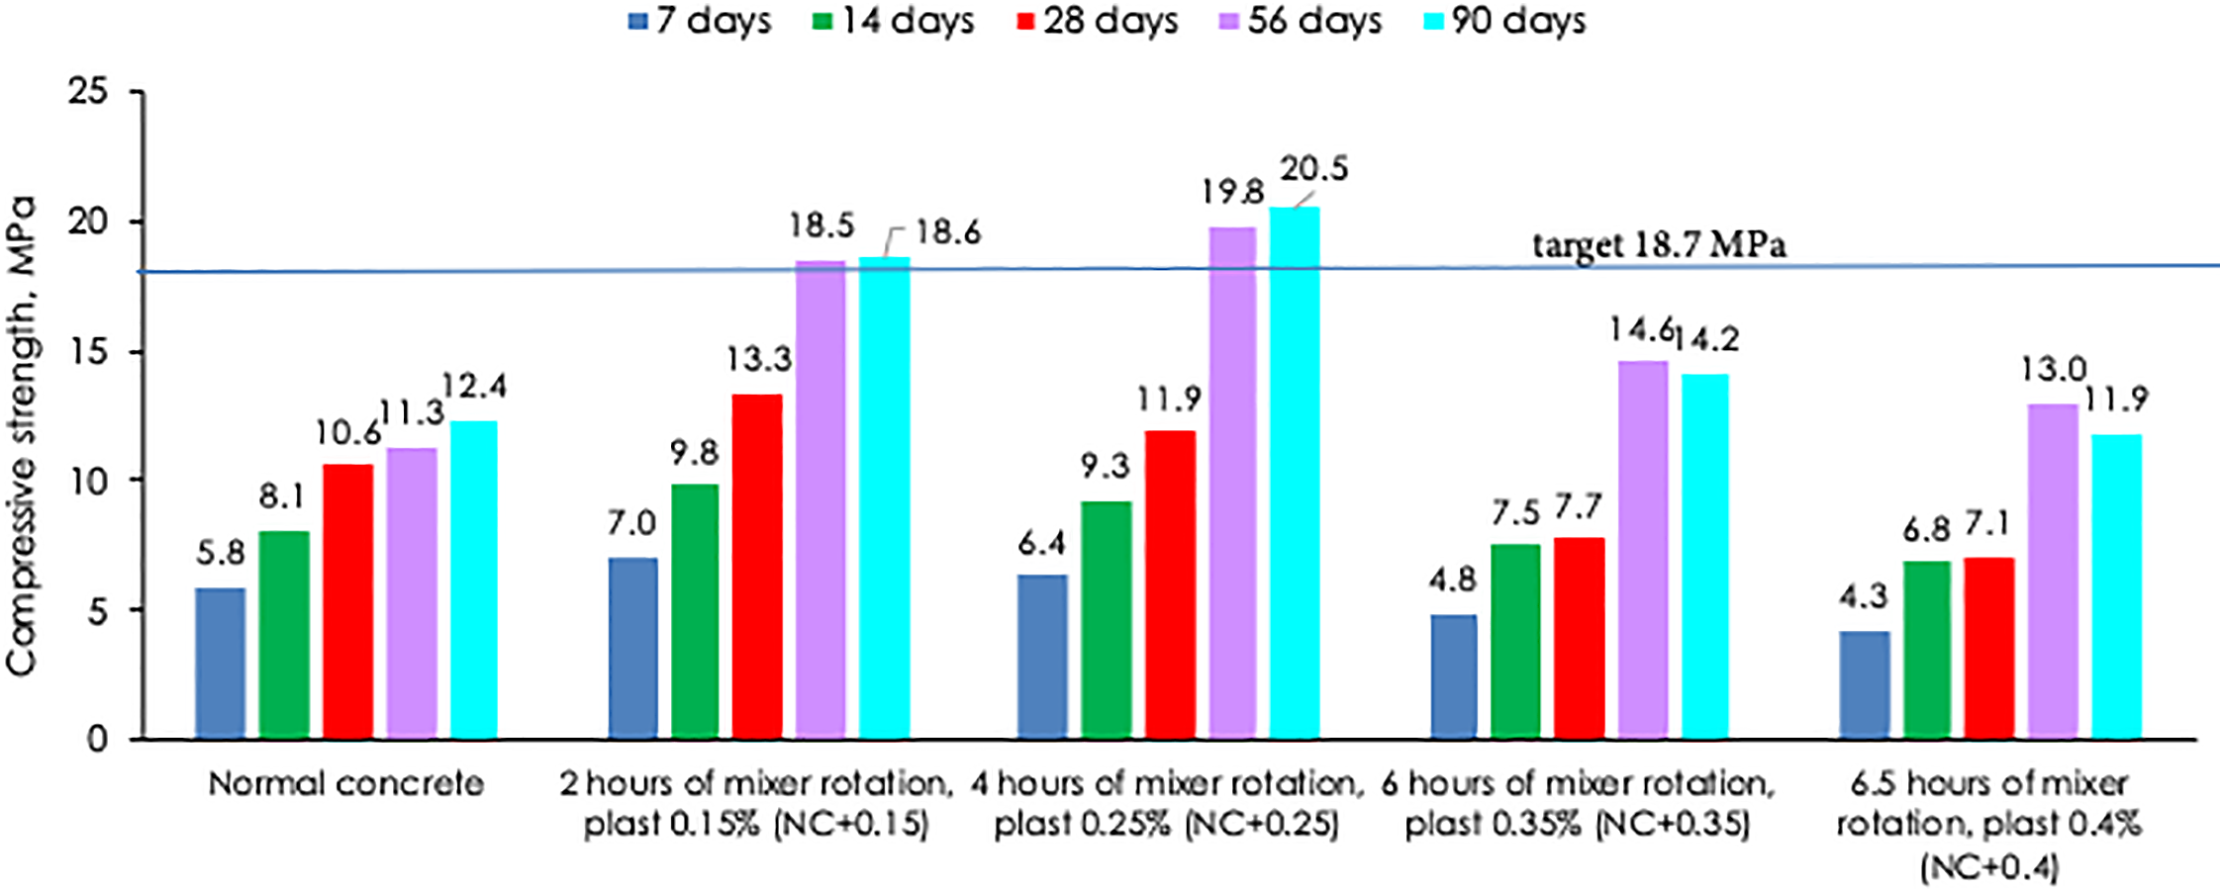
Figure 6: Compressive strength of concrete at different Plastiment 83 AM dosages and mixing durations
Compressive Strength
Validation
To ensure data validity, the compressive strength results were analyzed using the Dixon outlier test and Analysis of Variance (ANOVA) at a 10% significance level.
ANOVA
To determine the degree of difference between group means compared to random variations within the data, a Repeated Measures ANOVA was applied. The mean compressive strength for each age group was used to calculate between-treatment variance, while variations among samples within each group were used to determine the error variance.
The results are presented in Table 3.
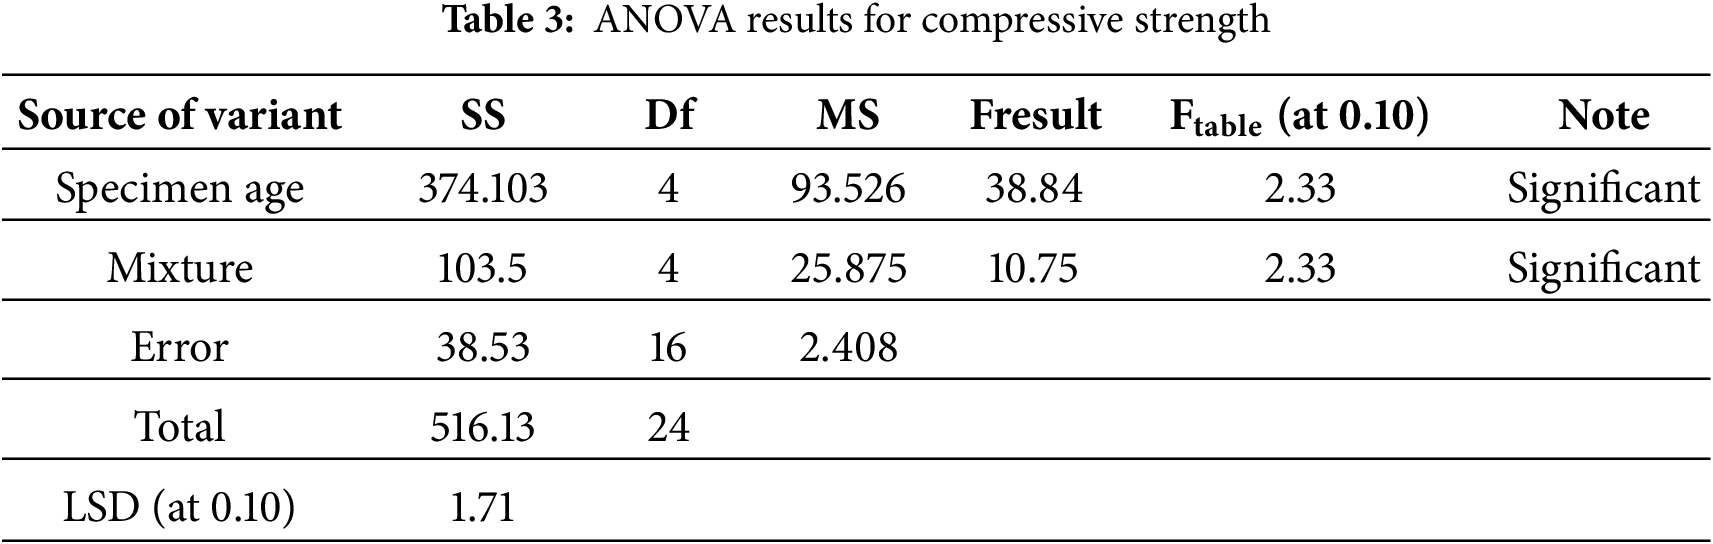
The ANOVA results show that both specimen age (F = 38.84) and mixture composition (F = 10.75) have F-values greater than the critical value (Ftable = 2.33) at a 10% significance level. Therefore, both variables significantly influence the compressive strength of concrete.
Dixon Criteria
Outlier detection was conducted using the Dixon test, as shown in Fig. 7a–e. Any data points exceeding the significance threshold were excluded from further analysis.
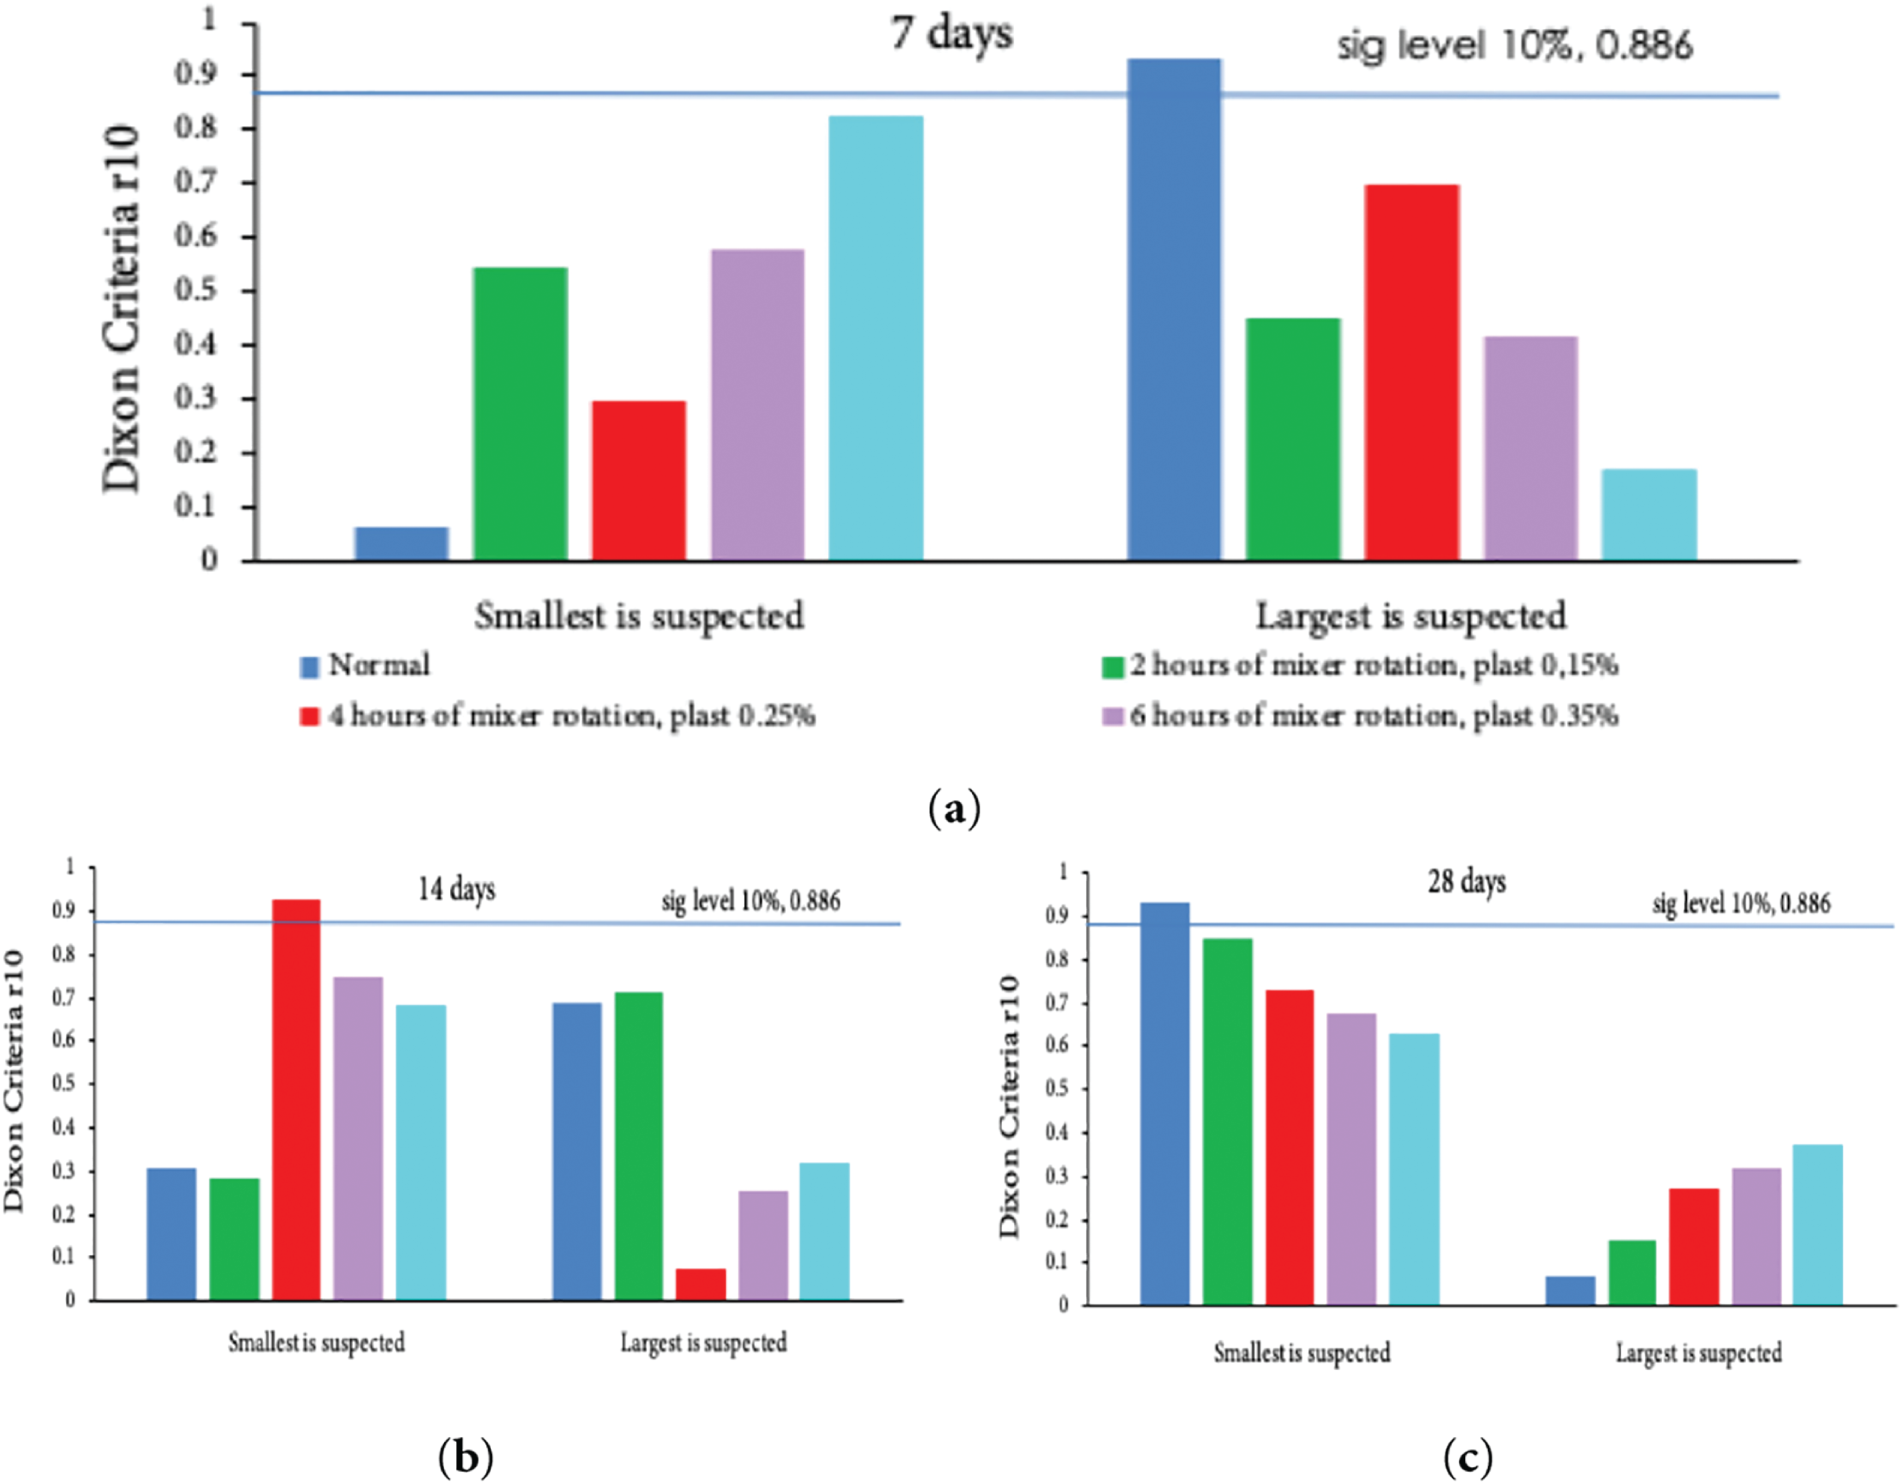
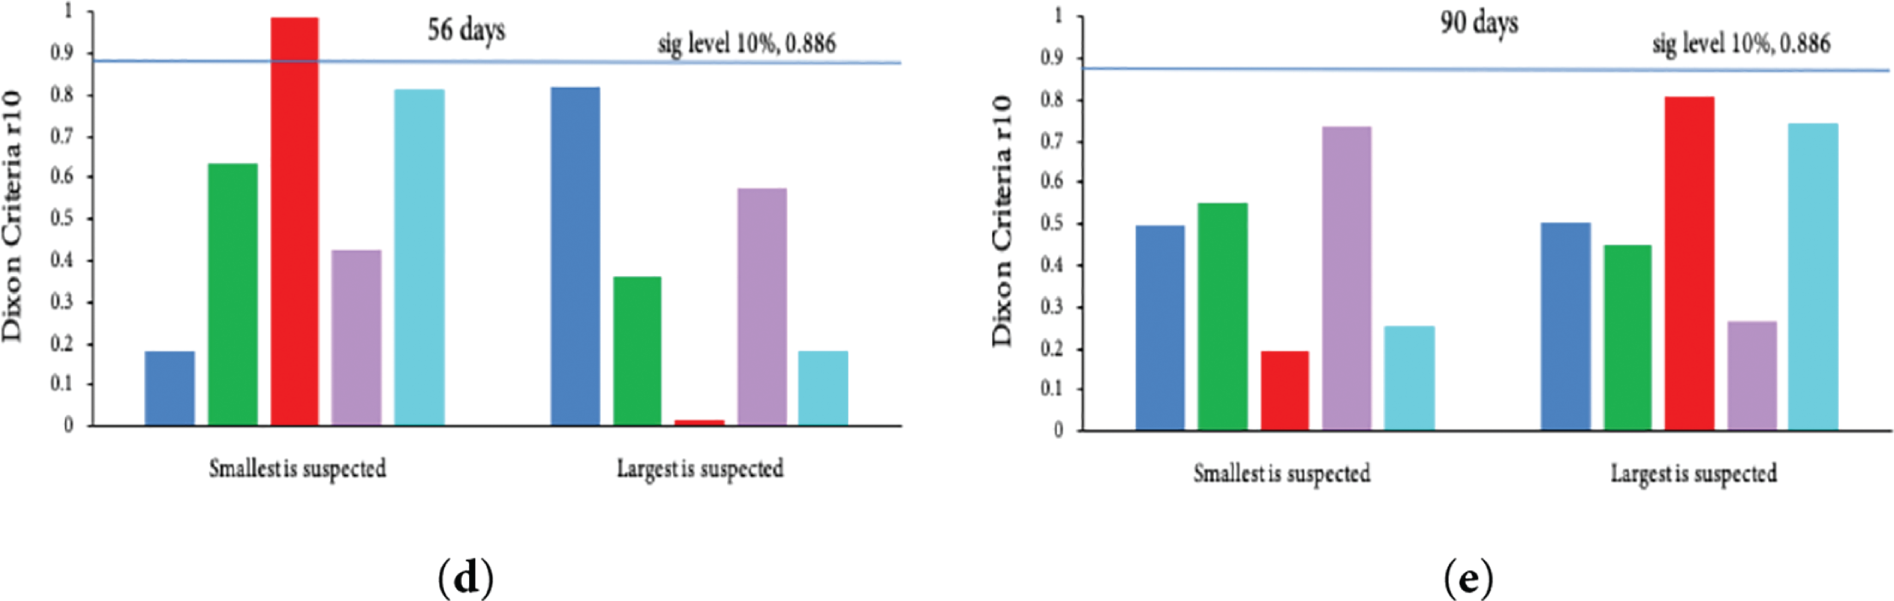
Figure 7: Dixon outlier test results for compressive strength at various ages: (a) 7 days, (b) 14 days, (c) 28 days, (d) 56 days, (e) 90 days
From Fig. 7, outliers were identified in the following data sets: 7-day NC mixture, 0.25% additive with 4-h mixing duration at 14 and 56 days, and 28-day NC mixture.
Compressive strength values used in subsequent analyses were the averages of the remaining valid data after excluding these outliers.
3.1.4 Energy Dispersion X-Ray (EDX)
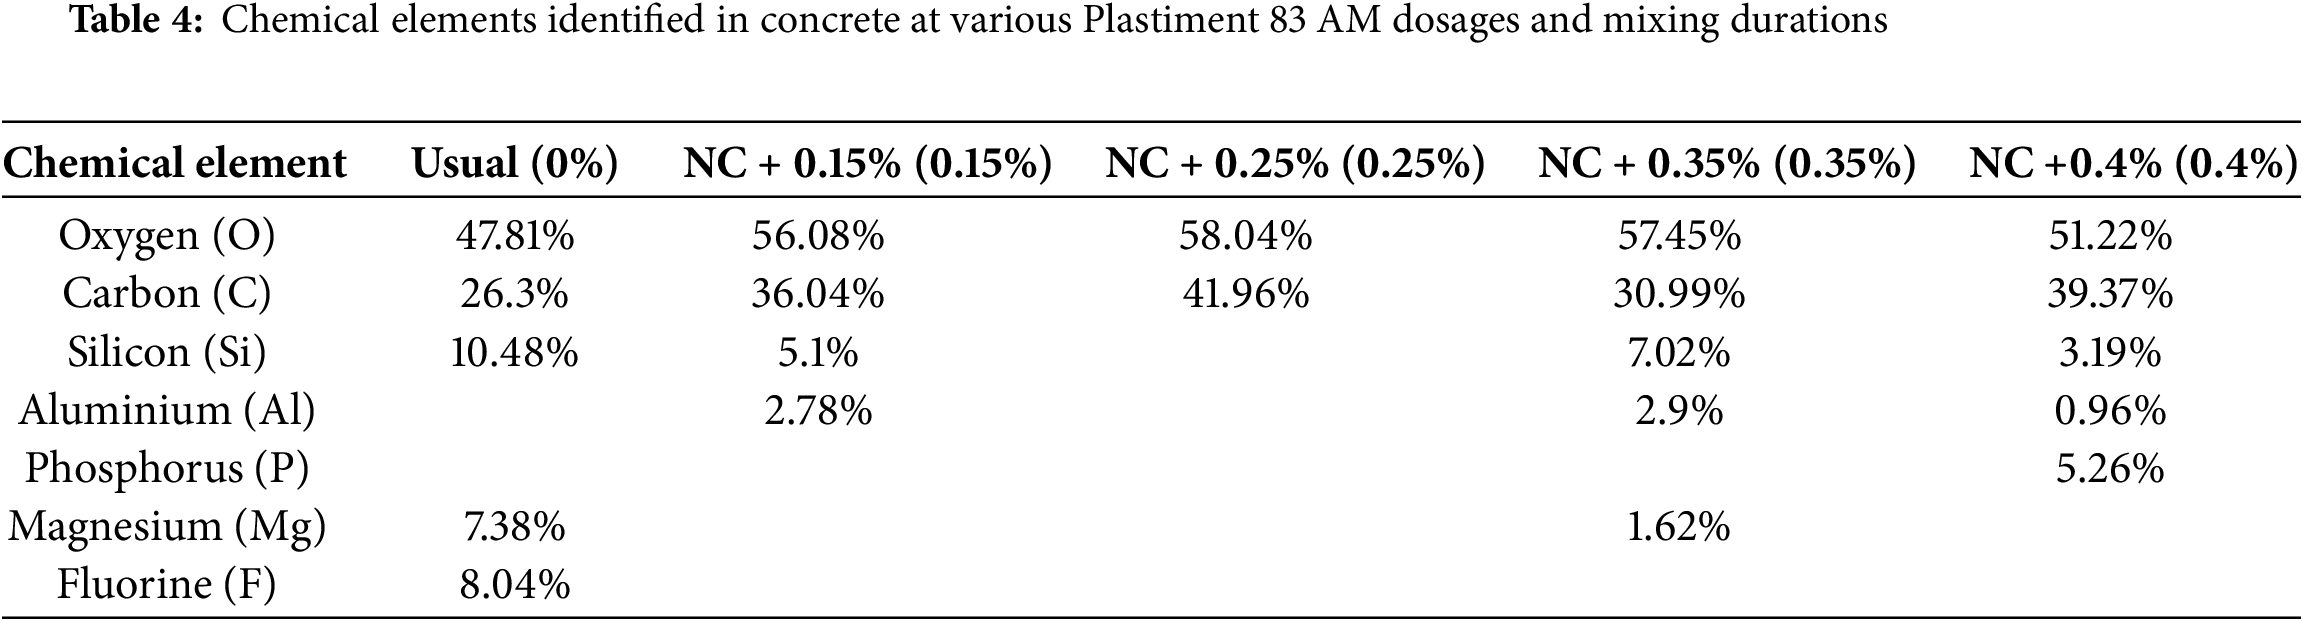
The EDX test identified the elemental composition of concrete samples with different Plastiment 83 AM dosages and mixing durations. The detected elements and their respective percentages are presented in Table 4.
This section discusses the experimental findings related to slump, water-to-cement ratio (w/c), compressive strength, and EDX results. The discussion focuses on hydration and pozzolanic reactions, the influence of detected chemical elements on concrete durability, and the interrelationship between failure patterns, workability, and chemical composition.3.2.1 Slump and Water-to-Cement Ratio (w/c)
To ensure proper placement, the slump value of concrete at the casting site should range from 12–15 cm. This value is slightly higher than the limit specified in and [38], but still within the acceptable range for ready-mix concrete, as slump can be adjusted according to field requirements. Achieving this slump range required the addition of Plastiment 83 AM and, in practice, supplemental water. The additive and water dosages presented in Table 2 can be considered optimal, as they produce slump values that meet field placement requirements (Fig. 3). Moreover, this range complies with [41], as the slump remains below the maximum permissible value of 200 mm.
As shown in Fig. 3, although the w/c ratio increased slightly with additive additive, the slump did not fully return to its initial level. This indicates that the mixture gradually became stiffer, signifying reduced workability despite a higher moisture content—likely due to partial hydration and early gel formation, which affected the flowability.
Plastiment 83 AM is known to control temperature rise and minimize thermal cracking by slowing down the hydration reaction and reducing the heat of hydration. This effect is evident from the hydration rate curve, where the highest rate of heat generation and the fastest initial setting occur in the NC + 0.25 mixture (Fig. 4). However, after reaching its peak, the hydration rate decreases sharply to the lowest level (Fig. 5b).
The development of compressive strength up to the initial setting stage for the NC + 0.35 and NC + 0.4 mixtures shows irregular behavior, indicating fluctuating hydration heat. The growth of penetration strength, which represents the formation of bonds, can drop significantly—even to zero—indicating a loss of previously formed bonds (Fig. 4). This suggests that the hydration reaction was inhibited during the first 24 h, as reflected by the decrease in compressive strength within that period (Fig. 4). When correlated with long-term strength development (Fig. 6), both mixtures also exhibited a reduction in compressive strength from 56 to 90 days.
Among all mixtures, NC + 0.25 initiated hydration the earliest, with a relatively high hydration rate (Fig. 4). This condition requires rapid on-site handling to protect the fresh concrete from moisture loss due to wind or evaporation, so that shrinkage deformation can still be accommodated by the plastic concrete without cracking. In contrast, the NC + 0.35 and NC + 0.4 mixtures remained in a plastic state for a longer period (Fig. 4), allowing expansion and shrinkage to occur without early bond failure. However, these mixtures should be avoided due to their reduced early-age strength at 24 h (Fig. 5a,b) compared to the initial strength.
A relationship was observed between the 24-h compressive strength (Fig. 5a), the rate of strength development from the initial setting to 24 h (Fig. 5b), and the overall compressive strength development between 7 and 90 days (Fig. 6). A high 24-h compressive strength (Fig. 5a) and a positive strength growth rate (Fig. 5b) indicate good long-term strength development, while a negative growth rate (Fig. 5b) corresponds to stagnant or declining compressive strength (Fig. 6).
The mixing process should begin once all materials are completely loaded into the mixer. The speed and duration of mixing significantly affect the compressive strength and thermal conductivity of lightweight and ultra-lightweight concrete, primarily due to entrapped air that alters density [42]. During mixing, there is a risk of forming clumps. If these clumps are not evenly dispersed, the resulting concrete becomes non-homogeneous, leading to reduced strength. Non-uniform SiO2 particle size distribution is also associated with such clumping [43]. To avoid this, mixing should be performed at a minimum speed of 60 rpm for at least 15 s. At speeds below 50 rpm, both the duration and intensity of mixing should be increased. In this study, the mixer was operated at 20–30 rpm for prolonged durations of 15 min, 2, 4, 6, and 6.5 h (Table 2).
The workability of fresh Portland cement concrete cannot be fully evaluated during mixing; however, changes in mixing power can indicate the optimum condition of the mixture. The lowest point—or second trough—of the mixing power vs. time curve corresponds to the optimal workability when using a plasticizer. According to [5], lower rotational speeds require longer mixing times but generally produce higher compressive strength values even when slump decreases. At medium-speed mixing, compressive strength initially increases and then decreases, while slump continuously declines. At higher speeds, both compressive strength and slump drop significantly over time [5]. Ready-mix concrete typically performs best when mixed for a longer duration at controlled speeds [44]. Because the mixing speed in this study was within the medium–high range, compressive strength increased initially and then decreased—particularly after 6 and 6.5 h of mixing (Fig. 6). This indicates that prolonged mixing durations should be avoided. The most effective mixing duration in this study was 4 h at 20–30 rpm, which resulted in optimal compressive strength development up to 90 days (Fig. 6).
A six-month compressive strength test should also be conducted. As stated in [19], if the compressive strength after six months does not reach at least 100% of the reference strength, the temporary conformity of the mixture must be revoked, and all users of the mixture must be notified.
3.2.3 Hydration and Pozzolanic Reaction
Portland Composite Cement (PCC) contains inorganic materials such as pozzolans [45]. Pozzolans typically consist of at least 25% SiO2, reactive Al2O3, and small amounts of Fe2O3 and other oxides. Pozzolanic activity refers to the chemical reaction between the reactive components of pozzolan, calcium hydroxide (CH), and water [46]. CH itself is a hydration product of cement. The relevant hydration reactions that generate CH are shown in Eqs. (1)–(6) [47].
The complete conversion of C3S and C2S into semi-crystalline C–S–H gels usually occurs within several weeks to about a month [48]. A decrease in compressive strength at 28 days suggests a disruption in C–S–H formation. In this study, the 6-h and 6.5-h mixing durations resulted in very low increases in compressive strength (Fig. 6), indicating impaired C–S–H development. The hydration of C3S and C2S also produces excess CH, which must be consumed in secondary reactions [48]. The pozzolanic reaction occurs when amorphous SiO2 and reactive Al2O3 combine with CH to form additional C–S–H and C–A–H gels, as shown in Eqs. (7) and (8).
These reactions demonstrate that pozzolanic materials interact with CH, reducing its content and improving the concrete’s durability. The secondary C–S–H formed through these reactions fills the pores left after primary hydration. Due to the heterogeneous nature of pozzolanic materials and the complex hydration mechanisms involved, it is not possible to establish a precise model of pozzolanic activity. Only general effects can be identified [48], such as producing denser, stronger, less permeable, and more durable concrete.
3.2.4 Hydration and Pozzolanic Reactions, Mixer Rotation, and Additives
Hydration, pozzolanic, and additive reactions occur simultaneously during the mixing and rotation processes, as shown in Table 2. The increase in chemical reaction rates can reduce rotational velocity due to factors such as fluid dynamics, molecular interactions, and higher momentum diffusivity [49]. In Maxwell dielectric nanofluids, fluid movements induced by electric field interactions can initiate chemical reactions that degrade dielectric stability, while rotational motion enhances stress relaxation in anisotropic porous media [50].
The results indicate that prolonged mixing durations (6 and 6.5 h) caused a significant reduction in compressive strength at 56 and 90 days (Fig. 6), suggesting high susceptibility to long-term degradation. This degradation is associated with the release of Mg and Al at 6 h, and Al and P (phosphorus) at 6.5 h (Table 4). These variations also exhibited severe failure patterns, confirming the adverse impact of overextended mixing on the structural integrity of concrete.
3.2.5 EDX and the Influence of Chemical Elements on Concrete
Variations in elemental composition may result from differences in admixture dosage, as supported by previous studies. Concrete mixtures incorporating superplasticizers often experience a temporary reduction in compressive strength before reaching their maximum strength at the optimum curing time. The rate of strength development largely depends on the type and dosage of the additive used [51]. Continuous mixing tends to produce only slight increases in compressive strength compared to intermittent mixing [52].
Excessive mixing duration or improper rotational speed can disturb the bonds among certain elements, allowing them to migrate within the concrete matrix. This alteration changes the microstructure of the concrete, thereby influencing its physical and mechanical properties [53]. If the mobilized elements are detrimental, they can significantly weaken the matrix and reduce durability. The main elements identified through the EDX analysis (Table 4), along with their influence on concrete performance, are discussed below.
All concrete variations contained oxygen and carbon as the dominant elements (Table 4). Oxygen levels remained relatively stable regardless of additive content or mixing duration. In contrast, carbon content increased with longer mixing durations, though not in a strictly linear pattern (Table 4). These elements can react to form carbon dioxide (CO2). Carbonation occurs when CO2 reacts with calcium hydroxide (CH) in the concrete to produce calcium carbonate (CaCO3). This reaction depletes calcium from the C–S–H phase, weakening the concrete microstructure. Moreover, carbonation lowers the concrete’s alkalinity, accelerating corrosion of embedded steel reinforcement.
The carbonation process requires moisture, as CO2 dissolves in water to form carbonic acid (H2CO3) [54]. Given Indonesia’s high average humidity (approximately 72%) [55], moisture-laden air easily penetrates the concrete, accelerating carbonation. Therefore, providing adequate surface protection—such as curing blankets or sealants—is essential for maintaining durability, especially in humid environments.
Silicon
The formation of liquid iron–silicon (Fe–Si) complexes with high mobility can inhibit the hydration of cement. The concentration of silicon in the cement matrix plays a crucial role in this process. Among the mixtures tested, silicon was absent in NC + 0.25%, suggesting that this composition is potentially less susceptible to hydration retardation caused by Fe–Si complexation.
Silicon and Fluorine
Fluorine chains bonded to silicon atoms can form a hydrophobic barrier through silanization, enhancing resistance to water penetration and reducing water absorption by up to 96% [56]. Silicon and fluorine were detected in the NC mixture, contributing to improved impermeability and reduced air infiltration. As a result, carbonation occurred at the slowest rate in this mixture.
Certain salt-based additives are fluorinated inorganic compounds. When used in small quantities (0.01%–0.011% by weight of concrete), these additives can increase compressive strength by more than 30% compared to conventional mixtures However, the NC mixture in this study contained 8.04% fluorine (Table 4), which far exceeds this optimal range. Consequently, although early-age compressive strength increased, the 90-day strength did not reach the desired target (Fig. 6).
Aluminum
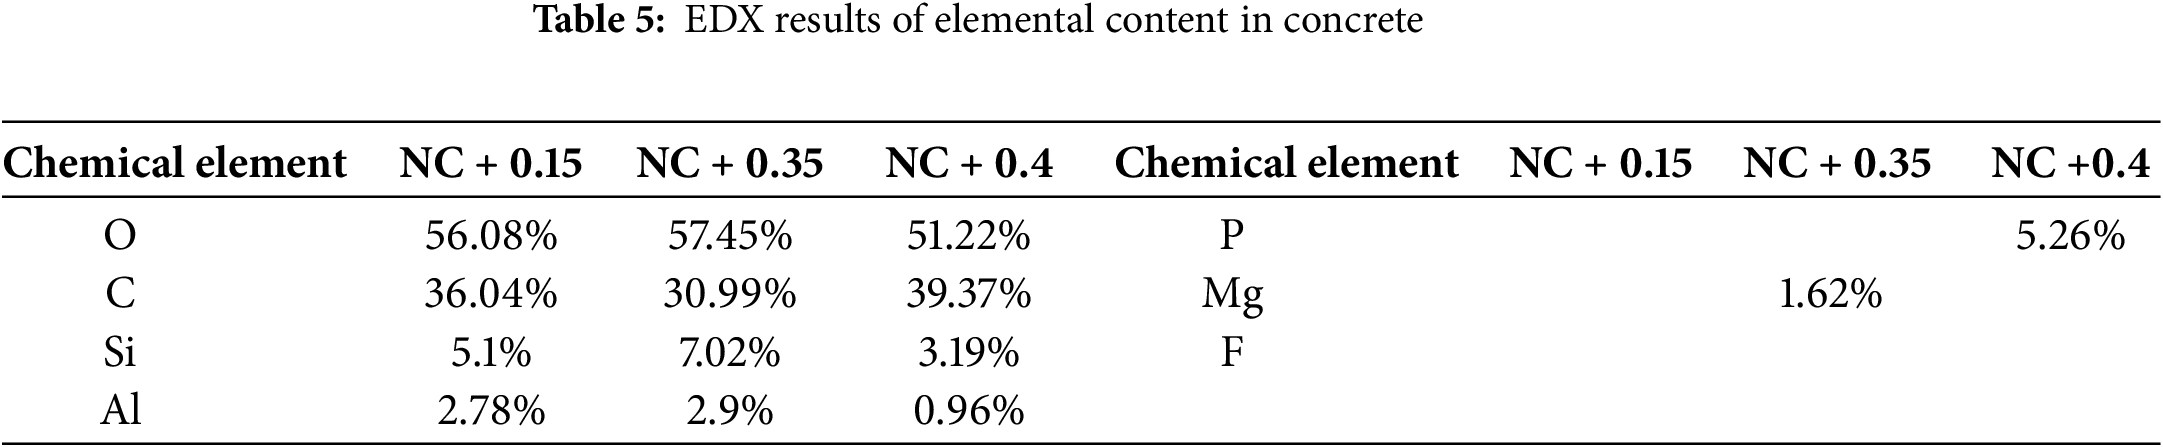
The addition of 0.6% aluminum powder to mortar reduces density by up to 50% (to below 1000 kg/m3), compressive strength by 58%, modulus of elasticity by 52%, and tensile strength by 44% [57]. In this study, aluminum was identified in mixtures NC + 0.15 (2.78%), NC + 0.35 (2.9%), and NC + 0.4 (0.96%) (Table 3); all exceeding the 0.6% threshold. Among these mixtures, only NC + 0.15 exhibited a slight increase in compressive strength between 56 and 90 days (0.1 MPa), while NC + 0.35 and NC + 0.4 showed stagnant strength development. This is most likely attributed to the adverse effects of aluminum.
Magnesium
Oxygen combines with magnesium to form magnesium oxide (MgO). MgO can react with silica fume to produce magnesium silicate hydrate (M–S–H) gel, which creates a shell-like structure with internal cavities [58]. However, since silica fume was not used in this study, M–S–H formation did not occur.
MgO provides potential benefits such as increased strength and dimensional stability. Nevertheless, magnesium ions from the surrounding environment can diffuse into the concrete and react with calcium on the surface of the silicate gel, resulting in calcium depletion in C–S–H and subsequent matrix instability [59]. Additionally, magnesium release promotes the precipitation of brucite (Mg(OH)2) within the cement paste. The growth of brucite crystals generates internal pressure; in extreme conditions, crystallization of brucite, gypsum, or halite can produce pressures exceeding 2000 atm (≈202.6 MPa), potentially causing significant expansion and structural failure in concrete [60].
Phosphorus and NC + 0.4%
Phosphorus and aluminum were detected in mixtures subjected to 6.5-h mixing durations (Table 4). This mixture exhibited the lowest compressive strength at all curing ages (Fig. 6). Although the pozzolanic reaction initially progressed well—indicated by the strength gain from 28 to 56 days—it was subsequently interrupted by competing hydration reactions. The compressive strength trend of NC + 0.35% was similar to that of NC + 0.4%, both influenced by aluminum, though at different interaction rates (Table 4). The reduction in strength from 56 to 90 days in NC + 0.35% was mainly caused by magnesium, while in NC + 0.4% it was dominated by phosphorus. The degradation caused by phosphorus was more severe than that caused by magnesium (Table 4).
Phosphorus does not naturally occur as a free element on Earth. Although its mineral composition is similar, variations in content can significantly alter microstructure and ettringite formation. Phosphorus reacts with calcium hydroxide (CH) to form calcium phosphate compounds such as hydroxyapatite (Ca5(PO4)3(OH)) or tricalcium phosphate (Ca3(PO4)2). Apatite allows substitution of calcium by various metal cations [61]. The replacement of calcium alters the Si/Ca ratio, destabilizing the silicate structure. This instability aligns with [62], who reported that higher P2O5 content decreases the mechanical strength but increases the workability of concrete. When P2O5 reaches 2.25% of the clinker mass, the cement fails to meet British Standard requirements [63]. The phosphorus content in NC + 0.4% was approximately 2.3 times higher than this limit, leading to severe deterioration (Table 4 and Fig. 6).
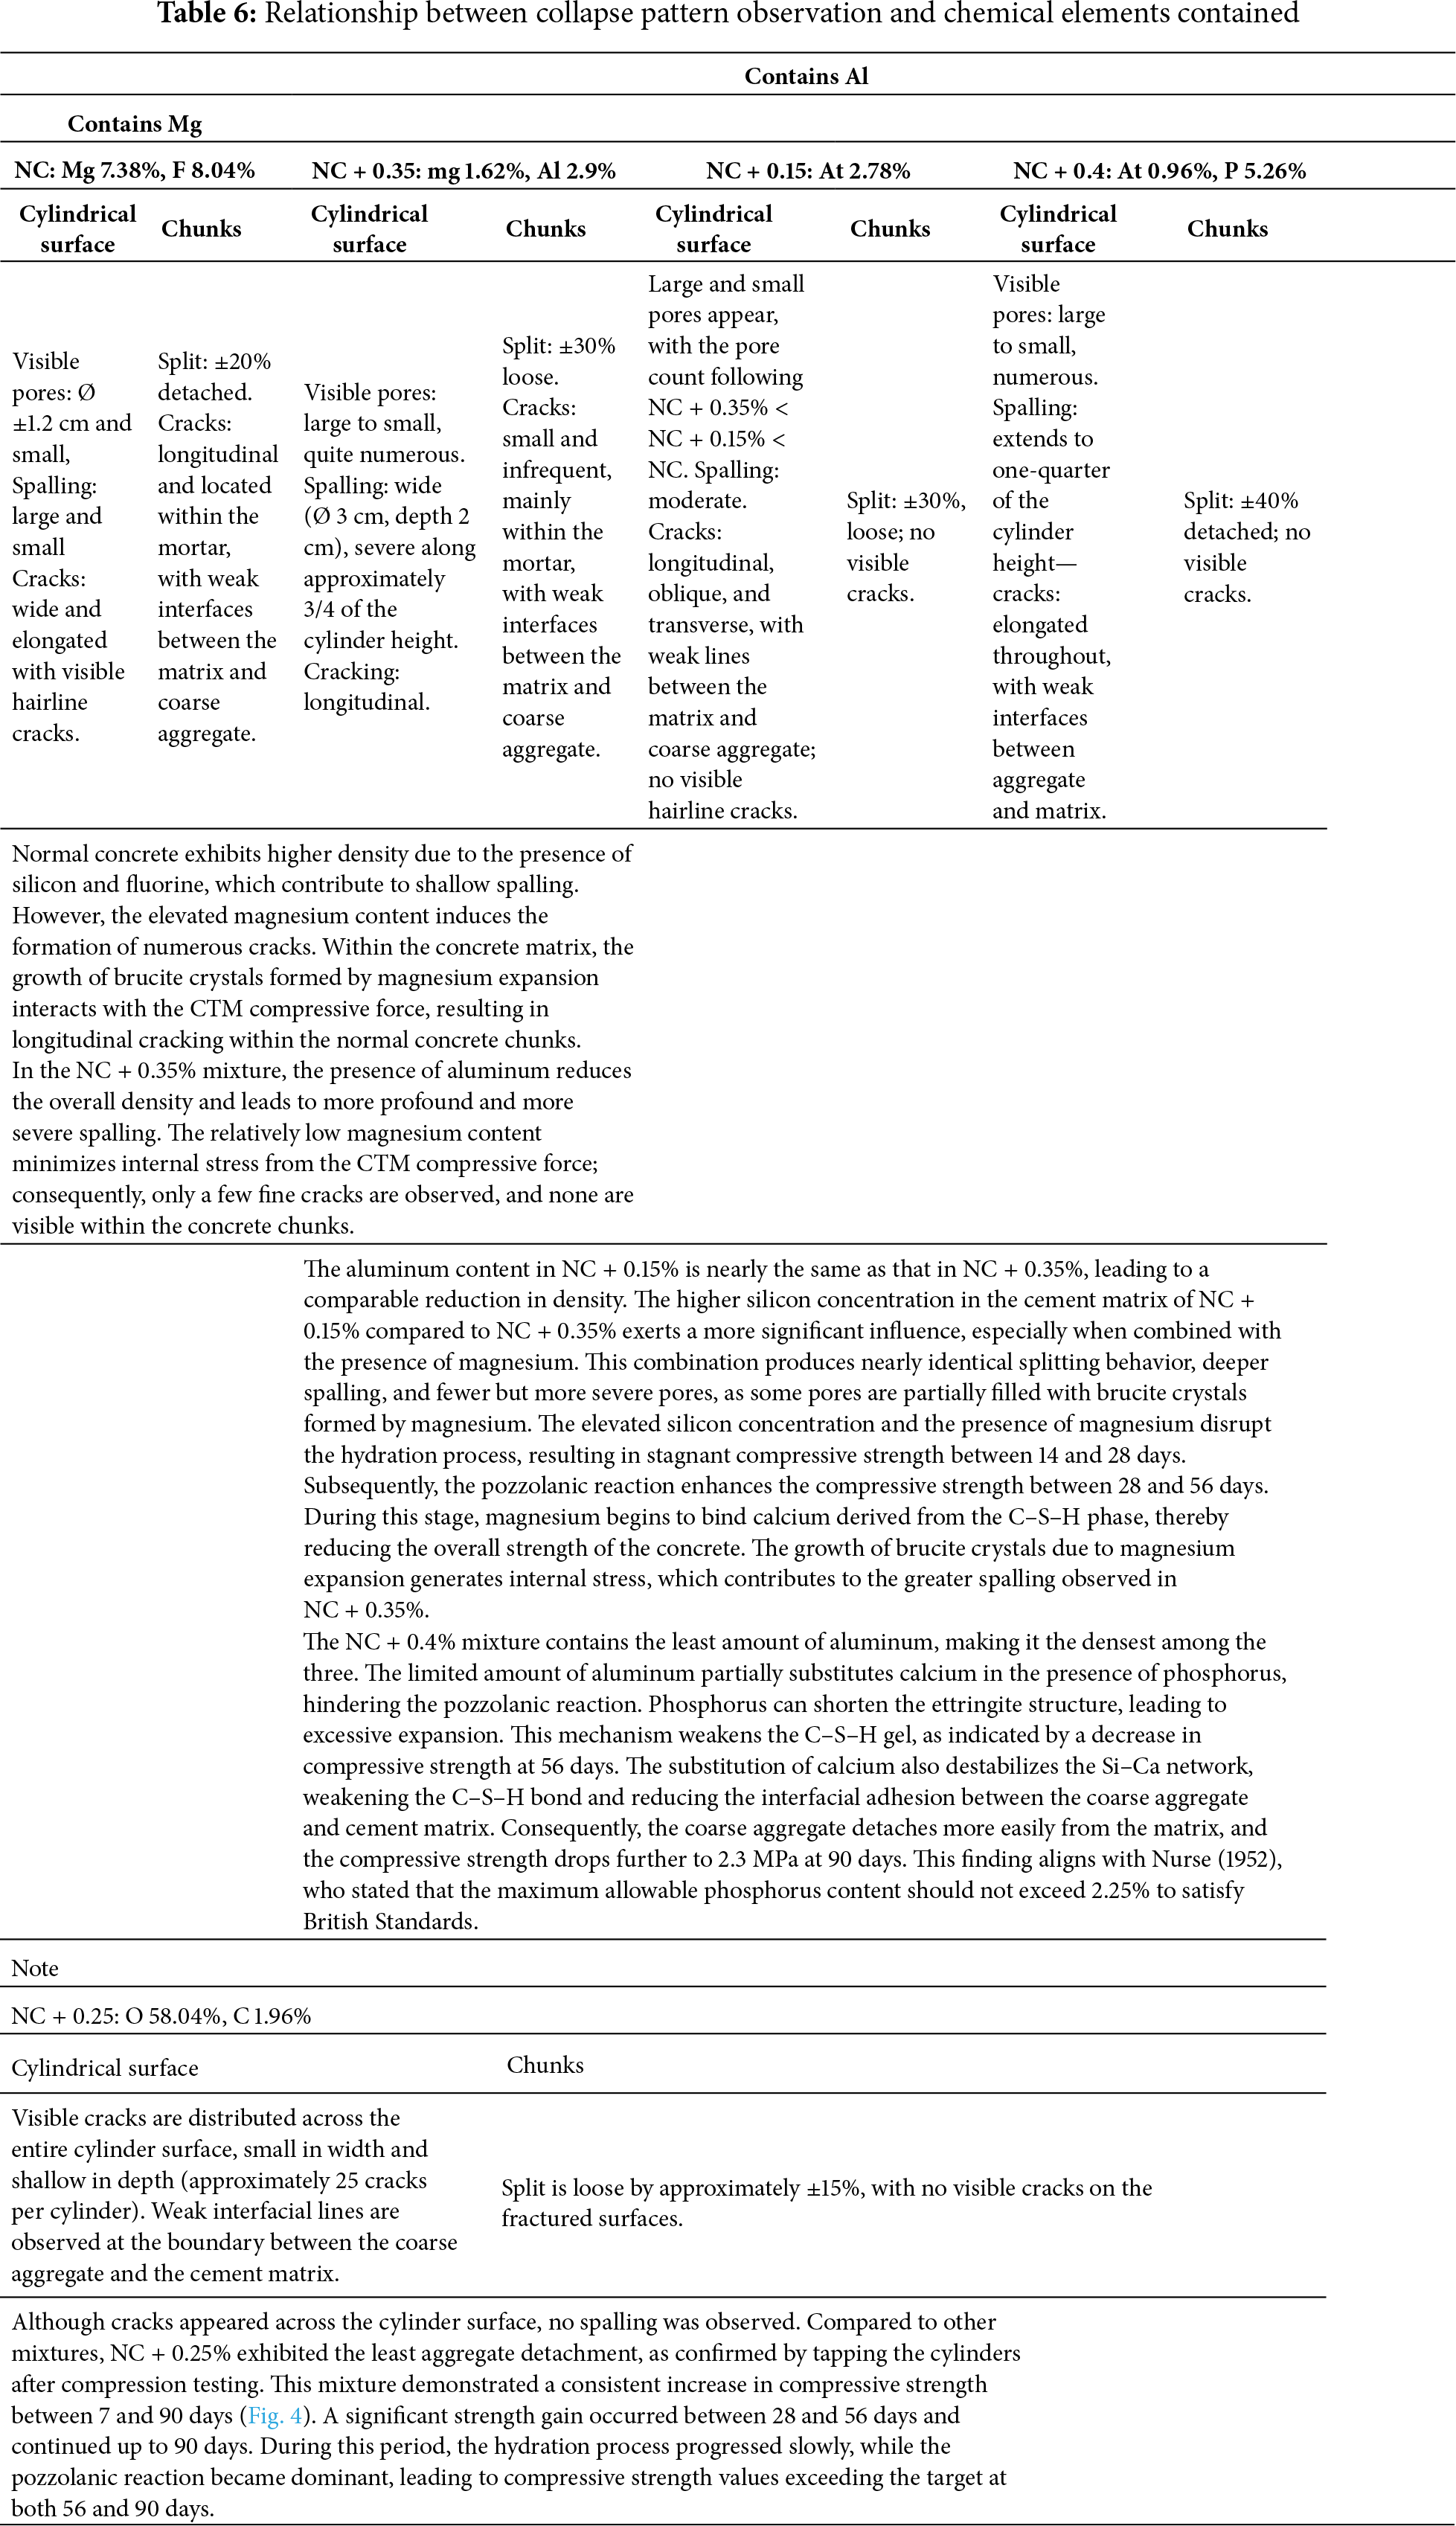
3.2.7 The Relationship between Collapse Patterns and Contained Chemical Elements
The correlation between the observed collapse patterns and the chemical elements contained in the concrete is illustrated in Figs. 8–10.
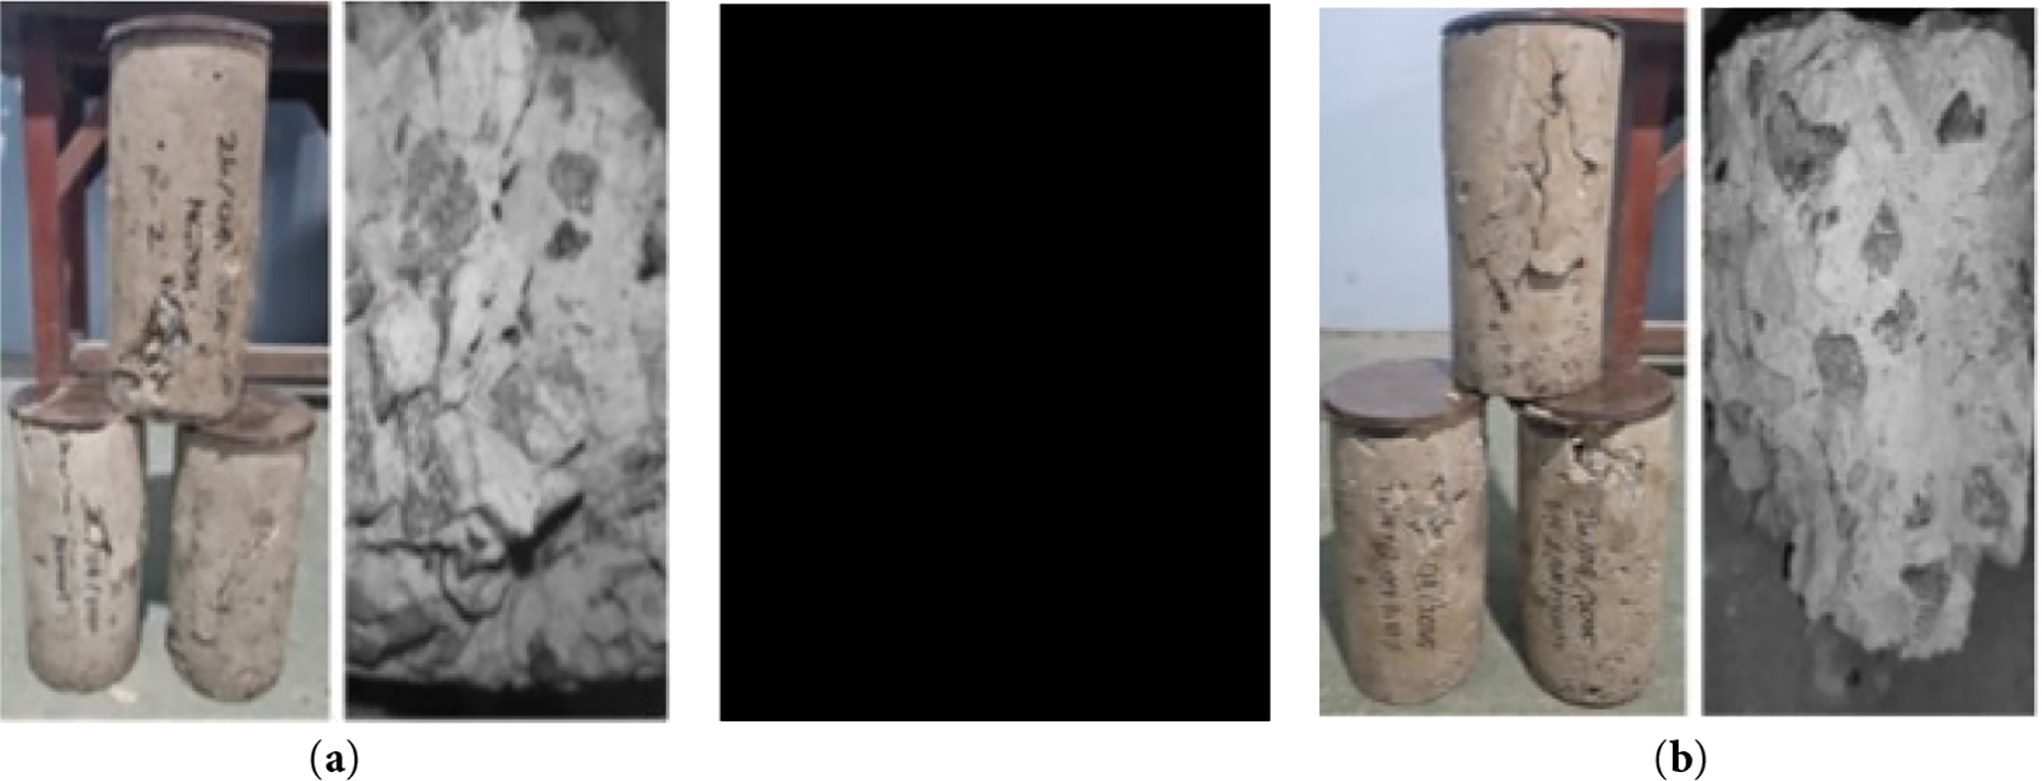
Figure 8: Collapse patterns and fracture appearance of Mg-containing concrete: (a) Normal concrete, (b) NC + 0.35
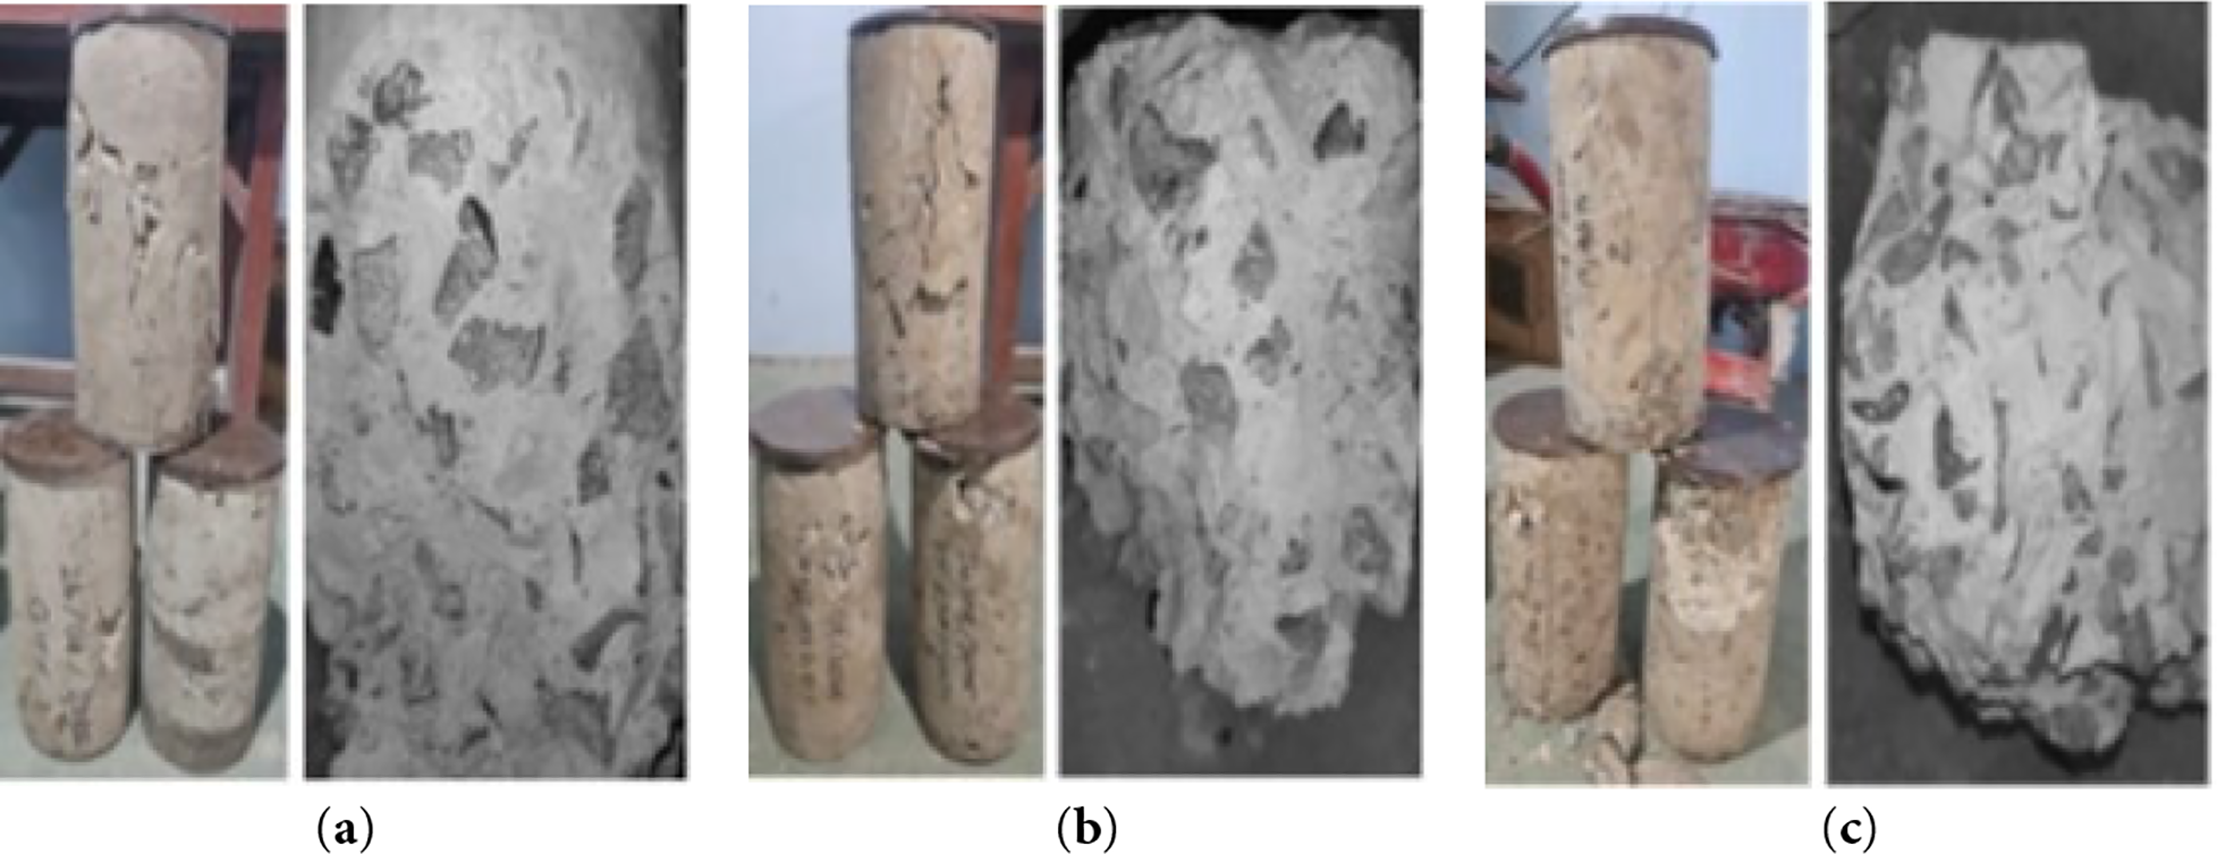
Figure 9: Cylindrical failure pattern and chemical composition of concrete containing Si and Al: (a) NC + 0.15; (b) NC + 0.35; (c) NC + 0.4
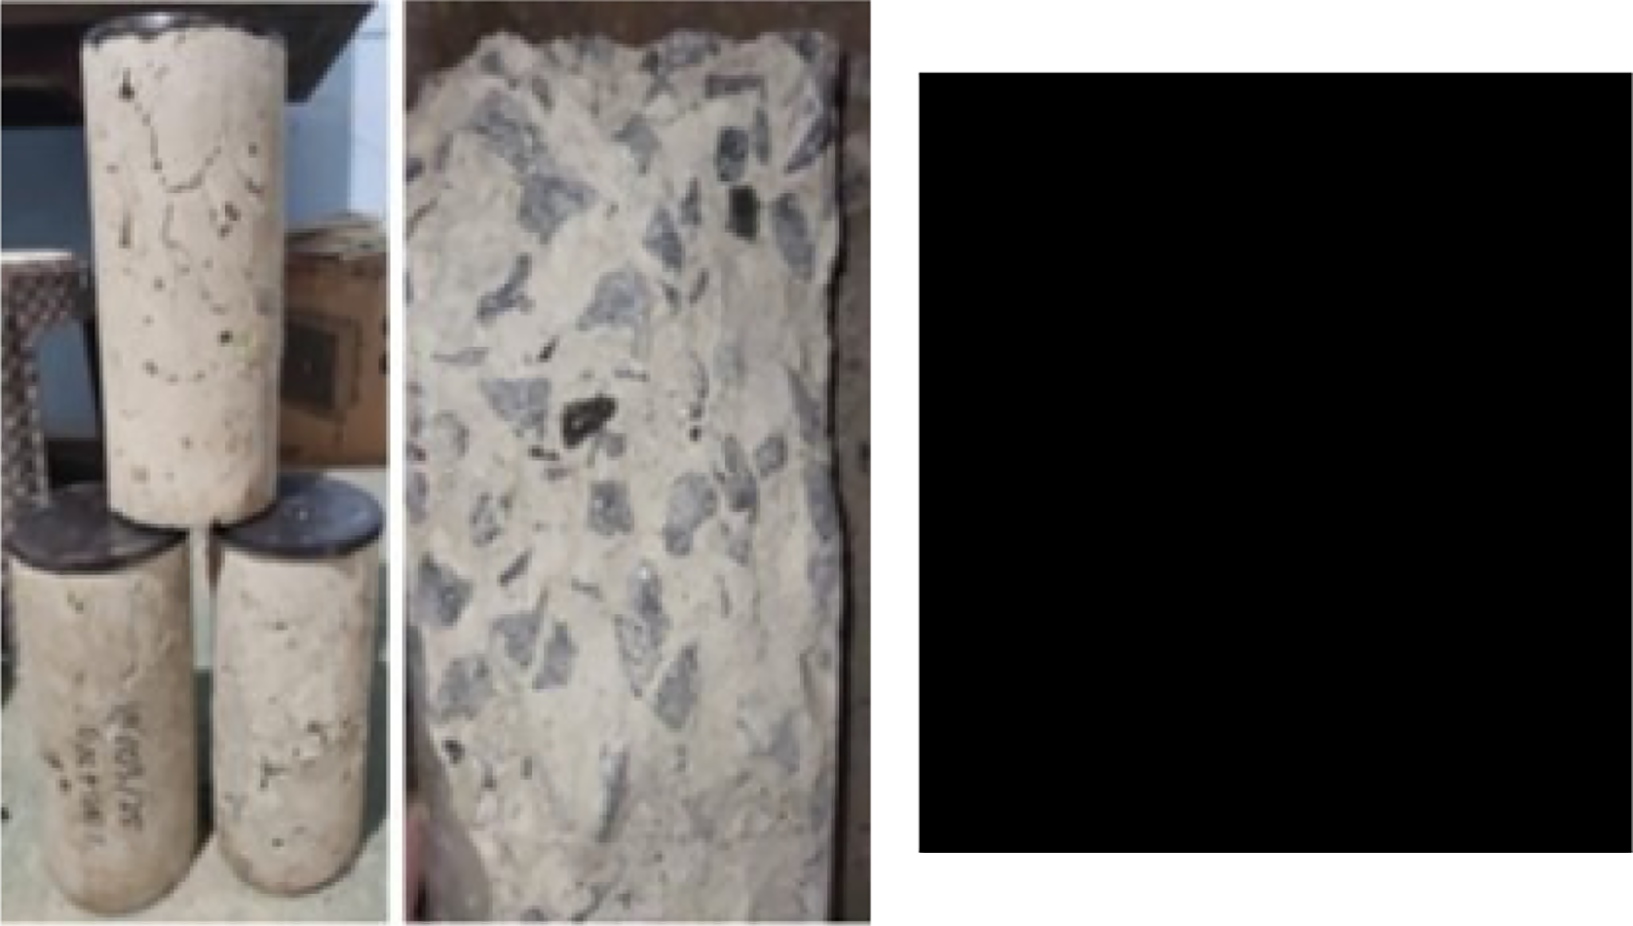
Figure 10: Failure pattern of NC + 0.25, which achieved the highest compressive strength
Variations of Concrete Containing Magnesium (Mg)
Concrete types containing magnesium include normal concrete (NC) and the NC + 0.35 variant. The corresponding collapse patterns, surface cracking, and elemental compositions are shown in Fig. 8.
Variation of concrete containing Silicon (Si) and Aluminum (Al)
Concrete mixtures with varying silicon (Si) and aluminum (Al) contents include NC + 0.15, NC + 0.35, and NC + 0.4. The failure modes, surface texture of fractured specimens, and corresponding elemental compositions are presented in Fig. 9.
The amount of Si and Al in NC +0.15, NC + 0.35, and NC + 0.4 is presented in Table 5.
Variation of Concrete Containing Only Oxygen and Carbon
The concrete variation containing only oxygen and carbon is NC + 0.25. The fracture mode, cracking characteristics, and corresponding elemental composition are shown in Fig. 10.
Visual observation results of concrete samples with varying Mg and Al content showed diverse macrostructural conditions. Detailed descriptions of the findings on the surface of the cylinders and fragments (chunks) for each composition are provided, including pore characteristics, spalling damage, as well as the patterns and locations of cracks identified, as shown in Table 6.
This study investigated the quality of concrete using Energy-Dispersive X-ray (EDX) analysis, focusing on the effects of additive dosage and prolonged mixing duration—simulating batching plant conditions—on compressive strength and microstructural composition. The main limitations of this study include the use of a constant stirring speed, the EDX test being conducted only on 56-day specimens, and the absence of monitoring the stirring power, which limited the assessment of optimal workability in fresh concrete.
Different mixing durations and additive dosages resulted in changes in the chemical composition of the concrete. Extended mixing tended to release reactive elements that interfered with hydration, slowed the development of compressive strength, and accelerated material degradation. Disruptions in the hydration process were indicated by the penetration test and the 24-h setting time test, both of which showed a decrease in compressive strength relative to penetration force.
These changes also manifested in distinctive failure patterns that could be associated with the presence of specific chemical elements. Among all the mixtures, the concrete containing only oxygen and carbon (NC + 0.25, 4-h mixing) achieved the highest compressive strength and exhibited superior microstructural performance, characterized by minimal aggregate cracking and delamination. Conversely, longer mixing durations (6 and 6.5 h) caused significant strength reductions at 56 and 90 days.
Considering the study’s limitations and findings, collaboration between batching plants, experts, and government authorities is essential. Practical implications for batching plant operations include the need to collect sufficient samples for compressive and EDX testing at various ages (7, 14, 28, 56, 90, 120, 150, and 180 days) to establish a comprehensive database. Such a database would enable batching plants to determine the optimal material types, mix proportions, rotation times, and plant locations to maintain both quality and profitability.
Batching plants should also allocate funding to monitor potentially hazardous elements and engage in regular consultation with material experts to ensure the safety of their operations. From a regulatory perspective, government support is needed through updated standards, consistent supervision, and strict law enforcement. Additionally, batching plant manufacturers should conduct preliminary research to determine the optimal mixing duration before commencing large-scale production.
Acknowledgement: This research received valuable support from Prof. Dr. Ir. Lusmeilia Afriani, D.E.A., IPM, Rector of the University of Lampung, Indonesia, for providing facilities from the Faculty of Engineering, the Integrated Laboratory, and the Center for Technology Innovation. We would like to express our gratitude to Prof. Masdar Helmi, S.T., D.E.A., Ph.D. and his staff for providing facilities and equipment for the Materials and Construction laboratory, and to Dr. Rinawati, S.Si., M.Si., Head of the Technical Implementation Unit of the Integrated Laboratory and the Center for Technology Innovation, for providing facilities for the EDX test, and his staff. We would like to express our gratitude to Mr. Hendrik Samiko, ST, sales distributor of PT. SIKA INDONESIA for the Lampung region, Indonesia, who kindly provided Plastimen 83 AM for this research, PT. Sumber Batu Berkah for providing coarse aggregate, and PT. Barisan Muda Sejahtera for providing fine aggregate. We would like to express our gratitude to the Heads of the Bima Mix and Solid Mix Batching Plants for providing valuable information about batching plants. Thank you to Ilham Fajar for his assistance with the Anova program. We also extend our gratitude to all parties for their support of this research.
Funding Statement: The authors received no specific funding for this study.
Author Contributions: The authors confirm contribution to the paper as follows: Conceptualization, Chatarina Niken and Mohd Isneini; methodology, Chatarina Niken and Mohd Isneini; software, Supriyanto and Suyadi Kartorono; validation, Supriyanto and Suripto Dwi Yuwono; formal analysis, Supriyanto and Suripto Dwi Yuwono; investigation, Supriyanto and Suripto Dwi Yuwono; resources, Supriyanto and Suripto Dwi Yuwono; data curation, Supriyanto and Suyadi Kartorono; writing—original draft preparation, Chatarina Niken and Mohd Isneini; writing—review and editing, Chatarina Niken and Mohd Isneini; visualization, Supriyanto and Suripto Dwi Yuwono; supervision, Chatarina Niken and Mohd Isneini; project administration, Supriyanto and Suyadi Kartorono. All authors reviewed and approved the final version of the manuscript.
Availability of Data and Materials: The information backing the conclusions of this research can be accessed publicly at: https://drive.google.com/file/d/1U-A3YQqEeZzHmNW7BYNrKx0FJk-9t7U3/view?usp=drive_link.
Ethics Approval: Not applicable because for studies not involving humans or animals.
Conflicts of Interest: The authors declare no conflicts of interest to report regarding the present study .
References
1. Han D, Ferron RD. Effect of mixing method on microstructure and rheology of cement paste. Constr Build Mater. 2015;93:278–88. doi:10.1016/j.conbuildmat.2015.05.124. [Google Scholar] [CrossRef]
2. Hasan N. Concrete mixing placing and curing. In: Durability and sustainability of concrete. Cham, Switzerland: Springer International Publishing; 2020. p. 85–115. doi:10.1007/978-3-030-51573-7_4. [Google Scholar] [CrossRef]
3. Malekipour M, Moodi F. A novel approach to improve quality of delivered concrete using slump estimations of the ready-mixed concrete (RMC) truck mixer. J Build Eng. 2021;44:103361. doi:10.1016/j.jobe.2021.103361. [Google Scholar] [CrossRef]
4. Hidayat I, Suangga M, Nataadmadja AD. The influence of crystalline to compressive strength of concrete in terms of mixing methods and mixer speed. IOP Conf Ser Earth Environ Sci. 2018;195:012017. doi:10.1088/1755-1315/195/1/012017. [Google Scholar] [CrossRef]
5. Gunawan JA. Pengaruh waktu pengadukan dan kecepatan putaran terhadap niai slump dan kuat tekan beton. Teras. 2022;12(3):25–31. (In Indonesian). doi:10.21009/jmenara.v2i1.7876. [Google Scholar] [CrossRef]
6. Trinugroho S, Ningrum RS. Optimum compressive strength of geopolymer concrete in material comparison variation and mixing time. J Phys Conf Ser. 2021;1858:012054. doi:10.1088/1742-6596/1858/1/012054. [Google Scholar] [CrossRef]
7. Montgomery MDE. How does cement stabilisation work? Coventry, UK: University of Warwick; 1998. [Google Scholar]
8. Singaravel DA, Boopathi N, Rajendran S, Dhairiyasamy R. A comprehensive investigation into the influence of prolonged mixing on the properties of concrete incorporating different types of Portland cement. Adv Mater Res. 2025;1183:73–84. doi:10.4028/p-yhslo3. [Google Scholar] [CrossRef]
9. El-motaal AMA, El-raheem AHA, Mahdy MG. Effect of time and speed mixes on concrete properties. Int J Eng Innov Technol. 2020;9(9):26–31. [Google Scholar]
10. Sumra Y, Payam S, Zainah I. The pH of cement-based materials: a review. J Wuhan Univ Technol Sci Ed. 2020;35(5):908–24. doi:10.1007/s11595-020-2337-y. [Google Scholar] [CrossRef]
11. Kurniasih NA, Nurhasanah KR, Febriyani AL, Bimantoro RJ, Susilowati, Khairumaynisa ZB, et al. Inovasi beton adaptif: optimalisasi self-healing concrete untuk mitigasi retakan dan struktur berkelanjutan: artikel reviu. In: Prosiding seminar nasional teknik sipil 2025. Kartasura, Indonesia: Fakultas Teknik Universitas Muhammadiyah Surakarta; 2025. (In Indonesian). p. 235–44. [Google Scholar]
12. ASTM C 685/C 685M-01. Standard specification for concrete made by volumetric batching and continuous mixing. West Conshohocken, PA, USA: ASTM; 2001. [Google Scholar]
13. ASTM C 94/C 94M–09. Standard specification for ready-mixed concrete. West Conshohocken, PA, USA: ASTM; 2009. [Google Scholar]
14. Cai H, Ouyang M, Zhu C, Xiao Z. Research on concrete mixing plant equipment based on Internet of Things technology. J Phys Conf Ser. 2021;1858:012054. doi:10.1088/1742-6596/1858/1/012054. [Google Scholar] [CrossRef]
15. Darsini, Pramuda Triwardana E, Ahya R. Pengaruh penambahan admixture terhadap nilai slump Dan kuat tekan beton bleeding. J Appl Mech Eng Renew Energy. 2023;3(2):81–7. (In Indonesian). doi:10.52158/jamere.v3i2.610. [Google Scholar] [CrossRef]
16. Rong X, Liu H, Li C. A proposed method and monitoring system for evaluating workability of Portland cement concrete during mixing. Heliyon. 2022;8(11):e11355. doi:10.1016/j.heliyon.2022.e11355. [Google Scholar] [PubMed] [CrossRef]
17. Plank J, Sakai E, Miao CW, Yu C, Hong JX. Chemical admixtures—Chemistry, applications and their impact on concrete microstructure and durability. Cem Concr Res. 2015;78:81–99. doi:10.1016/j.cemconres.2015.05.016. [Google Scholar] [CrossRef]
18. SNI03-6468. Tata cara perencanaan campuran tinggi dengan semen portland. Jakarta, Indonesia: Standar Nasional Indonesia; 2000. (In Indonesian). [Google Scholar]
19. ASTM C494/C494M. Standard specification for chemical admixtures for concrete 1. West Conshohocken, PA, USA: ASTM; 2024. [Google Scholar]
20. Barbhuiya S, Das BB, Adak D. Chapter 9-effects of chemical admixtures on the properties of concrete. In: Singh NB, Goyal R, Middendorf B, editors. Binding materials for sustainable construction. Sawston, UK: Woodhead Publishing; 2025. p. 329–62. doi:10.1016/b978-0-443-26566-2.00009-x. [Google Scholar] [CrossRef]
21. Mahgoub M, Hussein M, Mousa A. Extended discharge time of ready-mixed concrete: myth or necessity? Constr Build Mater. 2024;437:136913. doi:10.1016/j.conbuildmat.2024.136913. [Google Scholar] [CrossRef]
22. Fatah A, Prasetia AR, Dudi A, Afif SMM, Azan Muzahab L. The use of type D and type F admixtures concrete and their effects on setting time and compressive strength. J Soc Res. 2025;4(7):1796–808. doi:10.55324/josr.v4i7.2664. [Google Scholar] [CrossRef]
23. Hartono J, Masrianto M, Widuri IL, Dhanardono B, Santoso HT. Alternatif perencanaan komposisi campuran beton dengan gabungan bahan tambah kimia tipe F dan dagar waktu buka acuan dipercepat. J Jalan-Jembatan. 2022;39(1):1–14. (In Indonesian). [Google Scholar]
24. Wibowo W, Safitri E, Putri SRS. Kajian permeabilitas dengan tekanan 1 kg/cm2 pada beton bubuk reaktif dengan silica fume 15% Dan variasi pasir kuarsa. Matriks Tek Sipil. 2024;11(3):291. (In Indonesian). doi:10.20961/mateksi.v11i3.76538. [Google Scholar] [CrossRef]
25. Maricar S, Tatong B, Hasan H. The effect of the additive plastiment—VZ on the properties of concrete. J Mektek. 2013;1:39–58. [Google Scholar]
26. Mulyadi KWP, Sandjaya A. Analisis perbandingan mutu beton dengan menggunakan dan tidak menggunakan zat aditif. J Mitra Tek Sipil. 2025;8(1):1–8. (In Indonesian). doi:10.24912/jmts.v8i1.33092. [Google Scholar] [CrossRef]
27. Mehta PK, Monteiro PJM. Concrete microstructure, properties, and materials. 3rd ed. New York, NY, USA: McGraw Hill; 2006. [Google Scholar]
28. Moutassem F, Chidiac SE. Assessment of concrete compressive strength prediction models. KSCE J Civ Eng. 2016;20(1):343–58. doi:10.1007/s12205-015-0722-4. [Google Scholar] [CrossRef]
29. Niken C. Why does my concrete tile fragile? A case study: Genteng Beton Indonesia Ltd. In: Proceedings of the 1st International Conference on Industry Science Technology and Sustainability (IConISTS 2023); 2023 Oct 11–12; Bandar Lampung, Indonesia. doi:10.2991/978-94-6463-475-4_17. [Google Scholar] [CrossRef]
30. Sudeshna W, Abhijit W. Productivity of batching plant and quality of concrete production. Int J Adv Res IDEAS Innov Technol. 2017;3(1):18–21. [Google Scholar]
31. Chandra Nst H, Oktaviani CZ, Bulba AT. Implementation of quality management system performance by batching plant service providers in big aceh district. J World Sci. 2022;1(9):725–36. doi:10.36418/jws.v1i9.94. [Google Scholar] [CrossRef]
32. Akhila J, Rao NV. Experimental investigation on carbonation of concrete using SEM-EDX (scanning electron microscopy (SEM) with energy dispersive X-ray analysis (EDX) & environmental scanning electron microscope (ESEM) analysis. IOP Conf Ser Earth Environ Sci. 2023;1130(1):012022. doi:10.1088/1755-1315/1130/1/012022. [Google Scholar] [CrossRef]
33. Elkerany AM, Keshta MM, Elshikh MMY, Elshami AA, Youssf O. Characteristics of sustainable concrete containing metakaolin and magnetized water. Buildings. 2023;13(6):1430. doi:10.3390/buildings13061430. [Google Scholar] [CrossRef]
34. Kleiner F, Decker M, Rößler C, Hilbig H, Ludwig HM. Combined LA-ICP-MS and SEM-EDX analyses for spatially resolved major, minor and trace element detection in cement clinker phases. Cem Concr Res. 2022;159:106875. doi:10.1016/j.cemconres.2022.106875. [Google Scholar] [CrossRef]
35. Nasution MI. Pengaruh penambahan dan variasi butiran pasir merah terhadap kuat tekan beton pada mutu beton K-225. J Einstein. 2021;9(3):60–7. (In Indonesian). doi:10.22219/skpsppi.v2i1.4330. [Google Scholar] [CrossRef]
36. Lasino L, Rachman D, Sugiharto B. Kajian penggunaan semen portland komposit untuk beton. J Teknol Bahan dan Barang Tek. 2012;2(2):41. (In Indonesian). [Google Scholar]
37. C33-07 A. Standard specification for chemical admixtures for concrete 1. West Conshohocken, PA, USA: ASTM; 2012. [Google Scholar]
38. SNI 7656-2012. Tata cara pemilihan campuran untuk beton normal, beton berat dan beton massa. Jakarta, Indonesia: Standar Nasional Indonesia; 2012. (In Indonesian). [Google Scholar]
39. SNI 03-44-333. BAB I ruang lingkup ruang lingkup pengertian. Jakarta, Indonesia: Standar Nasional Indonesia; 1997. (In Indonesian). [Google Scholar]
40. Ananda F, Saputra H, Fahmi N, Prayitno E, Shapie SS, Bin Ikhwat MA, et al. Optimization of machine learning algorithms through outlier data separation for predicting concrete compressive strength. J Geosci Eng Environ Technol. 2025;10(2):191–202. doi:10.25299/jgeet.2025.10.02.21896. [Google Scholar] [CrossRef]
41. Yu Z, Shen L, Tang R, Huang Q. An experimental study and failure mechanism analysis on dynamic behaviors of plain concrete under biaxial compression-compression. Case Stud Constr Mater. 2022;17:e01200. doi:10.1016/j.cscm.2022.e01200. [Google Scholar] [CrossRef]
42. Xu T, Garrecht H. Effects of mixing techniques and material compositions on the compressive strength and thermal conductivity of ultra-lightweight foam concrete. Materials. 2024;17(11):2640. doi:10.3390/ma17112640. [Google Scholar] [PubMed] [CrossRef]
43. Silahooy S. Analisis serbuk silika amorf (SiO2) berbahan dasar pasir. Scie Map J. 2020;2(2):75–8. (In Indonesian). [Google Scholar]
44. Abd El-Motaal AM, Abdel-Reheem A, Mahdy M. Effect of low mixing speed on the properties of prolonged mixed concrete. Civ Eng J. 2020;6(8):1581–92. doi:10.28991/cej-2020-03091568. [Google Scholar] [CrossRef]
45. SNI 7064. Semen portland komposit. Jakarta, Indonesia: Standar Nasional Indonesia; 2014. (In Indonesian). [Google Scholar]
46. McCarthy MJ, Dyer TD. Pozzolanas and pozzolanic materials. In: Lea’s chemistry of cement and concrete. Amsterdam, The Netherlands: Elsevier; 2019. p. 363–467. doi:10.1016/b978-0-08-100773-0.00009-5. [Google Scholar] [CrossRef]
47. Reuge N, Bonnet S, Bignonnet F. Chloride diffusivity and electrical resistivity of slag-based concrete reinforced by steel fibers: experimental study and multiscale modeling. Eur J Environ Civ Eng. 2025;16:1–26. doi:10.1080/19648189.2025.2532800. [Google Scholar] [CrossRef]
48. John E, Matschei T, Stephan D. Nucleation seeding with calcium silicate hydrate—a review. Cem Concr Res. 2018;113:74–85. doi:10.1016/j.cemconres.2018.07.003. [Google Scholar] [CrossRef]
49. Peter P, Clement J, Arockiaraj M, Jacob K. Predictive modeling of molecular interaction energies using topological and spectral entropies of zeolite AWW. Front Chem. 2025;13:1543588. doi:10.3389/fchem.2025.1543588. [Google Scholar] [PubMed] [CrossRef]
50. Sridhar S, Muthtamilselvan M, Ahn K. Effects of rotation and chemical reactions on an electroconvection in Maxwell dielectric nanofluids within anisotropic porous media. J Taibah Univ Sci. 2024;18(1):2421576. doi:10.1080/16583655.2024.2421576. [Google Scholar] [CrossRef]
51. Teichmann A, Strahm B, Garrecht H, Blandini L. Effects of a two-stage mixing process on the characteristics of concrete: part I-hardened concrete characteristics. Results Mater. 2024;23:100604. doi:10.1016/j.rinma.2024.100604. [Google Scholar] [CrossRef]
52. Irfan A, Duraman SB, Yusof I, Sharbini MSH. Effects of mixing method and duration on concrete properties exposed to hot weather conditions. AIP Conf Proc. 2023;2643:030012. doi:10.1063/5.0128320. [Google Scholar] [CrossRef]
53. Falliano D, De Domenico D, Ricciardi G, Gugliandolo E. Experimental investigation on the compressive strength of foamed concrete: effect of curing conditions, cement type, foaming agent and dry density. Constr Build Mater. 2018;165:735–49. doi:10.1016/j.conbuildmat.2017.12.241. [Google Scholar] [CrossRef]
54. Deni DP, Santosa IWL, Rahmi AT, Pratiwi KH. Analisis serapan larutan karbonat pada beton mutu tinggi memadat mandiri dengan variasi substitusi metakaolin. JMTS J Mitra Tek Sipil. 2025;8(2):485–92. (In Indonesian). doi:10.24912/jmts.v8i2.32259. [Google Scholar] [CrossRef]
55. Niken C, Tjahjono E, Supartono F. Long-term shrinkage empirical model of high performance concrete in humid tropical weather. Civ Environ Res. 2013;3(2):35–47. [Google Scholar]
56. Szubert K, Dutkiewicz A, Nowicki M, Maciejewski H. Fluorocarbosilane-based protective coatings for concrete. Materials. 2022;15(17):5994. doi:10.3390/ma15175994. [Google Scholar] [PubMed] [CrossRef]
57. Paikara RK, Gyawali TR. Influence of aluminum powder content and powder-to-sand ratio on the physical and mechanical properties of aerated lightweight mortar. Clean Mater. 2023;10:100213. doi:10.1016/j.clema.2023.100213. [Google Scholar] [CrossRef]
58. Zhang P, Han S, Ng S, Wang XH. Fiber-reinforced concrete with application in civil engineering. Adv Civ Eng. 2018;2018:1698905. doi:10.1155/2018/1698905. [Google Scholar] [CrossRef]
59. Lagerblad B. Leaching performance of concrete based on studies of samples from old concrete constructions. Stockholm, Sweden: Swedish Cement and Concrete Research Institute; 2021. [Google Scholar]
60. Winkler EM, Singer PC. Crystallization pressure of salts in stone and concrete. Geol Soc America Bull. 1972;83(11):3509. doi:10.1002/1097-0142(1950)3:1<74::aid-cncr2820030111>3.0.co;2-7. [Google Scholar] [CrossRef]
61. Hughes JM, Rakovan J. The crystal structure of apatite, Ca5(PO4)3(F, OH, Cl). Rev Mineral Geochem. 2002;48(1):1–12. doi:10.2138/rmg.2002.48.1. [Google Scholar] [CrossRef]
62. Quan J, Li X, Liang S, Hu G, Li X, Yu W, et al. Enhancing phosphorus removal by novel porous concrete fabricated with alkali-activated aggregate derived from industrial solid wastes. Resour Conserv Recycl. 2024;204:107520. doi:10.1016/j.resconrec.2024.107520. [Google Scholar] [CrossRef]
63. Nurse RW. The effect of phosphate on the constitution and hardening of portland cement. J Appl Chem. 1952;2(12):708–16. doi:10.1002/jctb.5010021208. [Google Scholar] [CrossRef]
Cite This Article
 Copyright © 2026 The Author(s). Published by Tech Science Press.
This work is licensed under a Creative Commons Attribution 4.0 International License , which permits unrestricted use, distribution, and reproduction in any medium, provided the original work is properly cited.
 Downloads
 Citation Tools