
 Submit a Paper
 Propose a Special lssue
 Open Access
ARTICLE

Damage Evolution and Dynamic Characteristics of Arch Dams under Seismic Action
1 College of Civil and Architecture Engineering, Chuzhou University, Chuzhou, 239000, China
2 Anhui Provincial International Joint Research Center of Date Diagnosis and Smart Maintenance on Bridge Structures, Chuzhou, 239000, China
3 Water Resources Research Institute of Shandong Province, Jinan, 250014, China
4 College of Mechanical and Electrical Engineering, Hohai University, Changzhou, 213200, China
5 Faculty of Civil Engineering, Brno University Technology, Brno, 60200, Czech Republic
* Corresponding Author: Qingyang Wei. Email:
(This article belongs to the Special Issue: Artificial Intelligence and Data Mining Applications in Fault Diagnosis and Damage Identification of Infrastructure)
Structural Durability & Health Monitoring 2026, 20(2), 1 https://doi.org/10.32604/sdhm.2025.073665
Received 23 September 2025; Accepted 05 November 2025; Issue published 31 March 2026
 View Full Text
 Download PDF
Abstract
As vital hydraulic infrastructures, concrete dams demand uncompromising safety assurance. Seismic effect commonly serves as a potential factor contributing to the damage of concrete dams, making seismic performance analysis crucial for structural integrity. Numerical simulation based on damage mechanics is usually considered as the approach for investigating the seismic damage behavior of concrete dams. To address the limitations of existing studies and extract the key dynamic characteristics of concrete arch dams, a concrete elastoplastic damage mechanics model is adopted, a seismic load input technique involving the viscoelastic boundary along with equivalent nodal forces is generated, and a spring-contact pair simulation technique for modeling the transverse joints of arch dams is developed. The damage process of an arch dam under the classic Koyna seismic load is simulated, with the damage evolution process under seismic action being characterized. The middle sections of the arch dam near the upper portion are considered regions prone to damage under seismic action. Furthermore, the nonlinear dynamic characteristics caused by the opening and closing collision between transverse joints of the arch dam under strong seismic action are extracted. The extracted dynamic characteristic provides a manifestation for the dynamic damage diagnosis of arch dams based on seismic responses.Keywords
Concrete arch dam is the most prevalent dam type in the construction of high dams and large reservoirs due to its high strength, outstanding durability, and superior flood discharge capacity [1]. However, concrete arch dams are often located in regions with intense and frequent seismic activity, posing significant challenges to their structural safety [2]. Typically, the Pacoima Arch Dam developed significant cracks at the left abutment joint after experiencing a second earthquake in 1994, with the fractures extending into the rock mass [3]. The failure of high arch dams and large reservoirs under strong earthquakes would not only lead to severe engineering safety issues but also trigger catastrophic secondary disasters due to the sudden release of floodwaters downstream. Therefore, the seismic safety of concrete arch dams is significantly important.
To investigate the seismic safety and damage characteristics of concrete dams under seismic action, the academic and engineering communities primarily employ two approaches: numerical simulation and model testing [4,5]. Model testing can visually simulate the failure process of arch dams during seismic actions [6]. Nevertheless, due to current technological limitations—particularly the difficulty in ensuring that model materials fully satisfy the similarity conditions for destructive testing of high arch dams [7]—the results of model testing have inherent limitations. In contrast, numerical simulation, with the advantages of efficiency, flexibility, and repeatability, can simulate seismic processes under various scenarios and has become the primary approach for studying the dynamic behavior of concrete dams under seismic actions [8–10].
Damage mechanics characterizes concrete cracking through continuous damage variables, with three key advantages: capturing the locally continuous distribution of micro-defects; quantifying material property degradation; aligning damage evolution direction with crack propagation perpendicular to the principal stress [11,12]. The application of damage mechanics to concrete materials was pioneered by Dougill et al. [13]. Subsequently, various damage models emerged, including the Loland model [14] and Mazars and Pijaudier-Cabot model [15]. Cervera et al. [16] employed an isotropic damage model to analyze arch dam failure under seismic action, identifying the dam heel and upstream crown cantilever as critical damage locations. Through comparative analysis between damage models and linear elastic models for hyperbolic arch dams, Valliappan et al. [17] reconfirmed that the upstream crown cantilever area sustains the most severe damage. Lee and Fenves [18] developed a plastic damage constitutive model incorporating tension-compression differentiation under cyclic loading, subsequently applying it to analyze the dynamic response and failure process of concrete dams. Zhang et al. [19] and Leyi et al. [20] investigated mainshock-aftershock effects on dam damage utilizing the plastic damage model, concluding that strong aftershocks produce cumulative damage effects. Faria et al. [21] established a rate-dependent damage constitutive model for simulating seismic-induced cracking in arch dams. Wang et al. [22] combined an elastoplastic damage mechanics model with a contact model to analyze the dynamic behavior of arch dam transverse joints, demonstrating that neglecting joint interactions leads to underestimation of cracking risk during strong earth-quakes. Hussein et al. [23] studied the reliability analysis of seismic stability for concrete dams and established the matrix of damage states with the intricate interaction among the dam, water, and foundation rock considered. Subsequently, uncertainties in material properties and seismic characteristics are incorporated and a mathematical model is introduced to describe the progressive nature of damage evolution [24]. Current numerical simulation studies on the seismic-induced damage behavior of concrete dams primarily rely on the integration of finite element analysis frameworks with damage mechanics theory [25,26].
The dynamic behavior of concrete arch dams under seismic action is influenced by numerous factors, exhibiting high complexity and uncertainty [27]. Extensive research has been conducted worldwide on seismic effects concerning concrete arch dams, with investigations focusing on one or more of the following aspects: seismic input mechanisms, source-to-site distance effects, reservoir-dam-foundation interaction, material constitutive relationships, and numerical simulation methodologies [28–32]. These forward analysis approaches have significantly advanced the understanding of how various factors affect dam dynamic response, thereby providing valuable insights for seismic design. However, it should be noted that inverse analysis methods, particularly damage identification based on dynamic responses, fundamentally relies on the availability of effective dynamic damage characteristics. While previous studies have extensively identified vulnerable areas and dynamic response patterns in arch dams under seismic action, most have not systematically extracted the key damage characteristics that evolve throughout the damage process. This shortcoming results in numerous analytical findings being inapplicable to inverse problems of arch dam’s damage identification.
To address this gap, this study numerically and experimentally investigates the damage evolution process in concrete arch dams with the aim of extracting effective dynamic damage characteristics. The findings are expected to provide a basis for developing more reliable damage identification methodologies.
2.1 Concrete Damaged Plasticity Model
The stress-strain curves of concrete under uniaxial tension and uniaxial compression are assumed to be as shown in Fig. 1. The linear elastic deformation is undergone before reaching the ultimate tensile stress
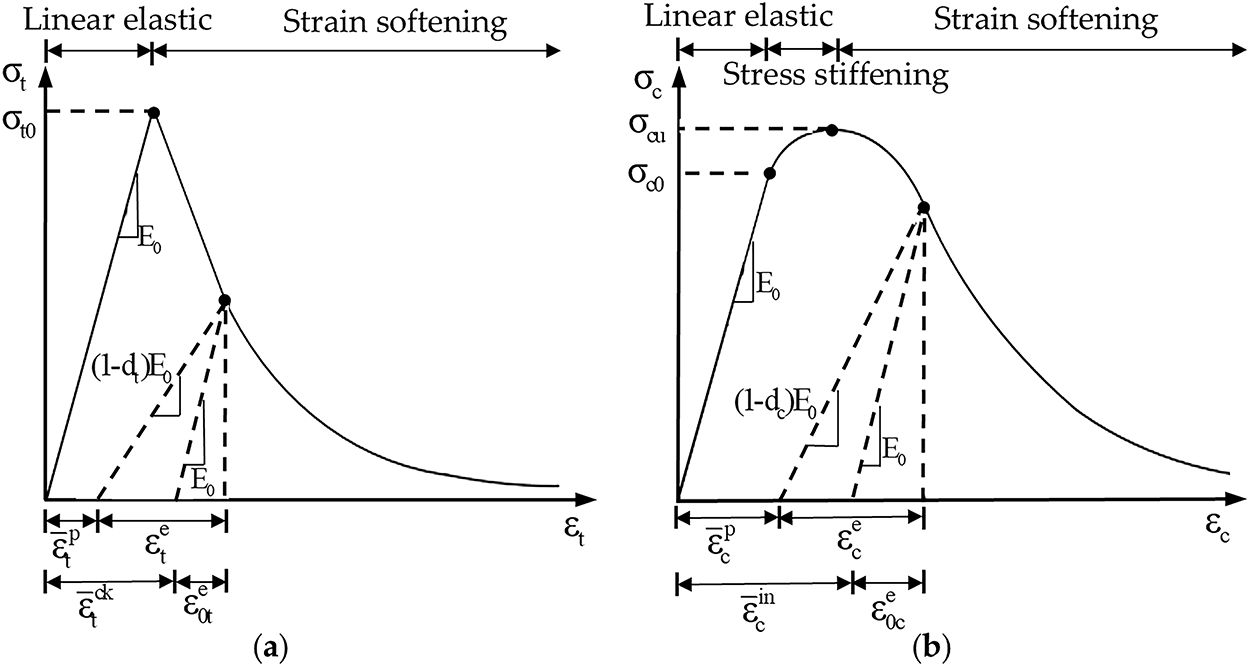
Figure 1: Stress-strain relationship of concrete: (a) uniaxial tension; (b) uniaxial compression
The stress-strain relationship of uniaxial tensile and uniaxial compressive damage of concrete is represented as:
The equivalent plastic strains under tension and compression can be solved as:
The yield surfaces shown in Fig. 2 can be described as:
where,
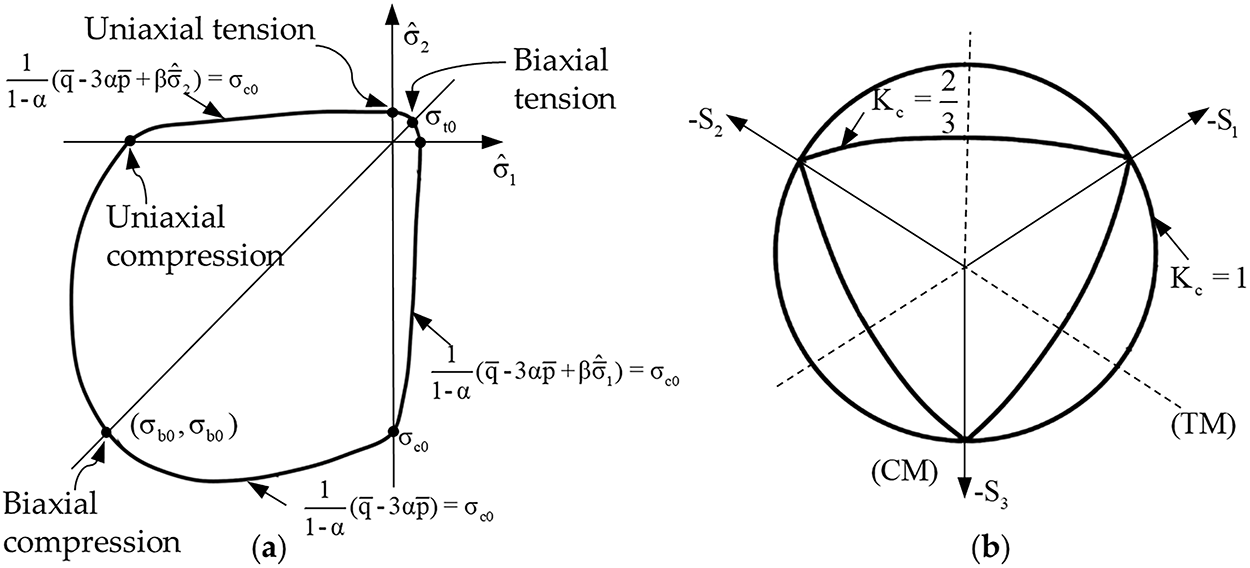
Figure 2: Yield surfaces of concrete: (a) initial yield surface; (b) variation of the yield surface
The flow potential G of the concrete damage is described as:
where,
where,
The viscoelastic boundary is essentially a spring-damper system distributed on the truncated boundary, and its mechanical parameters are as follows:
where,
The displacement vector of the free field is supposed as
where,
Based on the uniaxial tensile cyclic loading experimental data from literature [18], a planar model with dimensions of 82.6 mm × 82.6 mm is established. The model has an elastic modulus of 27.3 GPa, a representative tensile strength of 3.48 MPa, and a representative compressive strength of 27.6 MPa. The characteristic element length is 82.6 mm. The computational mesh and loading configuration are shown in Fig. 3, with the maximum strain of interest being 0.0005.
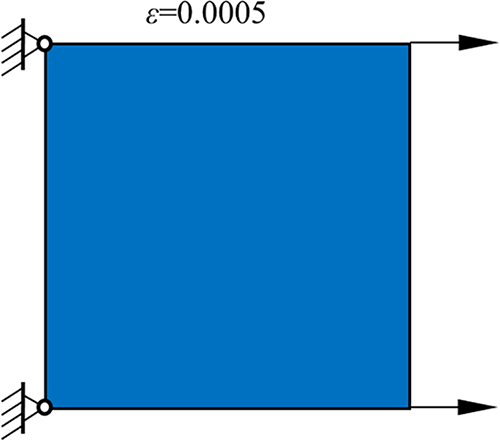
Figure 3: Uniaxial tension model
As shown in Fig. 4, the stress and strain data of the model during the loading and unloading processes under uniaxial tension are extracted. When the model is unloaded after reaching its ultimate strength, the unloading modulus is lower than the initial modulus, resulting in irrecoverable residual deformation. Upon reloading, the stress increases along the path of the previous unloading phase, and softening occurs again when the ultimate strength is reached. Compared with the measured loading and unloading data from experimental specimens, the numerical results effectively capture the mechanical characteristics of concrete under multiple loading and unloading cycles, validating the model and selected parameters used in this study.
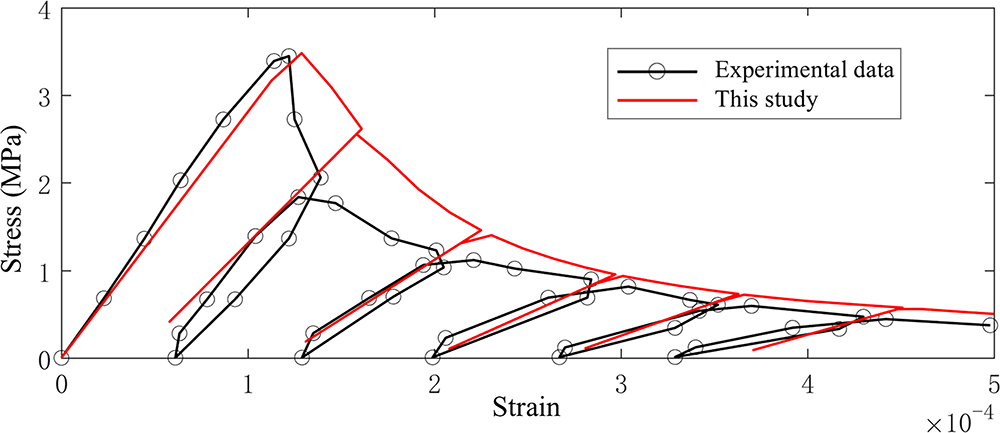
Figure 4: Stress-strain curves under uniaxial tensile cyclic loading
To validate the effectiveness of the model in seismic damage analysis of concrete dams, a study is conducted based on the classic Koyna earthquake damage case. Fig. 5 summarizes the experimental results from two scaled model tests of seismic damage to the Koyna gravity dam reported in existing literature, along with the simulation results obtained using the method proposed in this study. The final tensile damage distribution of the dam derived in this study shows strong agreement with the seismic damage patterns of the Koyna gravity dam documented in other literature. Specifically, the damage primarily manifests as an oblique extension from the downstream slope change point, followed by horizontal progression toward the upstream face. This damage pattern has been validated in multiple studies, indicating that the development of seismic-induced damage in gravity dams follows certain consistent characteristics. Results from some literature also reveal damage at the dam heel similar to the findings of this study, suggesting that the dam heel may be a vulnerable area in gravity dams under seismic action.
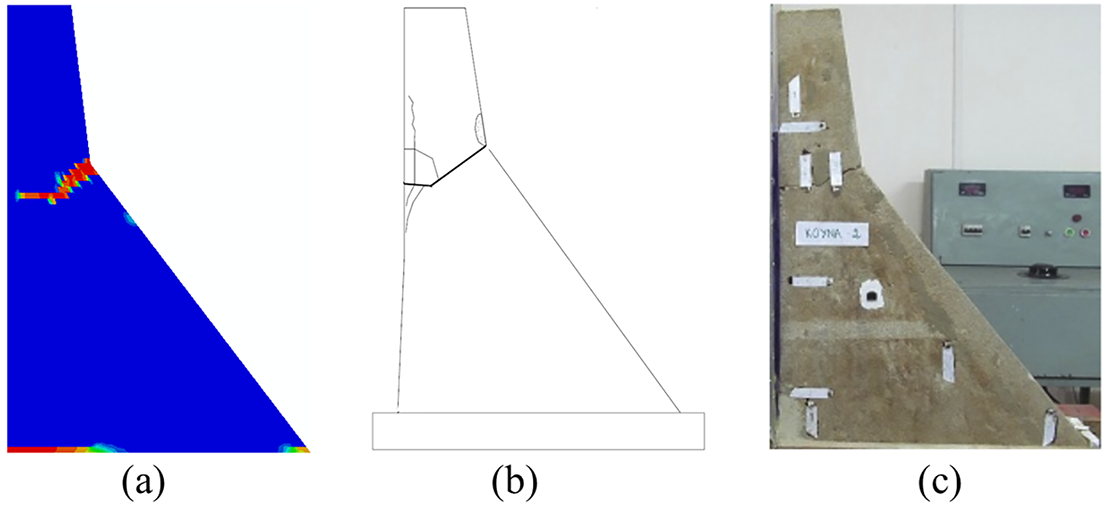
Figure 5: Damage shapes of the Koyna Dam: (a) this model; (b) reference [33]; (c) reference [34]
3 Seismic Damage Process of Arch Dam
A double-curvature arch dam in Southwest China is selected as a case study, and the three-dimensional finite element model of the dam-foundation system is established, as shown in Fig. 6. The dam has the maximum height of 270 m, the crest thickness of 11.98 m, the base thickness of 51 m, the thickness-to-height ratio of 0.19, and the upstream crest arc length of 326.95 m.
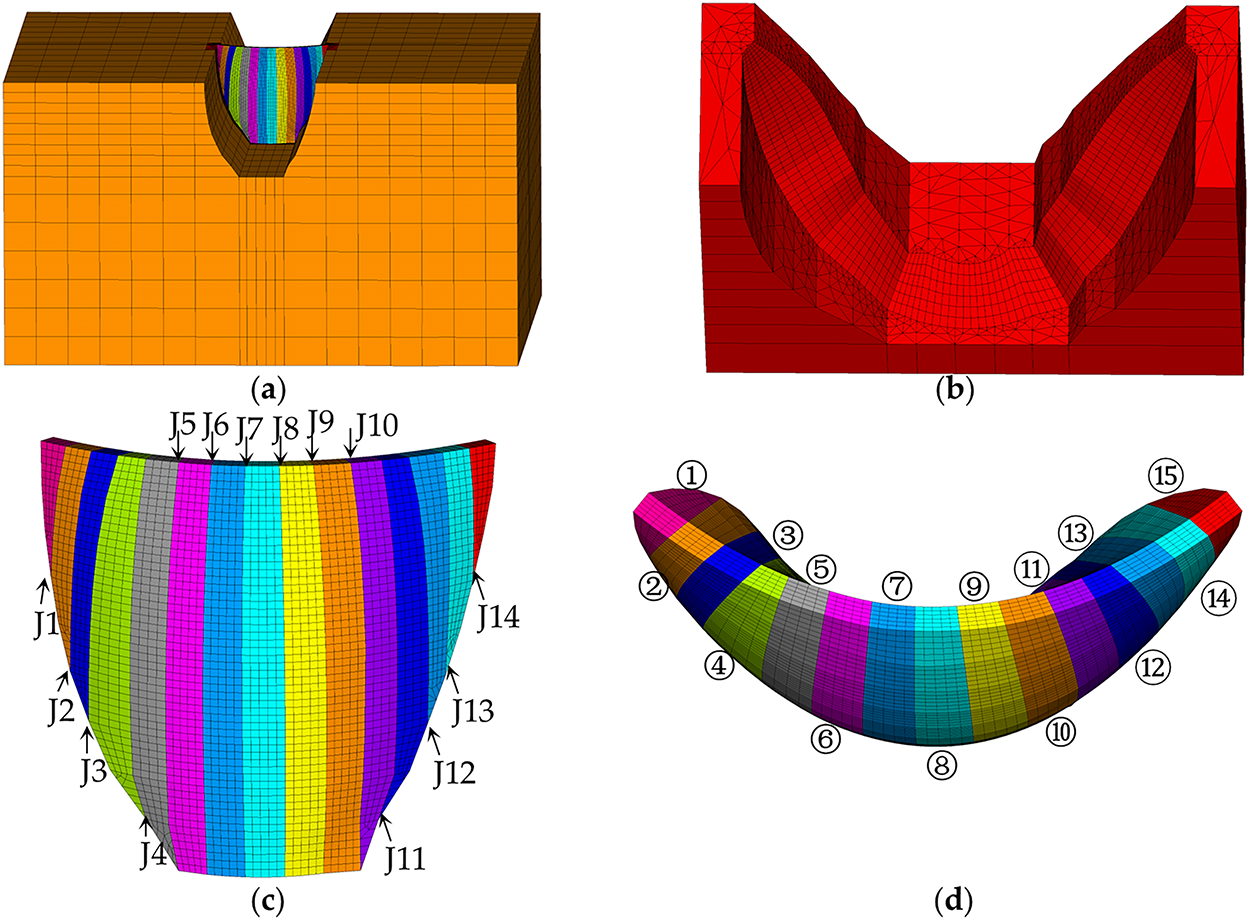
Figure 6: Finite element model of the arch dam: (a) dam-foundation system; (b) transition zone near abutment; (c) front view of the dam body; (d) top view of the dam body
The established three-dimensional model comprises the dam body, foundation, and abutment transition zone, where the abutment transition zone serves to reconcile the fine mesh of the dam body with the coarser mesh of the foundation. The extents of the foundation in the left/right banks, up-stream/downstream directions, and depth direction are set at 2, 2.5, and 3 times the maximum dam height, respectively. The dam body and foundation are discretized using 8-node hexahedral elements, while the transition zone is meshed with 4-node tetrahedral and pentahedral elements. The finite element model of the dam body consists of 23,786 elements and 16,320 nodes, the foundation consists of 3810 elements and 4816 nodes, and the abutment transition zone consists of 9658 elements and 2629 nodes. The dam body is divided into 15 sections (labeled ① to ⑮), with 14 transverse joints (labeled J1 to J14) formed between them.
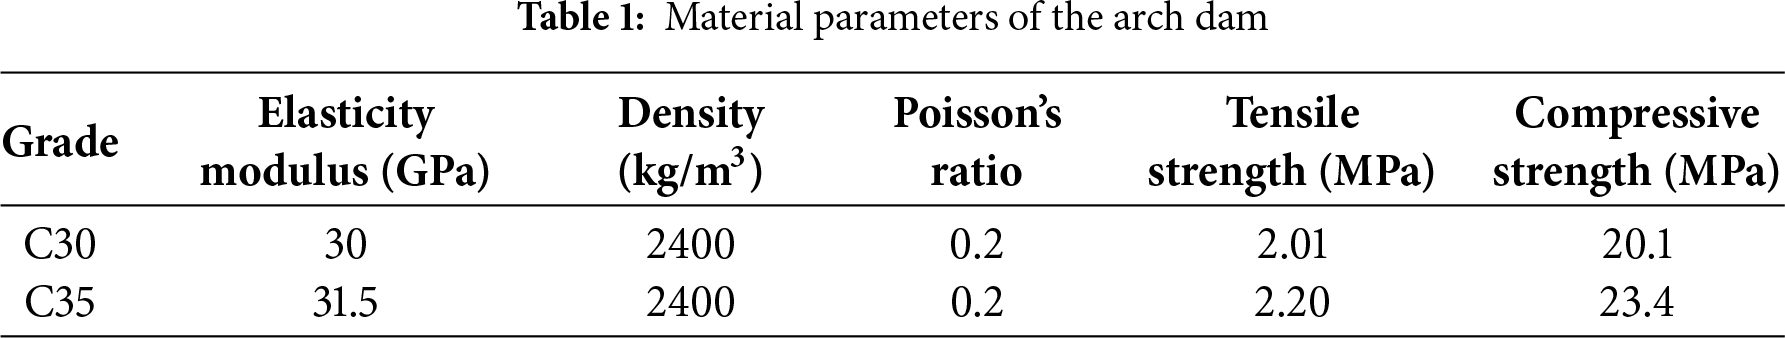
The dam body is concreted using two strength grades of concrete: C30 and C35 during construction. The C35-grade concrete is employed in the dam portion adjacent to the foundation surface, while the remaining sections utilized C30-grade concrete. The foundation rock mass is treated as a linear elastic material without considering damage, with an elastic modulus, density, and Poisson’s ratio of 20,000 MPa, 2700 kg/m3, and 0.18, respectively. The material parameters of the dam concrete are determined in accordance with the Chinese concrete design code [35], as list in Table 1. The plastic parameters [36] of the dam concrete include a dilation angle of 38°, an eccentricity of 0.1, a biaxial-to-uniaxial compressive strength ratio of 1.16, and an invariant stress ratio coefficient Kc of 0.667.
The elastoplastic damage model expresses the stress-strain relationship beyond the elastic range in the forms of
where
where,
The transverse joints of an arch dam remain in a compressed and closed state due to the upstream water pressure under normal operating conditions. However, these joints may exhibit behaviors such as opening, closing, and sliding under seismic actions. Therefore, the treatment of transverse joints is particularly critical when studying the dynamic response and damage process of arch dams under seismic load. As shown in Fig. 7, tangential springs are employed to connect adjacent dam sections based on the dynamic contact force model, thereby providing tangential restraint. The constitutive relationship of the normal dynamic contact force model is as follows:
where, c is the initial contact gap, h is the relative displacement between the contact surfaces. p is the contact pressure on the contact pair and
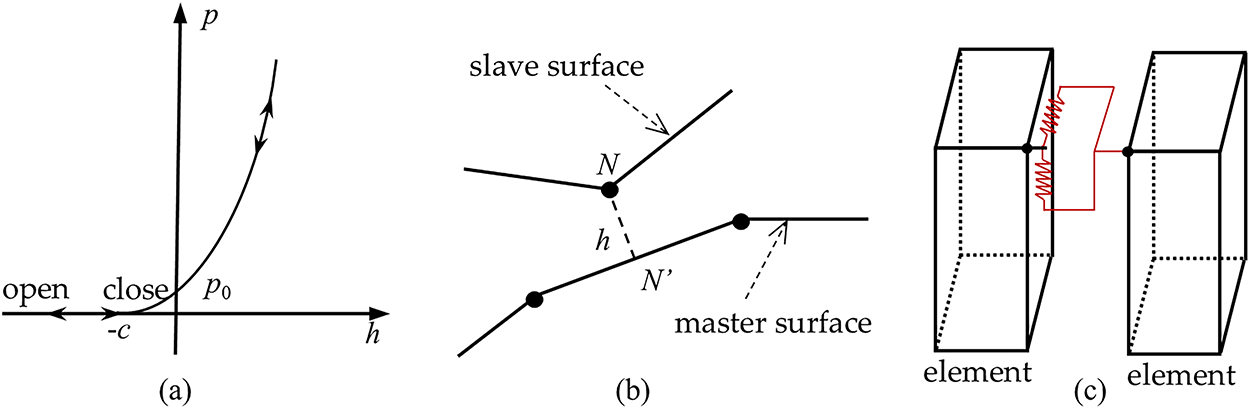
Figure 7: Normal contact-spring model: (a) the curve of contact force and embedding distance; (b) the master-slave contact pair; (c) springs setting
During the calculation process of the numerical model, the concrete plastic damage model is directly applied to the constitutive relations of the elements. Therefore, all elements in the dam body portion utilize this nonlinear damage constitutive relationship. Additionally, the contact spring model for the transverse joints exists only at the connections between two dam sections. The spring model is applied to corresponding pairs of nodes that belong to different dam sections but are in close proximity, while the contact model is applied to coincident surfaces belonging to the two adjacent dam sections.
For the seismic damage analysis of the arch dam, the input seismic load is derived from the recorded Koyna earthquake. The computational loads include the self-weight of the dam body, upstream hydrostatic pressure, and seismic dynamic load. For the calculation of self-weight and hydrostatic pressure loads, fixed boundaries are applied with full constraints at the bottom boundary and normal constraints at the side boundaries of the model. The water load of dam includes hydrostatic pressure and hydrodynamic pressure. The normal water level is 91 m. The hydrostatic force is directly set according to the triangular distribution load, and the hydrodynamic pressure is calculated using the Westergaard additional mass method as below:
where
The radiation damping of the foundation is simulated using viscoelastic artificial boundaries, while the damping of the dam body is considered in the form of proportional damping as follows:
where, M and K are the mass matrix and stiffness matrix of the dam body, respectively. α and β are the mass proportional coefficient and stiffness proportional coefficient, respectively. ξ is the damping ratio, which is set as 5%. f1 and f2 are selected as the 1st and 10th natural circular frequencies of the dam-foundation system model, respectively.
Prior to its application, the main frequency distributions are confirmed to cover the first 6 order modes of the dam. The amplitude of the Koyna seismic load is maintained at its original recorded value, forgoing baseline correction to preserve its inherent measured characteristics. The time-history curves and frequency distributions of the seismic load are presented in Fig. 8, with a total duration of 10 s. The absolute peak ground accelerations reached 0.47 and 0.31 g in the horizontal and vertical directions, respectively.
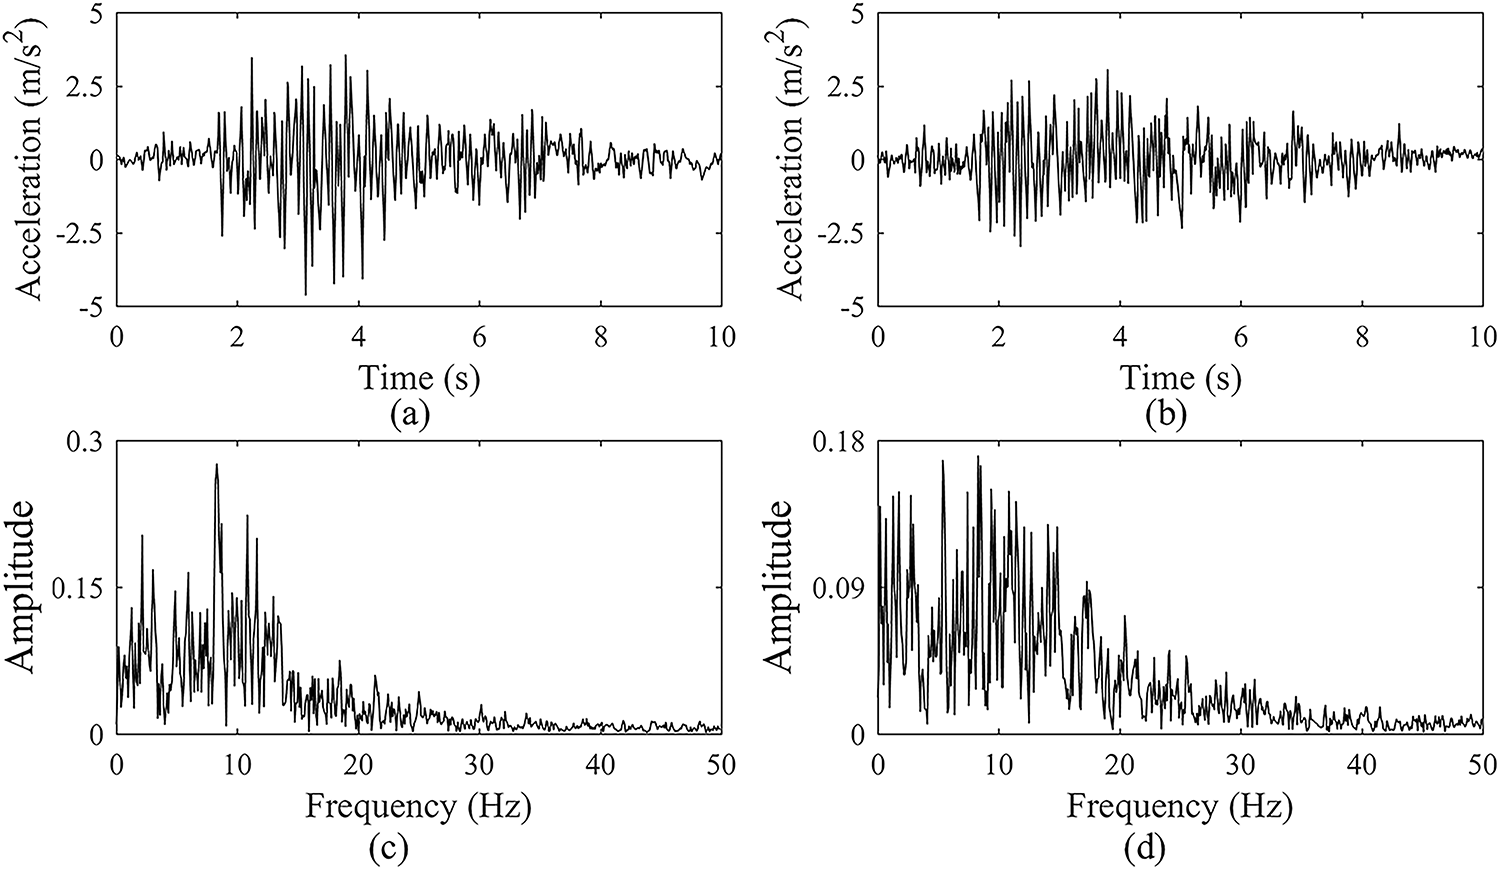
Figure 8: The Koyna seismic time-history accelerations: (a) component 1 in time domain; (b) component 2 in time domain; (c) component 1 in frequency domain; (d) component 2 in frequency domain
During the numerical simulation, the maximum time step is set to 0.01 s. If convergence cannot be achieved with a time step of 0.01 s, the program will automatically reduce the step size to half of the current value of time step for solution. The damage distributions induced by tensile stress on the upstream and downstream faces of the dam, as well as on the cross-sections of the dam sections at different time instants, are shown in Fig. 9, where the damage degree ranges from 0 to 1. At 1 s, no damage is observed on the downstream face, while slight damage appears at the dam heel. By 4 s, significant damage develops in the middle-upper region of the upstream face, particularly in dam Sections 7 and 8, extending inward to approximately half of the dam thickness. Compared to the 1 s condition, the damage at the dam heel also progresses further. At 7 s, the damage in the upper part of the dam remains relatively unchanged, whereas the damage degree at the dam heel increases noticeably. By 10 s, the damage at the dam heel shows little variation, but extensive damage emerges on the downstream face. The cross-sectional views of dam Sections 6–9 reveal the presence of downstream damage.
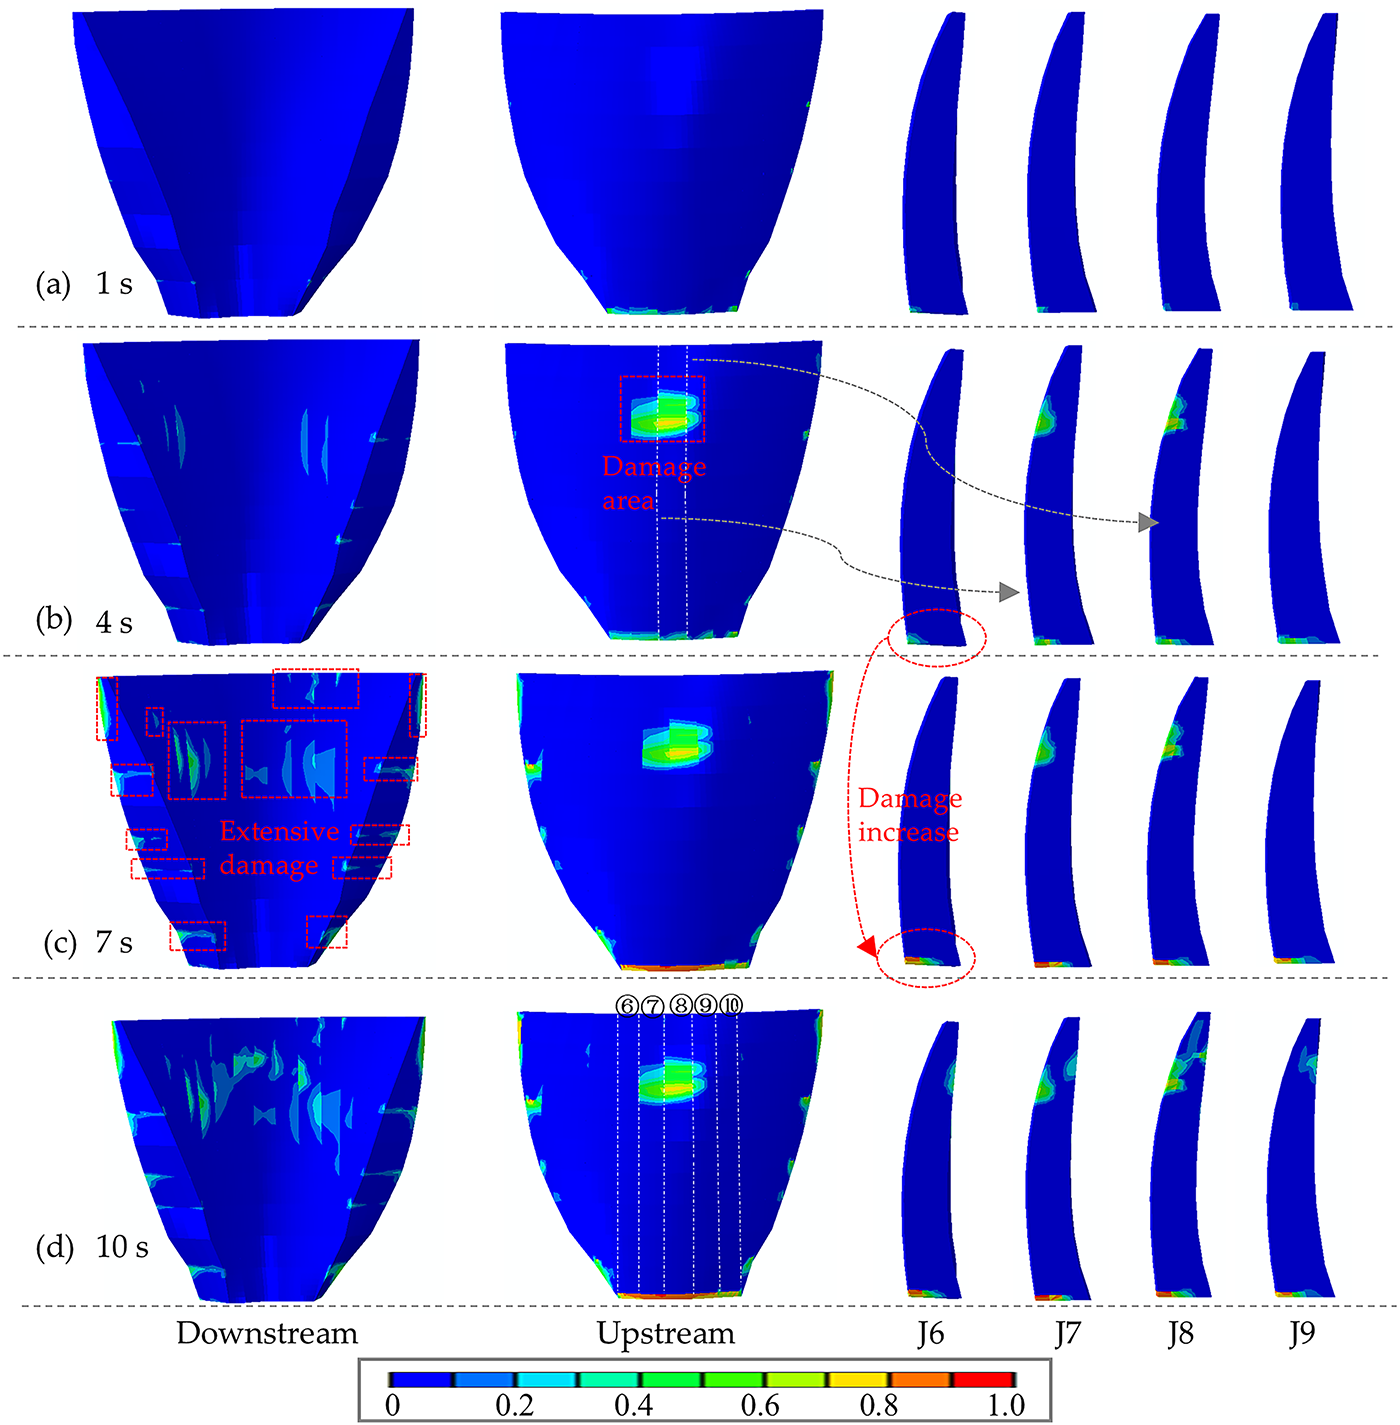
Figure 9: Damage distributions induced by tensile stress of the arch dam body
The damage dissipation energy curve of the arch dam caused by seismic-induced damage is shown in Fig. 10. Throughout the seismic excitation, the growth of damage dissipation energy primarily occurs in three distinct period: period 1 (0–3.64 s), period 2 (3.64–6.94 s), and period 3 (6.94–10 s). The energy accumulation is relatively modest in periods 1 and 3, while period 2 exhibits significantly greater growth. The damage distribution diagram at 4 s after the first stage (Fig. 6b) reveals that the dam evolved from an undamaged state to a condition with apparent damage during this period. The damage distribution diagram at the 7 s after the first stage (Fig. 6c) reveals that the dam subsequently progressed from apparent to severe damage during this period. Notably, the most rapid increase in damage dissipation energy occurs around 6.90 s, indicating accelerated damage progression at this instant. The final cumulative damage dissipation energy of the dam body reaches 12.36 × 10³ kN·m. The damage dissipation energy in the arch dam shows a sustained upward trend during the earthquake, interrupted only by short intervals of stability. This phenomenon originates from the model’s consideration of multiple dam blocks and transverse joints, allowing the continuous seismic excitation to progressively drive damage evolution across the various dam sections.
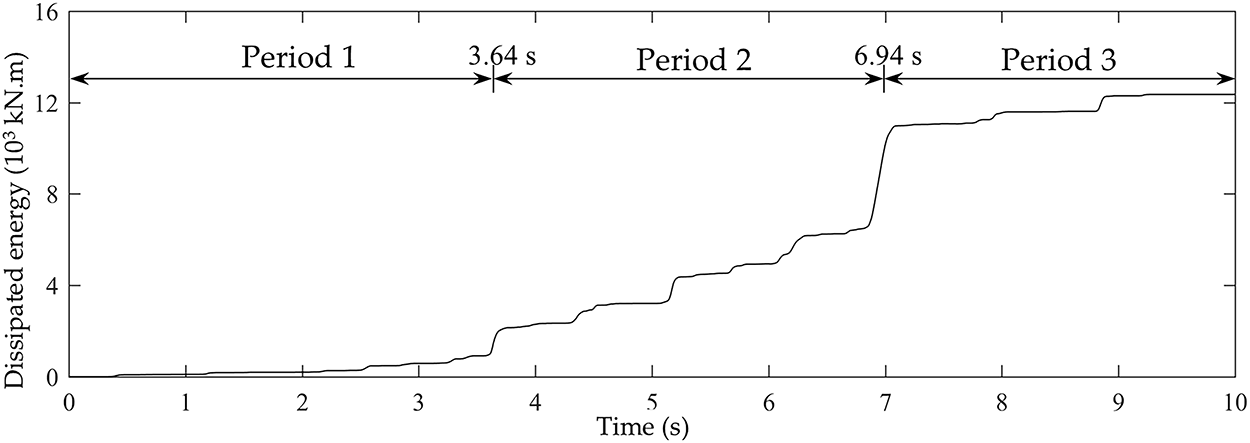
Figure 10: Damage dissipation energy of the arch dam
As shown in Fig. 11, the maximum principal stress distributions of the arch dam before and after two critical time instants (3.65 and 7.80 s) during the seismic action are extracted to illustrate the stress evolution characteristics. To simultaneously visualize the deformation patterns of all dam sections, the structural deformations are magnified by 300 times their actual values in the plots. At 3.55 s, most transverse joints remain closed, and the stress distribution along the dam height appears relatively uniform. By 3.65 s, the central dam sections exhibit downstream displacement, with significantly elevated maximum principal stresses observed on the upstream face of these sections. This tensile stress concentration subsequently leads to the damage development shown in Fig. 6b. At 3.75 s, the maximum principal stresses on the upstream face of damaged sections are notably released, while undamaged sections maintain relatively high stress levels. The 7.80 s time instant reveals a concentrated zone with maximum principal stresses exceeding 2 MPa in the central dam region, which correlates with the damage initiation depicted in Fig. 9d. By 7.90 s, as damage progresses and the deformed central dam sections partially recover, the maximum principal stresses demonstrate significant reduction compared to adjacent undamaged sections.
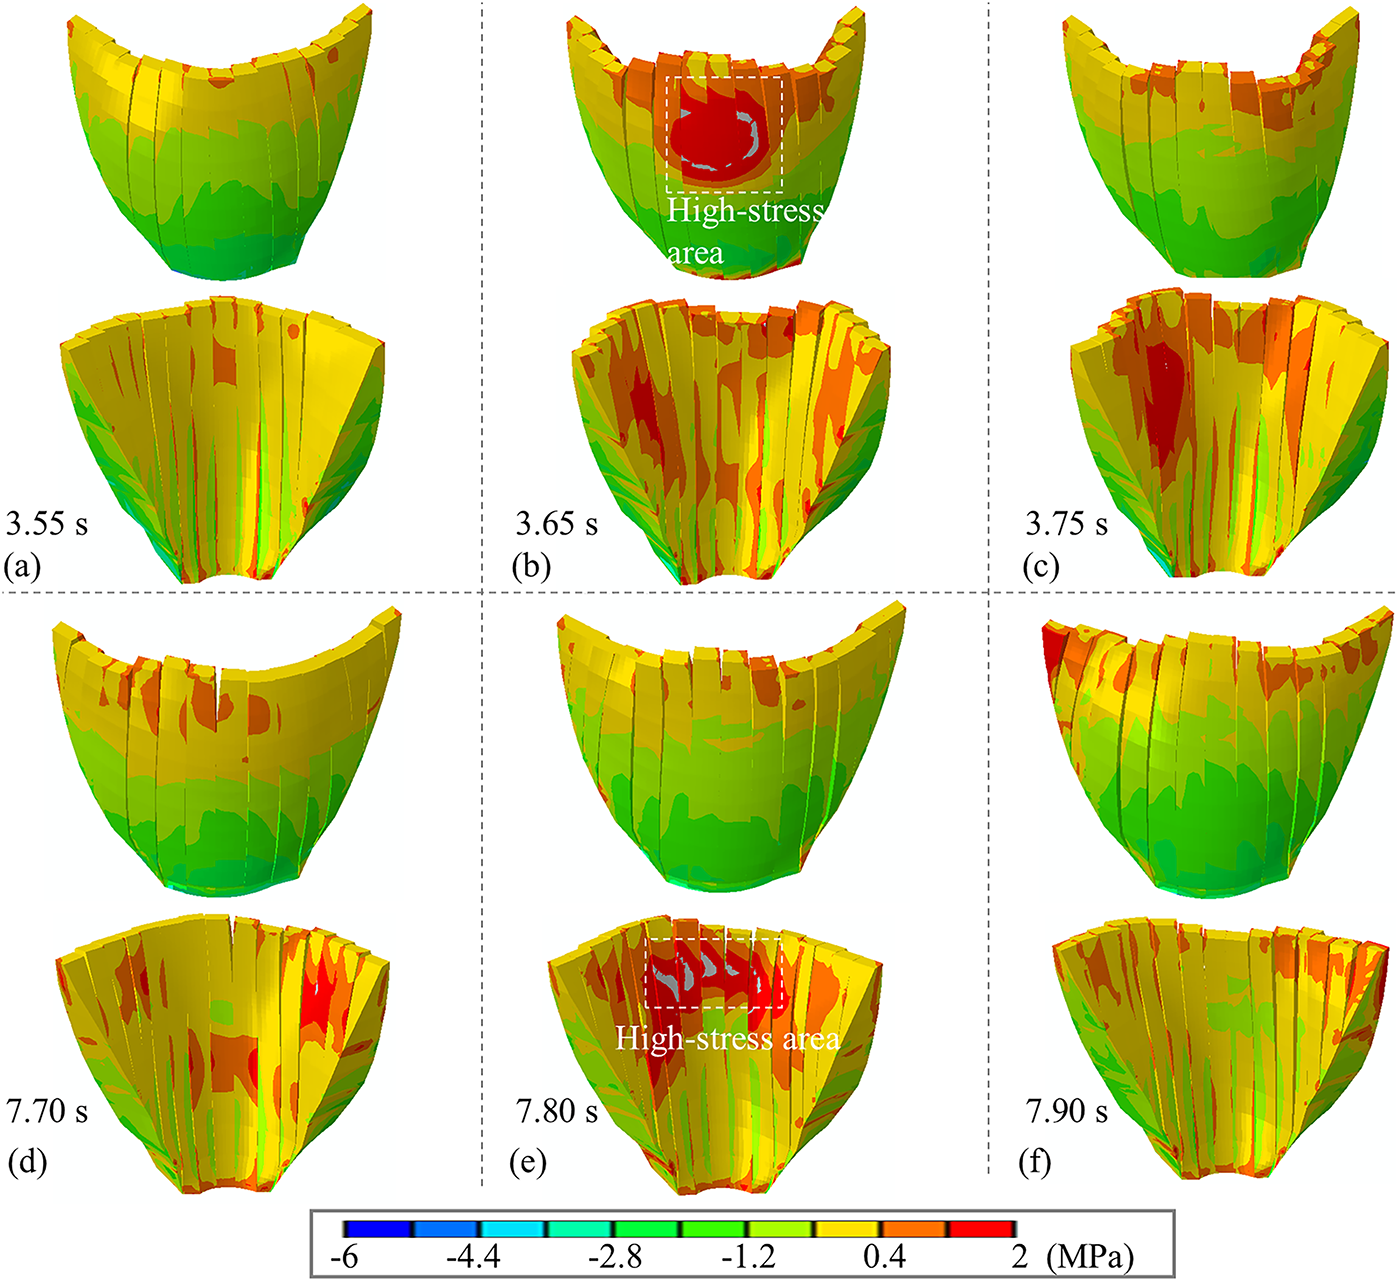
Figure 11: Maximum principal stress distributions of the arch dam
The behavior of transverse joints between the significantly damaged central dam sections merits thorough examination, for which a scaled seismic load with reduced intensity (peak acceleration of 0.19 g) is generated by attenuating the original Koyna seismic load (peak acceleration 0.47 g) to 2/5 of its initial magnitude. Fig. 12 presents the normal opening and tangential sliding displacements of joints 6–9 at the dam crest under both seismic load cases, revealing that joint opening displacements consistently and substantially exceed sliding displacements during seismic action. Under the Koyna seismic load, joint 7 exhibits maximum opening of 20.67 mm at 9.27 s while joint 9 exhibits maximum sliding of 5.64 mm at 7.08 s; corresponding values for the scaled load are 4.07 mm opening at joint 7 (9.21 s) and 3.41 mm sliding at joint 9 (7.07 s). Notably, although the Koyna load’s intensity is merely 2.5 times greater than the scaled load, the resulting joint openings demonstrate a disproportionate increase (approximately 5 times). The significant nonlinear behavior induced by strong seismic actions is exhibited by the most critical responses while maintaining similar response timing between load cases despite amplitude differences. Therefore, the quantitation of the nonlinear scaling relationship between seismic intensity and joint response has important implications for seismic safety evaluation of arch dams.
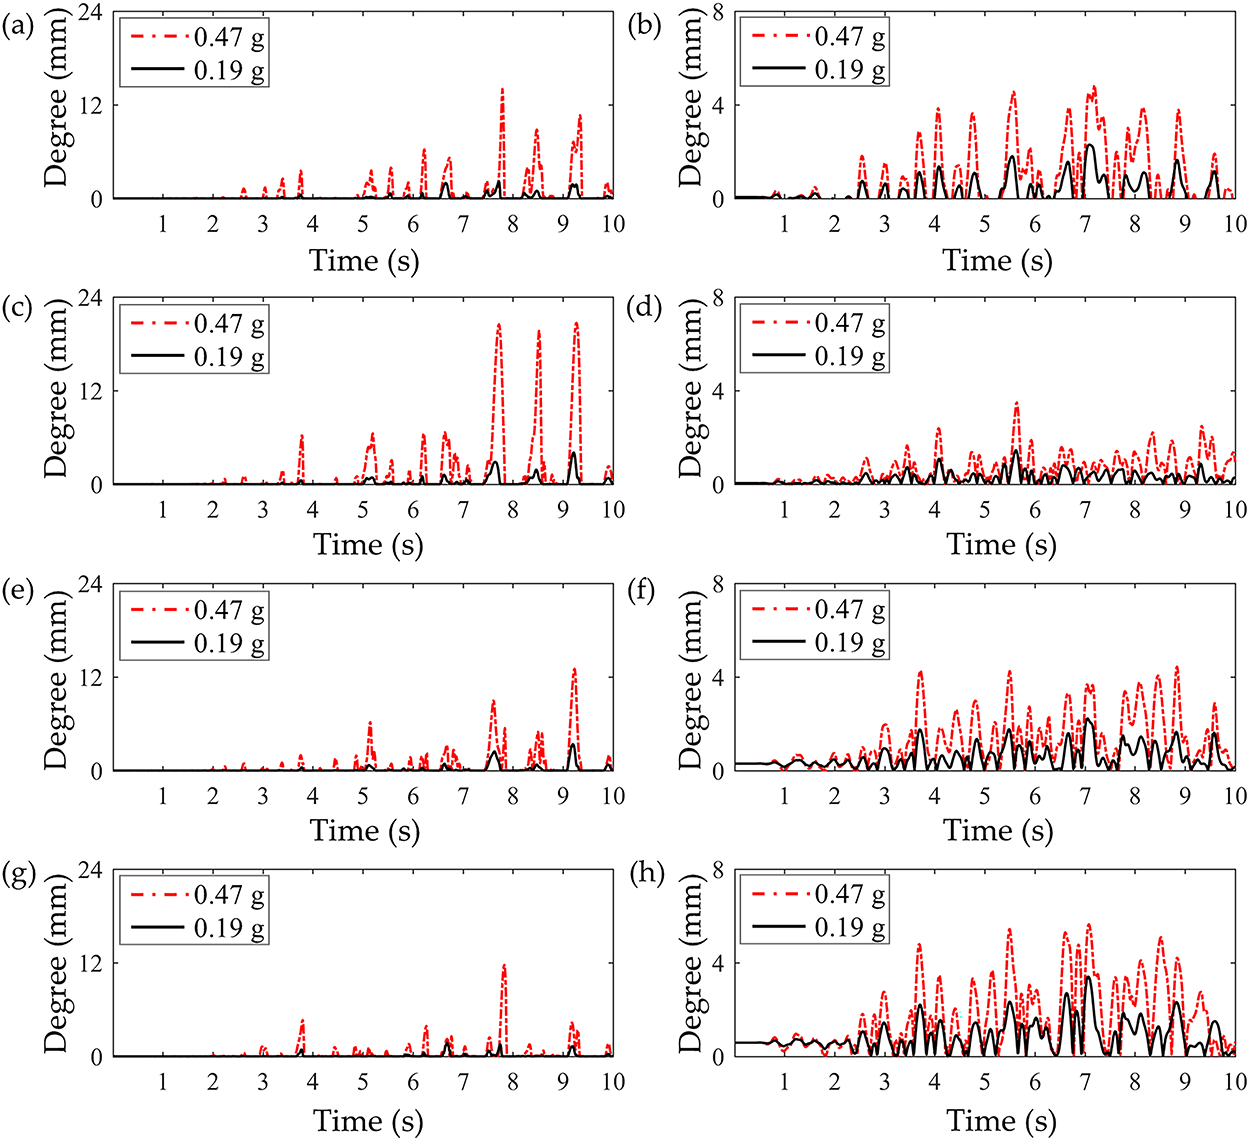
Figure 12: Relative displacements of the transverse joints at dam crest: (a) opening of joint 6; (b) sliding of joint 6; (c) opening of joint 7; (d) sliding of joint 7; (e) opening of joint 8; (f) sliding of joint 8; (g) opening of joint 9; (h) sliding of joint 9
As shown in Fig. 13, the acceleration responses at the dam crest of Sections 6–9 under two seismic load cases are extracted. When the scaled seismic load is applied, the maximum amplitude of the acceleration responses for the four sections is approximately 0.5 g. However, under the Koyna seismic load, the peak acceleration responses of Sections 6, 7 reach about 3 g, indicating significant nonlinear dynamic behavior of the arch dam. Under the Koyna seismic load, such high acceleration peaks occurred multiple times, each with a short duration. This phenomenon is primarily attributed to the repeated opening and closing of transverse joints in the arch dam induced by seismic action. The sudden impact during the closure of adjacent separated sections led to abrupt increases in acceleration responses. Therefore, these short-duration impulsive characteristics of acceleration responses can serve as dynamic indicators of damage in transverse joints of arch dams.
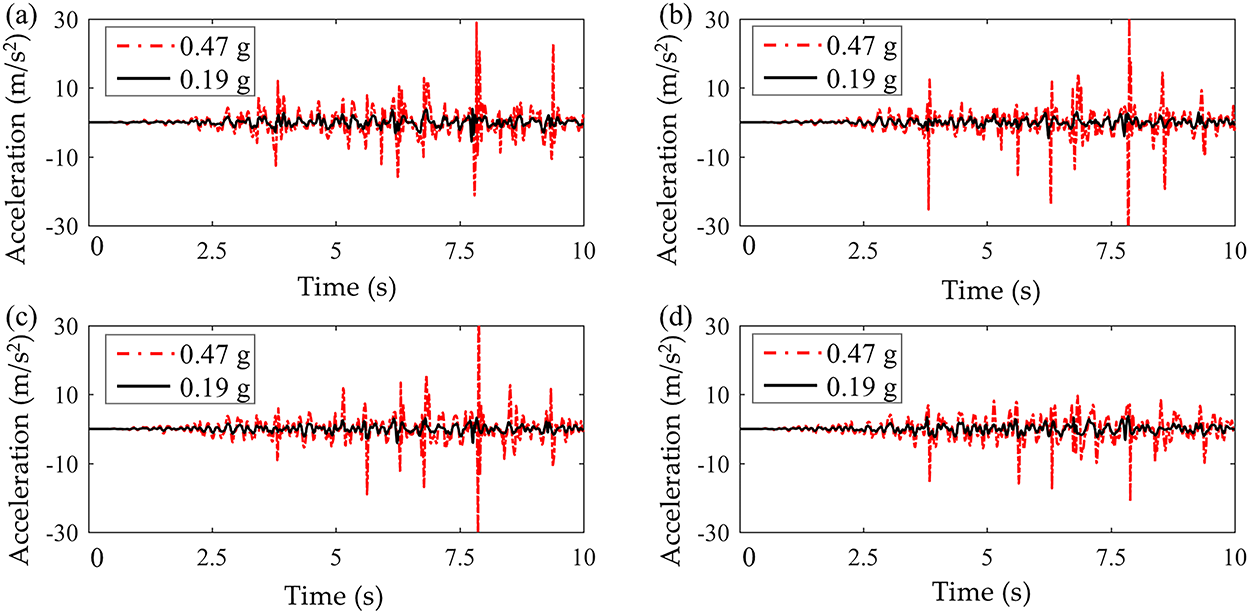
Figure 13: Accelerations of dam crest: (a) Section 6; (b) Section 7; (c) Section 8; (d) Section 9
In addition to the Koyna load, three different seismic loads are selected from the PEER database, namely the RSN1126, RSN1752, and RSN2003 seismic loads. Fig. 14 shows the acceleration time-history curves of the seismic loads. To ensure comparability, the peak acceleration of the three seismic loads is set to 0.33 g, with a duration of 20 s for each. Calculations reveal that although the Koyna seismic load has the shortest duration, it exhibits the highest Arias intensity of 1.2 m/s. The Arias intensities of the RSN1126 and RSN1752 seismic loads are approximately 0.7 m/s, while the RSN2003 seismic load has the smallest Arias intensity, about 0.3 m/s.
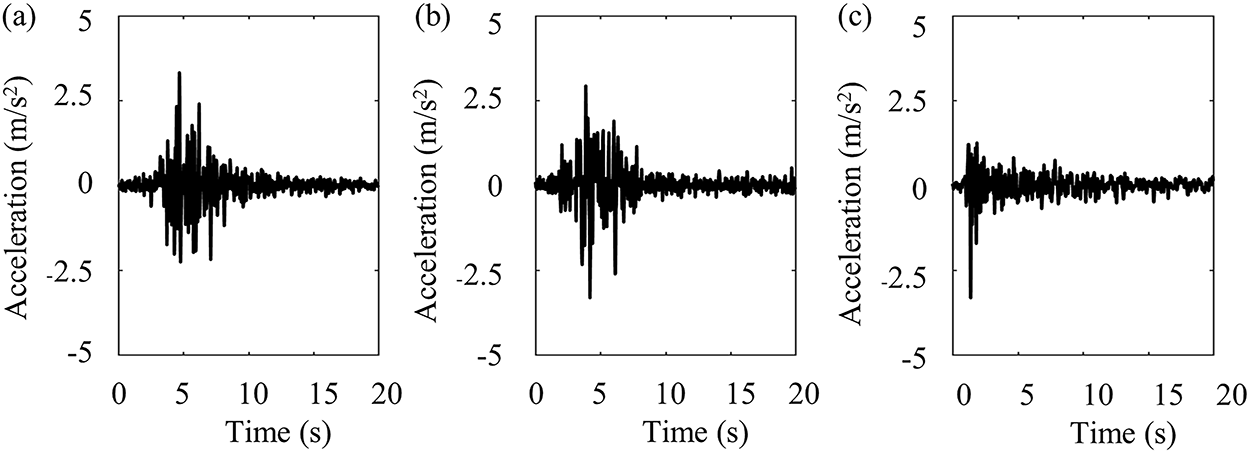
Figure 14: Seismic loads: (a) RSN1126 acceleration; (b) RSN1752 acceleration; (c) RSN2003 acceleration
The time-frequency distribution coefficients of the seismic loads are shown in Fig. 15. The maximum peak of the Koyna seismic load occurs at 3.13 s and 9.3 Hz, that of the RSN1126 seismic load occurs at 5.73 s and 5.45 Hz, that of the RSN1752 seismic load occurs at 3.86 s and 5.10 Hz, and that of the RSN2003 seismic load occurs at 1.42 s and 7.90 Hz.
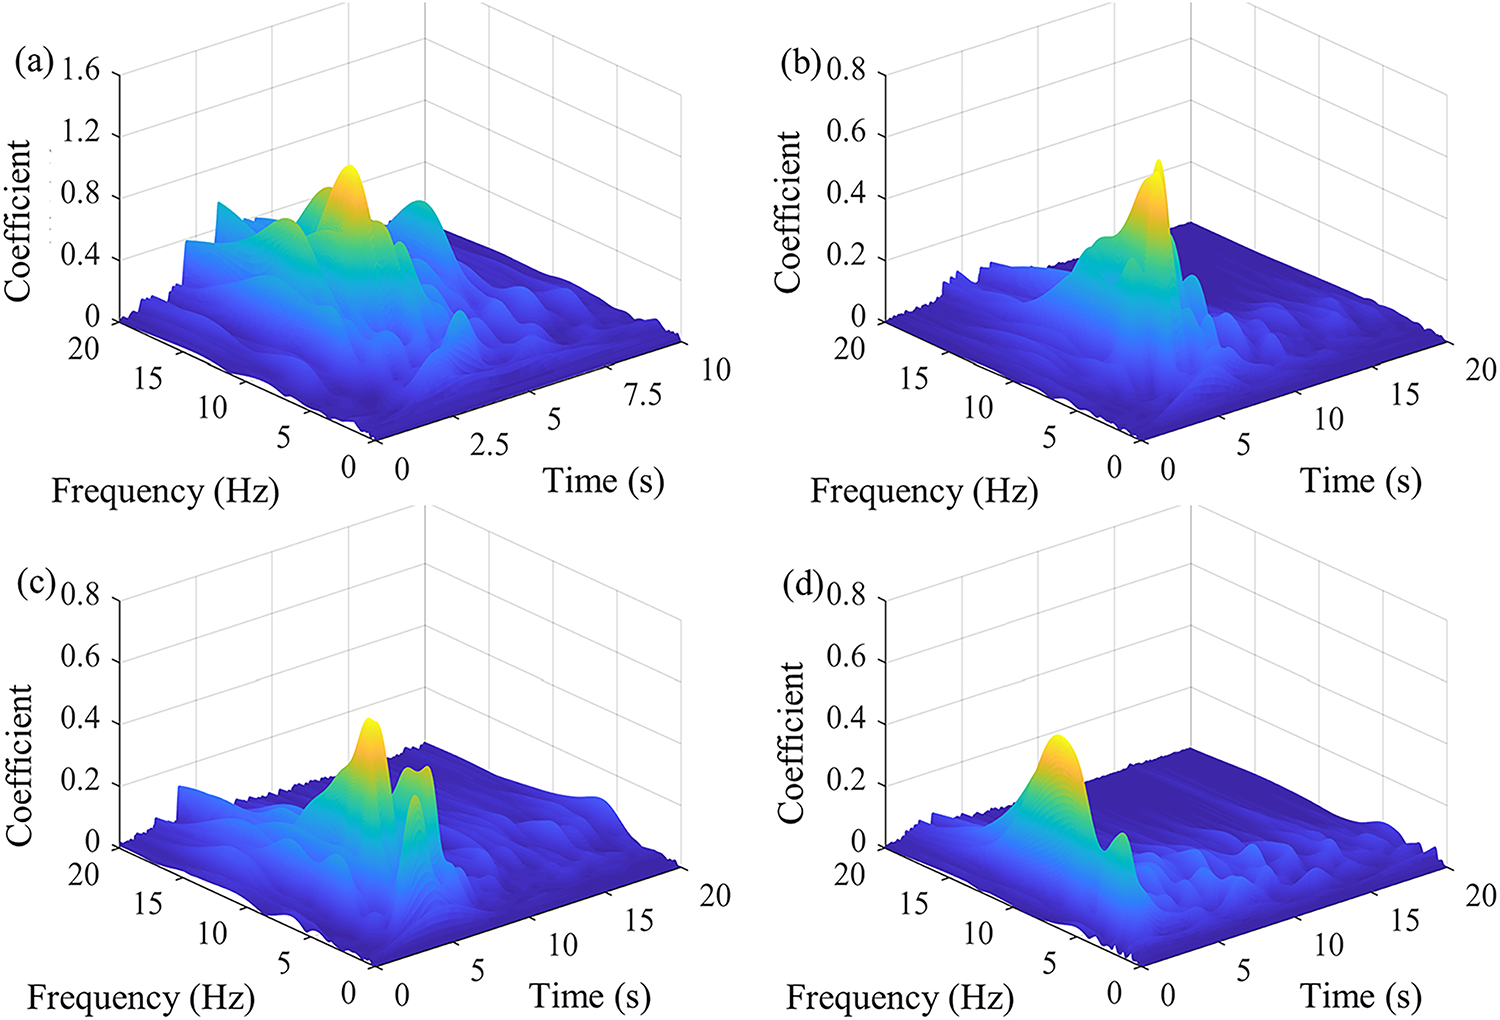
Figure 15: Time-frequency distributions of seismic loads: (a) Koyna; (b) RSN1126; (c) RSN1752; (d) RSN2003
Taking the damage distribution on the upstream face of the dam as an example, the damage distribution is shown in Fig. 16. The damage caused by the RSN1126 seismic load is the smallest, while the damage from the RSN1752 seismic load is slightly greater than that caused by the Koyna seismic load. In contrast, the RSN2003 seismic load results in the most severe damage. This indicates that although the RSN2003 seismic load has the smallest Arias intensity, it causes the most significant damage. Conversely, the Koyna seismic load, with the highest Arias intensity, results in relatively minor damage. This demonstrates the limitations of the traditional Arias intensity index in characterizing the relationship between seismic load intensity and the severity of dam damage. Under different seismic loads, the most severely damaged location of the dam remains the same, specifically the upper part of the central dam section.
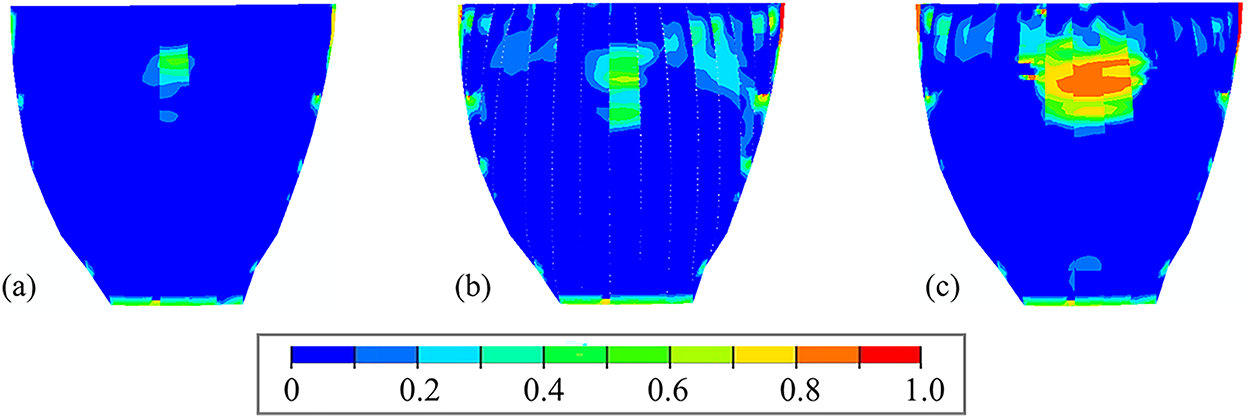
Figure 16: Upstream damage distributions of arch dam: (a) RSN1126, (b) RSN1752, (c) RSN2003
4 Shaking Table Tests on the Arch Dam Model
4.1 Experimental Setup and Instrumentation
For model tests investigating the entire failure process of structures, it is essential to consider both the dynamic characteristics during the elastic stage and the failure modes as well as mechanical behaviors during the failure stage. Therefore, such model tests must satisfy multiple unidirectional force similarity conditions, namely, the simultaneous similarity of elastic force and gravity to inertial force. In concrete dam model tests, the geometric scale typically ranges between 100 and 300, and the elastic force-gravity similarity criterion is adopted. Since the density scale of sand-cement-based similar materials is comparable to that of prototype concrete, it is necessary to prepare model materials with an elastic modulus scale of 1:100 to 1:300. Given that the elastic modulus of ordinary concrete is approximately 30,000 MPa, the elastic modulus of the similar model materials should fall within the range of 100 to 300 MPa.
The prototype of the arch dam is a double-curvature arch dam with a height of 135 m. Designed at a geometric scale of 1:100, the number of transverse joints is simplified to three in the model. The mass mix ratio parameters of the model material are barite sand:barite powder:fly ash:cement:water = 14:4.48:0.5:0.28:2.4. The compressive strength, splitting tensile strength, dynamic elastic modulus, and density of the model material are 0.45, 0.03, 341 MPa, and 2280 kg/m3, respectively. The arch dam model is manufactured according to the model dimension diagram shown in Fig. 17.
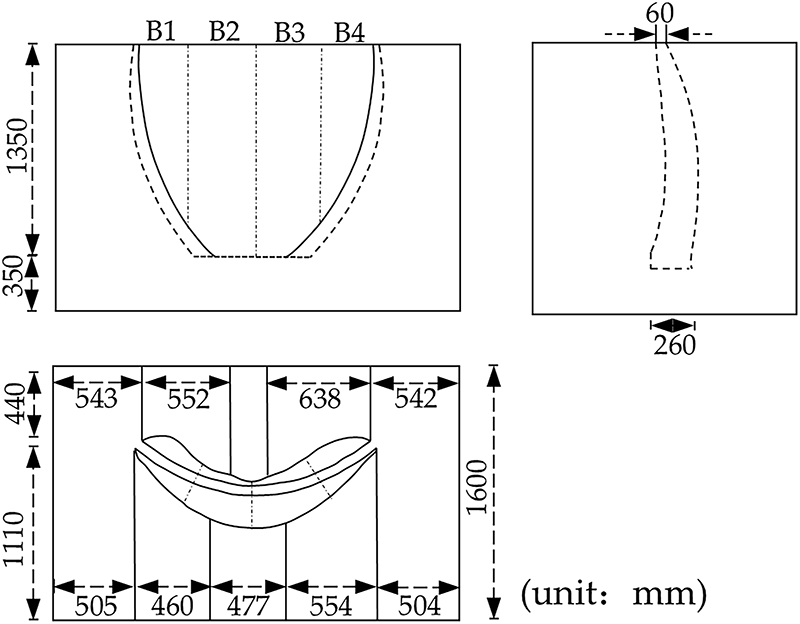
Figure 17: Dimensions of the scaled arch dam
The performance parameters of the model material consider compressive strength, tensile strength, dynamic elastic modulus, and density, with dynamic elastic modulus and density being the preferred parameters. The tensile strength is measured through the splitting tensile process of cylindrical specimens, while the compressive strength is obtained from the uniaxial compression process of cube specimens. For the dynamic elastic modulus test, a cantilever beam specimen with a side length of 50 mm and a height of 500 mm is used (see Fig. 18). The base of the beam is bonded to the foundation using 302 modified acrylic adhesives, and an accelerometer is attached to the free end of the beam. The dynamic elastic modulus is calculated as follows:
where,
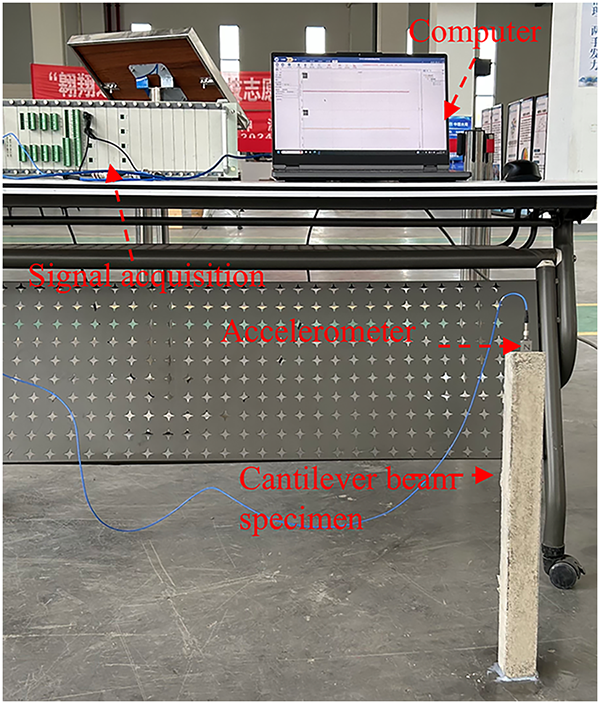
Figure 18: Testing of dynamic elastic modulus
The consideration of transverse joints in the model is primarily addressed through phased pouring, with the details as follows: (1) support the dam formwork on the foundation of the rock mass section; (2) pour and compact the model material for dam block 1 (B1) and dam block 3 (B3); (3) after a 3-day interval, pour dam block 2 (B2) and dam block 4 (B4); (4) keep the model under standard laboratory conditions for 7 days before removing the formwork; (5) after demolding, still keep the model under standard laboratory conditions for another 7 days, then hoist it onto the shaking table. Three contact surfaces are formed between the four dam sections by using two-stage pouring, thereby accounting for the objectively weak zones of the transverse joints in the arch dam. However, it should be noted that due to experimental constraints, only three transverse joints are simulated in this test, whereas actual arch dams contain a greater number of transverse joints.
As shown in Fig. 19, the arch dam model is equipped with two measurement systems on the upstream and downstream sides: an electrical measurement system based on accelerometers and dynamic signal acquisition instruments, and an optical measurement system based on binocular cameras and digital image correlation (DIC) technology. The accelerometers used are IEPE-type sensors (models 1A314E and 1A731E) produced by Jiangsu Donghua Testing Technology Co., Ltd., with a measurement range of 50 g and a sensitivity coefficient of 10 mV/(m/s2). The acceleration signals are acquired using a 64-channel dynamic signal acquisition system manufactured from DEWETRON. The seismic damage process and dynamic signal acquisition during the simulated earthquake are acquired using a high-speed camera from PHANTOM, combined with DIC analysis software developed by Correli STC.
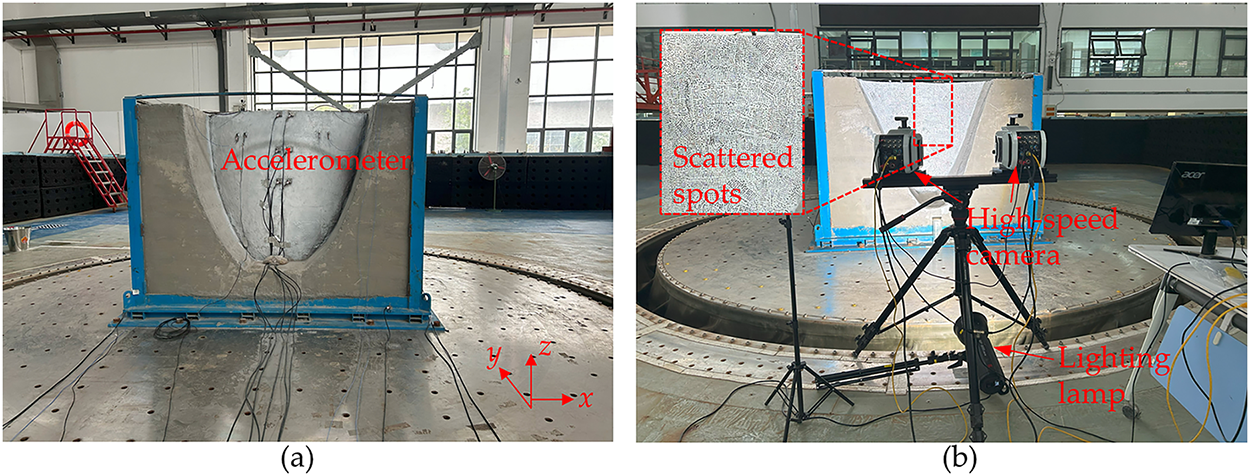
Figure 19: Measuring systems of arch dam model: (a) electrical measurement system, (b) optical measurement system
The optical measurement system is arranged on the downstream face of the model, while the electrical measurement system is installed on the upstream face, both configured with a sampling frequency of 2000 Hz. Generally, shaking table tests can generate vibration frequencies ranging from 50 to 200 Hz. However, since this experiment focuses on the nonlinear dynamic response of the model induced by secondary vibrations under seismic action, the sampling frequency is set at a relatively high value. The two measurement systems are not synchronized during the experiment but are aligned post-acquisition based on timestamps. The speckle pattern is created by rolling a roller over the model surface, with each speckle occupying approximately 5 pixels in the image.
The seismic excitations applied to the arch dam model are sequentially listed in Table 2 according to the application order. The artificial seismic excitations are primarily used to induce damage in the model, with their amplitudes progressively increasing in subsequent loadings to validate the previously described short-duration high-frequency characteristics during transverse joint closure. Taking case 1 as an example, the artificial seismic excitation employed is shown in Fig. 20. According to the similitude law of elasticity-gravity, the scale factor for gravitational acceleration is 1:1, while the time scale is the square root of the geometric scale, resulting in a time scale of 1:10. In such large-scale model tests, selecting actual seismic loads typically lasting 5–10 s and compressing them to one-tenth of their original duration is impractical, which imposes high demands on the performance of the shaking table. Therefore, this experiment employs an artificially simulated seismic load. The duration of the artificial seismic excitation is 7.5 s, and it exhibits a broad frequency distribution with significant energy content across the 0–200 Hz range, thereby ensuring sufficiently destructive effects on the scaled model. This seismic excitation corresponds to a realistic duration of 75 s, and its frequency couples with the model’s characteristic frequencies. Thus, it must be interpreted as a highly destructive, prolonged seismic event.
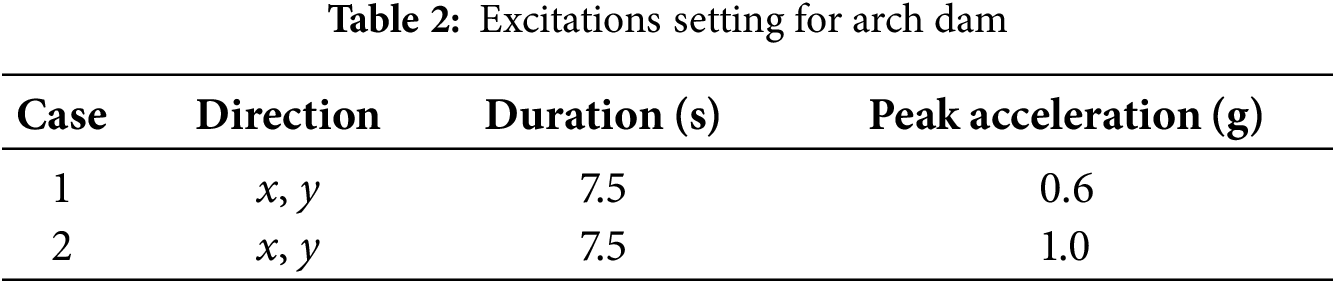
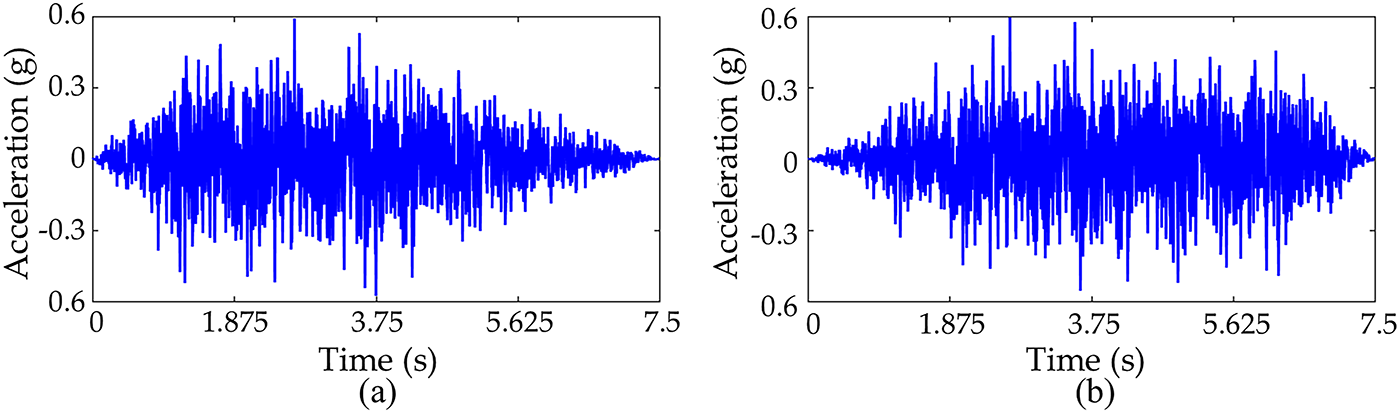
Figure 20: Seismic excitations of arch dam: (a) x-direction, (b) y-direction
It should be noted that the shaking table model test only considers the seismic effects under empty reservoir conditions, neglecting the influence of water pressure. This is because the water tank used in the shaking table is of a surrounding type, which cannot effectively simulate the water level difference between the upstream and downstream of the arch dam. Such a simplification may lead to the following consequences: (1) Under empty reservoir conditions, the absence of the additional mass effect of water results in a systematically higher measured natural frequency of the dam model, with a more pronounced impact on higher-order modes. (2) In real scenario, the static water pressure from the upstream reservoir restrains the opening of transverse joints on the upstream face. However, whether the dynamic water pressure exacerbates or mitigates the damage remains a subject without consensus in the academic community. Fortunately, this experiment does not specifically focus on the exact numerical values of the dam model’s response or the magnitude of transverse joint opening. Instead, it places greater emphasis on verifying the presence of the open-close dynamic characteristics and the high-frequency impact response.
During the arch dam test, significant cracking is observed at the transverse joints under loading case 2. The displacement field and strain field (Green-Lagrange strain) on the downstream surface of the arch dam model are calculated using DIC technology. Fig. 21 presents the displacement field, maximum principal strain field, and y-direction strain field at 1.946 s during the application of case 2. The displacement field reveals incoherent deformation among different dam sections, with pronounced discontinuities between the central two monoliths and the side monoliths. The distribution of maximum principal strain is consistent with these displacement discontinuities. Meanwhile, the y-direction strain exhibits higher magnitudes in the lower portions of the monoliths, indicating that the separation between monoliths causes stress redistribution toward the beam ends. The experimental results demonstrate that the transverse joints of the arch dam are prone to dynamic opening-closing behavior under seismic loading. Once the joints open, stresses in the dam body tend to transfer toward the beam ends.
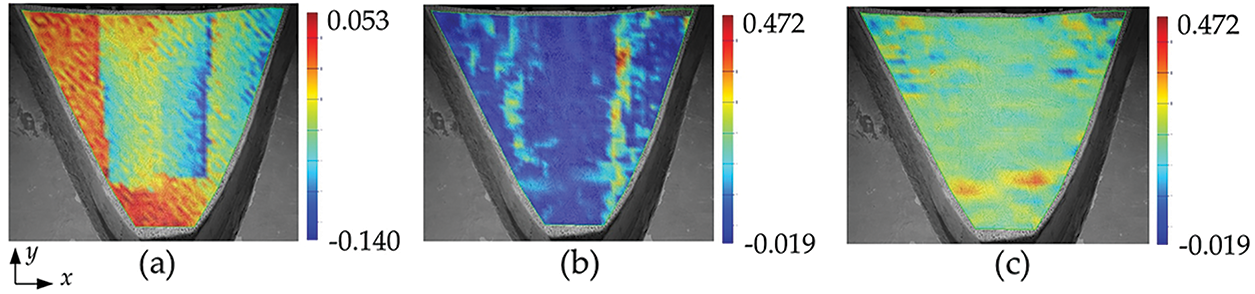
Figure 21: Damage characteristics of arch dam: (a) displacement; (b) maximum principal strain; (c) y direction strain
As shown in Fig. 22, the peak acceleration response of the dam body reaches up to 6 g under case 2, whereas the acceleration response generally remains below 1.5 g in case 1. This significant amplification is attributed to the opening-closing behavior of transverse joints observed in case 2. During dynamic loading, when the opened joints suddenly close under impact forces, rapid collision and compression occur between adjacent dam monoliths, resulting in substantially amplified acceleration responses. This phenomenon experimentally validates the numerical simulation findings that the transverse joints of arch dams exhibit dynamic opening-closing behavior, and that joint closure can induce considerable impact effects.
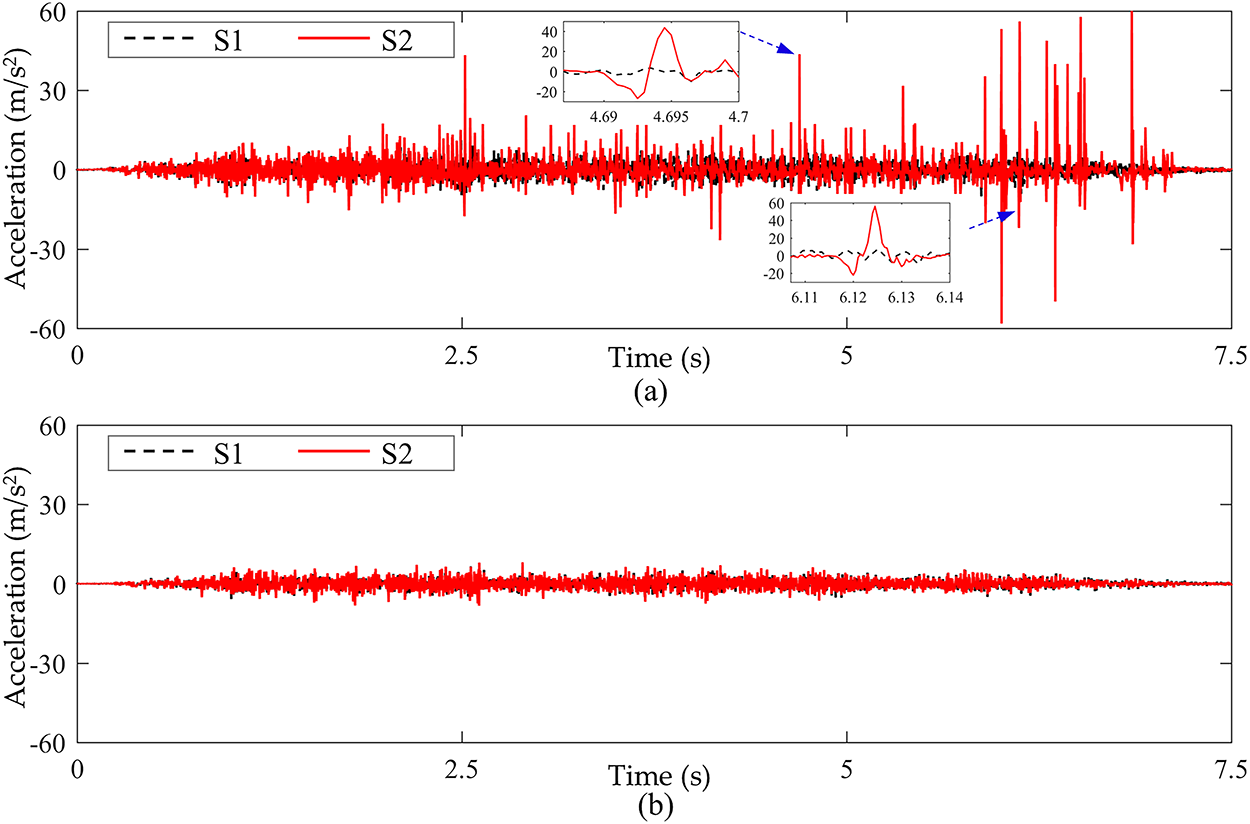
Figure 22: Damage response characteristics: (a) case 2; (b) case 1
The current experimental model only incorporates three transverse joints, which has a significant simplification compared to actual arch dams that typically contain a greater number of joints. While the observed phenomena including joint opening-closing, discontinuous deformation, and acceleration amplification effectively capture essential nonlinear dynamic behaviors, this simplification may influence the quantitative aspects of the global response of the dam. A reduced number of joints could potentially alter the distribution and progression of dynamic energy dissipation across the dam body, possibly leading to an over-concentration of damage and displacement localization in the model.
This study conducts the seismic damage evolution analysis and dynamic characteristics extraction of concrete arch dams under seismic action based on numerical simulation and shaking table test. The distinctive aspect of this study lies in its focus on the opening and closing behavior between dam sections under strong seismic excitation, and in its characterization of this phenomenon through dynamic response analysis. The numerical analysis focuses on the damage evolution mechanism, energy dissipation process, stress distribution patterns, and dynamic response characteristics of the arch dam under seismic action. Based on high-speed cameras and three-dimensional digital image correlation, optical measurement technique offers a novel perspective for conducting traditional dynamic model tests. The primary advantage lies in the ability to capture the full-field response of the model. The main conclusions of this study can be drawn as follows:
(1) Damage on the upstream face of the arch dam is primarily concentrated in the upper portion of the central dam sections and the dam heel, whereas downstream damage is distributed across multiple sections.
(2) Under seismic loads with peak accelerations of 0.47 and 0.19 g, the maximum joint openings of the transverse joints are measured at 20.67 and 4.07 mm, respectively.
(3) The opening of joints reduces the load-sharing capacity between dam sections, leading to elevated stress levels within individual sections. In contract, joint closure induces transient impact characteristics in the dynamic response of the arch dam and results in dynamic responses that significantly exceed normal levels.
The opening-closing behavior and its corresponding high-frequency response characteristics can provide insights for damage identification in arch dam transverse joints. Utilizing these characteristics for damage detection represents a self-consistent approach, as the seismic action serves both as the load inducing the damage and as the excitation condition that activates the nonlinear dynamic response.
Acknowledgement: Not applicable.
Funding Statement: This research was supported by the Fundamental Research Funds for the Central Universities (No. B250201286), the Jiangsu–Czech Bilateral Co-Funding R&D Project (No. BZ2023011), the Jiangsu School–Enterprise Cooperation R&D Project (No. 24880047-D01-001), the Anhui International Joint Research Center of Data Diagnosis and Smart Maintenance on Bridge Structures (No. 2021AHGHZD03), and the Key Research Project of Natural Science in Colleges and Universities of Anhui Province (No. 2024AH051404).
Author Contributions: Shuigen Hu: Methodology, Validation, Data curation, Writing—original draft preparation. Hao Wang: Investigation, Supervision, Writing—original draft preparation. Qingyang Wei: Software, Conceptualization, Writing—review and editing. Maosen Cao: Investigation, Writing—review and editing, Funding acquisition. Drahomír Novák: Project administration, Supervision, Writing—review and editing. All authors reviewed the results and approved the final version of the manuscript.
Availability of Data and Materials: The data that support the findings of this study are available from the corresponding author upon reasonable request.
Ethics Approval: Not applicable.
Conflicts of Interest: The authors declare no conflicts of interest to report regarding the present study.
References
1. Wei P, Lin P, Peng H, Yang Z, Qiao Y. Analysis of cracking mechanism of concrete galleries in a super high arch dam. Eng Struct. 2021;248:113227. doi:10.1016/j.engstruct.2021.113227. [Google Scholar] [CrossRef]
2. Wang R. Key technologies in the design and construction of 300 m ultra-high arch dams. Engineering. 2016;2(3):350–9. doi:10.1016/j.eng.2016.03.012. [Google Scholar] [CrossRef]
3. Chopra AK, Wang JT. Earthquake response of arch dams to spatially varying ground motion. Earthquake Eng Struct Dyn. 2010;39(8):887–906. doi:10.1002/eqe.974. [Google Scholar] [CrossRef]
4. He Z, Liu YR, Pan YW, Yang Q. Evaluating the safety of high arch dams with fractures based on numerical simulation and geomechanical model testing. Sci China Technol Sci. 2015;58:1648–59. doi:10.1007/s11431-015-5855-7. [Google Scholar] [CrossRef]
5. Chen H. Seismic safety analysis of tall concrete dams, investigation and insights on critical challenges. Earthq Eng Eng Vibrat. 2020;19(3):533–9. doi:10.1007/s11803-020-0578-6. [Google Scholar] [CrossRef]
6. Wang H, Li D. Experimental study of seismic overloading of large arch dam. Earthquake Eng Struct Dyn. 2006;35(2):199–216. [Google Scholar]
7. Donlon WP, Hall JF. Shaking table study of concrete gravity dam monoliths. Earthquake Eng Struct Dyn. 1991;20(8):769–86. doi:10.1002/eqe.4290200805. [Google Scholar] [CrossRef]
8. Wei Q, Cao M, Shen L, Qian X, Dunai L, Ostachowicz W. A novel DISTINCT method for characterizing breathing features of nonlinear damage in structures. Mech Syst Signal Process. 2023;196:110333. doi:10.1016/j.ymssp.2023.110333. [Google Scholar] [CrossRef]
9. Wei Q, Shen L, Cao M, Jiang Y, Qian X, Wang J. A novel method for identifying damage in transverse joints of arch dams from seismic responses based on the feature of local dynamic continuity interruption. Smart Mater Struct. 2023;32(5):055022. doi:10.1088/1361-665x/acc9f0. [Google Scholar] [CrossRef]
10. Zhang H, Song M, Shen L, Alkayem NF, Cao M. Discrete numerical study on Type II fracture of partially detached concrete panels in cold region. Struct Durab Health Monit. 2025;19(1):55–75. doi:10.32604/sdhm.2024.052869. [Google Scholar] [CrossRef]
11. Yin Y, Ren Q, Lei S, Zhou J, Xu L, Wang T. Mesoscopic crack pattern fractal dimension-based concrete damage identification. Eng Fract Mech. 2024;296:109829. doi:10.1016/j.engfracmech.2023.109829. [Google Scholar] [CrossRef]
12. Yun K, Wang Z, Ronald S, Pak Y. An advanced continuum damage mechanics model for predicting the crack progress process based on the consideration of the influence of crack direction under quasi-static load. Int J Mech Sci. 2017;130:487–96. doi:10.1016/j.ijmecsci.2017.05.021. [Google Scholar] [CrossRef]
13. Dougill JW, Lau JC, Burt NJ. Towards a theoretical model for progressive failure and softening in rock, concrete and similar materials. Mech Eng. 1976;102:333–55. [Google Scholar]
14. Løland KE. Continuous damage model for load-response estimation of concrete. Cem Concr Res. 1980;10(3):395–402. doi:10.1016/0008-8846(80)90115-5. [Google Scholar] [CrossRef]
15. Mazars J, Pijaudier-Cabot G. Continuum damage theory—application to concrete. J Eng Mech. 1989;115(2):345–65. doi:10.1061/(asce)0733-9399(1989)115:2(345). [Google Scholar] [CrossRef]
16. Cervera M, Oliver J, Faria R. Seismic evaluation of concrete dams via continuum damage models. Earthquake Eng Struct Dyn. 1995;24(9):1225–45. doi:10.1002/eqe.4290240905. [Google Scholar] [CrossRef]
17. Valliappan S, Yazdchi M, Khalili N. Seismic analysis of arch dams—a continuum damage mechanics approach. Int J Numer Methods Eng. 1999;45(11):1695–724. [Google Scholar]
18. Lee J, Fenves GL. Plastic-damage model for cyclic loading of concrete structures. J Eng Mech. 1998;124(8):892–900. [Google Scholar]
19. Zhang S, Wang G, Sa W. Damage evaluation of concrete gravity dams under mainshock–aftershock seismic sequences. Soil Dyn Earthq Eng. 2013;50:16–27. doi:10.1016/j.soildyn.2013.02.021. [Google Scholar] [CrossRef]
20. Xu L, Huang H, Yu H. Study on the influence of mainshock-aftershock sequences on the damage characteristics of gravity dams. North China Earthquake Sci. 2024;42(2):9–13. [Google Scholar]
21. Faria R, Oliver J, Cervera M. A strain-based plastic viscous-damage model for massive concrete structures. Int J Solids Struct. 1998;35(14):1533–58. doi:10.1016/s0020-7683(97)00119-4. [Google Scholar] [CrossRef]
22. Wang G, Wang Y, Lu W, Yu M, Wang C. Deterministic 3D seismic damage analysis of Guandi concrete gravity dam: a case study. Eng Struct. 2017;148:263–76. doi:10.1016/j.engstruct.2017.06.060. [Google Scholar] [CrossRef]
23. Hussein TS, kadir MAA, Alzabeebee S, Ramli MZ. Comprehensive reliability analysis of seismic stability for concrete gravity dams: a case study of pine flat dam. Transp Infrastruct Geotechnol. 2024;11(4):2186–220. doi:10.1007/s40515-023-00368-1. [Google Scholar] [CrossRef]
24. Hussein TS, Kadir MAA, Alzabeebee S, Keawsawasvong S, Ramli MZ, Al-Husseini TR. Robust seismic fragility curves for concrete gravity dams incorporating aleatory, epistemic, and fuzzy uncertainties. Structures. 2024;70:107688. doi:10.1016/j.istruc.2024.107688. [Google Scholar] [CrossRef]
25. Wei Q, Shen L, Dunai L, Kövesdi B, Elqudah S, Cao M. Quantitative evaluation on the effects of the spatial variability in concrete materials on seismic damage of concrete gravity dams. Eng Fract Mech. 2024;307:110287. doi:10.1016/j.engfracmech.2024.110287. [Google Scholar] [CrossRef]
26. Cen W-J, Wen L-S, Zhang Z-Q, Xiong K. Numerical simulation of seismic damage and cracking of concrete slabs of high concrete face rockfill dams. Water Sci Eng. 2016;9(3):205–11. doi:10.1016/j.wse.2016.09.001. [Google Scholar] [CrossRef]
27. Chen K, Pang R, Xu B. Stochastic dynamic response and seismic fragility analysis for high concrete face rockfill dams considering earthquake and parameter uncertainties. Soil Dyn Earthq Eng. 2023;167:107817. doi:10.1016/j.soildyn.2023.107817. [Google Scholar] [CrossRef]
28. Gorai S, Maity D. Seismic response of concrete gravity dams under near field and far field ground motions. Eng Struct. 2019;196:109292. doi:10.1016/j.engstruct.2019.109292. [Google Scholar] [CrossRef]
29. Hariri-Ardebili MA, Kianoush MR. Seismic analysis of a coupled dam-reservoir-foundation system considering pressure effects at opened joints. Struct Infrastruct Eng. 2015;11(7):833–50. doi:10.1080/15732479.2014.915857. [Google Scholar] [CrossRef]
30. Jin A, Qiu Y, Wang J. Comparison of seismic fragility analysis methods for arch dams. Earthq Eng Eng Vibrat. 2023;22(1):173–89. doi:10.1007/s11803-023-2164-1. [Google Scholar] [CrossRef]
31. Zeinizadeh A, Mirzabozorg H, Noorzad A, Amirpour A. Hydrodynamic pressures in contraction joints including waterstops on seismic response of high arch dams. Structures. 2018;14:1–14. doi:10.1016/j.istruc.2018.01.005. [Google Scholar] [CrossRef]
32. Hariri-Ardebili MA, Seyed-Kolbadi SM, Saouma VE, Salamon J, Rajagopalan B. Random finite element method for the seismic analysis of gravity dams. Eng Struct. 2018;171:405–20. doi:10.1016/j.engstruct.2018.05.096. [Google Scholar] [CrossRef]
33. Wilcoski J, Hall RL, Gambill JB, Matheu EE, Chowdhury M. Seismic testing of a 1/20 scale model of Koyna dam. Champaign, IL, USA: ERDC Construction Engineering Research Laboratory (CERL); 2001. ERDCTR-01-17. [Google Scholar]
34. Mridha S, Maity D. Experimental investigation on nonlinear dynamic response of concrete gravity dam-reservoir system. Eng Struct. 2014;80:289–97. doi:10.1016/j.engstruct.2014.09.017. [Google Scholar] [CrossRef]
35. Code for design of concrete structures GB 50010-2010. Beijing, China: Ministry of Housing and Urban-Rural Development of the People’s Republic of China; 2015. [Google Scholar]
36. Svensen D. Numerical analyses of concrete buttress dams to design dam monitoring. Stockholm, Sweden: Royal Institute of Technology; 2016. [Google Scholar]
37. Liang C, Chen J, Xu Q, Li J. Damage identification of arch dams based on post-earthquake residual displacement gradients. Soil Dyn Earthq Eng. 2023;172:108054. doi:10.1016/j.soildyn.2023.108054. [Google Scholar] [CrossRef]
38. Wang J-T, Zhang C-H, Jin F. Nonlinear earthquake analysis of high arch dam–water–foundation rock systems. Earthquake Eng Struct Dyn. 2012;41(7):1157–76. [Google Scholar]
39. Chen D, Pan Z, Zhao Y. Seismic damage characteristics of high arch dams under oblique incidence of SV waves. Eng Fail Anal. 2023;152:107445. doi:10.1016/j.engfailanal.2023.107445. [Google Scholar] [CrossRef]
Cite This Article
 Copyright © 2026 The Author(s). Published by Tech Science Press.
This work is licensed under a Creative Commons Attribution 4.0 International License , which permits unrestricted use, distribution, and reproduction in any medium, provided the original work is properly cited.
 Downloads
 Citation Tools