
 Submit a Paper
 Propose a Special lssue
 Open Access
ARTICLE

Deep Learning-Based Structural Displacement Identification and Quantification under Target Feature Loss
1 School of Civil Engineering and Architecture, University of Jinan, Jinan, 250022, China
2 Centre for Infrastructural Monitoring and Protection, School of Civil and Mechanical Engineering, Curtin University, Perth, WA 6102, Australia
3 Department of Civil Engineering, The University of Texas Rio Grande Valley, Edinburg, TX 78539, USA
* Corresponding Authors: Guangcai Zhang. Email: ; Qun Xie. Email:
(This article belongs to the Special Issue: Sustainable and Resilient Civil Infrastructure with Intelligence and Digital Transformation)
Structural Durability & Health Monitoring 2026, 20(2), 4 https://doi.org/10.32604/sdhm.2025.074620
Received 14 October 2025; Accepted 13 November 2025; Issue published 31 March 2026
 View Full Text
 Download PDF
Abstract
Structural displacement monitoring faces significant challenges under complex environmental conditions due to the loss or degradation of target features, making it difficult for traditional methods to ensure high accuracy and robustness. Therefore, this study proposes a structural displacement identification and quantification method that integrates YOLOv8n with an improved edge-orientation gradient-based template matching algorithm. By combining deep learning techniques with traditional template matching methods, the accuracy and robustness of monitoring are enhanced under adverse conditions such as noise and extremely low illumination. Specifically, in the edge-orientation gradient matching stage, the Canny-Devernay sub-pixel edge detection technique and an improved ellipse-fitting method are employed for sub-pixel edge extraction, and a five-level Gaussian pyramid structure is introduced to accelerate the matching speed. Experimental results show that the proposed method achieves high-precision displacement monitoring under sufficient illumination, and it maintains stable target localization and displacement quantification performance under conditions of noise interference and extremely low illumination. Notably, under salt-and-pepper noise interference, although YOLOv8n maintains a high level of localization confidence, the accuracy of gradient matching deteriorates, resulting in a root-mean-square error (RMSE) of 0.035 mm. This finding reveals the differential impact of various noise types on different stages of the algorithm. The proposed method offers a novel technological approach for precise structural displacement monitoring in complex environments.Keywords
Structural displacement response is a critical parameter for evaluating structural health conditions and safety performance, directly or indirectly reflecting the static and dynamic characteristics of structures. Traditional displacement measurement techniques are generally categorized into contact-based and non-contact methods. Contact sensors, such as linear variable differential transformers (LVDTs) [1], must be physically attached to structural surfaces, creating limitations including dependency on fixed reference points, complicated wiring, and added mass effects. Indirect estimation methods, such as acceleration integration [2], are highly susceptible to noise interference and cumulative errors. Non-contact techniques, such as global positioning systems (GPS) [3], laser vibrometers [4], and radar interferometry systems [5], avoid physical contact but suffer limitations including low sampling rates, high costs, and difficulties in multi-target synchronization. In recent years, computer vision-based displacement monitoring methods have garnered significant attention due to their advantages in non-contact measurement, high precision, and ease of deployment [6,7], especially suited to complex environments and large-scale engineering structures [8].
In this context, the integration of computer vision and deep learning technologies [9,10] has further promoted advancements in structural displacement monitoring. Numerous high-precision, non-contact measurement methods have been proposed and successfully implemented in engineering practice. Wu et al. [11] proposed a high-precision structural displacement reconstruction approach based on physics-informed neural networks, integrating accelerometer data and low-resolution, low-frame-rate computer vision measurements, significantly improving interpretability and identification accuracy through physics-based constraints in the loss function. Building upon this, Shao et al. [12] developed the innovative Displacement Measurement using a Moving Camera (DIMMC) visual system, employing monocular cameras mounted on unmanned aerial vehicles (UAVs) and Vision Transformer-based grid deformation neural networks, achieving 3D structural reconstruction from monocular video and compensating effectively for camera motion errors, although still limited by scale calibration and lens distortion. To further improve measurement accuracy and applicability, Zhao et al. [13] introduced a semi-dense sub-pixel displacement measurement framework based on detector-free feature matching algorithms, integrating adaptive image preprocessing, local feature matching architectures, and error compensation mechanisms, thus realizing high-precision monitoring without the need for artificial targets. Similarly, Xie et al. [14] developed an economical method leveraging binocular vision and sub-pixel identification of square features, enabling simultaneous high-precision measurement of linear displacement, angular displacement, and motion trajectories using standard cameras and computers. Facing common engineering issues such as camera distortion, inclined viewpoints, and baseline drift, Wei et al. [15] proposed a self-calibrating computer vision approach combining distortion correction without calibration boards, perspective transformation techniques, and robust data processing workflows, significantly enhancing measurement accuracy in complex scenarios. Jin et al. [16] utilized an e Long Short-Term Memory (LSTM) network to improve prediction accuracy for temperature-induced girder-end displacement and mitigate time-lag effects. Furthermore, Zhu and Luo et al. [17,18] respectively proposed methods integrating deep learning with gradient correlation matching and improved monocular vision methods optimized by enhanced feature groups and depth estimation, significantly improving system adaptability for complex environments and smartphone platforms. Dougill et al. [19] achieved sub-pixel displacement extraction using forced excitation and phase-based optical flow with low-frame-rate cameras. Notably, Nguyen et al. [20] introduced a hybrid Transforming Model Prediction (ToMP)–Kanade–Lucas–Tomasi (KLT) tracking method incorporating Transformer models, significantly enhancing stability and precision of visual displacement measurement under extreme conditions such as occlusion and variable illumination. Despite significantly broadening the application scope of visual measurement technologies, these methods still exhibit substantial limitations concerning environmental interference, quantification of systematic errors, and generalization capability, necessitating more robust and physically meaningful identification frameworks.
With advancing research, multi-source information fusion and systematic error control have become key directions for improving displacement monitoring reliability and applicability. Liu et al. [21] addressed high-rise building displacement identification under unknown wind loads, proposing a data fusion method combining acceleration and strain responses based on modal Kalman filtering without wind load assumptions, effectively suppressing modeling errors and measurement noise. Focusing similarly on multi-sensor coordination, Jin et al. [22] developed a multi-rate data fusion framework based on variational mode decomposition, significantly expanding frequency ranges and overall accuracy of displacement estimation through optimized modal recombination strategies integrating reliable low-frequency components from vision systems and broadband dynamic responses from accelerometers. Zhu et al. [23] achieved multi-target deformation monitoring under oblique photography through a TransUNet-based framework with multi-target transformation models. Liu et al. [24] designed a parallel camera network-based motion compensation approach, effectively suppressing observational platform vibrations by real-time monitoring distant control points, thereby increasing measurement accuracy on unstable platforms by over threefold and successfully applying it to bridge construction and settlement monitoring. Chen et al. [25] achieved simultaneous multi-point displacement measurements for long-span bridges through camera-chain systems and error compensation. Wu et al. [26] integrated optical flow and binocular vision for multi-target 3D displacement monitoring and modal identification. Li et al. [27] improved YOLOv8 structures, enhancing robustness and precision of object detection in complex scenarios. Addressing UAV and non-coplanar target measurement challenges, Liu et al. [28] developed a pose estimation algorithm based on digital image correlation and homography relationships, achieving highly accurate 3D coordinate calculations with significantly reduced field errors compared to conventional methods. Hou et al. [29] focused on strong vibration environments, developing methods based on improved kernel correlation filtering and frequency-domain processing, enabling sub-pixel accuracy displacement tracking and frequency-domain analysis. He and Wang [30] enhanced the accuracy of small-amplitude vibration detection by integrating multiple color spaces and super-resolution modules. Tang et al. [31] realized long-distance six-degree-of-freedom pose tracking for mountainous bridge structures through improved corner detection. Yu et al. [32] addressed the challenges of resolution and motion interference by employing super-resolution and unsupervised homography estimation techniques. Qin et al. [33] implemented nighttime long-range bridge dynamic response monitoring using morphological closing operations combined with LSTM networks. Zhang et al. [34] realized automatic two- and three-dimensional tracking of multi-plane bridge displacements using coded targets and intelligent algorithms. Qu et al. [35] accomplished high-precision real-time simultaneous monitoring of displacement and rotation for long-span bridges by fusing Global Navigation Satellite System (GNSS) and accelerometer data through extended Kalman filtering. To systematically address measurement uncertainty, Zhang et al. [36] developed a quantitative model and configuration guideline, providing a detailed analysis of how hardware parameters and algorithm choices affect measurement accuracy and emphasizing that quantification of environmental influences and camera angle variations remains a critical research direction. These advancements have deepened the theoretical framework of multi-source sensor fusion and error management, providing a solid technical foundation for structural displacement monitoring under complex environments. Nevertheless, existing studies lack systematic attention to scenarios involving target feature loss or degradation. Particularly under conditions of blurred textures, partial occlusion, or dramatic illumination variations, mechanisms ensuring the stability and precision of displacement recognition remain insufficient. Therefore, the development of a robust, quantifiable, and intelligent recognition framework tailored to feature degradation scenarios is of pressing importance.
To address the challenge of target feature loss or degradation in structural displacement monitoring, a structural displacement identification and quantification method integrating YOLOv8n with an improved edge-orientation gradient matching algorithm was developed. In this study, complex environments are defined as scenarios where the target is subjected to noise interference or extremely low illumination—factors that have been demonstrated in prior research to adversely affect displacement-monitoring accuracy. Compared with existing approaches, this work introduces innovative improvements in feature extraction, matching strategy, and displacement quantification. In particular, the target-matching process incorporates the Canny–Devernay technique and an enhanced ellipse-fitting algorithm. The remainder of this paper is organized as follows: Section 2 describes the construction of the target dataset for localization; Section 3 details the implementation process of the proposed structural displacement identification and quantification method; Section 4 presents and analyzes three experimental cases and their results; Section 5 discusses the findings based on experimental observations; and finally, Section 6 summarizes the main contributions of this research.
2 Construction of the Target Dataset
In the field of structural displacement monitoring, two principal technical paradigms prevail: natural-feature-based methods and artificial-target-based methods. The natural-feature approach relies on inherent textures and surface details of structures for identification, eliminating the need for additional markers. This approach offers simple deployment and minimal intrusiveness, making it particularly suitable for historical buildings or temporary monitoring scenarios. However, it is highly susceptible to illumination changes, occlusion, and feature degradation, which limits its long-term stability and measurement precision. In contrast, artificial targets utilize high-contrast patterns and precisely defined geometric shapes that markedly enhance robustness, enabling stable sub-pixel localization and sub-millimeter displacement measurement. As illustrated in Fig. 1, this study employs a custom-designed target, whose pattern geometry and deployment strategy were carefully optimized to achieve maximum monitoring accuracy and environmental adaptability while maintaining economic feasibility.
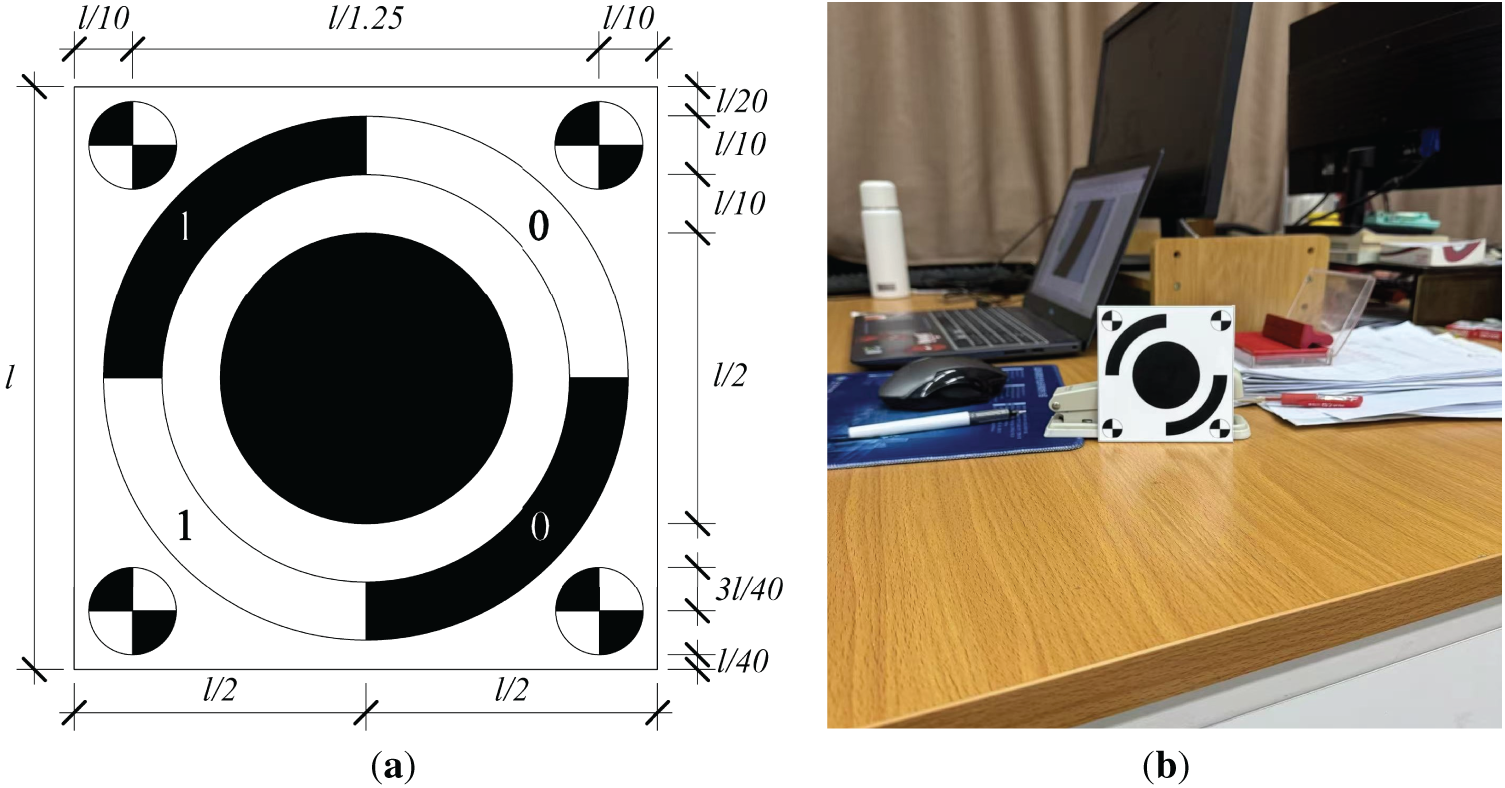
Figure 1: Schematic of the designed target: (a) target design diagram; (b) physical target
To construct a target dataset suitable for complex scenarios, images were collected using the custom-designed marker under diverse background environments, varying spatial scales, multiple viewing angles, and a broad range of illumination conditions. All images were captured using a smartphone device with a unified original resolution of 1200 × 1200 pixels, resulting in a total of 1024 high-quality raw images. Representative samples of the dataset are shown in Fig. 2. To further enhance data diversity and improve the model’s generalization capability, a total of 11 data augmentation techniques were applied, including geometric transformations and color-space adjustments. The specific data distribution before and after augmentation is summarized in Table 1. The establishment of this dataset provides a crucial foundation for high-precision and high-robustness visual perception tasks under complex environmental conditions.
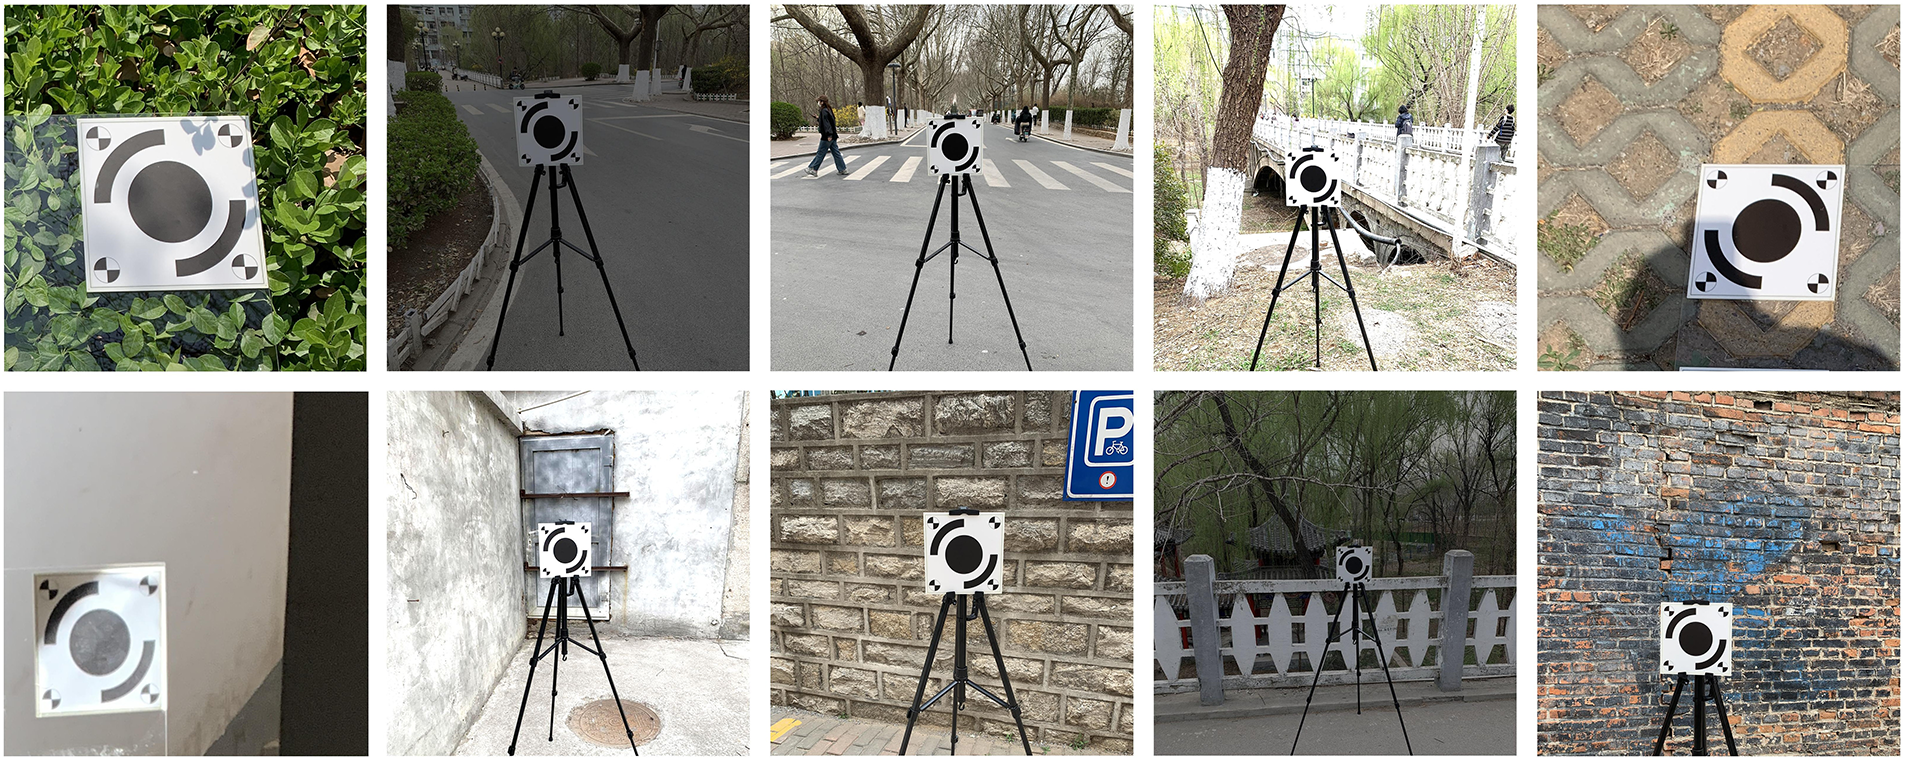
Figure 2: Samples of the dataset under different shooting conditions
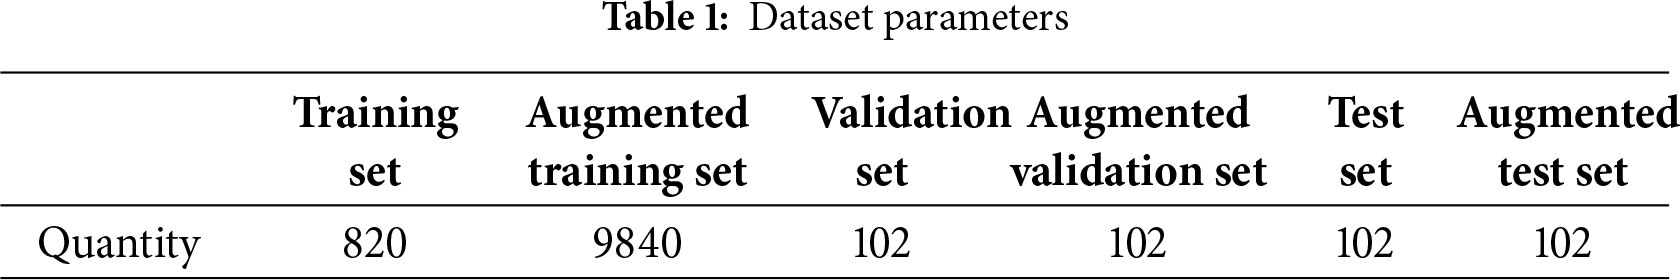
The validation and test sets retained their original, non-augmented data to ensure an unbiased and accurate evaluation of the model’s true generalization capability. The dataset was further annotated using the LabelImg software, with the target named MARK1. A total of 820 original images were manually labeled, and the annotations for the augmented training set were automatically generated by the algorithm based on the original labels.
3 Structural Displacement Identification and Quantification
YOLOv8n, a lightweight variant within the YOLOv8 series developed by Ultralytics, follows the canonical YOLO architecture comprising three components: backbone, neck, and head. The backbone is built on an improved CSPDarknet structure and replaces the YOLOv5 C3 module with the C2f module, which enhances feature flow via gradient-splitting connections and multiple bottleneck units, thereby improving feature reuse while reducing computational cost. The neck adopts a PAN-FPN architecture to realize bidirectional multi-scale feature fusion, strengthening detection capability across object scales. The head employs a decoupled, anchor-free design that separates classification from bounding-box regression, improving detection accuracy and generalization. The overall network structure of YOLOv8n is illustrated in Fig. 3.
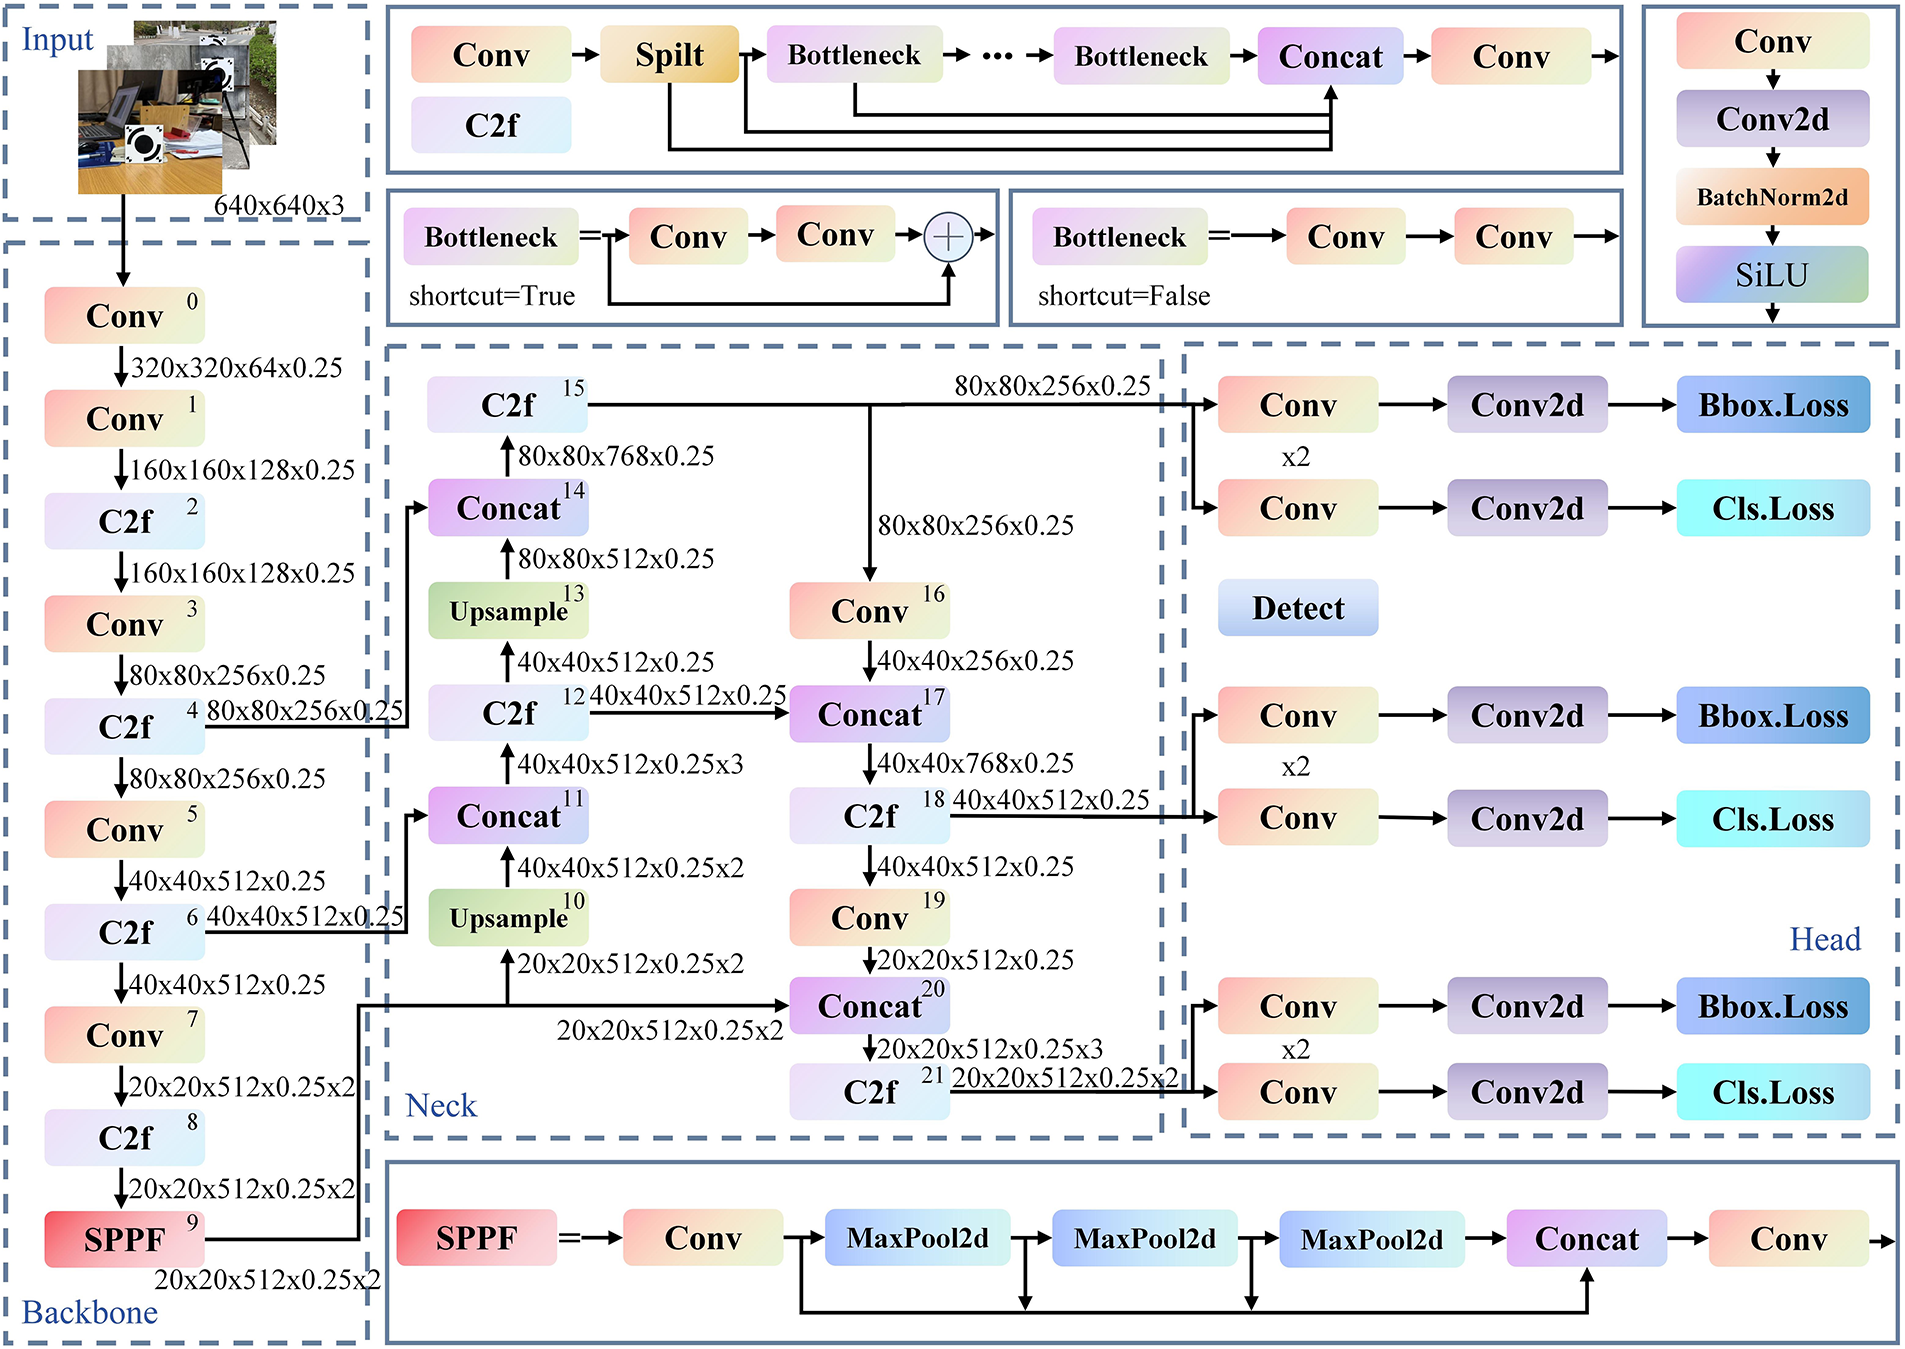
Figure 3: Structure of the YOLOv8n model
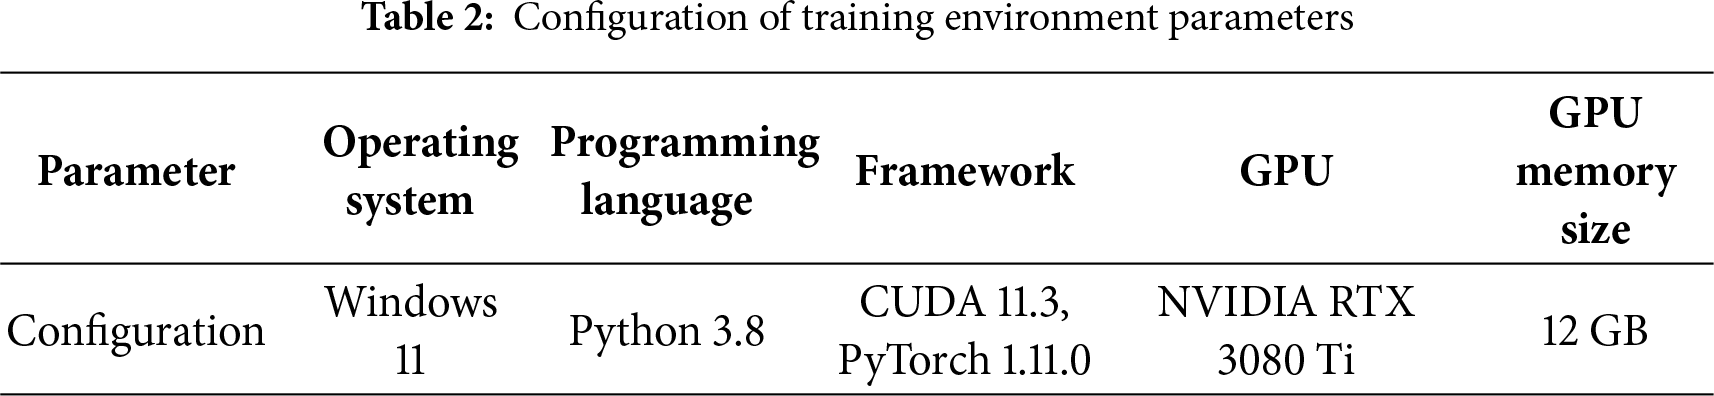
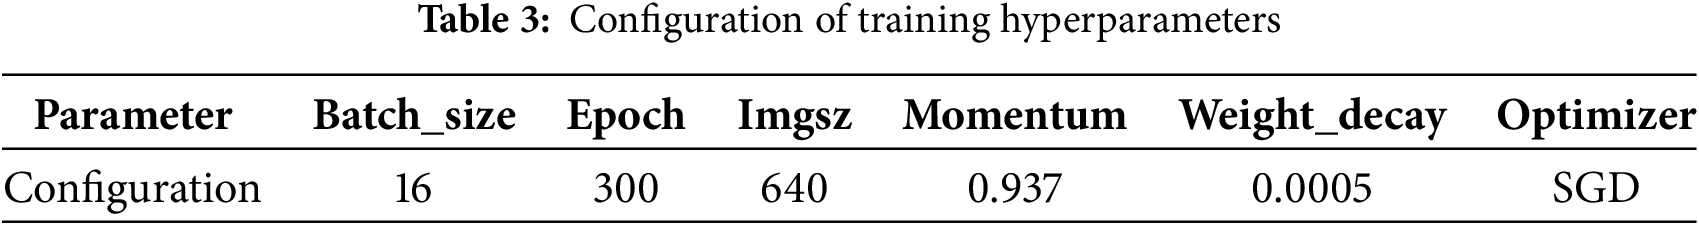
The hardware and software configurations used in the experiments are summarized in Table 2, and the core hyperparameters for YOLOv8n training are listed in Table 3. After training, the model achieved an mAP50-95 of 97.84%, indicating strong detection performance and generalization capability—attributable to the relative simplicity of the target features as well as the scale and quality of the training dataset—thus providing a reliable basis for target localization and extraction of bounding-box coordinates.
Bounding boxes output by YOLOv8n represent target locations using normalized coordinates. The center coordinates (
where
It should be noted that when the input image during model inference is padded (for instance, gray borders added to maintain aspect ratio), the padding offsets must be removed prior to coordinate conversion to ensure accurate alignment with the original image.
In multi-target monitoring scenarios, wide field-of-view imaging often results in targets occupying relatively small portions of the frame. When the square root of the ratio between the bounding-box area and the total image area falls below 3%, the object is defined as a small target. Such small targets are prone to missed detections due to the multi-layer downsampling in YOLOv8n. To address this issue, the original image is divided into multiple overlapping local patches, with each patch processed independently by the detection network. The entire image is traversed through fixed window sizes and sliding strides, with an overlap ratio of 45%, allowing localized magnification and refinement of target regions.
A Non-Maximum Suppression (NMS) algorithm is applied to merge duplicate detection boxes and remove redundant predictions resulting from overlapping windows. When multiple predicted boxes correspond to the same target, NMS retains the bounding box with the highest confidence while suppressing other boxes whose intersection-over-union (IoU) with the highest-scoring box exceeds a predefined threshold. Because sliding-window slicing generates numerous overlapping detections, NMS ensures that only one optimal bounding box is output for each target. The global processing procedure consists of the following steps:
(1) Each image patch is independently processed to generate initial bounding boxes;
(2) Duplicate boxes across patches are merged through NMS;
(3) A low IoU threshold of 0.1 is applied to prevent excessive suppression of small-target detections.
3.2 Improved Edge-Orientation Gradient Matching
Based on the pixel coordinates of the target obtained in Section 3.1, a region of interest (ROI) is defined within the original image to extract the edge-orientation gradient features for template construction, enabling high-precision matching.
The edge-orientation gradient matching method is a high-accuracy template matching algorithm that relies on the similarity of edge gradient directions. It achieves target localization by evaluating the consistency of gradient direction vectors between the template and local regions of the target image. The algorithm first constructs a multi-level pyramid model of the template and extracts its edge features and normalized gradient direction vectors. In this study, the Canny operator combined with the sub-pixel edge optimization technique proposed by Devernay [37] is employed to extract the edge features of the MARK1 target, corresponding to pixel positions where the grayscale intensity of the image function exhibits sharp variations, as illustrated by the 3D grayscale image in Fig. 4. During matching, a top-down pyramid search strategy is adopted, where the similarity is evaluated by sliding the template across the target image and computing the dot products of their directional vectors. Gradient orientation demonstrates strong invariance to illumination variations and depends solely on edge-structure information, allowing the algorithm to effectively handle brightness fluctuations, partial occlusion, and noise interference. Finally, the similarity score function is optimized and integrated with rotation and scale transformation models to achieve sub-pixel accuracy in multi-pose target localization [38].
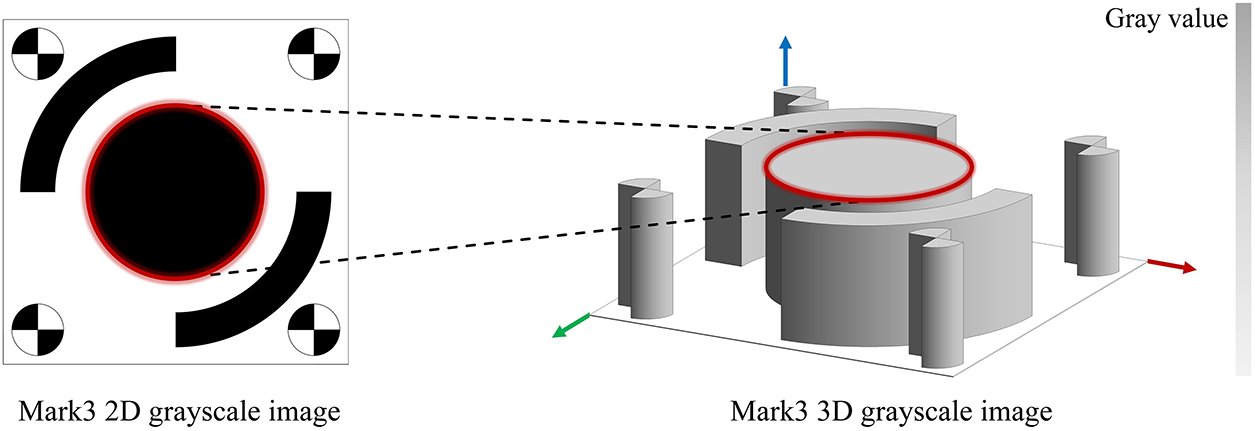
Figure 4: Extracted edge features on the target surface
Using the Canny-Devernay operator, pixel points with nonzero gradient magnitudes are extracted from both the reference and the target images, yielding a total of n points with coordinates denoted as
Accordingly, the overall matching score, denoted as
here,
To determine the correct matching location, all potential regions in the target frame are traversed, and those with similarity scores exceeding a predefined threshold
A higher value of
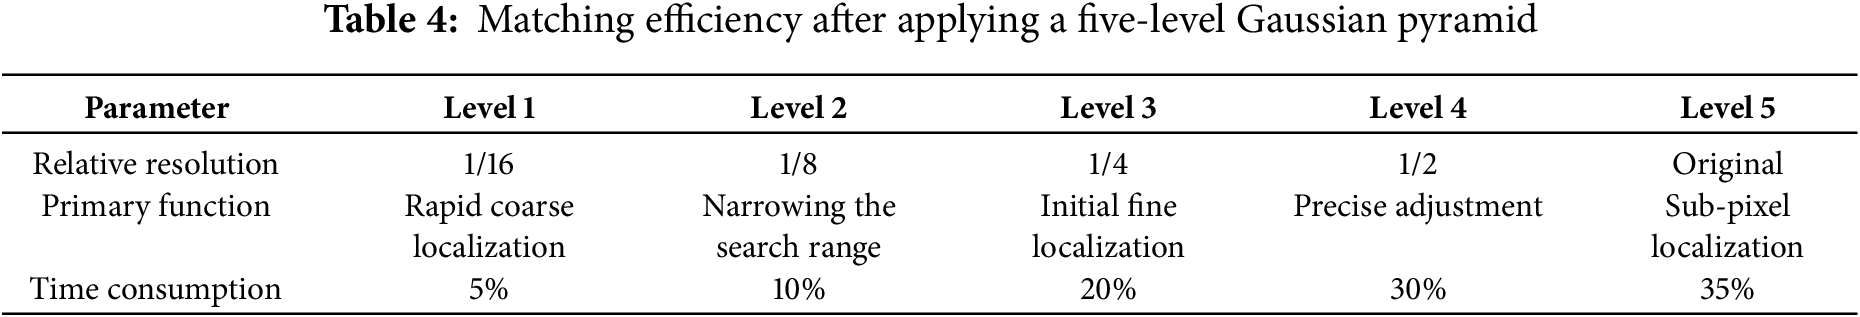
To handle high-resolution video frame data and enhance subsequent analytical efficiency, a Gaussian pyramid model is introduced to represent the original frame at multiple scales. Through iterative downsampling and Gaussian smoothing, a scale-space representation is constructed that reduces computational complexity while preserving critical structural information in lower-resolution layers, thus providing an efficient computational foundation for the matching task.
The original image
where
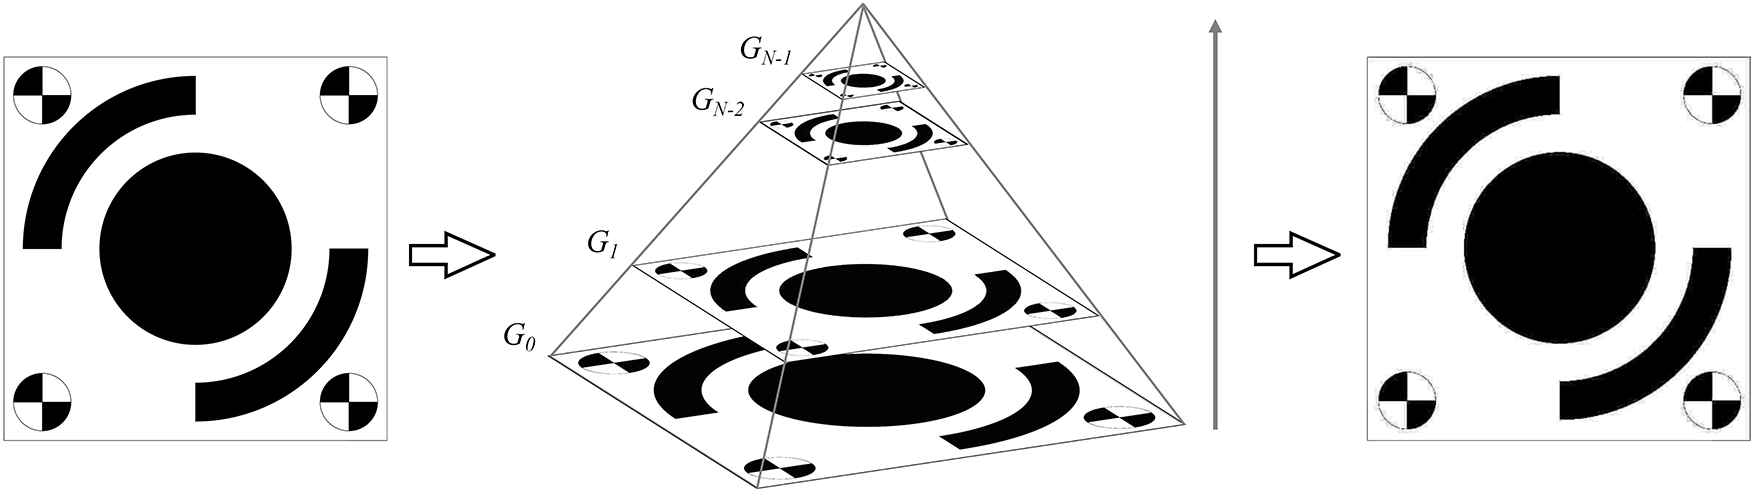
Figure 5: MARK1 after applying a five-level Gaussian pyramid
3.3 Structural Displacement Quantification
To ensure the accuracy of displacement quantification, the image acquisition system is subjected to rigorous geometric calibration prior to analysis. A scale-factor method—widely adopted in engineering practice—is employed to establish a deterministic mapping between image pixel coordinates and physical-space coordinates.
The procedure first applies Zhang’s calibration to correct radial and tangential lens distortions. As illustrated in Fig. 6a, under the ideal condition where the camera optical axis is strictly perpendicular to the target plane, the scale factor
where
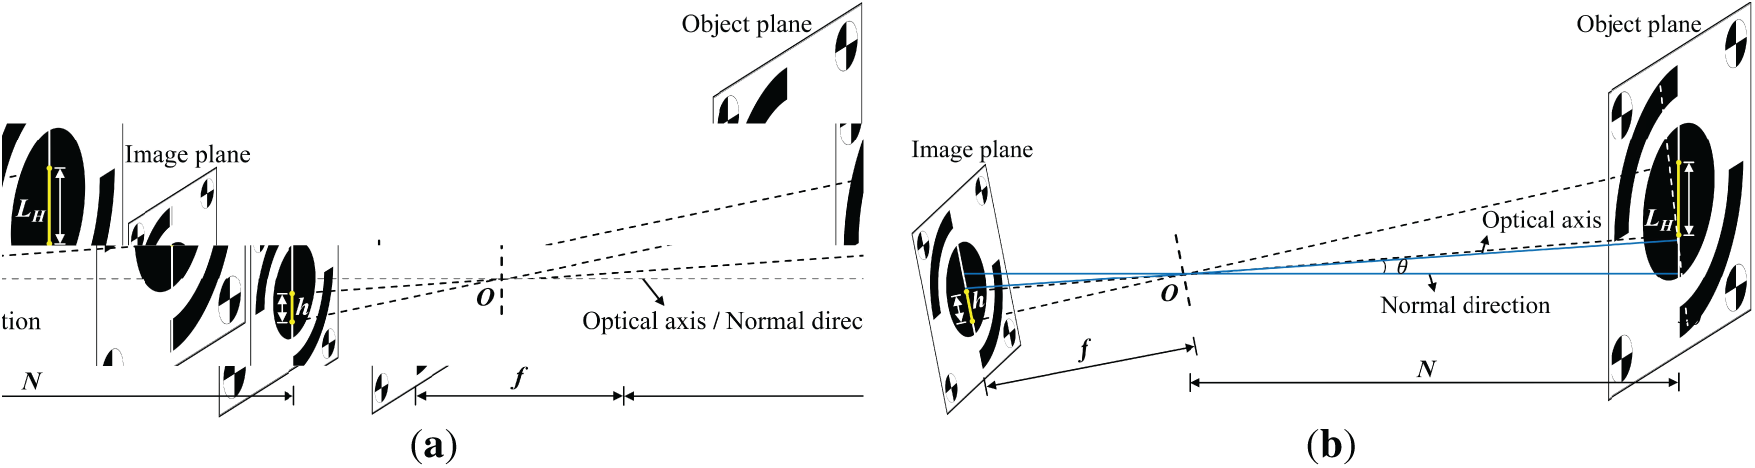
Figure 6: Applicability of the scale-factor method to camera pose: (a) optical axis perpendicular to the target plane, (b) optical axis forming an angle with the target plane
When the optical axis forms an angle
Experimental tests and theoretical analysis indicate that the scale factor is essentially independent of the camera’s intrinsic parameters (e.g., focal length, principal point) and extrinsic parameters (i.e., the camera’s pose relative to the world frame). This property implies that, even when both the camera and the target may move, as long as the target displacement occurs along a single axis and the optical-axis-to-plane angle is either perpendicular or known and stable, calibration can be achieved directly from the target’s physical dimensions and their pixel measurements, without solving for full intrinsics/extrinsics.
A saddle point is a special critical point in the image-intensity field at which the intensity reaches a minimum along one principal direction and a maximum along the orthogonal principal direction. Owing to this distinctive curvature property, saddle points remain highly discriminative across regions with varying intensity gradients and thus serve as ideal sub-pixel localization features in vision metrology. Because the four corner regions of the designed target exhibit pronounced gradient fields, saddle points are used as reference features for computing the scale factor in this study.
First, Gaussian smoothing is applied within the ROI provided by YOLOv8n to suppress noise. The local gray-level distribution is then approximated by a quadratic polynomial in the x and y directions. The core of this model is the Hessian matrix, composed of second-order directional derivatives of the image function, as given in Eq. (13):
where
Whose matrix form is written as Eq. (15):
This exploits the property that a saddle point attains an intensity minimum along one principal direction and a maximum along the orthogonal direction, enabling stable detection even on complex structural surfaces. Fig. 7 illustrates saddle points detected on a building exterior insulation panel and a construction hoist equipped with the MARK1 target.
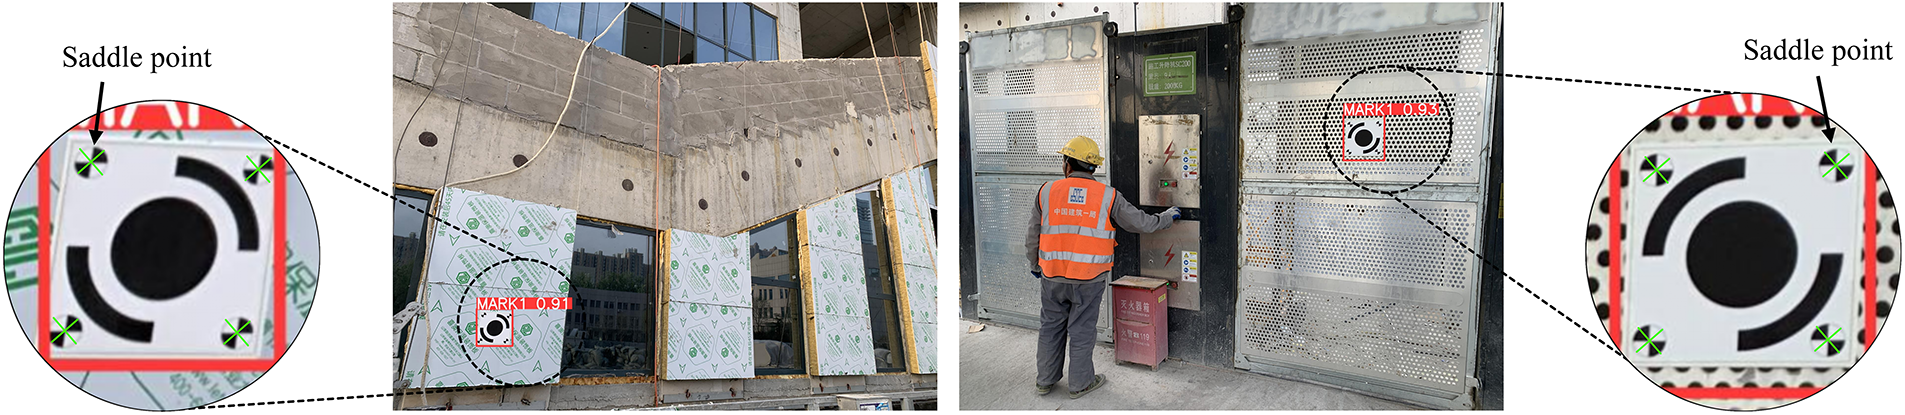
Figure 7: On-site saddle-point detection test
After extracting the edges of the target’s central ellipse using the Canny-Devernay operator, the set of ellipse edge points
where
In this formulation,
By solving for the eigenvector corresponding to the positive eigenvalue of
As indicated by Eq. (21), the scatter matrix is additive; the scatter matrix of the union equals the sum of those of the subsets. This property markedly improves the computational efficiency of ellipse fitting, allowing partial subset matrices to be merged to approximate the complete edge distribution of the target’s central circle or ellipse, thereby maintaining robustness and accuracy even when edges are incomplete or disturbed.
The saddle points at the four corners of the designed target serve as reference features for computing the scale factors [40]. Let
here,
If any corner is occluded, the scale factor in an arbitrary direction can be computed using any available pair Eq. (24):
The pixel center coordinates of the target are obtained by averaging the intersection point of the saddle points and the center derived from the fitted ellipse edge. Let
To verify the effectiveness of combining YOLOv8n with the improved edge-orientation gradient matching method—and to assess its accuracy under complex environments—systematic tests were conducted in the Structural Laboratory at the University of Jinan, Shandong, China. In the experiments, the confidence threshold of YOLOv8n was set to 0.5; if no objects with appearances similar to the target were present in a video frame, this threshold could be slightly reduced. The similarity threshold for edge-orientation gradient matching was set to 0.25; in cases of severe feature loss, this threshold could also be reduced, since the coordinates provided by YOLOv8n already exclude interference from non-target objects for displacement computation. The laboratory layout is shown in Fig. 8.
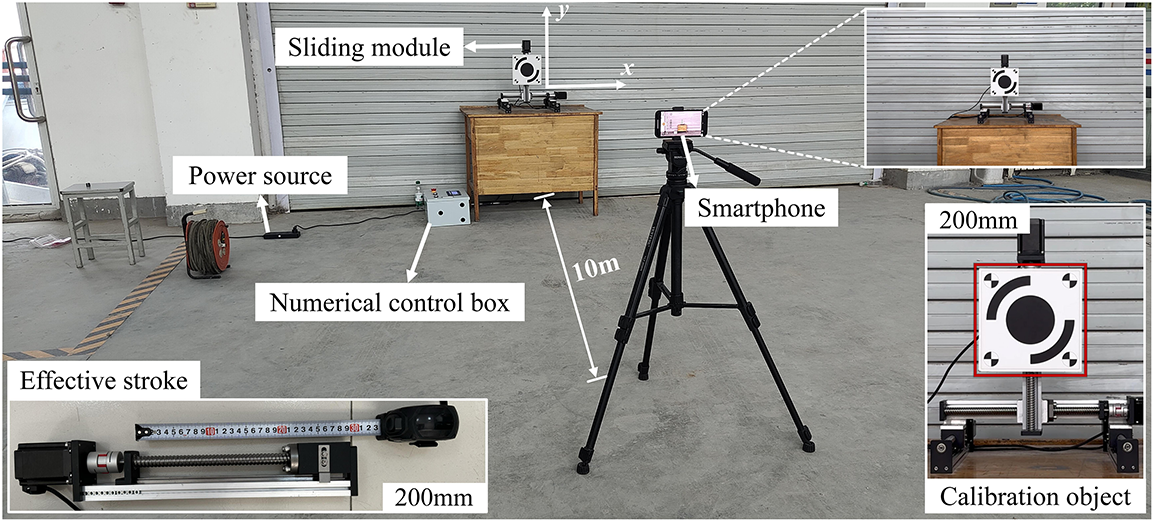
Figure 8: Field layout of the experiment
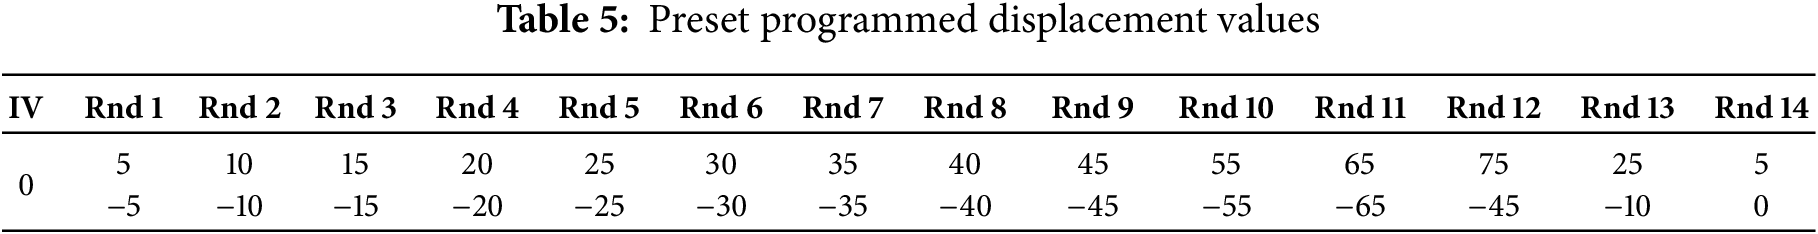
An X-Y-Z linear slide module was placed on a table in an open area and precisely controlled by a manually programmable computer numerical control (CNC) controller. The preset displacement precision of the module reached ±0.01 mm, providing a high-accuracy reference for the proposed method. A 200 × 200 mm target was mounted on the Y-axis of the X-Y-Z module. After positioning with a laser rangefinder, an image-acquisition device (a smartphone) was set at a distance of 10 m from the target. The choice of device was not deliberately optimized—any camera capable of video acquisition can be used for the present displacement-measurement method. The slide module was powered by a regulated laboratory power supply, and the displacement sequence was programmed via the CNC controller. The specific programmed values are listed in Table 5, where “IV” denotes the initial value and “Rnd” denotes the motion round. The Y-axis was fixed at the center position of the X-axis and used as the initial reference; one full left-right reciprocation of the X-axis was defined as a single motion round, and 14 rounds were executed in total. The smartphone recorded videos at 1080 p and 60 fps. Each video lasted 1 min 23 s and was transferred to a laptop for processing, yielding approximately 5011 valid displacement samples per video for subsequent analysis.
Three test scenarios, Test 1.1–1.3, were designed. Test 1.1 was collected around 12:00 under natural illumination to validate feasibility and accuracy. Test 1.2 was collected under the same illumination conditions but with artificially injected Gaussian and salt-and-pepper noise to evaluate noise robustness. Test 1.3 was conducted at dusk under extremely low illumination to examine effectiveness under adverse lighting. It is worth noting that many vision-based displacement monitoring methods employ artificial lighting or self-luminous targets for low-illumination cases. Developing a method that remains feasible under extremely low illumination is therefore necessary, as it extends the effective monitoring window within a day and can reduce system deployment and maintenance costs.
4.2 Test 1.1 Algorithm Performance
To evaluate feasibility and accuracy, the first test was conducted around 12:00 under natural illumination. YOLOv8n detection was performed first, as the initial region of interest it provides is crucial for subsequent precise displacement computation. From the recorded video, six frames were selected between 1:04 and 1:11; the detected targets under these conditions are shown in Fig. 9. The results indicate that the detection boxes tightly enclose MARK1 and that the annotated coordinates align well with its salient features. The mean confidence was approximately 0.962, demonstrating strong stability of the trained model in localizing the target.
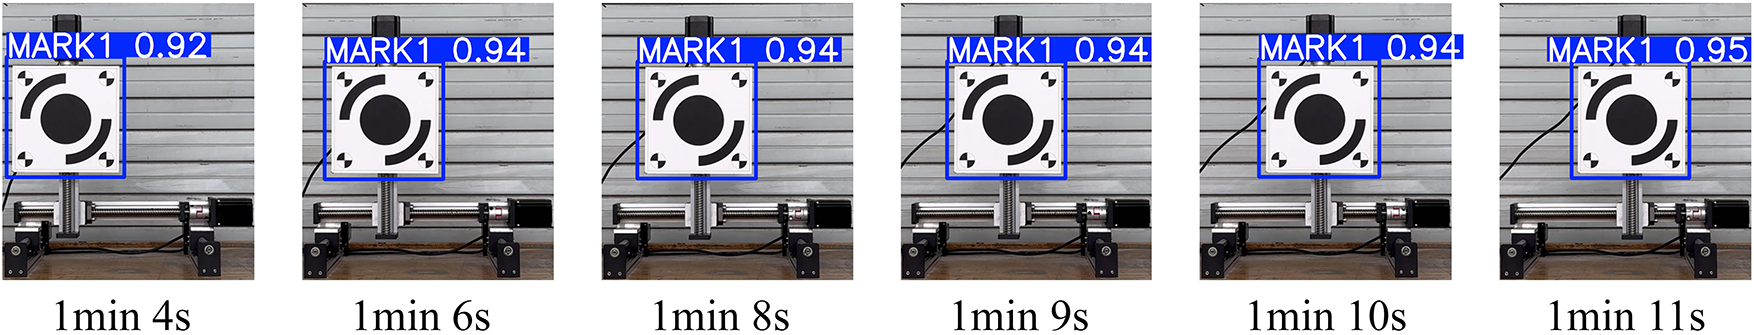
Figure 9: Extraction results under natural illumination at 12:00 noon
Fig. 10 presents the displacement time-history responses of the X-Y-Z linear slide module, the proposed method, and the conventional (unimproved) template-matching method under natural illumination at 12:00 noon. The three curves exhibit highly consistent overall trends over an 80-s time sequence. In terms of waveform characteristics, the proposed method shows close agreement with the preset displacement in both amplitude and phase, indicating its capability to accurately capture the time-varying characteristics of structural displacement. The RMSE between the proposed method and the reference data is 0.016 mm, whereas the conventional template-matching approach yields an RMSE of 0.021 mm. This high level of consistency demonstrates that the proposed method can effectively reproduce the core dynamic response of the slide module, thereby validating its effectiveness and reliability in time-domain displacement extraction and providing a solid foundation for subsequent comparative studies.
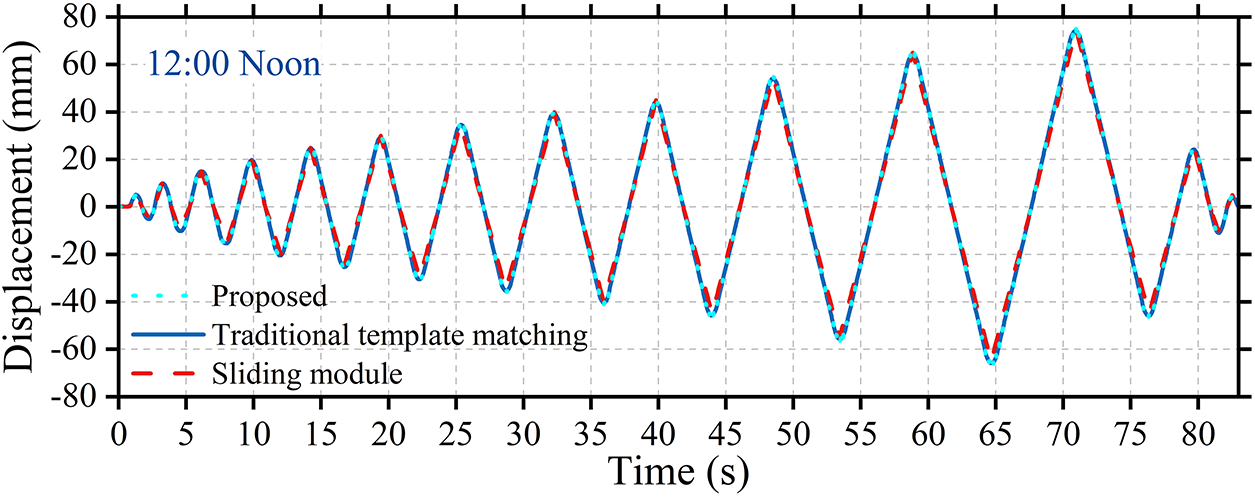
Figure 10: Displacement time-history curve extracted at 12:00 noon
To assess robustness in realistic complex environments, image degradations commonly encountered during video acquisition were deliberately simulated. In practical applications, random noise is often introduced into video frames due to channel interference, sensor thermal noise, or poor illumination, thereby challenging the accuracy of target-detection algorithms. To quantitatively analyze noise effects, Gaussian and salt-and-pepper noise were injected into the original frames. Gaussian noise with mean 0 and standard deviation 40 was used to emulate inherent thermal noise in electronic devices; salt-and-pepper noise with 1.4% salt pixels and 1.4% pepper pixels was used to emulate impulsive interference arising during signal transmission. Figs. 11 and 12 show the extraction results of the YOLOv8n model on the same frame under these noise conditions. Despite the pronounced degradation in image quality, YOLOv8n continued to output accurate target coordinates stably. The mean detection confidences were 0.954 under Gaussian noise and 0.957 under salt-and-pepper noise, with minimal fluctuations. These results indicate that the deep feature-extraction mechanism underlying YOLOv8n exhibits strong tolerance to structured noise; the interference does not materially impair the model’s core localization capability, underscoring its stability in noisy environments.
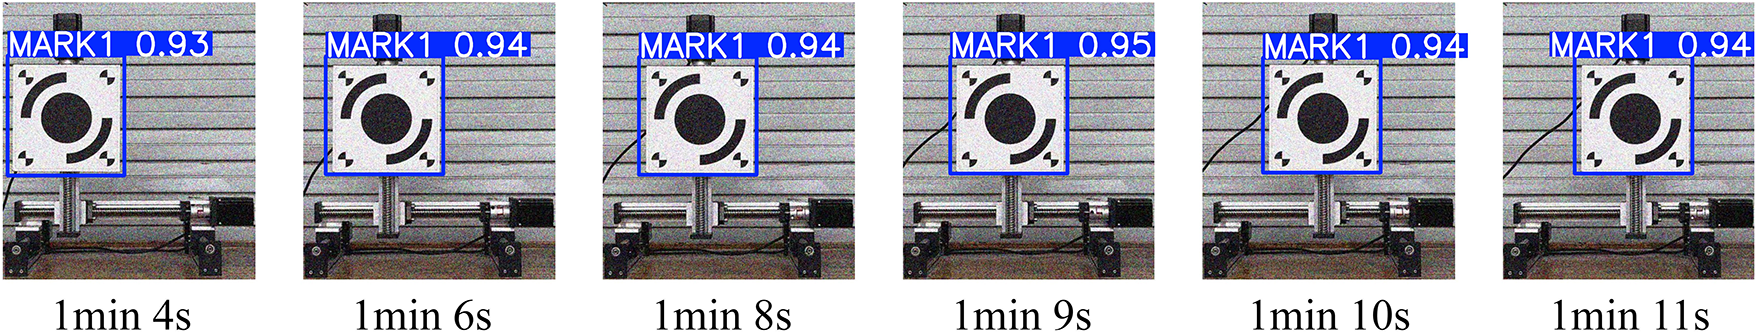
Figure 11: Extraction results under Gaussian noise
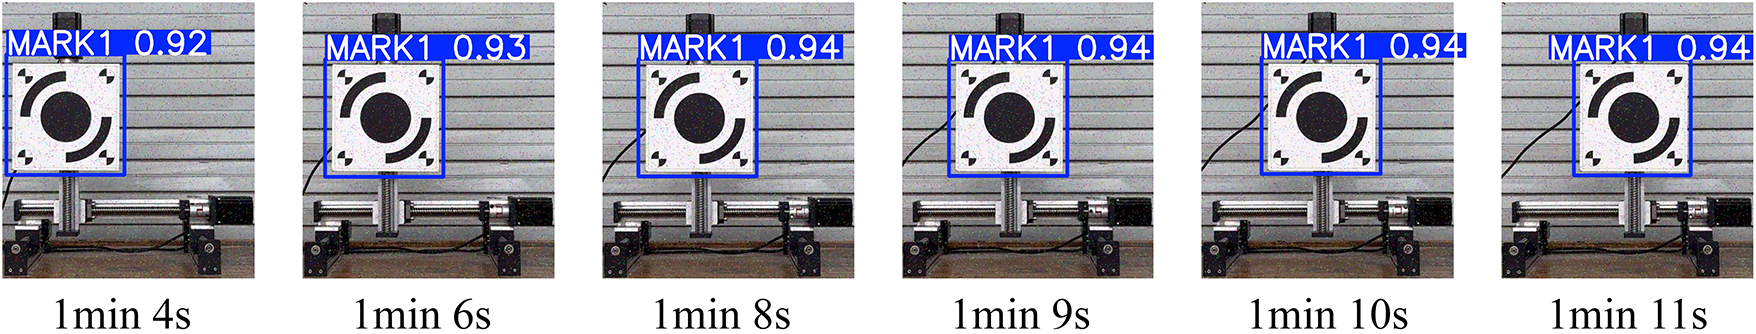
Figure 12: Extraction results under salt-and-pepper noise
Fig. 13 systematically evaluates the displacement extraction accuracy of the proposed method under typical noise interference through two comparative experiments. Fig. 13a shows the displacement time-history curves of the proposed method and the conventional (unimproved) template-matching method compared with the reference data from the linear slide module under Gaussian noise conditions, with RMSE values of 0.029 and 0.032 mm, respectively. Fig. 13b presents the comparison under salt-and-pepper noise, where the RMSE values are 0.035 and 0.039 mm, respectively. In both experiments, the displacement curves obtained by the proposed method exhibit high consistency with the reference curves in terms of overall trend, phase, and amplitude, while the error values remain at very low levels. These quantitative results confirm that the proposed method demonstrates superior suppression capability for both types of noise. The displacement extraction achieves sub-millimeter accuracy, highlighting the method’s ability to maintain stable and reliable performance in complex noisy environments.
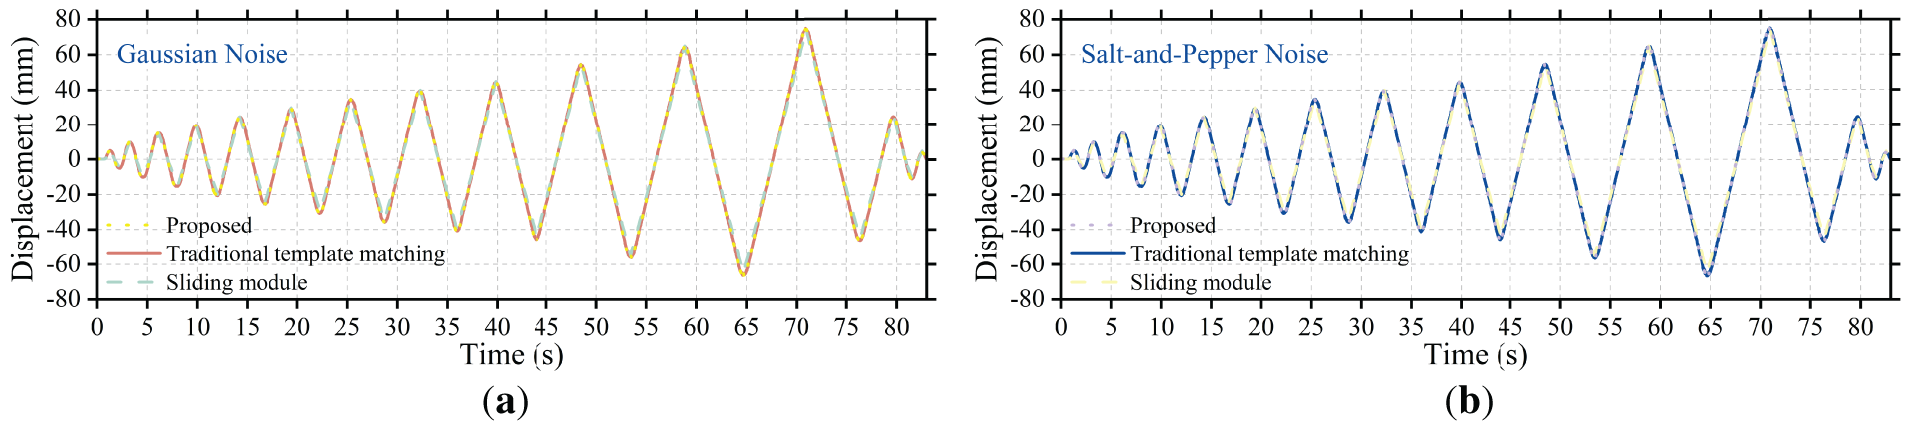
Figure 13: Displacement time-history curves under different noise interferences: (a) Gaussian noise, (b) salt-and-pepper noise
4.4 Test 1.3 Effect of Low Illumination
Fig. 14 presents the performance evaluation of the target detection algorithm under low-visibility conditions at dusk. The sequential image series records the continuous detection status of the MARK1 target between 1:04 and 1:11. Although ambient illumination was markedly reduced, causing a decrease in overall image contrast, the algorithm maintained consistent and stable target recognition and localization. Detection confidence remained within the high range of 0.92–0.94 with minimal fluctuation, indicating that the feature-extraction network exhibits strong adaptability to illumination variations. The spatial positions of the blue detection boxes remained highly consistent across frames, further confirming that localization accuracy was not significantly affected by low-visibility conditions. These findings demonstrate that the proposed method retains excellent robustness and reliability in complex lighting environments, with detection performance unaffected by illumination decay during dusk.
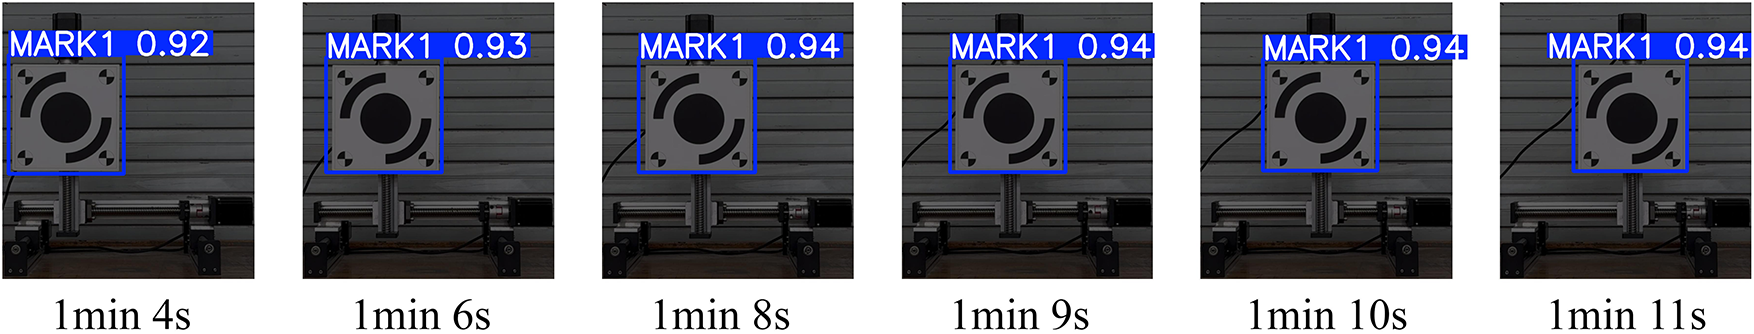
Figure 14: Extraction results under low-visibility conditions at dusk
Fig. 15 illustrates the comparison of displacement time-history curves extracted by the proposed method and the conventional (unimproved) template-matching method with the reference data from the linear slide module under low-visibility conditions at dusk. Over the 80-s observation period, all three curves exhibit highly consistent periodic oscillation patterns, with the proposed method closely following the reference trajectory and showing strong overall agreement. Quantitative analysis reveals that the RMSE calculated using the proposed method is only 0.032 mm, whereas the conventional template-matching method yields an RMSE of 0.037 mm. This minimal deviation demonstrates that the proposed method maintains excellent measurement accuracy even under low-illumination conditions. Combined with the stable detection confidence observed in Fig. 14 under identical lighting conditions, these results indicate that the proposed method effectively overcomes the challenges posed by reduced image contrast through a robust feature-extraction mechanism, thereby achieving precise reconstruction of displacement information.
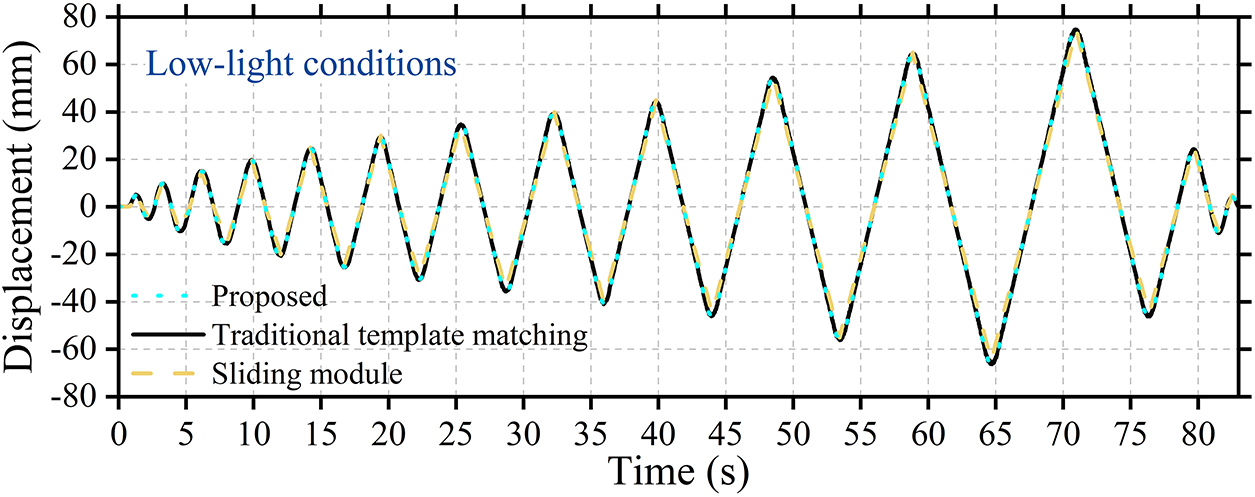
Figure 15: Displacement time-history curve extracted under low-visibility conditions at dusk
Addressing the challenges of structural displacement monitoring in complex environments, this study integrates deep learning with gradient-based matching to deliver a vision measurement approach that combines high accuracy with robustness. By fusing YOLOv8n detection with an improved edge-orientation gradient matching algorithm, stable sub-pixel displacement identification is achieved under uneven illumination, noise interference, and local feature degradation. Experimental results indicate that high measurement accuracy is maintained across noise levels, with mean RMSE markedly lower than that of conventional template matching—demonstrating superior noise immunity and generalization. Further analysis shows that constraining edge-orientation gradients mitigates pixel nonlinearity caused by grayscale nonuniformity and Image Signal Processor (ISP) processing, thereby preserving matching consistency under local grayscale drift [17]. Notably, although smartphone imaging pipelines inevitably involve ISP, validation suggests only minor impact on gradient-based relative displacement measurement, implying strong portability of the method in nonlinear imaging systems [41]. Nevertheless, to ensure precise absolute displacement calibration, future work should incorporate the linear imaging characteristics of industrial cameras for systematic error quantification to further verify algorithmic stability.
From an engineering standpoint, the method’s behavior under shadows, low illumination, and complex backgrounds reveals an intrinsic coupling between visual features and environmental perturbations. Comparisons between synthetic and measured shadow samples indicate that local occlusion primarily disturbs the distribution of orientation gradients and the consistency of template matching, thereby increasing localized displacement errors [42]. Introducing orientation-gradient constraints together with a pyramid, coarse-to-fine matching strategy substantially reduces false matches along shadow boundaries. These findings suggest that the hybrid framework—combining deep detection with gradient information—delivers not only high accuracy in laboratory conditions but also robustness in field scenarios with nonuniform lighting and dynamic backgrounds. Despite these advantages, several limitations remain. The algorithm’s performance is sensitive to device calibration and camera pose stability, and the stability of gradient features still requires improvement under conditions of dynamic illumination or highly reflective surfaces. Future work may integrate multi-view geometric constraints and physics-informed priors to construct an end-to-end learning and matching framework, followed by multimodal field validation in complex environments such as bridges and tunnels, thereby bridging the gap between algorithmic precision and engineering reliability.
This study proposed a structural displacement identification and quantification method that integrates YOLOv8n with an improved edge-orientation gradient matching approach to address the problem of target feature loss or degradation under complex environments. The main conclusions are as follows:
(1) The proposed method combines deep learning with gradient-based matching, enabling stable and high-precision target localization and displacement quantification in complex environments. Under natural illumination, the YOLOv8n model achieved an average confidence of 0.962, and the RMSE of the displacement time history was 0.016 mm, demonstrating excellent performance under standard conditions.
(2) The comparison between the pre- and post-improvement results shows that the enhanced edge-orientation gradient matching algorithm significantly improves displacement identification accuracy and stability, with a notable reduction in error. Meanwhile, under noisy and low-illumination conditions, the detection confidence remains above 0.92 and the RMSE stays at a low level, demonstrating strong robustness of the method under degraded environmental conditions.
(3) The influence of salt-and-pepper noise on displacement measurement accuracy was found to be more significant than that of Gaussian noise and low-illumination conditions. Although the YOLOv8n model retained high localization confidence under salt-and-pepper interference, the main effect occurred during the gradient-matching stage, reducing sub-pixel matching precision and subsequently affecting displacement quantification results.
(4) Future research could further integrate mechanical prior knowledge with deep learning models by embedding physics-based constraint loss functions and developing hybrid mechanism- and data-driven displacement identification frameworks to enhance generalization and interpretability under extreme conditions.
Acknowledgement: Thanks to all team members for their work and contributions.
Funding Statement: The work described in this paper was supported by the National Natural Science Foundation of China (No. 52408533), the Natural Science Foundation of Shandong Province (No. ZR2024QE408), the University of Jinan Disciplinary Cross-Convergence Construction Project 2023 (XKJC202310), the Municipal and School Integration Development Strategic Project of Jinan City (JNSX2023023), Natural Science Foundation of Tianjin (24JCQNJC00870), and Doctoral Fund Support Project of University of Jinan (XRC2563).
Author Contributions: The authors confirm contribution to the paper as follows: study conception and design: Qun Xie; methodology: Lishuai Zhu, Qun Xie, Zhen Peng, Li Ai; investigation: Lishuai Zhu, Qun Xie; resources: Guangcai Zhang, Ruijun Liang, Taochun Yang; supervision: Qun Xie, Guangcai Zhang, Zhen Peng, Li Ai; project administration: Qun Xie; funding acquisition: Qun Xie, Ruijun Liang, Taochun Yang; writing—original draft preparation: Lishuai Zhu, Guangcai Zhang. All authors reviewed the results and approved the final version of the manuscript.
Availability of Data and Materials: The data used to support the findings of the study are available from the corresponding author upon request.
Ethics Approval: Not applicable.
Conflicts of Interest: The authors declare no conflicts of interest to report regarding the present study.
References
1. Pham TT, Kim D, Woo U, Jeong SG, Choi H. Development of non-contact measurement techniques for concrete elements using light detection and ranging. Appl Sci. 2023;13(24):13025. doi:10.3390/app132413025. [Google Scholar] [CrossRef]
2. Liu Q, Chang S, Feng G, Liu F. Top displacement estimation for monopile-supported offshore wind turbine based on the combination of acceleration and inclination. Ocean Eng. 2025;327(12):120954. doi:10.1016/j.oceaneng.2025.120954. [Google Scholar] [CrossRef]
3. Yi TH, Li HN, Gu M. Recent research and applications of GPS-based monitoring technology for high-rise structures. Struct Control Health Monit. 2013;20(5):649–70. doi:10.1002/stc.1501. [Google Scholar] [CrossRef]
4. Miyashita T, Nagai M. Vibiration-based structural health monitoring for bridges using laser doppler vibrometers and MEMS-based technologies. Int J Steel Struct. 2008;8:325–31. [Google Scholar]
5. Chen Y, Huang Q, Zhang T, Zhou M, Jiang L. Measurement refinements of ground-based radar interferometry in bridge load test monitoring: comprehensive analysis on a multi-span cable-stayed bridge. Remote Sens. 2024;16(11):1882. doi:10.3390/rs16111882. [Google Scholar] [CrossRef]
6. Jin T, Gu S, Shou Z, Shi H, Zhang M. Investigation of attention mechanism-enhanced method for the detection of pavement cracks. Struct Durab Health Monit. 2025;19(4):903–18. doi:10.32604/sdhm.2025.063887. [Google Scholar] [CrossRef]
7. Huang C, Li H, Yu Z. Intelligent concrete defect identification using an attention-enhanced VGG16-U-Net. Struct Durab Health Monit. 2025;19(5):1287–304. doi:10.32604/sdhm.2025.065930. [Google Scholar] [CrossRef]
8. Ou Y, Su L, Zhu L, Ma Q, He H, Wu F. Laser rangefinder and vision-based 3D structural displacement monitoring. J Infrastruct Intell Resil. 2025;4(4):100158. doi:10.1016/j.iintel.2025.100158. [Google Scholar] [CrossRef]
9. Gu H, Zhu K, Strauss A, Shi Y, Sumarac D, Cao M. Rapid and accurate identification of concrete surface cracks via a lightweight & efficient YOLOv3 algorithm. Struct Durab Health Monit. 2024;18(4):363–80. doi:10.32604/sdhm.2024.042388. [Google Scholar] [CrossRef]
10. Zhang C, Shi J, Huang C. Identification of damage in steel–concrete composite beams based on wavelet analysis and deep learning. Struct Durab Health Monit. 2024;18(4):465–83. doi:10.32604/sdhm.2024.048705. [Google Scholar] [CrossRef]
11. Wu T, Zhu W, Tang L, Lang L, Xu J, Yuan Q, et al. Accurate structural displacement reconstruction from acceleration and computer vision measurements using physics-informed neural networks. Mech Syst Signal Process. 2025;235(1):112961. doi:10.1016/j.ymssp.2025.112961. [Google Scholar] [CrossRef]
12. Shao Y, Li L, Li J, Li Q, An S, Hao H. DIMMC: a 3D vision approach for structural displacement measurement using a moving camera. Eng Struct. 2025;338(5):120566. doi:10.1016/j.engstruct.2025.120566. [Google Scholar] [CrossRef]
13. Zhao W, Shi X, Ni F, Tian Y. Semi-dense sub-pixel displacement measurement for structural health monitoring: a framework of deep learning-based detector-free feature matching. Measurement. 2025;254(2):117899. doi:10.1016/j.measurement.2025.117899. [Google Scholar] [CrossRef]
14. Xie C, Huang B, Wu Z, Hu Y, Liang K, Chen J, et al. A new economical approach for measurement of 3D structural displacement and motion trajectory: utilizing binocular vision and subpixel enhancement with square feature recognition. Structures. 2025;77(11):109178. doi:10.1016/j.istruc.2025.109178. [Google Scholar] [CrossRef]
15. Wei X, Wang C, Wang X, Du Y. Structural health monitoring using urban surveillance cameras: self-calibrated computer vision for enhanced displacement measurement. Structures. 2025;75:108714. doi:10.1016/j.istruc.2025.108714. [Google Scholar] [CrossRef]
16. Jin Y, Ren Y, Xu X, Guo ZY, Guo CY, Li C. A deep learning estimation method for temperature-induced girder end displacements of suspension bridges. Struct Durab Health Monit. 2025;19(2):307–25. doi:10.32604/sdhm.2024.055265. [Google Scholar] [CrossRef]
17. Zhu L, Xie Q, Li Y, Liu F, Liang R, Li J. Deep learning-based displacement identification and quantification for structures with surface features loss. Mech Syst Signal Process. 2025;237:112976. doi:10.1016/j.ymssp.2025.112976. [Google Scholar] [CrossRef]
18. Luo W, Gong F, Song M, Xia Y. A structural 3D displacement measurement method using monocular camera based on multiple feature points tracking. Measurement. 2025;243(7):116406. doi:10.1016/j.measurement.2024.116406. [Google Scholar] [CrossRef]
19. Dougill L, Croxford AJ, Wilcox PD. Extracting sub-pixel displacement measurements using visual vibrometry methods for non-destructive evaluation. J Sound Vib. 2025;614(14):119136. doi:10.1016/j.jsv.2025.119136. [Google Scholar] [CrossRef]
20. Nguyen XT, Jeon G, Vy V, Lee G, Lam PT, Yoon H. A hybrid approach for vision-based structural displacement measurement using transforming model prediction and KLT. Mech Syst Signal Process. 2025;223(2):111866. doi:10.1016/j.ymssp.2024.111866. [Google Scholar] [CrossRef]
21. Liu L, Su H, Zhao P, Liang S, Lei Y. Identify the full-field displacements of high-rise buildings under unknown wind loads using data fusion of partial structural response measurements-deterministic and statistical studies. Eng Struct. 2025;342(3):120918. doi:10.1016/j.engstruct.2025.120918. [Google Scholar] [CrossRef]
22. Jin Z, Chen G, Niu Y, Zhang C, Zhang X, Shu J. Variational mode decomposition-based multirate data-fusion framework for estimating structural dynamic displacement by integrating vision- and acceleration-based measurements. Mech Syst Signal Process. 2024;211(8):111252. doi:10.1016/j.ymssp.2024.111252. [Google Scholar] [CrossRef]
23. Zhu W, Jiang T, Heng J, Chu X, Zhou Z. Enhanced monocular vision system for multi-target deformation monitoring of bridges via oblique photography. Eng Struct. 2025;323:119196. doi:10.1016/j.engstruct.2024.119196. [Google Scholar] [CrossRef]
24. Liu X, Hu B, Yin Y, Zhang Y, Chen W, Yu Q, et al. Parallel camera network: motion-compensation vision measurement method and system for structural displacement. Autom Constr. 2024;165(2):105559. doi:10.1016/j.autcon.2024.105559. [Google Scholar] [CrossRef]
25. Chen W, Yin Y, Hu B, Yu Q, Liu X, Zhang Y, et al. Multipoint dynamic displacement monitoring of long-span beam bridges and their time-space evolution using a camera-chain system. Comput Ind. 2025;168(3):104271. doi:10.1016/j.compind.2025.104271. [Google Scholar] [CrossRef]
26. Wu J, Ma Z, Xue Y, Qin J, You D, Sun G. Displacement monitoring and modal parameter identification of cable net structure based on feature optical flow and binocular stereo vision. Structures. 2025;76:108914. doi:10.1016/j.istruc.2025.108914. [Google Scholar] [CrossRef]
27. Li MZ, Yan ZT, Yang XG, Zhao S. Structural displacement monitoring via improved YOLOv8 structure under complex scenarios. Structures. 2025;73(1):108302. doi:10.1016/j.istruc.2025.108302. [Google Scholar] [CrossRef]
28. Liu G, Luo J, Yang Q, Law SS, He C. Non-contact structural displacement measurement using UAV and DIC with non-coplanar fixed region of interest. Measurement. 2025;242(5):115936. doi:10.1016/j.measurement.2024.115936. [Google Scholar] [CrossRef]
29. Hou J, Zhang Y, Cai E, Guo T, Luo M, Guo J. An automatic method for measuring inter-storey structural displacement based on vision data. Mech Syst Signal Process. 2025;237:113123. doi:10.1016/j.ymssp.2025.113123. [Google Scholar] [CrossRef]
30. He Q, Wang S. Improving 2D displacement accuracy in bridge vibration measurement with color space fusion and super resolution. Adv Eng Inform. 2025;65:103248. doi:10.1016/j.aei.2025.103248. [Google Scholar] [CrossRef]
31. Tang Y, Huang B, Wang S, Zhou J, Xiang Z, Sheng C, et al. Computer vision-based real-time continuous monitoring of the pose for large-span bridge cable lifting structures. Autom Constr. 2024;162(12):105383. doi:10.1016/j.autcon.2024.105383. [Google Scholar] [CrossRef]
32. Yu S, Su Z, Dong S, He X, Yang Y, Zhang J. Enhanced vision-based structural displacement monitoring through deep learning approaches. Comput Ind. 2025;171(4):104337. doi:10.1016/j.compind.2025.104337. [Google Scholar] [CrossRef]
33. Qin J, Long J, Zhang M, Yuan R, Jiang F, Duan W. Long-range nighttime dynamic monitoring of long-span cable-stayed bridge with the enhanced bokeh tracking method using closing operation and long short-term memory networks. Eng Struct. 2025;342(2):120913. doi:10.1016/j.engstruct.2025.120913. [Google Scholar] [CrossRef]
34. Zhang S, Ni P, Wen J, Han Q, Du X, Xu K. Automated vision-based multi-plane bridge displacement monitoring. Autom Constr. 2024;166:105619. doi:10.1016/j.autcon.2024.105619. [Google Scholar] [CrossRef]
35. Qu X, Ding X, Xu YL. Simultaneous monitoring of displacement and rotation of a long-span bridge based on innovative integration of GNSS and accelerometer measurements. Eng Struct. 2025;338(7):120518. doi:10.1016/j.engstruct.2025.120518. [Google Scholar] [CrossRef]
36. Zhang S, Ni P, Han Q, Wen J, Du X, Li J. Measurement uncertainty quantification for computer vision-based structural dynamic displacement monitoring. Measurement. 2025;253:117835. doi:10.1016/j.measurement.2025.117835. [Google Scholar] [CrossRef]
37. Grompone Von Gioi R, Randall G. A sub-pixel edge detector: an implementation of the canny/devernay algorithm. Image Process Line. 2017;7:347–72. doi:10.5201/ipol.2017.216. [Google Scholar] [CrossRef]
38. Luo K, Kong X, Li J, Hu J, Deng L. Motion magnification for video-based vibration measurement of civil structures: a review. Mech Syst Signal Process. 2024;220:111681. doi:10.1016/j.ymssp.2024.111681. [Google Scholar] [CrossRef]
39. Lu C, Xia S, Shao M, Fu Y. Arc-support line segments revisited: an efficient high-quality ellipse detection. IEEE Trans Image Process. 2020;29:768–81. doi:10.1109/TIP.2019.2934352. [Google Scholar] [PubMed] [CrossRef]
40. Luo K, Kong X, Zhang J, Hu J, Li J, Tang H. Computer vision-based bridge inspection and monitoring: a review. Sensors. 2023;23(18):7863. doi:10.3390/s23187863. [Google Scholar] [PubMed] [CrossRef]
41. Zhang Y, Liu P, Zhao X. Structural displacement monitoring based on mask regions with convolutional neural network. Constr Build Mater. 2021;267(5):120923. doi:10.1016/j.conbuildmat.2020.120923. [Google Scholar] [CrossRef]
42. Wang M, Ao WK, Bownjohn J, Xu F. A novel gradient-based matching via voting technique for vision-based structural displacement measurement. Mech Syst Signal Process. 2022;171(6):108951. doi:10.1016/j.ymssp.2022.108951. [Google Scholar] [CrossRef]
Cite This Article
 Copyright © 2026 The Author(s). Published by Tech Science Press.
This work is licensed under a Creative Commons Attribution 4.0 International License , which permits unrestricted use, distribution, and reproduction in any medium, provided the original work is properly cited.
 Downloads
 Citation Tools