
 Submit a Paper
 Open Access
ARTICLE
Evaluation of Environmental Sound Pressure Level, Drawing of Noise-Isosonic Map Using Surfer V.19, and Prioritization of Engineering Noise Control Methods Using the Analytic Hierarchy Process (AHP): A Field Study in CGS Stations
1 Department of Occupational Health Engineering and Safety at Work, Faculty of Public Health, Kerman University of Medical Sciences, Kerman, 7616913555, Iran
2 Social Determinants of Health Research Center, Institute for Futures Studies in Health, Kerman University of Medical Sciences, Kerman, 7616913555, Iran
3 Department of Occupational Health and Safety, School of Health, Larestan University of Medical Sciences, Larestan, 7467155863, Iran
4 Student Research Committee, Kerman University of Medical Sciences, Kerman, 7616913555, Iran
5 Department of Industrial Engineering, Shahid Bahonar University of Kerman, Kerman, 7616913555, Iran
6 Department of Occupational Health Engineering and Safety at Work, Faculty of Public Health, Urmia University of Medical Sciences, Urmia, 5714783734, Iran
7 Department of Occupational Health Engineering, School of Health, Isfahan University of Medical Sciences, Isfahan, 8174673461, Iran
* Corresponding Author: Reza Esmaeili. Email:
Sound & Vibration 2022, 56(3), 275-291. https://doi.org/10.32604/sv.2022.020207
Received 11 November 2021; Accepted 16 December 2021; Issue published 10 August 2022
 View Full Text
 Download PDF
Abstract
Noise pollution is one of the most significant harmful physical factors in the industrial and occupational environments. Due to the high costs of exposure to excessive noise; continuous sound evaluation, propose and implement noise control plans in occupational environments is necessary. Thus, the present study aimed to review environmental sound measurements, drawing of noise maps, and prioritizing the engineering noise control methods using the Analytic Hierarchy Process (AHP). This study was a descriptive-analytical study that aimed to assess occupational noises and present a control plan in the City Gas Stations (CGSs) of Kerman, Iran in 2021. The present study was done in two phases. In the first phase, six CGSs were investigated to measure and evaluate the noise. In addition, the noise map of a CGS was drawn using the Surfer software. Finally, the AHP was used in the second phase of the research to prioritize the control measures. In this phase, four criteria and ten alternatives were identified. According to first phase results, the sound pressure level (SPL) of the stations varied from 76 to 98 dBA. Besides, the majority of the studied stations had a sound level higher than 85 dBA (danger zone). The second phase of the study showed that out of the four evaluated criteria, the executability criterion had the highest impact and the cost criterion had the lowest impact on the selection of control measures with a weight of 0.587 and 0.052, respectively. Based on the results of prioritization of the alternatives, using a silenced regulator (weight of 0.223) and increasing the thickness of the tube (weight of 0.023) had the highest and lowest priorities among the alternatives, respectively. The use of engineering noise control methods such as using silenced regulators was the best way to control the noises of CGSs. Additionally; it is noteworthy that AHP is a practical method for prioritizing alternatives to achieve the most accurate decision-making. The results of AHP can be of great help to health and safety experts and managers in choosing the sound engineering control measures more precisely.Keywords
Nomenclature
| AHP | Analytic Hierarchy Process |
| CGSs | City Gas Stations |
| SPL | Sound Pressure Level |
| WHO | World Health Organization |
| ISO | International Organization for Standardization |
| TBS | Town Board Station |
| MCDM | Multi-Criteria Decision-Making |
| SIR | Superiority and Inferiority Ranking |
| MAUT | Multi-Attribute Utility Theory |
| ELECTRE | Elimination and Choice Corresponding to Reality |
With the ascending growth of industries and manpower, noise pollution is currently one of the most important physically harmful factors in such environments, and it can be regarded as one of the biggest concerns affecting the quality of environmental and urban life worldwide [1]. About 30 million workers in the United States [2] and between 4 and 5 million people in Germany (equivalent to 12% to 14%) of the workforce are exposed to the illegally excessive sound levels defined by the World Health Organization (WHO) [3]. Moreover, according to the statistics provided by the Center of Environmental and Occupational Health affiliated with Iran’s Ministry of Health, more than two million workers are exposed to harmful occupational noises [4]. Exposure to excessive noise levels can cause many health problems such as stress [5], peripheral vascular irritation and hypertension [6,7], cardiovascular problems [8,9], fatigue, sleep disorders, psychosis, and hearing loss [10,11]. Also, excessive exposure to noise can increase oxidative stress and decrease speech comprehension, concentration, and performance in individuals and ultimately increase the risk of accidents in the workplace [12–14]. Therefore, the need to address the noise-related issues as well as prevention of health issues caused by such exposures can also be justified from an economic viewpoint [15]. Due to the high costs of excessive exposure to noise, it is necessary to propose and implement noise control measures in occupational environments [16]. Thus, in addition to legal, administrative, and educational measures, proposing technical control solutions and alternatives to solve the problems caused by noise exposure is of great importance to ensure the health of employees [17].
Various industrial activities can be a source of noise pollution for workers as well as people living in the vicinity of such industries. One of these industries is the city gas refining and exploitation industry. The rapid growth of the demand for natural gas in the world, and particularly in Iran, has caused an annual increase in the gas pipelines and gas pressure reducing stations, many of which have obvious problems with noise pollution [18]. The constant noises of such stations not only have detrimental effects on people’s health but can also damage the pipeline measurement tools and severely harm production safety. Sound generating sources in such industries include fans, compressors, regulators, pumps, boilers, ventilation systems, electrical equipment, and cooling towers, which are generally regarded as the main source of low-frequency noises [19].
In the industries associated with natural gas distribution, the gas pressure must be within the permitted range before reaching the distribution point for consumption. The natural gas extracted from gas and oil wells enters the refinery at a pressure of 4000 psi and exists at 1000 psi. Continuity of the gas flow is maintained by the compressor stations. Refined gas enters the City Gate Stations (CGS) through the main pipeline. Then, the pressure is reduced to 250 psi by the CGS, and the refined gas enters the Town Board Station (TBS). TBS reduces the gas pressure again to 60 psi, and it then enters the main distributor [20]. A lot of noise is created in these stations due to the existing gas flow, gas pressure reduction in the station, gas discharge, and periodic inspection of gas measurement tools [20]. Intra-city gas pressure is one of the main sources of noise pollution by increasing gas consumption and excessive overload. Due to these reasons, the noise level usually exceeds the safe zone (82 dBA) in the site area, and if the noise in them is not controlled, the workers’ hearing system may be damaged [19].
Decision-making is defined as the process of determining the best option among all available options. Nonetheless, in most cases, it is difficult to achieve the optimum result as decision-makers often face various problems when it comes to making certain decisions. Multi-criteria decision-making (MCDM) is one of the most commonly used methods in the decision-making process and is used to identify the best of all available choices [21]. There are numerous techniques to perform MCDM, including AHP, superiority and inferiority ranking (SIR), Simos’ ranking method, multi-attribute utility theory (MAUT), and elimination and choice corresponding to reality (ELECTRE) [22]. The AHP technique has been widely used to prioritize control measures in order to make decisions to control and reduce noise level [16,23,24]. The AHP technique, which was proposed by Saaty in 1980, is a multi-criteria decision-making method widely used to determine the weight of criteria and prioritize them in a structured way based on the pairwise comparison [25]. This technique examines a problem or a factor hierarchically, from goal to criteria, sub-criteria, and alternatives at successive levels [26]. A hierarchical assessment provides experts with an overview of intrinsic complex relationships in a certain field and allows them to compare various factors based on their weight using a 9-level scale [27].
Therefore, since noise is the most prevalent detrimental and harmful factor in the workplace and considering the high prevalence of noise-induced hearing loss in the industries and the high importance of proposing control measures to reduce harmful noises in an occupational environment, the present study was designed to meet the following goals:
• Assessing the environmental SPL
• Drawing a noise isosonic map (aligned lines) to determine the danger, caution and safety points using Surfer V.19 software
• Providing engineering noise control strategies in CGS stations
• Prioritization of the proposed strategies based on the results of the evaluation of the environmental SPL using the AHP technique
Authors are encouraged to use the Microsoft Word template when preparing the final version of their manuscripts. In introduction, authors should provide a context or background for the study (that is, the nature of the problem and its significance). State the specific purpose or research objective of, or hypothesis tested by, the study or observation. Cite only directly pertinent references, and do not include data or conclusions from the work being reported.
The present research was a descriptive-analytical study with the goal of evaluating occupational noise and presenting a control plan in CGSs in Kerman, Iran in 2021. Firstly, the required information was collected from six different CGSs. Geographical locations, output capacity, the number of gas transmission lines, and the required technical information were specified. Finally, the dimensions, types of surfaces, and sound-generating components in each station were determined through an inspection. Next, the obtained data were used to assess the sound in several stages. The present research was conducted as following steps:
1) Evaluation of the environmental noise in accordance with the ISO 9612: 2009 and ISO 11200: 2014 standards; 2) Drawing the noise isosonic map using Surfer V.19 software based on the measurement results; 3) Identifying the main noise sources and selecting the first priority in relation to noise control among all parts given the noise maps; 4) Proposing and prioritizing the engineering noise control methods using AHP to choose the best noise pollution control method.
2.2 Measuring the Environmental SPL in CGSs
The sound level meter model CEL-450 made by the Casella-Cel company in England was used in the frequency distribution network A and at a slow speed in order to measure the environmental SPL in the chosen areas. The previously mentioned sound level meter was calibrated by the Cel calibrator model 2/110. The environmental noise was measured based on the ISO 9612: 2009 and ISO 11200: 2014 standards [28,29] to determine the level of noise pollution in the units and identifying the main sound generating sources [30,31]. In this study, the studied units were divided into equal squares (5 × 5 m2), and the centers of these squares were determined as the measuring points [32–34]. Since the environmental noise was constant in this industrial unit and the sound did not change much given the time, the sound was measured a minimum of three times in each area, and the average of these three readings was recorded as the sound level in the station. The microphone was placed and pointed towards people’s heads, of course without their presence, according to the recommendations presented in the ISO9612: 2009 standard. The distance between the microphone of the sound level meter and the ground level was about 1.55 ± 0.075 m [29–35].
2.2.1 Calculating the Average Environmental SPL
The Eq. (1) was used to estimate the average environmental SPL [36]:
where
2.3 Drawing the Noise Zoning Map and the Noise-Isosonic Map
The isosonic and noise maps are common drawing methods in expressing and evaluating environmental noises. These maps determine various areas of the workplace based on the determined zones of sound pressure level. To draw the maps, firstly, the workplace was divided into checkerboard areas with the same dimensions (5 × 5 m2). Then, the center of each area of the station was determined for SPL measurements. After the measurements, the results were recorded in the factory’s stationed plan and then were put in the Surfer V.13 software in a file format (input) [37]. Following that, the isosonic and noise maps were drawn by taking into account the three SPL zones. In the isosonic maps, different points from the same level were connected to one another, and the so-called “isosonic curves” were drawn. These lines showed the SPL zones like topographic maps:
• Safe zone (SPL < 65 dBA) with the green color
• Caution zone (65 dBA < SPL < 85 dBA) with the yellow color
• Danger zone (SPL > 85 dBA) with the red color
The outcome was a zoned and color-coded and a leveled map displaying the safe, cautious, and danger zones, the most important of which was the danger zone as well as control measures were concerned [36].
2.4 Performance and Prioritization of the AHP Process
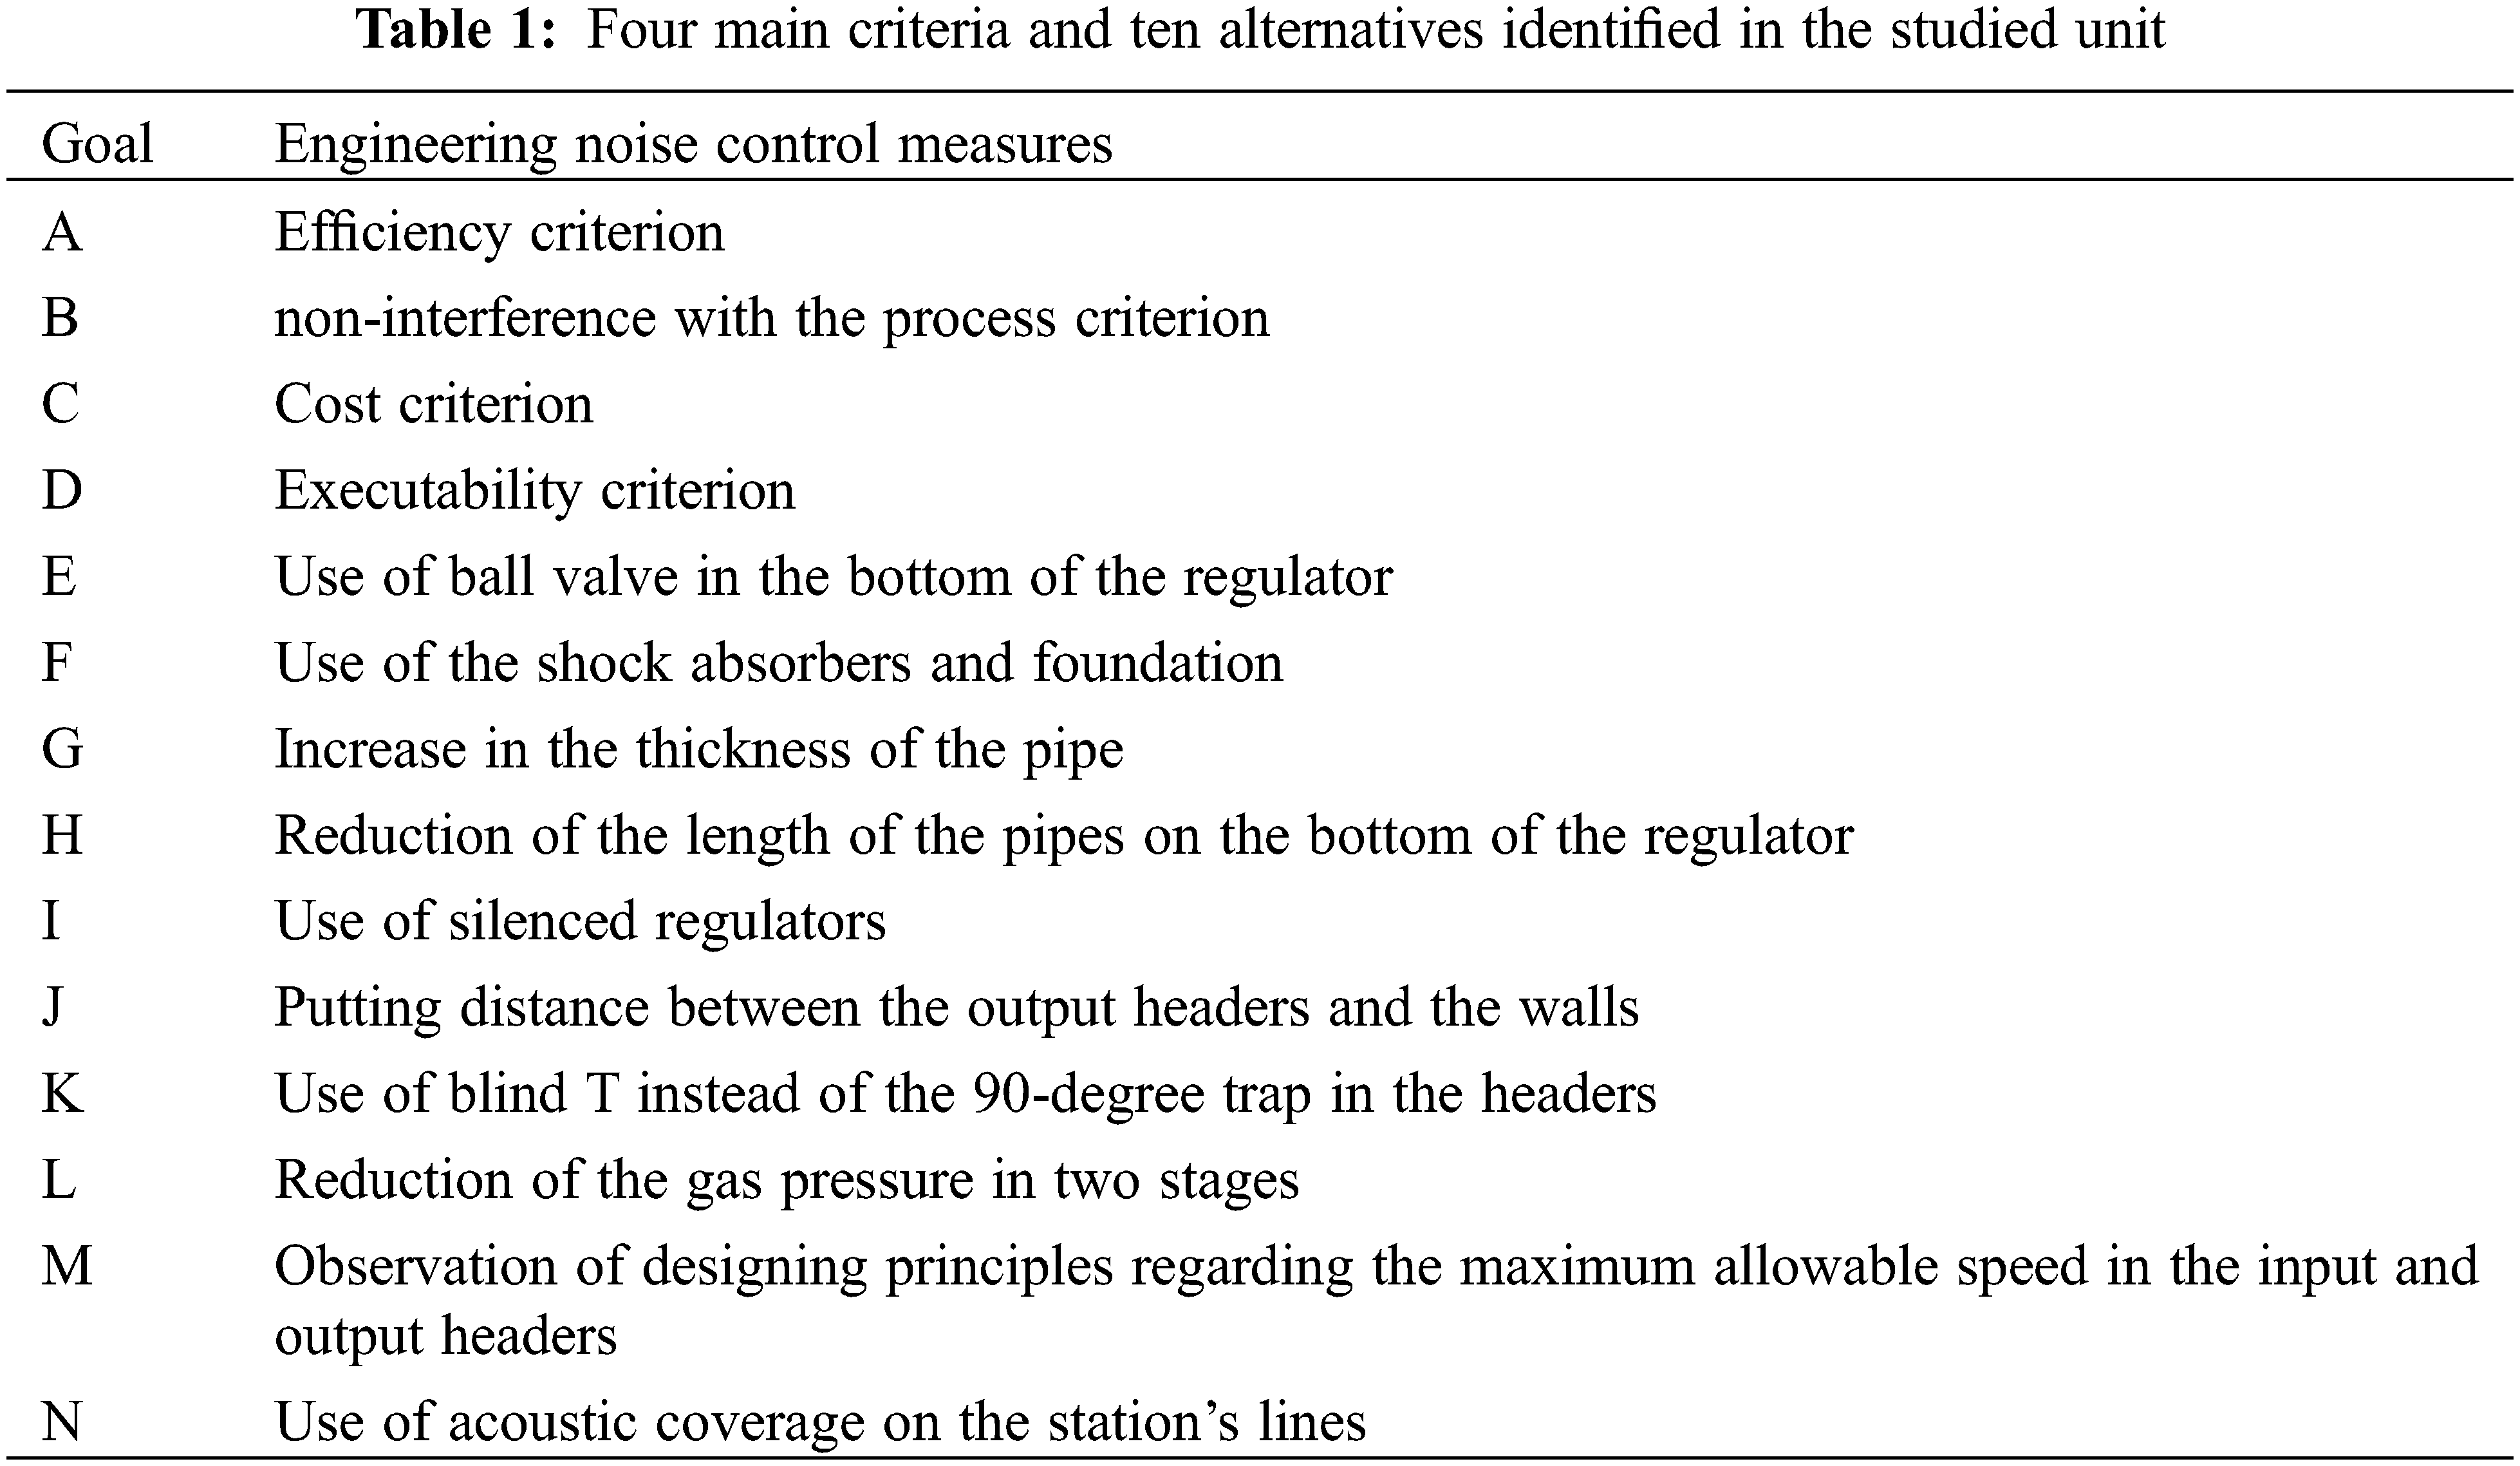
2.4.1 Determining the Goal, Criteria, and Alternatives as an Engineering Noise Control Methods in Accordance with the Experts Pane
The engineering noise control methods reduce the workers’ exposure to noise. Principles of engineering control include making changes in the noise sources such as installing mufflers, reducing sound emission in the environment like using absorbents, barriers, and installing complete enclosures [38]. Ten experts were involved in the present study, including university professors, health and safety specialists and supervisors with over ten years of experience in the CGS stations. A comparative questionnaire and a Likert-based questionnaire were distributed among the previously mentioned experts to assess the criteria and to evaluate the alternatives based on the criteria. The experts were asked to fill out these two questionnaires. In this study, four main criteria were identified based on the experts’ opinions and field studies, and also, ten alternatives (engineering noise control methods) were identified based on Table 1.
A communication matrix is firstly developed, and both the rows and the columns of the said matrix contain effective factors. Then, the final structure of the issue is obtained as a tree. At an overall glance, it can be stated that the development of the hierarchy depends on the type of decision that must be made. The goal is at the top of the AHP network. The goal is followed by the criteria and the alternatives are at the bottom of the lowest level of the network [39]. Fig. 1 displays the resultant AHP network in current study.
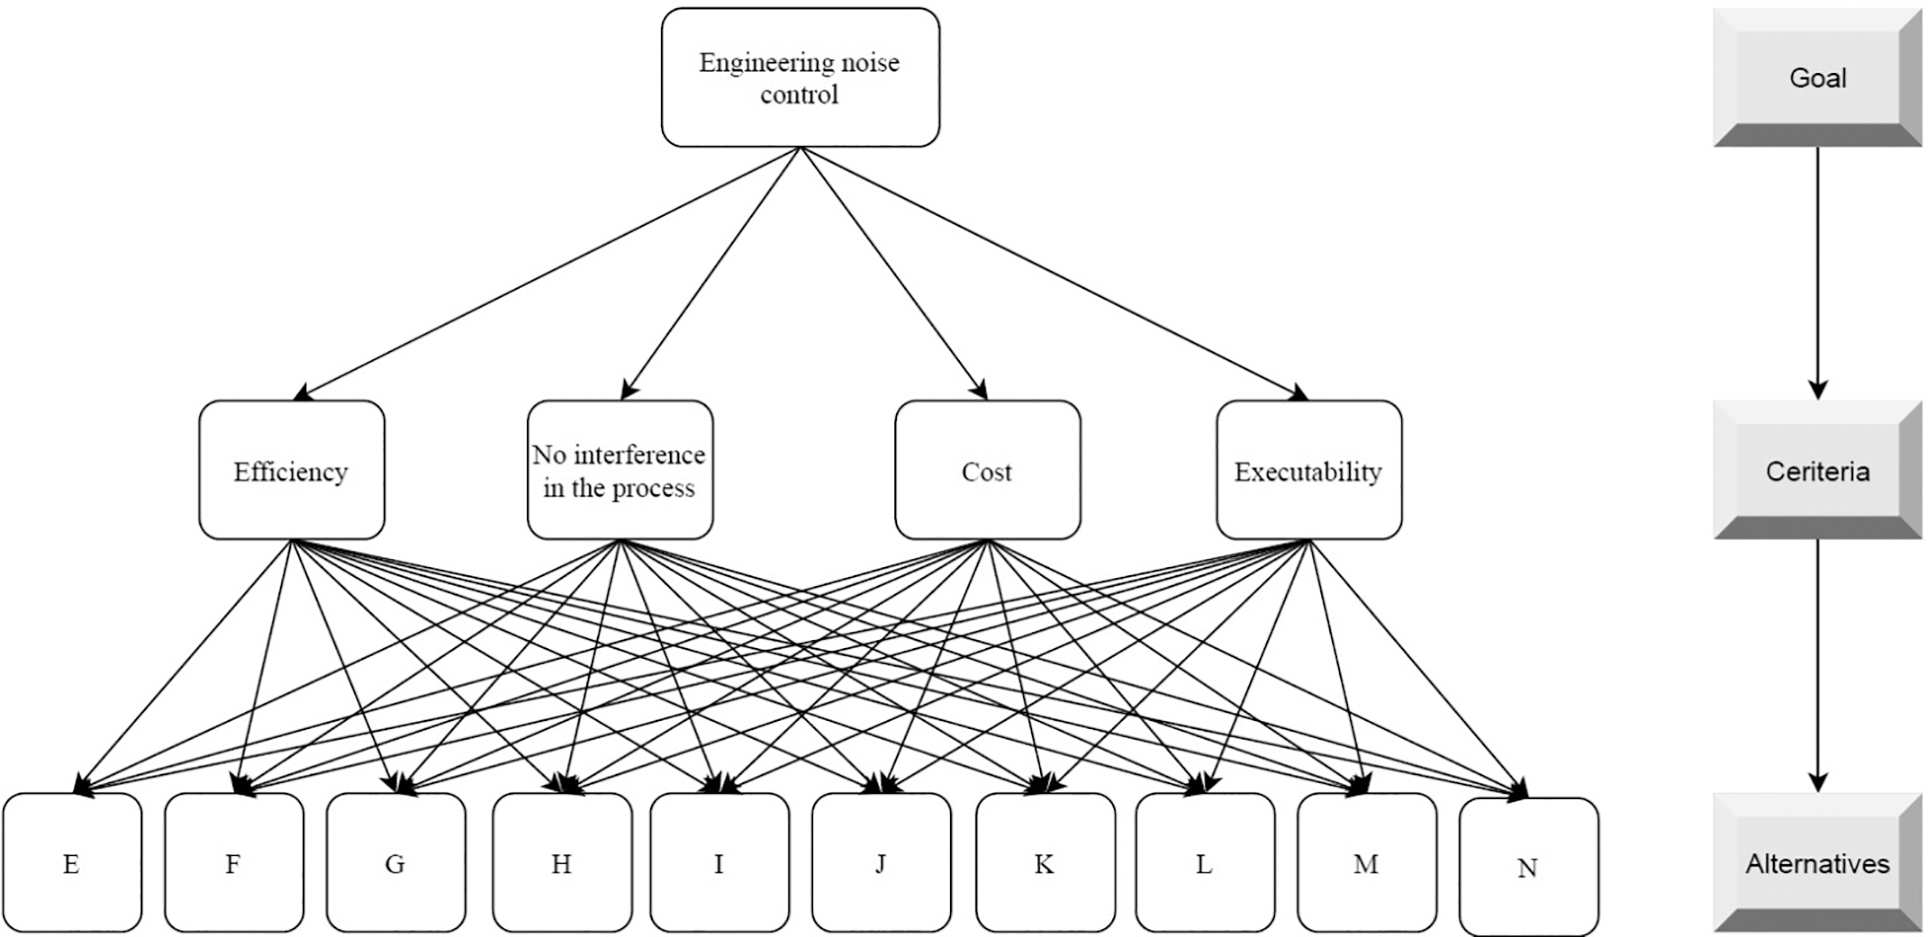
Figure 1: AHP network drawn based on criteria and alternatives in the CGSs
2.4.3 Designing the Preferential Judgment Questionnaire (Pairwise Comparisons)
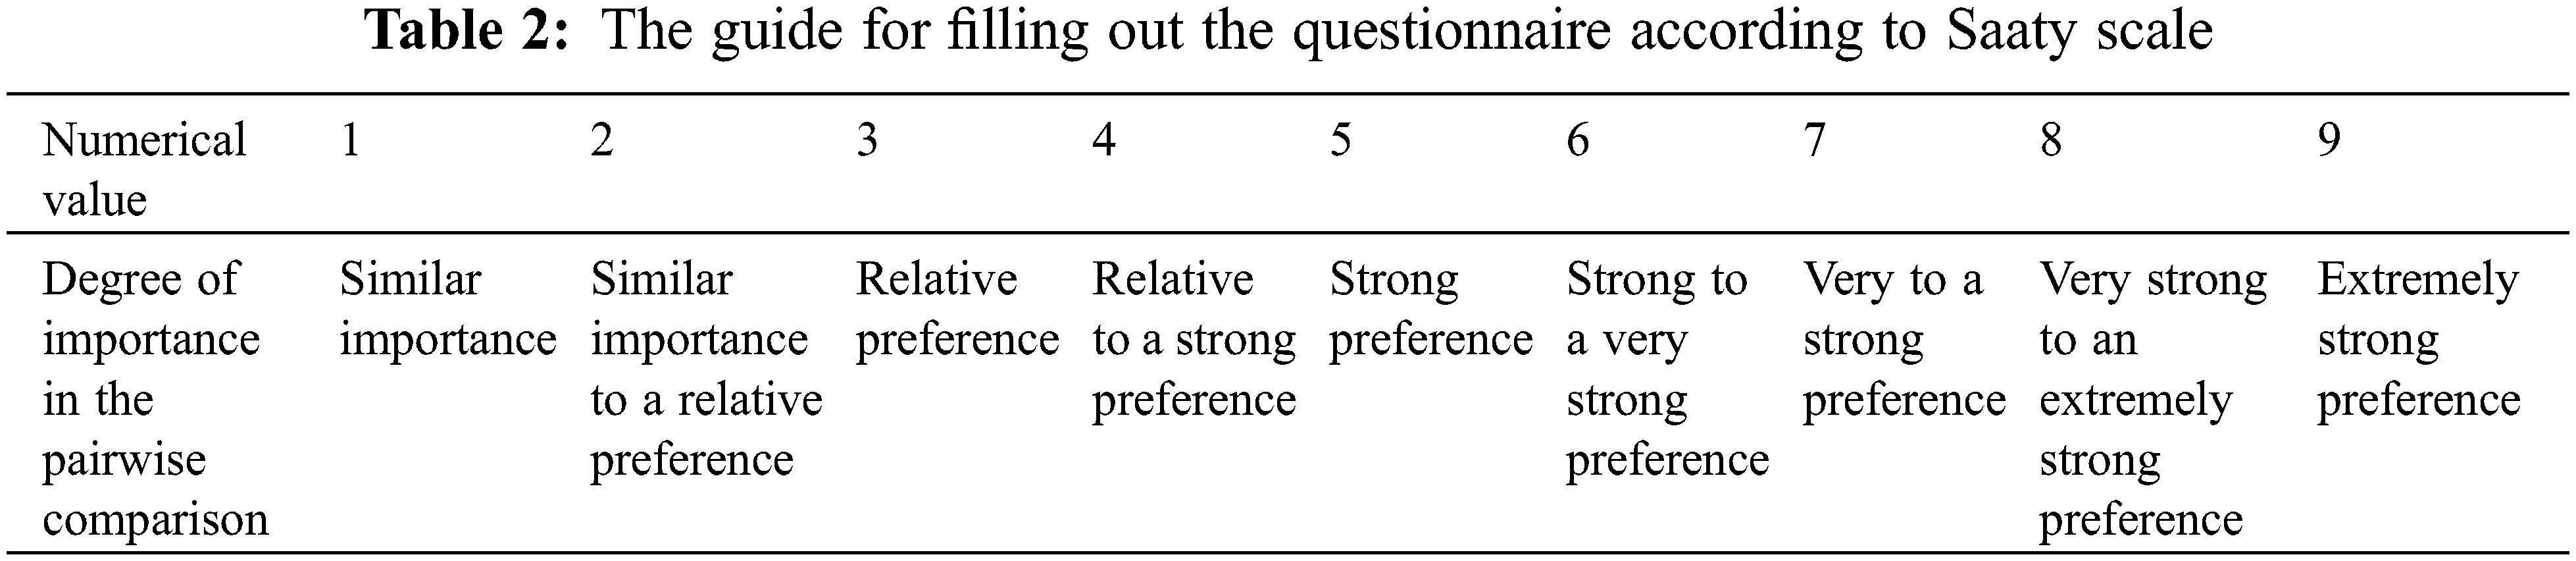
As an input for the AHP, a questionnaire must be designed to become aware of the views of the target population and performing pairwise comparisons based on them. For this purpose, a questionnaire was designed based on the 1–9 Saaty scale. The said questionnaire contained the criteria and alternatives. It must be distributed among a number of technical experts in the industry and experienced health specialists active in the field of noise management and control. Then, the criteria and alternatives must be determined based on the scores given by experts. Finally, the chosen items should be used based on the AHP technique to quantify the weight of engineering noise control measures [25].
Following guide is useful for filling out the questionnaire according to the 1–9 Saaty scale:
Experts must give each question a score from 1 to 9. A score of 1 indicates the equal importance of the two elements, and a score of 9 indicates the great significance of one element in comparison to another element. The degree of importance of the scores (1 to 9) in the pairwise comparisons has been presented in the Table 2 [25].
2.4.4 Prioritization Using AHP
AHP analyzes complex issues, simplifies them, and attempts to solve them. This method has been widely used in economic and social issues, and more recently, it has also been employed in management. The following steps must be taken after constructing the structure of the issue to solve a problem or make a decision [40]:
• Estimating the weights
• System consistency
Relative weight is calculated using a pairwise comparison matrix, while the absolute weight is the final rank of each option which is calculated by combining relative weights [40].
Calculation of Relative Weights
In AHP, firstly, the elements are compared in pairs, and then the pairwise comparison matrix is developed according to Eq. (2). Next, the relative weight of the elements is computed using this matrix. In general, a pairwise comparison matrix is displayed as follows in which aij indicates the preference of the element i to element j, which is obtained from the value of aij of the weight of the elements, i.e., wi [40].
Calculation of the Final Weight
The final weight of each option in AHP is calculated by multiplying the importance of the criteria by the weight of the options.
Calculation of the Rate of Inconsistency
A matrix may be compatible or incompatible. When the matrix is compatible, it is easy to calculate the weight of the elements as it is only obtained from normalizing each column. However, multiple methods can be used for estimating the weight in incompatible matrixes. In addition to estimation of weight in incompatible matrixes, estimation of the rate of inconsistency is of great significance as well. In general, it can be said that the acceptable inconsistency rate of a matrix or a system depends on the decision-maker. However, Saaty presents 0.2 as the acceptable rate of inconsistency and believes that if the rate of inconsistency is higher than 0.1, it must be reviewed [41].
The IBM SPSS Statistics software ver. 26 was used to analyze the collected data, and Excel was employed to present the results as a graph. In this study a descriptive static analysis was used to analysis data. Furthermore, the noise map was prepared based on the results of the existing measurements using Surfer ver. 19.2.213. The Expert Choice Software was used to evaluate and prioritize the engineering noise control measures.
The present study has been confirmed by the Ethics Committee of Kerman University of Medical Sciences with the code IR.KMU.REC.1399.027.
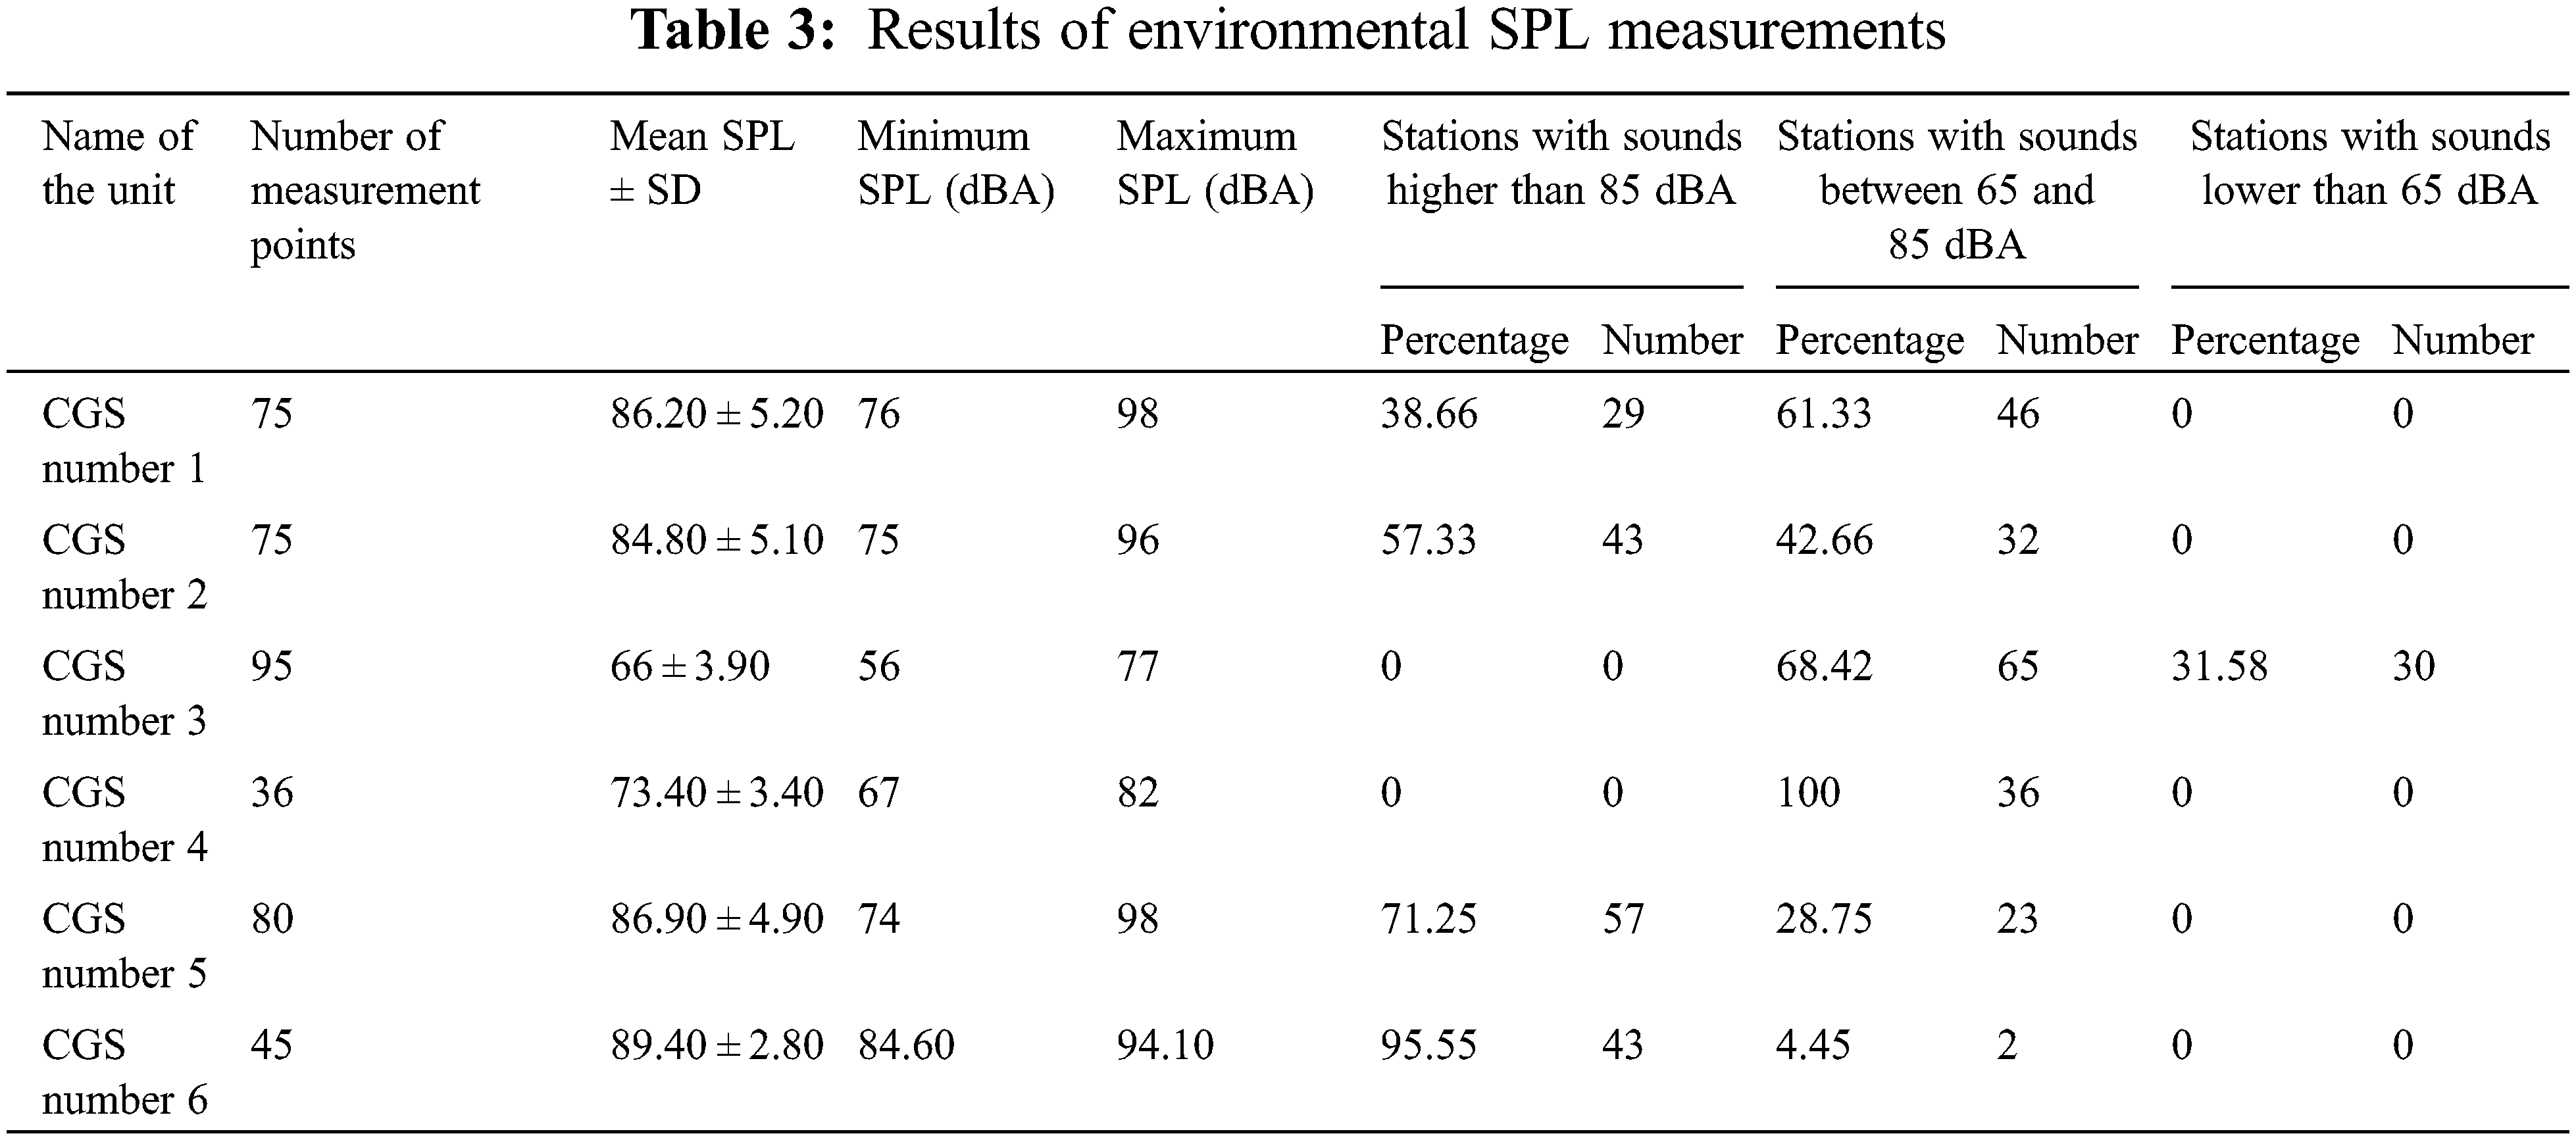
3.1 Environmental SPL Measurements
Table 3 displays the results of measuring the environmental SPL of the six studied CGSs. The number of measurement points, blind spots, mean, standard deviation, minimum, and maximum of SPL in each CGS have been displayed. The majorities of the evaluated points were in the danger zone and had SPL of higher than 85 dBA.
3.2 Noise Map of the Studied Stations
Given the fact that engineering noise control methods must be presented based on the worst-case scenario, Fig. 2 shows the noise map of CGS number 5 as the worst station in terms of noise generation among all six stations. The danger zone is very important for implementing the engineering noise control measures.
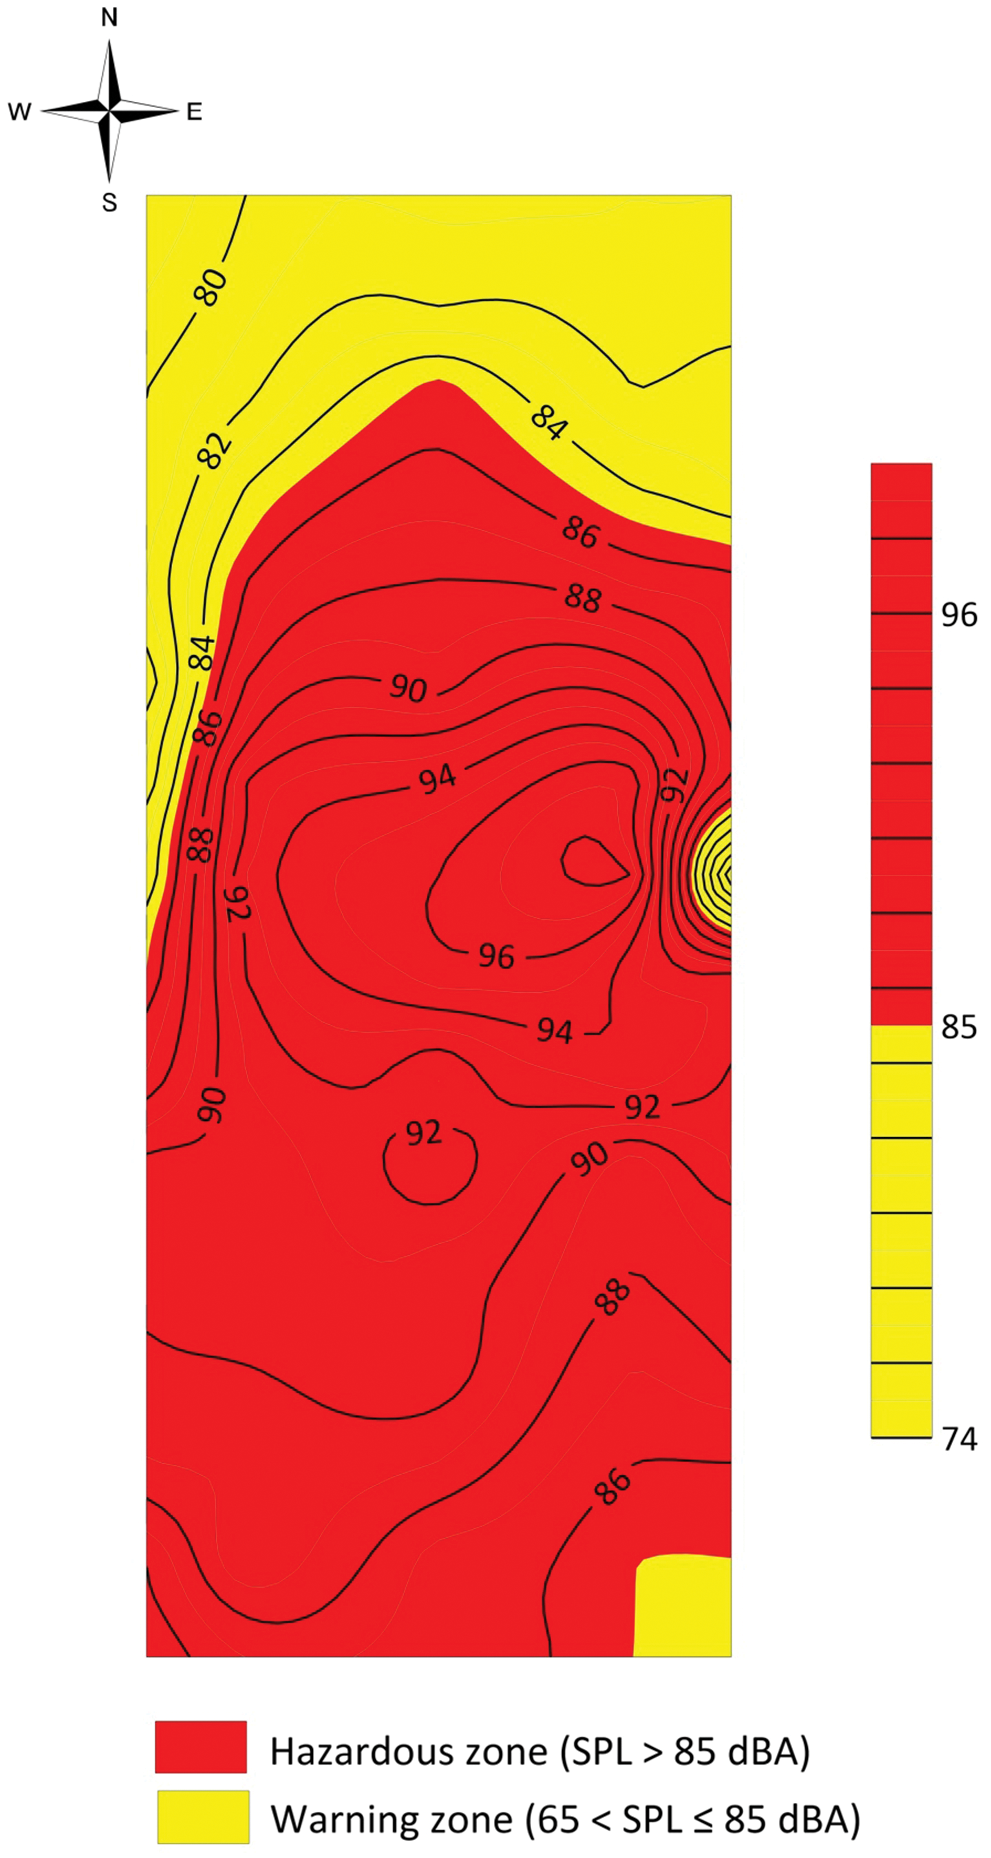
Figure 2: Noise map and isosonic points of CGS number 5 drawn using the Surfer software
3.3 Prioritization of Engineering Noise Control Measures Using the AHP Technique
The AHP technique was used to carry out the process of prioritization of the criteria and the alternatives. The obtained results have been presented in the following sections.
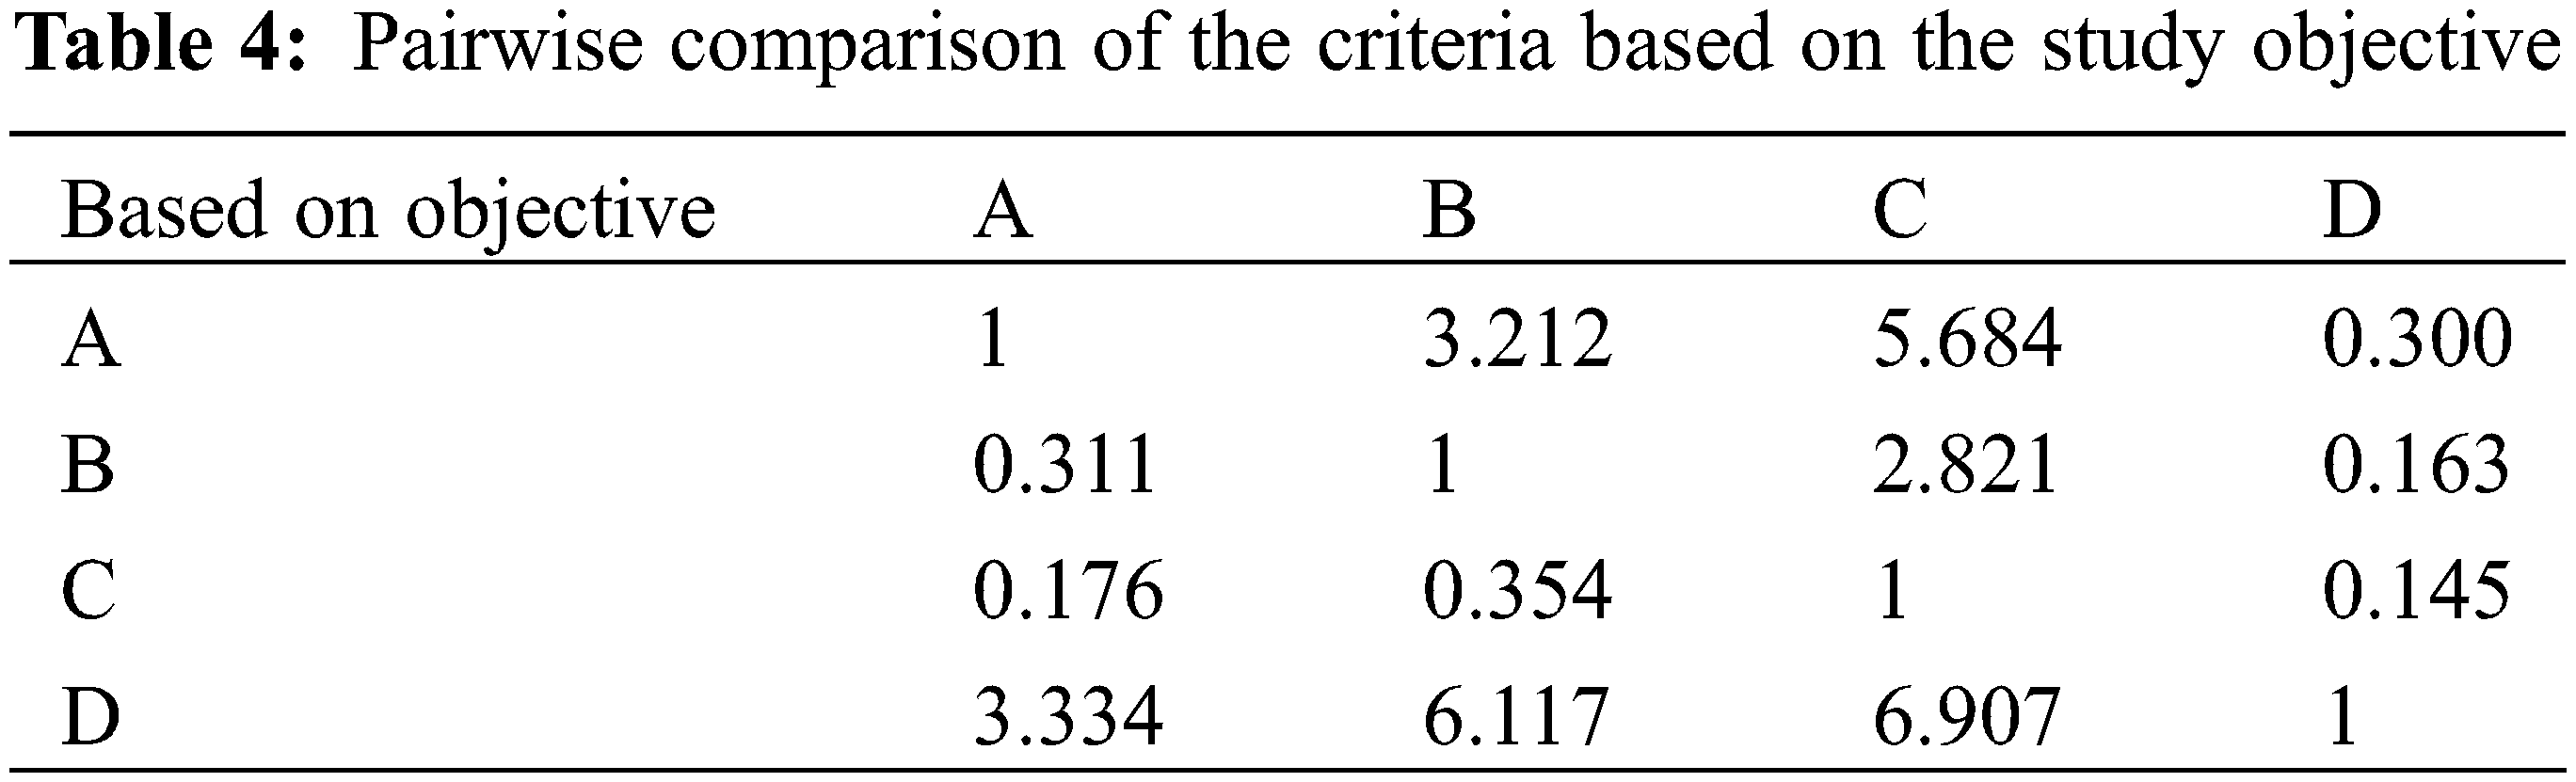
3.3.1 Pairwise Comparison of the Criteria Based on the Goal (Inconsistency Rate of 0.056)
Table 4 presents the pairwise comparison of the criteria based on the objective of the study. According to the results, criterion D (executability) was the first priority among all criteria.
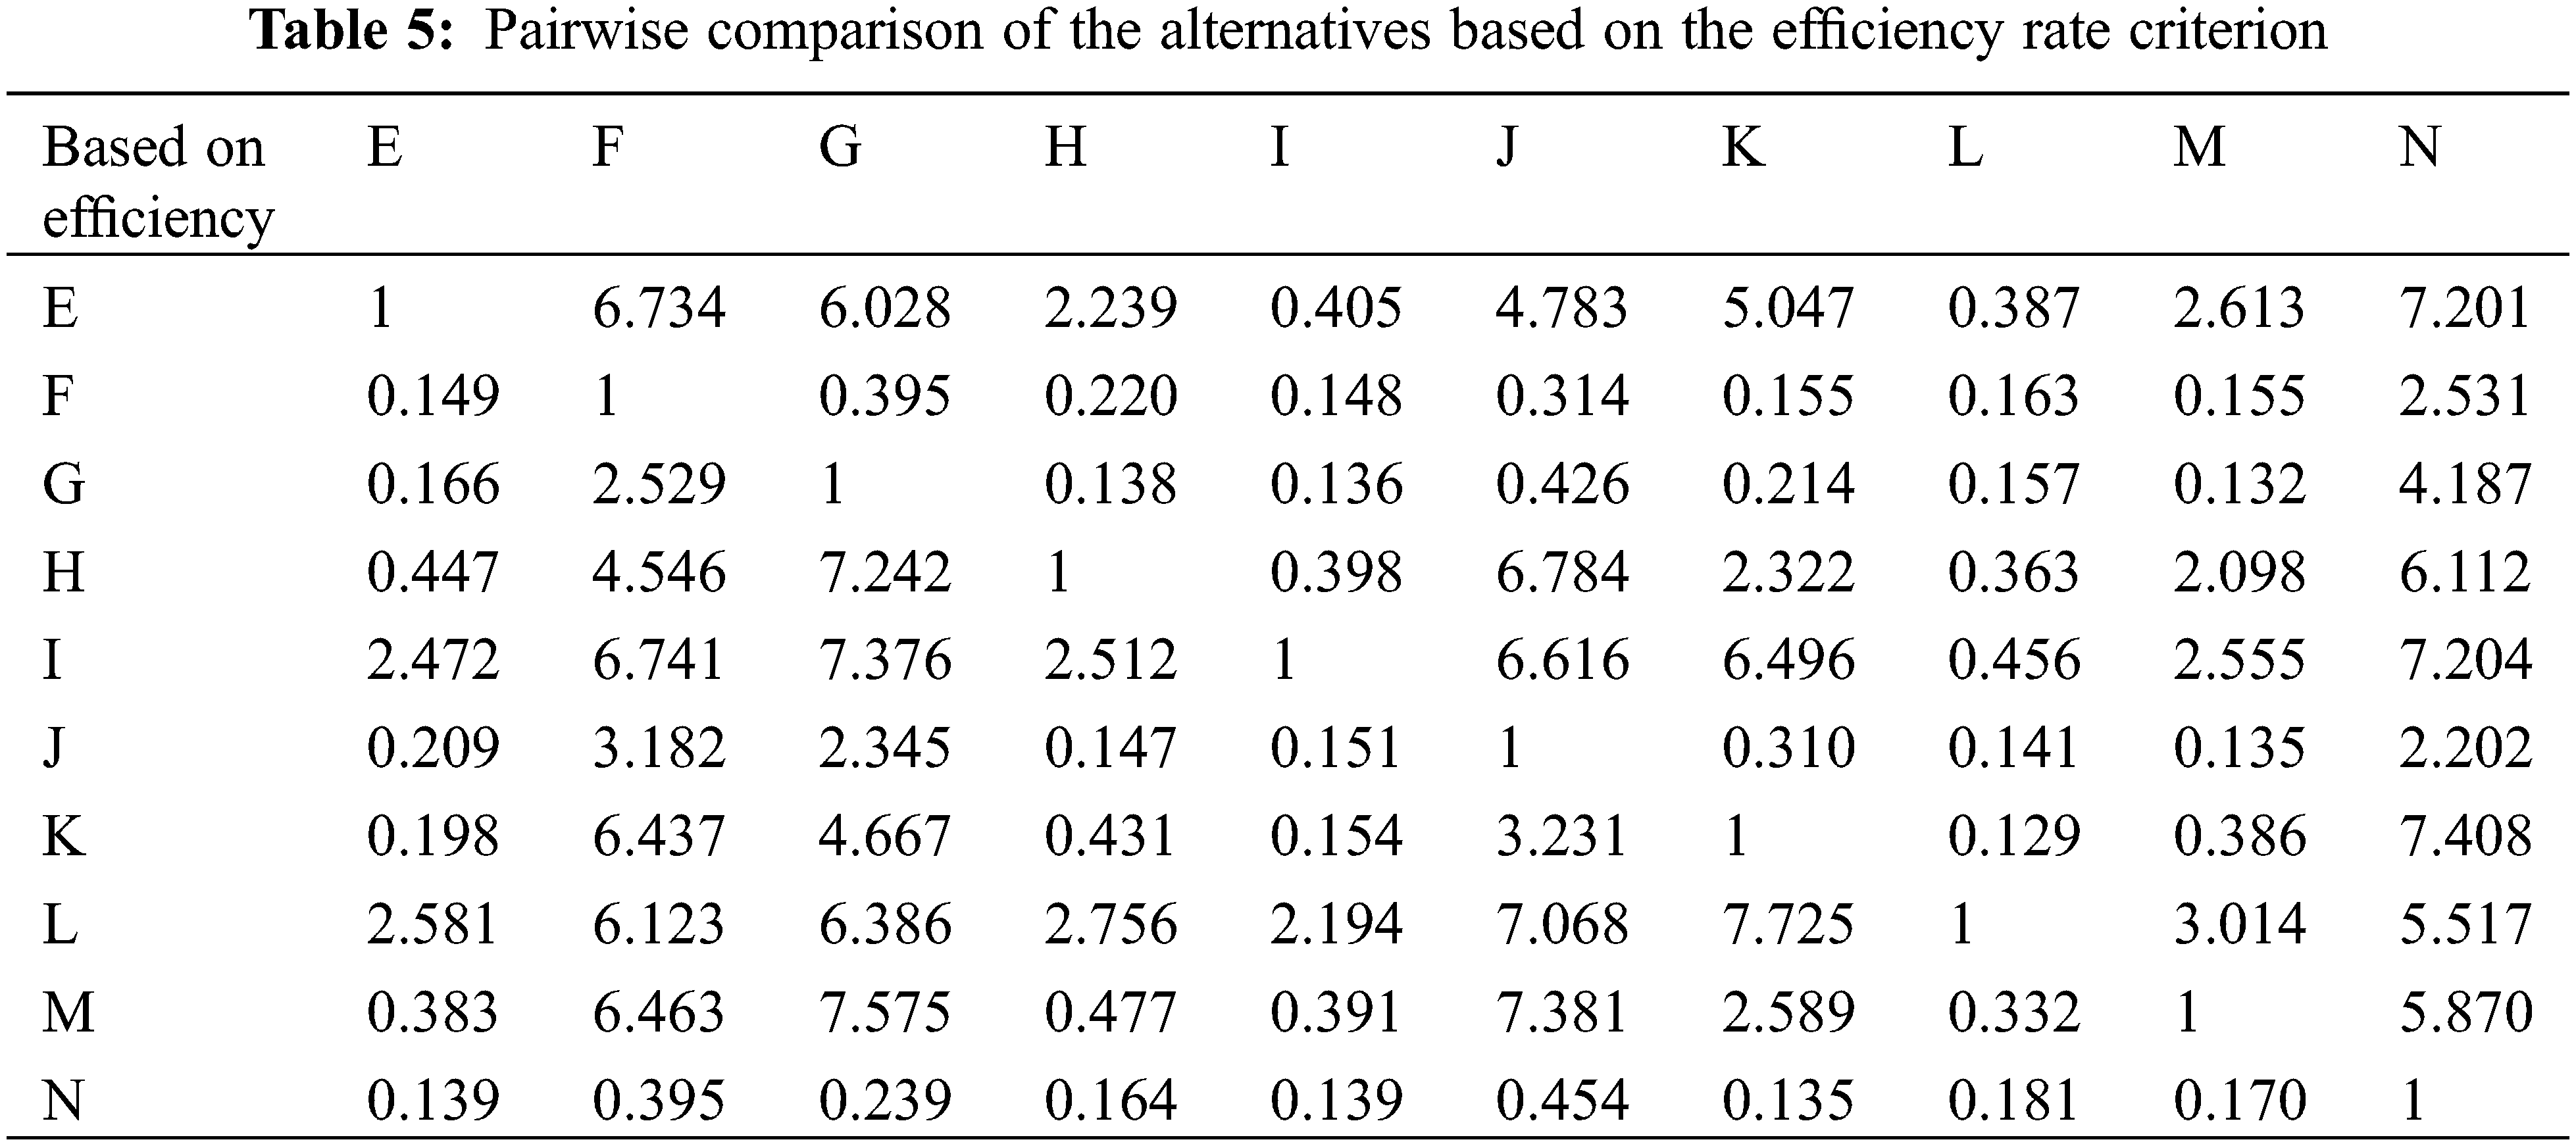
3.3.2 Pairwise Comparison of the Alternatives Based on Criterion A = Efficiency Rate (Inconsistency Rate of 0.097)
Table 5 presents the pairwise comparison of the alternatives based on efficiency rate of each measure. Based on this criterion, “reduction of the gas pressure in two stages” and “Increase in the thickness of the pipe” were the highest and lowest priorities, respectively.
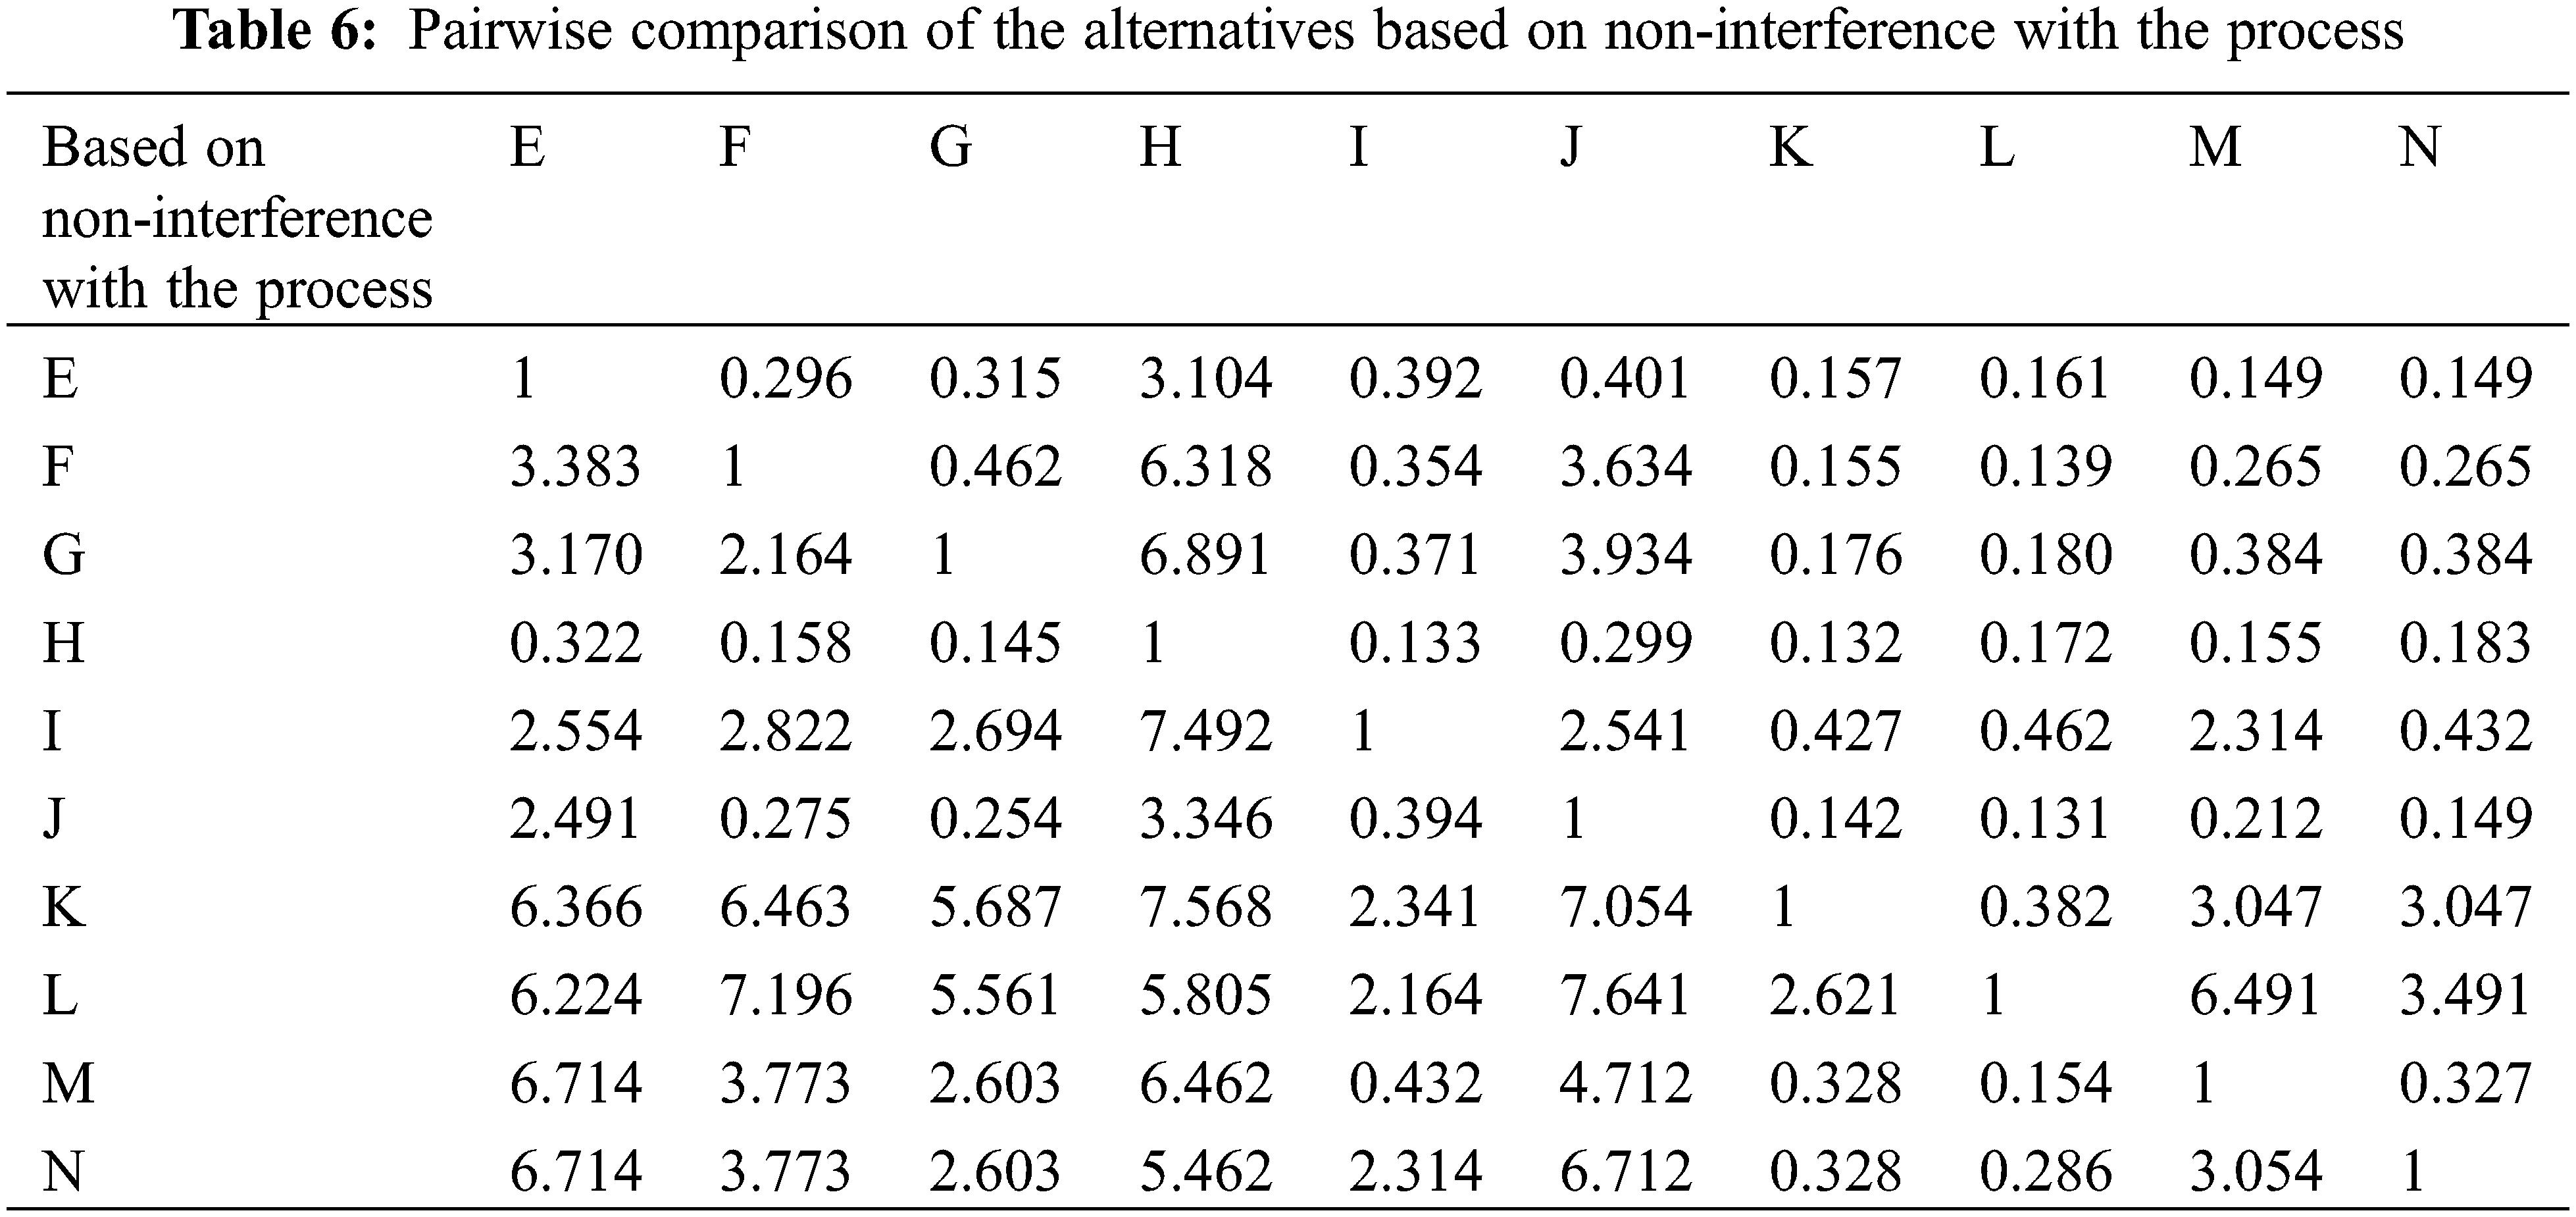
3.3.3 Pairwise Comparison of the Alternatives Based on Criterion B = Non-Interference with the Process (Inconsistency Rate of 0.094)
Table 6 presents the pairwise comparison of the alternatives based on non-interference with the process criterion. This criterion showed, “reduction of the gas pressure in two stages” and “use of a ball valve on the bottom of the regulator” were the highest and lowest priorities in the two phases of the study, respectively.
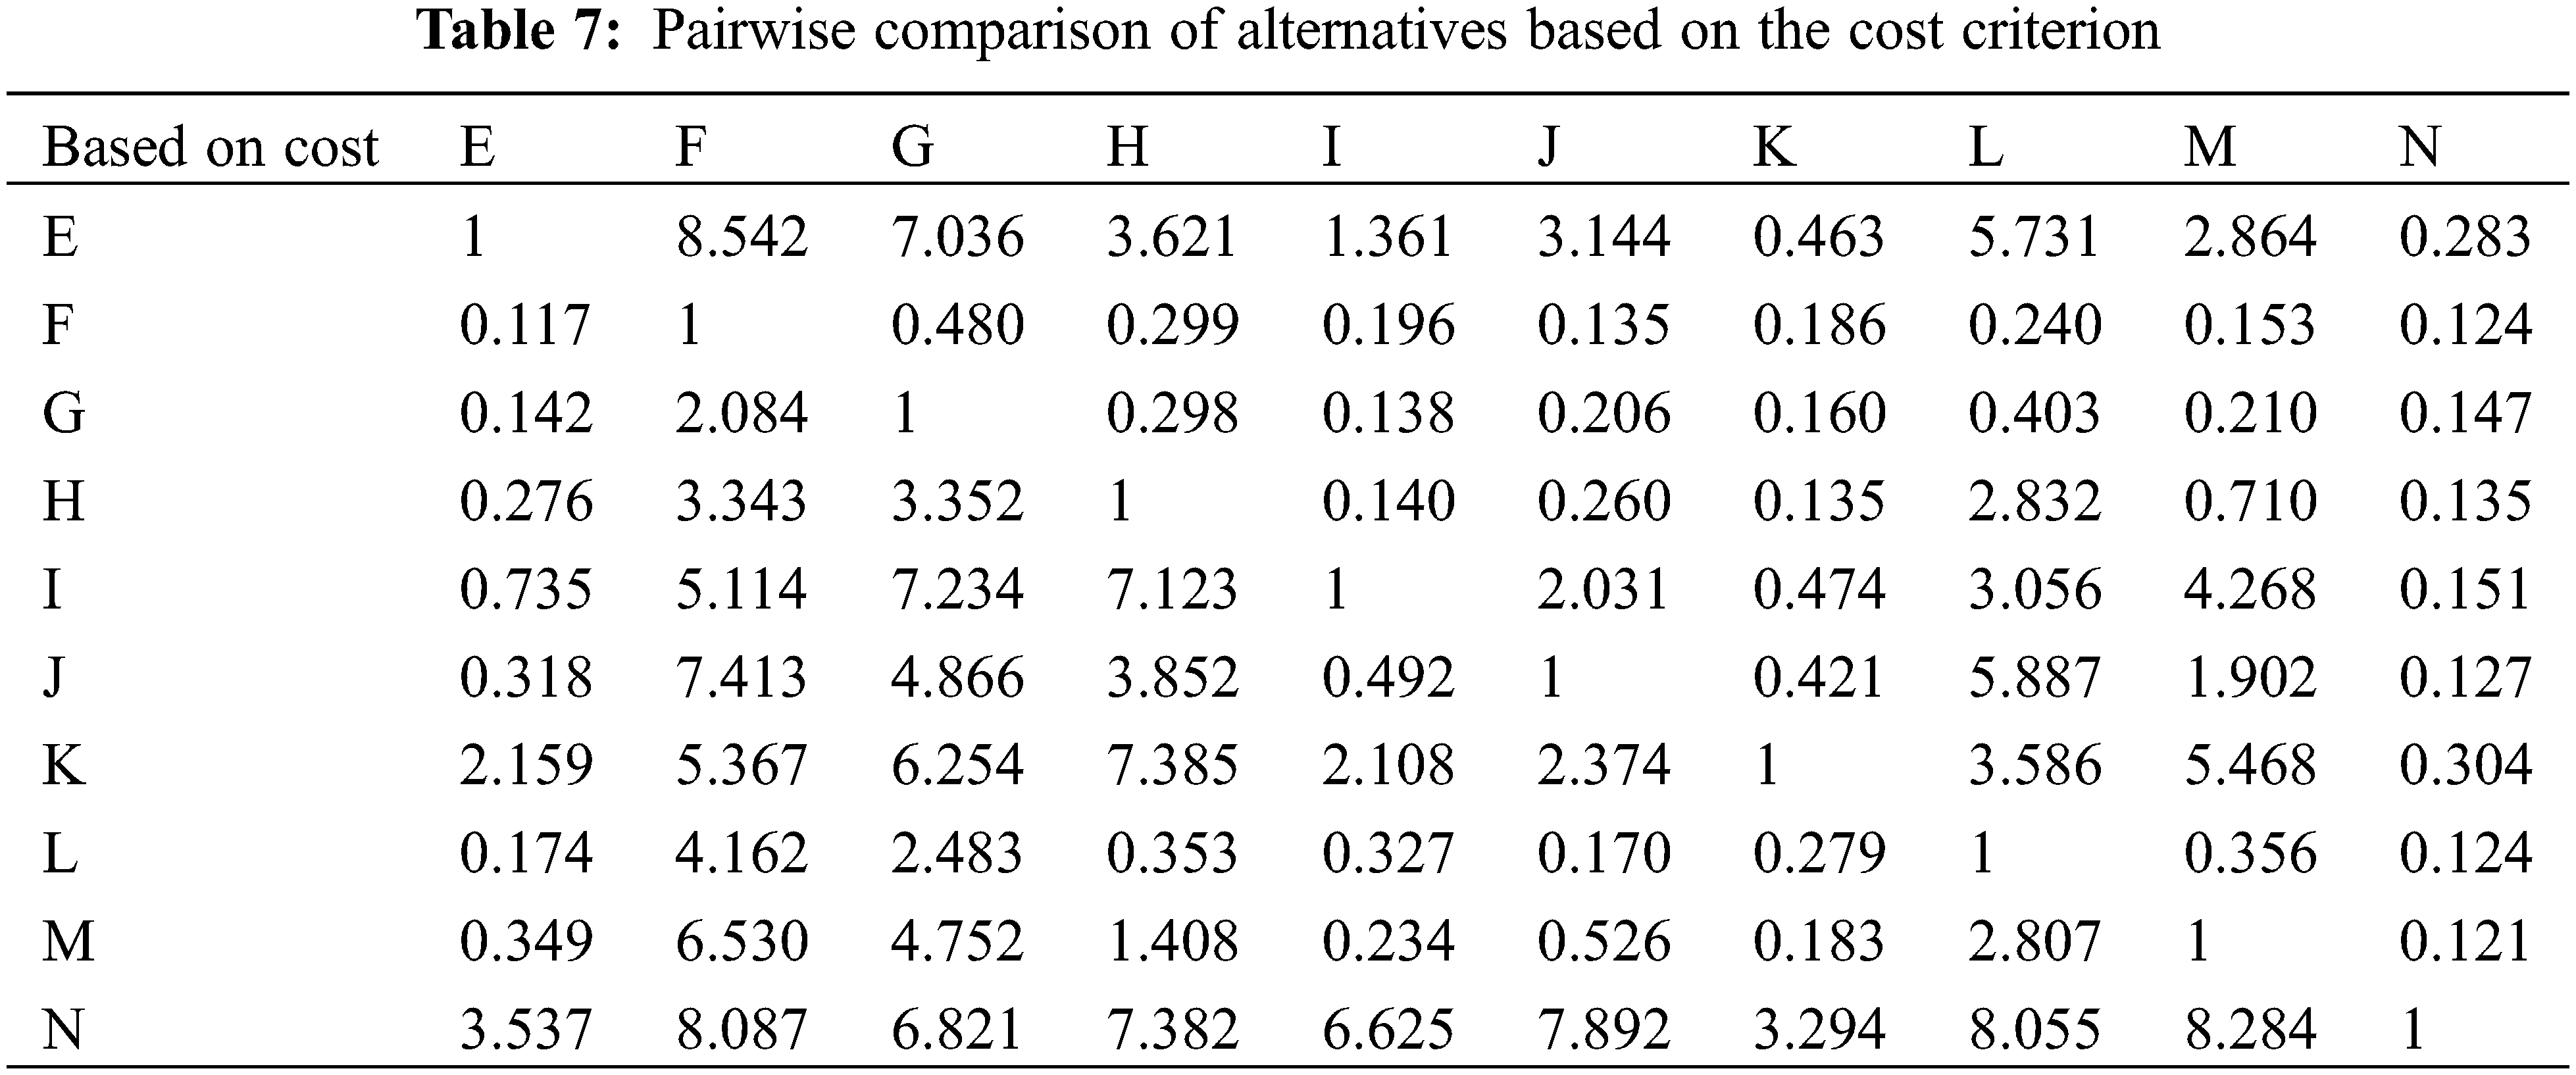
3.3.4 Pairwise Comparison of the Alternatives Based on Criterion C = Cost (Inconsistency Rate of 0.094)
Table 7 displays the pairwise comparison of the alternatives based on cost criterion. Based on this criterion, “use of silenced regulators” and “use of shock absorber and foundations” were the highest and lowest priorities among all alternatives, respectively.
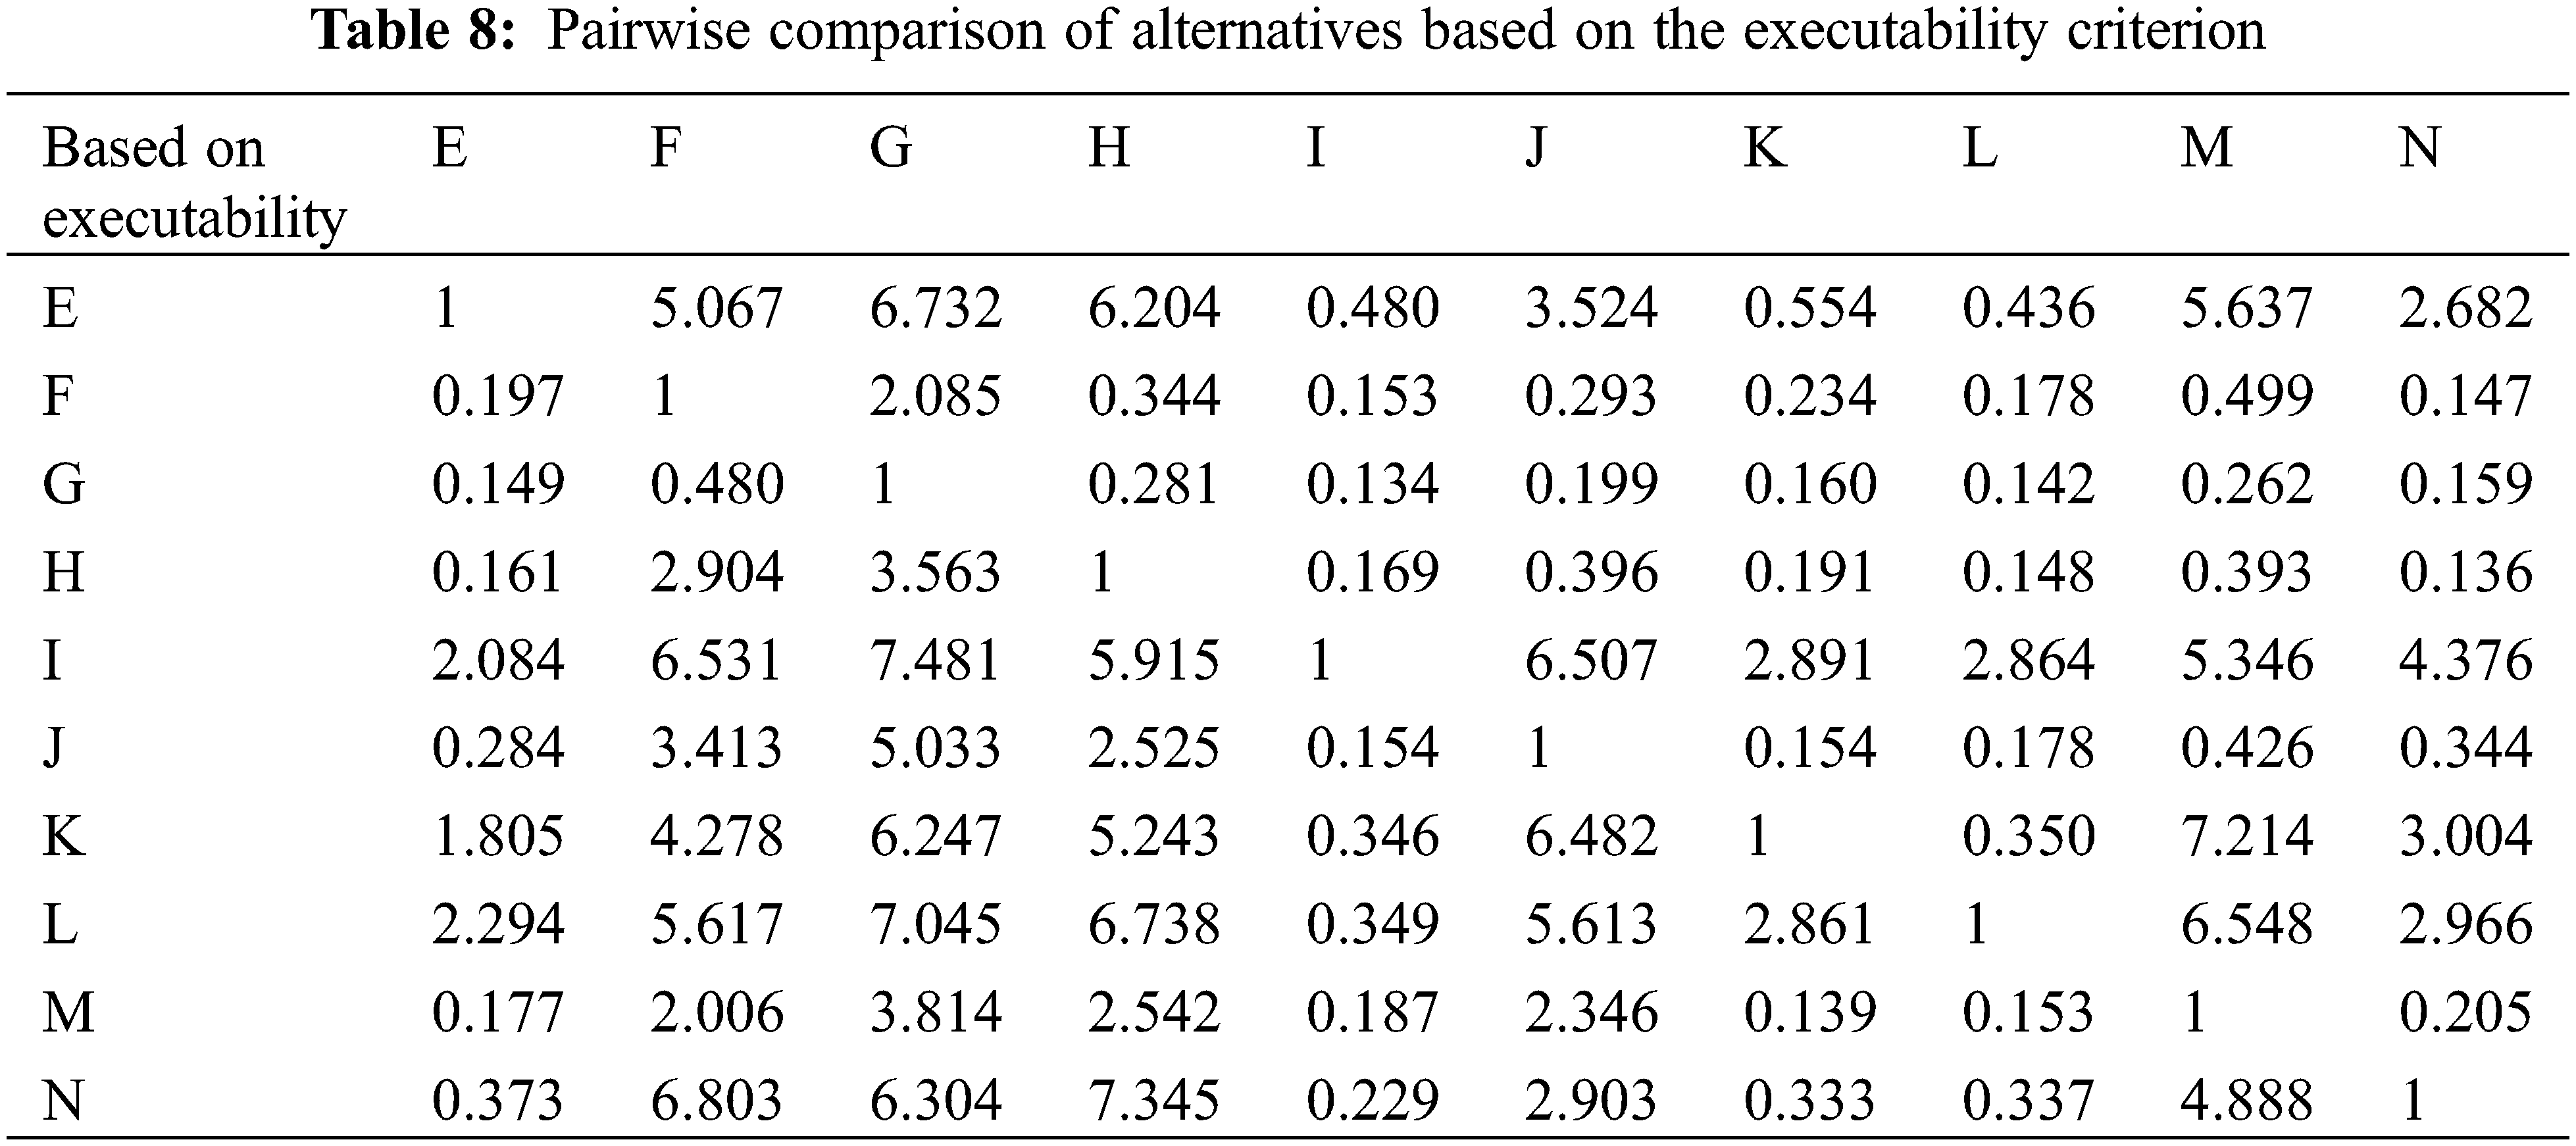
3.3.5 Pairwise Comparison of the Alternatives Based on Criterion D = Executability (Inconsistency Rate of 0.089)
Table 8 displays the pairwise comparison of the alternatives based on executability criterion. This criterion showed the “use of silenced regulators” and “increases in the thickness of the pipe” were the highest and lowest priorities among all alternatives, respectively.
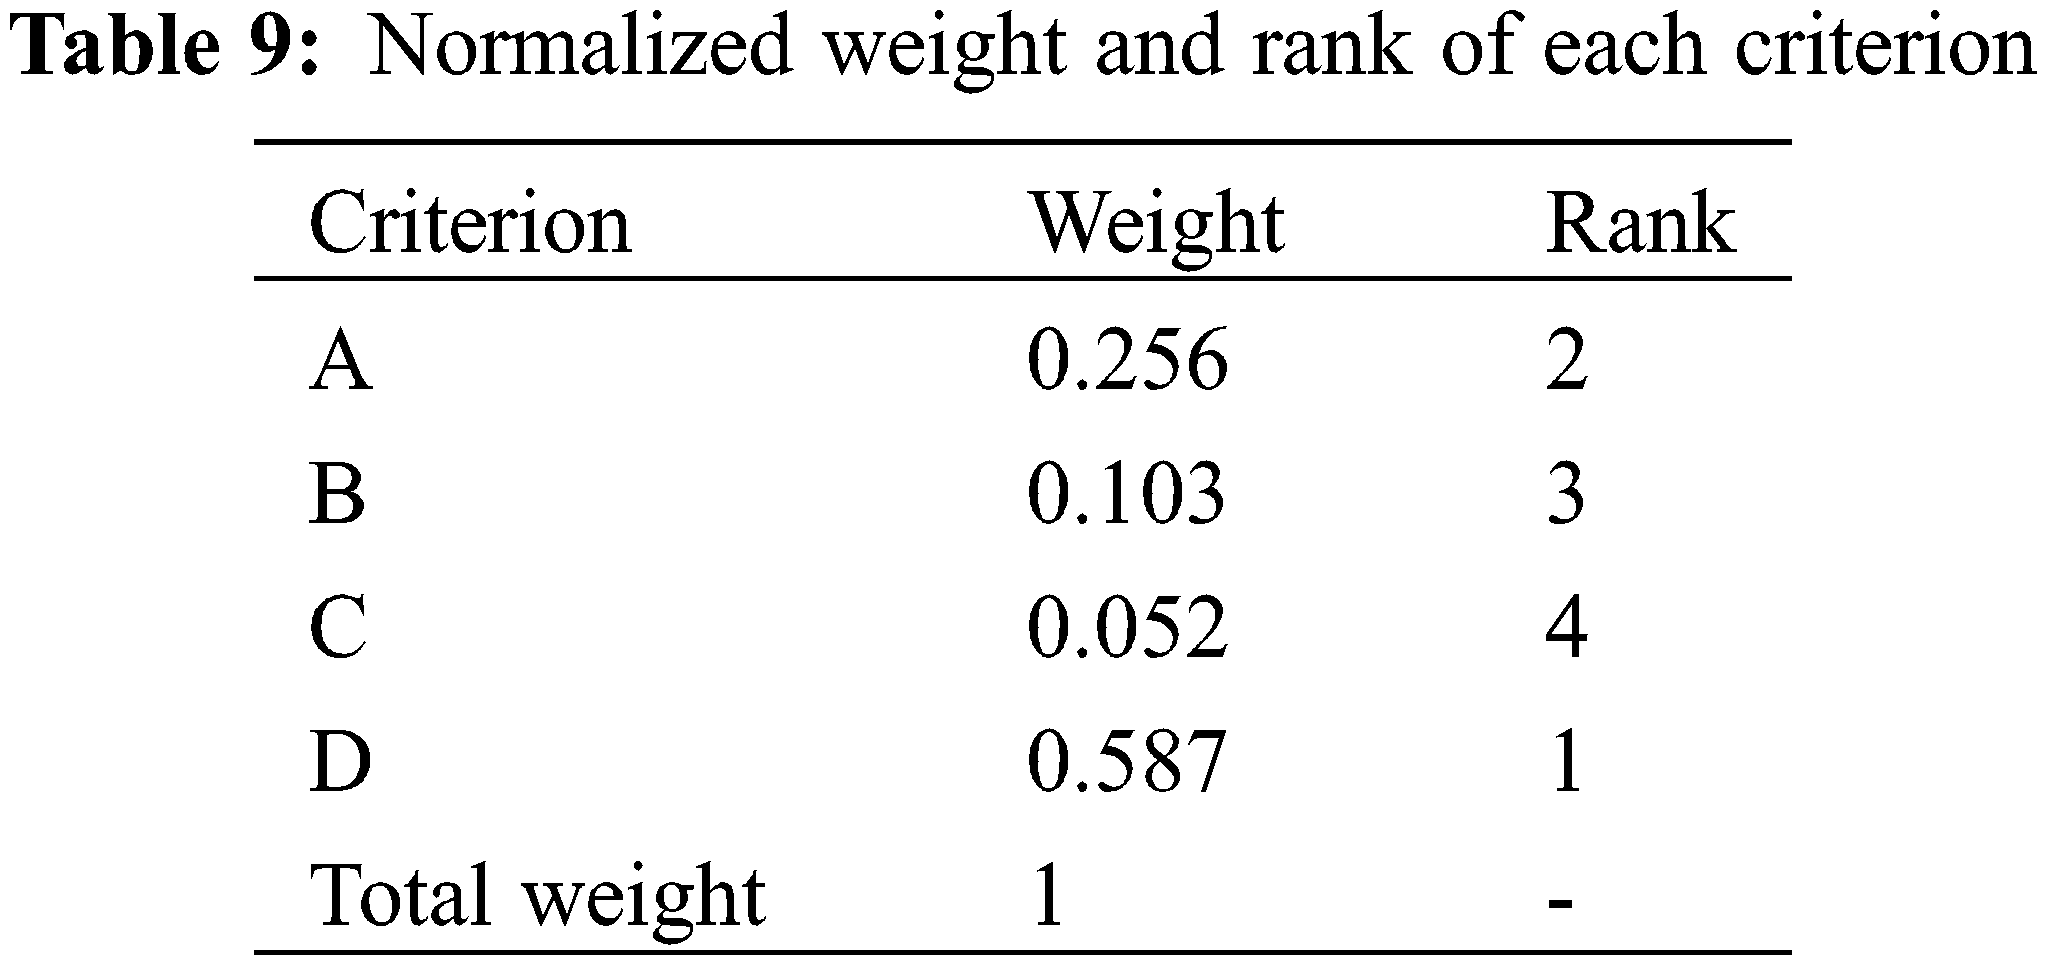
3.3.6 Normalized Rank and Weight of Each Criterion
Table 9 shows the normalized rank and weight of each of the studied criteria. As shown in Table 9, the executability criterion and cost criterion had the greatest and the least effect on choosing the control measure.
3.3.7 Normalized Weight of Each Alternative Based on Each Criterion and Final Weight and Rank of Each Alternative
Table 10 illustrates the normalized weight of each alternative based on the chosen criteria. According to the results of prioritization of the alternatives, the alternative of the “use of silenced regulators” was the first priority and had the highest weight (with a weight of 0.223) among all studied alternatives. Moreover, “reduction of the gas pressure in two stages” and “use of blind T and 90-degree traps in headers” were the second and third priorities with weights of 0.215 and 0.139, respectively. “Putting distance between the output header and the walls”, “use of shock absorbers and foundation” accounted for the fourth and fifth priorities with weights of 0.039 and 0.024, respectively. Finally, an “increase in the thickness of the pipe” was the last priority among the alternatives, with a weight of 0.023.
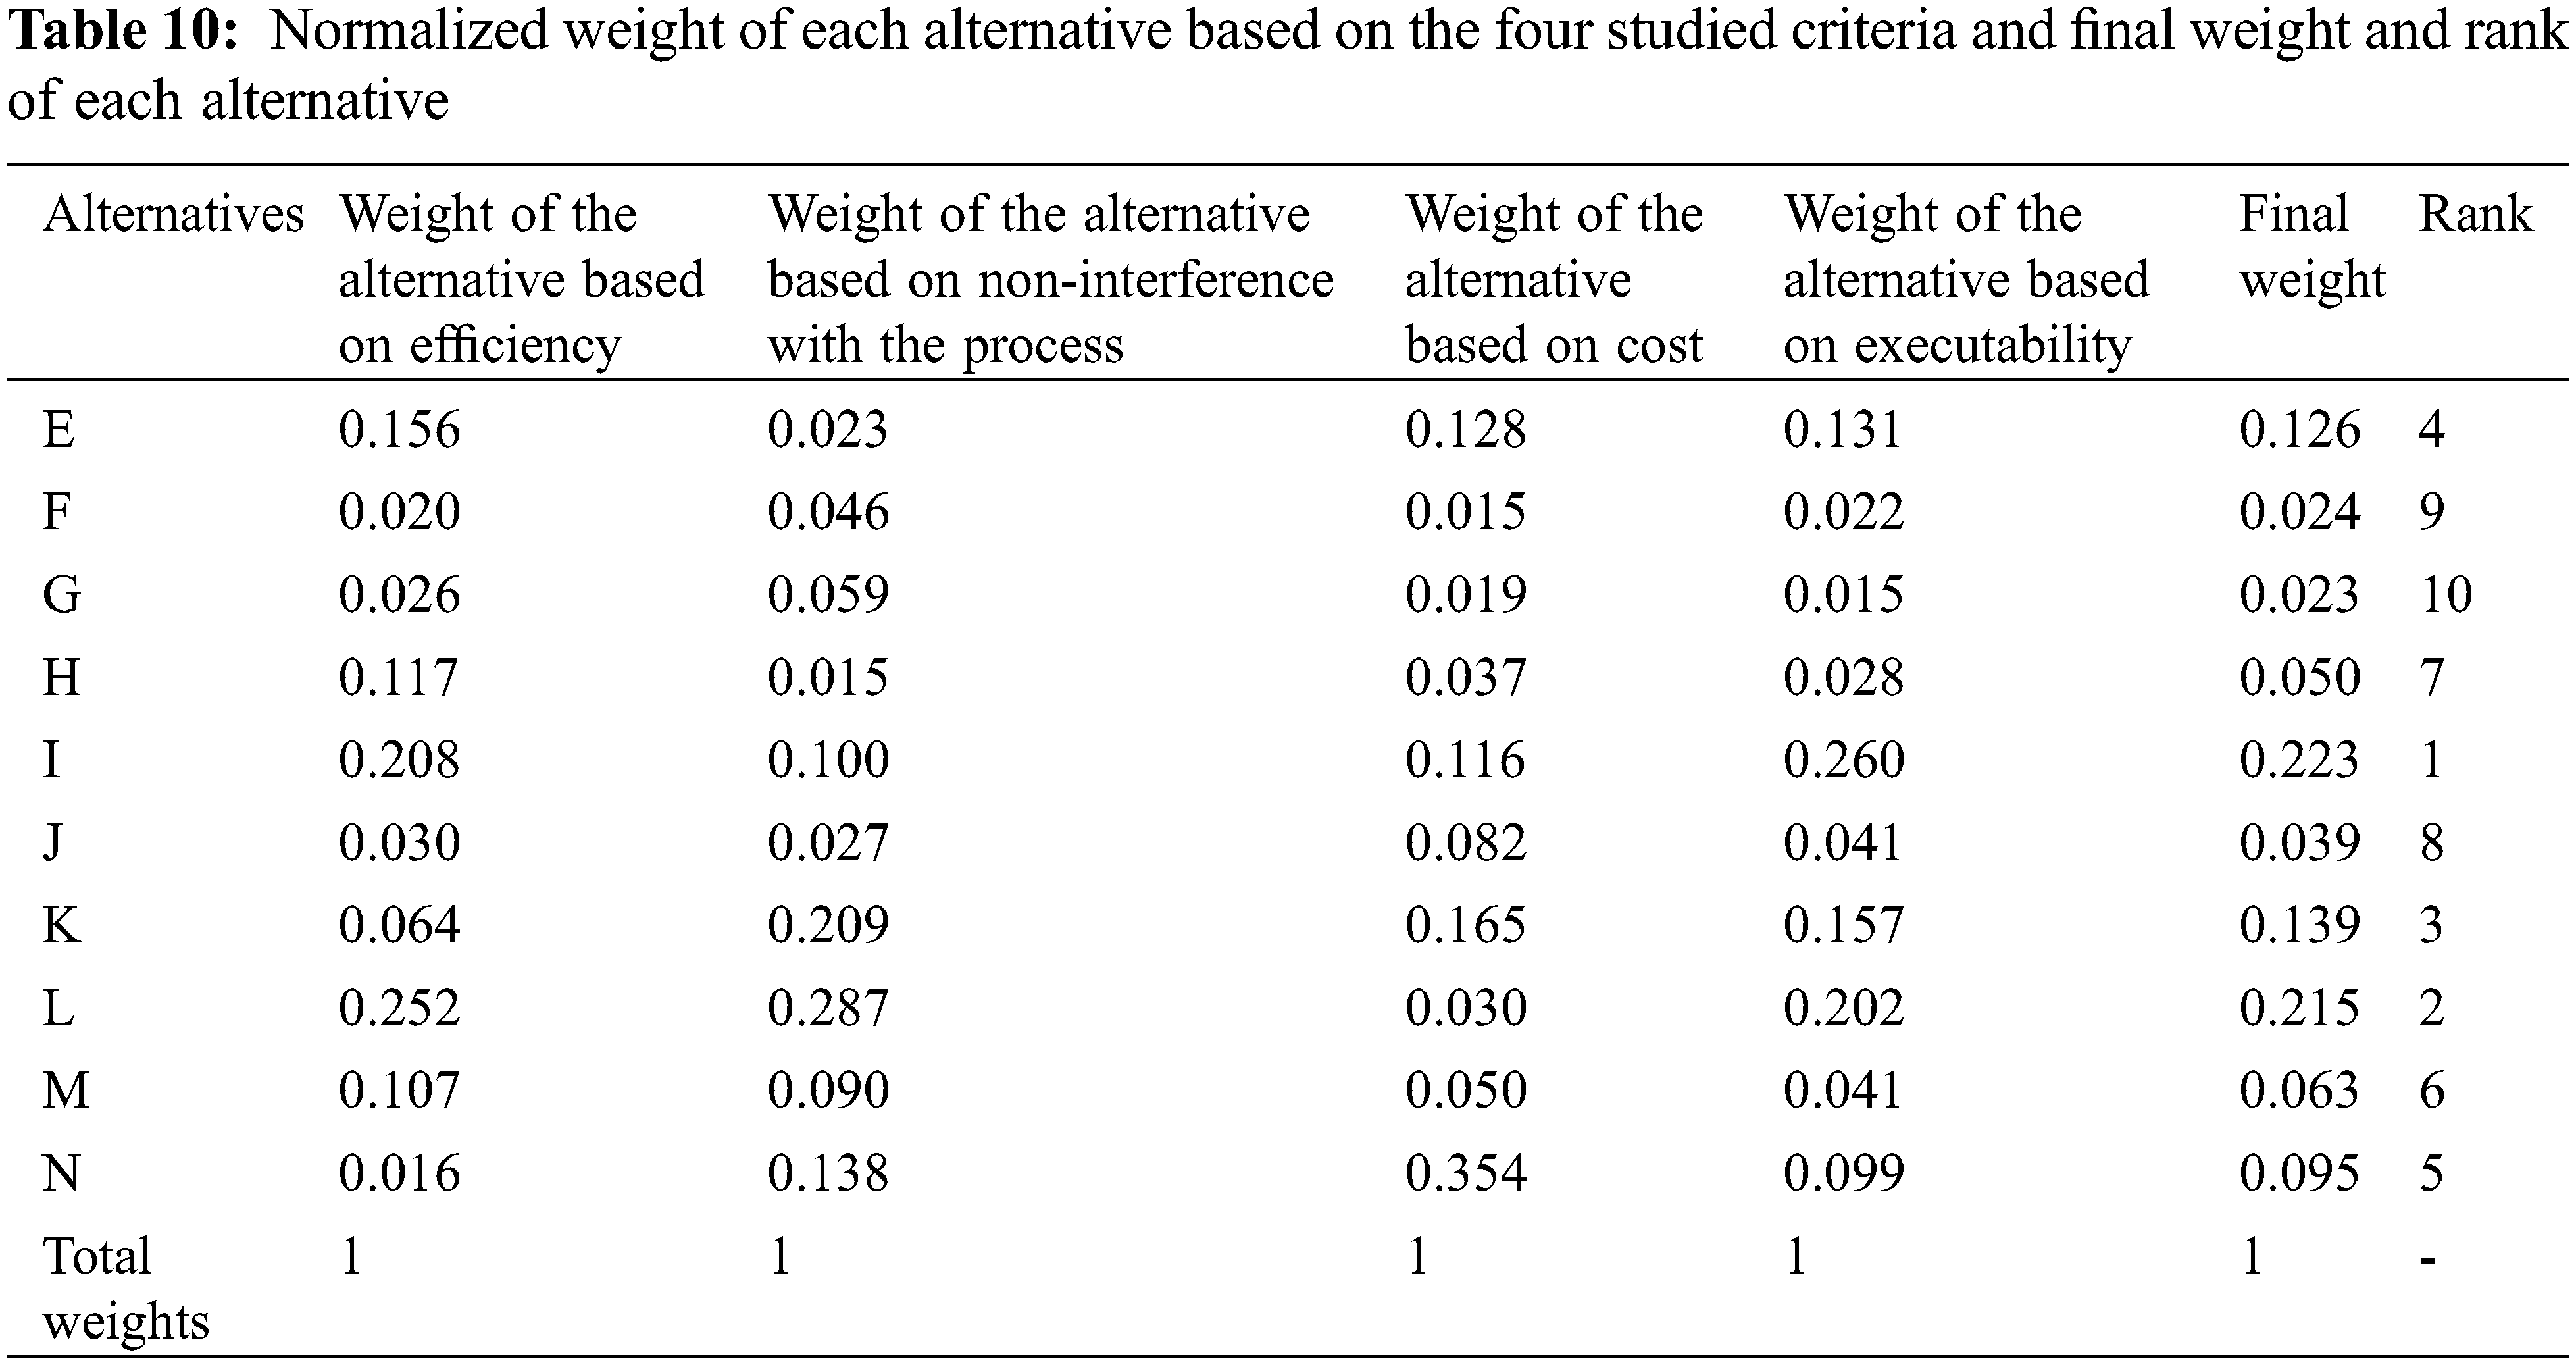
Fig. 3 compars the effect and priority of each of the studied alternatives on controlling the noise in CGSs.
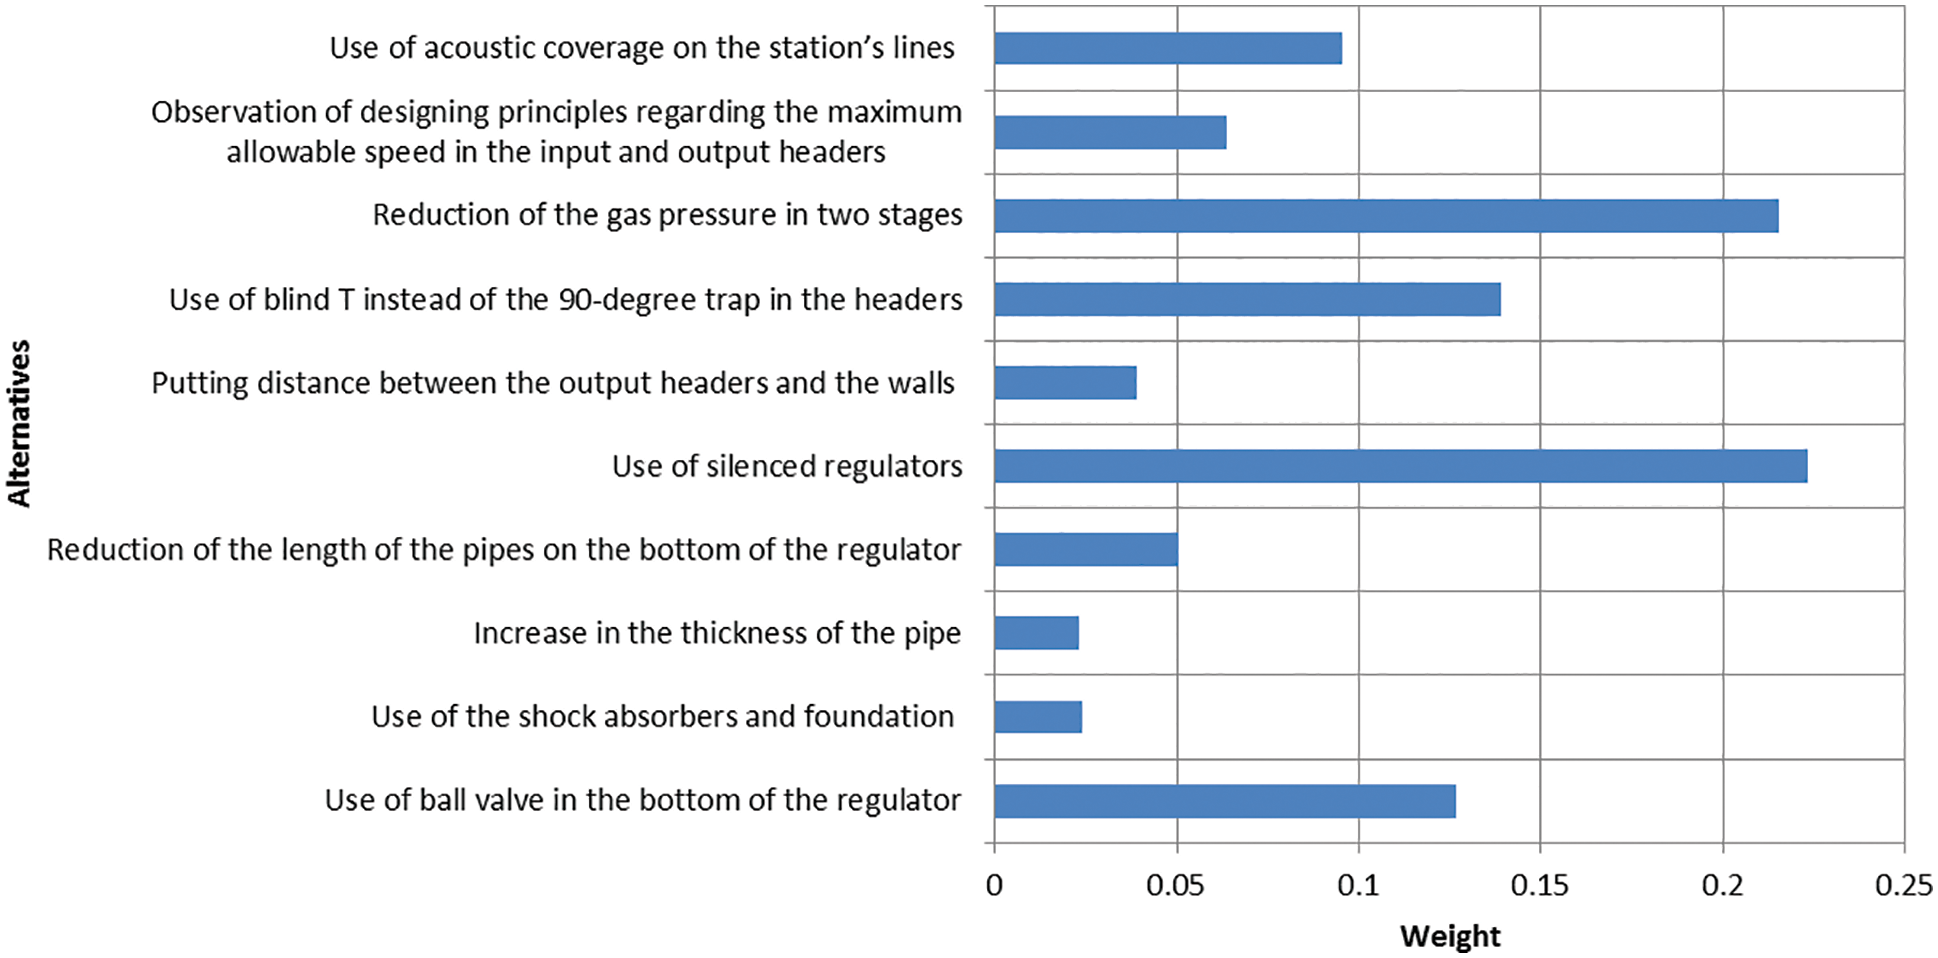
Figure 3: Comparison of the priority of each studied alternatives on noise control in CGSs
The present study aimed to review environmental sound measurements, drawing of noise maps, and prioritizing the engineering noise control measures using AHP in CGSs in in 2021 Kerman, Iran. Six CGSs were evaluated in this study, and the results showed that generally, SPL of the studied stations varied from 76 to 98 dBA, with most stations having a sound exceeding to 85 dBA (danger zone) (Table 3). Fig. 2 shows the sound map of the CGS number 5, which had the worst condition among all evaluated stations. Furthermore, multicriteria decision-making was used to prioritize the engineering noise control measures and four criteria and ten alternatives were identified based on the obtained results. Of the said four criteria, the executability criterion and the cost criterion had the highest and the least effect on the selection of alternatives, respectively. According to the results of prioritizing alternatives, the use of silenced regulators accounted for the first priority among all studied alternatives and the highest weight with a weight of 0.223. In addition, an increase in the thickness of the pipes was the lowest priority, with a weight of 0.023 (Table 10).
Golmohammadi et al. [19] conducted a study entitled “Assessing occupational noise and presenting a control plan in TBS.” Based on the noise map developed in their study, 67% of the evaluated stations were in the danger zone (SPL of higher than 85 dBA), and 33% of them were in the caution zone (SPL of between 65 and 85 dBA). From the total of three units of water, air, and power plant, the air unit, with SPL of 88 to 89 dBA and the compression sector, with the mean SPL of 93.28 dBA, had higher levels of sound pressure in comparison to the other sectors of the said complex. Besides, Golmohammadi et al. stated that the main causes of noise in the TBS were the regulator and the outlet valve of the gas transmission lines. These findings were in compliance with the findings of the present study as the majority of the evaluated stations in this research were in the danger zone, and the mean SPL was between 84 and 90 dBA (except for two stations), and regulators were the main cause of the noise. Furthermore, Zare et al. [41] did a study that aimed to evaluate the individual and environmental SPL and to draw noise maps using the Surfer and noise at work software in a glue production factory. They concluded that the canning unit accounted for the maximum SPL (92 dBA). Moreover, the noise maps drawn for the production unit were more in the danger zone than any other area. Similarly, in the present study, regulators were the main causes of noise production with the maximum SPL of 98 dBA. Also, Golmohammdi et al. [42] did a study with the purpose of evaluating and implementing engineering interventions to reduce occupational exposure to noise in various units of an oil-making factory. In their study, they showed that the SPL was above the national limit in all evaluated stations, meaning that all of them were in the danger zone (between 85.20 and 92.63 dBA). They also showed that a 63-ton compressor accounted for the highest SPL (92.63 dBA). In contrast, in the present study, most stations (not all of them) had high SPLs, which put them in the danger zone, with the regulator accounting for the highest SPL with 98 dBA. The reason for this difference seemed to lie in the difference between the two studied industries. Finally, Zare et al. [43] conducted a study entitled “Assessing Individual and Environmental SPL and noise mapping in Iranian Safety Shoes Factory.” They concluded that 32.3% of the three main units of the said factory were in the danger zone (SPLs of higher than 85 dBA). The skiving and creaser unit, injection unit, and cutting, sewing, and the lasting unit had the highest SPLs with 88, 89, and 93 dBA, respectively. While, in the present study, more than 50% of the stations were in the danger zone and the SPL varied from 56 to 98 dBA in the studied CGSs.
Mousavi et al. [16] did a study aimed at prioritizing noise control measures in the distillation unit of a petrochemical factory using the Fuzzy AHP-TOPSIS method and five criteria, i.e., efficiency, cost, safety, executability, and non-interference with the process. According to their evaluations, the efficiency criterion with a weight of 0.256 and the non-interference with the process with a weight of 0.070 had the highest and lowest effects on the selection of engineering noise control measures. In addition, they prioritized the alternatives as follows: personal enclosure (with a weight of 0.147), use of acoustic enclosure on the source (with a weight of 0.137), use of partial enclosure (with a weight of 0.127), and use of personal protective equipment (with a weight of 0.113) as the first, second, third, and fourth priority, respectively. Furthermore, modification or change of the process, with a weight of 0.059, was the lowest priority among control measures. However, in the present study, the executability criterion and the cost criterion had the highest and lowest weights, respectively. The reason for this inconsistency in the findings of the two studies seemed to be the distance between the CGSs and urban areas and the fact that noise control and cost were the most and the least important, respectively. However, the results of prioritizing the noise control measures in the two studies showed that alternatives that aimed to control the noise in the source were higher priorities than other alternatives. Mousavi et al. [23] conducted another study aimed at prioritizing noise control measures. In their study, they stated that the cost criterion had the greatest impact on the selection of control measures. Also, according to their results, the second most effective criterion in selecting an alternative was executability with a weight of 0.244, while the weight of the executability criterion was 0.587 in the present study. In addition, both studies mentioned controlling the noise in the source as the highest priority. Moreover, Thani et al. [24] did a study entitled “Prioritization of the noise control measures using Analytical Hierarchy Process (AHP) in the battery industry.” They evaluated eight criteria and seven alternatives. They concluded that the acoustic efficiency of the measure and the executability of the measure had the highest weights, and the number of people exposed to the noise and SPL of the environment had the lowest weights. Also, they mentioned that among the alternatives, controlling the length of exposure to the noise and workers’ training and the use of sound absorbers in the workplace (controlling noise at the source) had the highest weights and process change measures and the use of active noise control measures had the lowest weights, respectively. Similarly, in the present study, the executability criterion had the highest weight among the evaluated criteria. In addition, Thani et al. mentioned the use of silenced regulators as a method for controlling noise at the source, which was the first priority among the evaluated alternatives. These findings were consistent with the findings of the present study. Eventually, Eshaghi et al. [44] reviewed four criteria and eleven alternatives to prioritize noise control measures in a glass factory. They concluded that the efficiency criterion had the highest weight among all criteria. Also, they mentioned that the cost criterion had the lowest weight and was the lowest priority. These results were in compliance with the findings of the present study. They also mentioned controlling the vibration of the main sources to control noise as a low priority with a weight of 0.091. Similarly, the present study stated use of shock absorbers and foundation specifications used for controlling the vibration of the noise producer as the ninth priority with a weight of 0.024.
The advantage of the present study in comparison to other studies was that it was a comprehensive study that evaluated the sound by preparing a noise map, presenting solutions for noise control, and asking skilled experts to prioritize the CGSs. The findings of the present study could help managers in making decisions regarding the implementation of noise control measures in this field. One of the limitations of this study was the need for a permit to enter the units and the fact that not all experts were willing to cooperate in the evaluations. Another limitation of the present study was that it failed to take into account the mutual effects of alternatives on one another. For this purpose, it is suggested to future researchers to utilize the views of a larger number of people to prioritize and evaluate the measures and to pay attention to the mutual effects of the assessed factors.
This research results indicated that the best criterion for selecting the noise control method was the executability criterion. Also, the use of silenced regulators, “reduction of gas pressure in two stages”, and the “use of blind T instead of 90-degree traps in the headers” were the most effective engineering noise control measures in CGSs. Therefore, it can be stated that AHP is a practical method for prioritizing different measures to make the best and most effective decisions. The results of AHP can be of great help for health and safety specialists and managers in best selecting engineering noise control methods.
Acknowledgement: Thanks are given to the Kerman University of Medical Sciences for supporting this study as a research project (Code No. 98001198). We are also grateful of CGSs personnel for cooperation in this research.
Funding Statement: The authors received no specific funding for this study.
Conflicts of Interest: The authors declare that they have no conflicts of interest to report regarding the present study.
References
1. ElahiShirvan, H., Ghotbi-Ravandi, M., Zare, S., Ahsaee, M. (2020). Using audiometric data to weigh and prioritize factors that affect workers’ hearing loss through support vector machine (SVM) algorithm. Sound & Vibration, 54, 99–112. DOI 10.32604/sv.2020.08839. [Google Scholar] [CrossRef]
2. Le, T. N., Straatman, L. V., Lea, J., Westerberg, B. (2017). Current insights in noise-induced hearing loss: A literature review of the underlying mechanism, pathophysiology, asymmetry, and management options. Journal of Otolaryngology-Head & Neck Surgery, 46(1), 1–15. DOI 10.1186/s40463-017-0219-x. [Google Scholar] [CrossRef]
3. World Health Organization (2004). Occupational noise: Assessing the burden of disease from work-related hearing impairment at national and local levels. Environmental Burden of Disease Series, (9), 1–33. [Google Scholar]
4. Golmohammadi, R., Giahi, O., Aliabadi, M., Darvishi, E. (2014). An intervention for noise control of blast furnace in steel industry. Journal of Research in Health Sciences, 14(4), 287–290. [Google Scholar]
5. van Kempen, E. E., Kruize, H., Boshuizen, H. C., Ameling, C. B., Staatsen, B. A. et al. (2002). The association between noise exposure and blood pressure and ischemic heart disease: A meta-analysis. Environmental Health Perspectives, 110(3), 307–317. DOI 10.1289/ehp.02110307. [Google Scholar] [CrossRef]
6. Teixeira, L. R., Pega, F., Dzhambov, A. M., Bortkiewicz, A., da Silva, D. T. C. et al. (2021). The effect of occupational exposure to noise on ischaemic heart disease, stroke and hypertension: A systematic review and meta-analysis from the WHO/ILO joint estimates of the work-related burden of disease and injury. Environment International, 154, 106387. DOI 10.1016/j.envint.2021.106387. [Google Scholar] [CrossRef]
7. Bolm-Audorff, U., Hegewald, J., Pretzsch, A., Freiberg, A., Nienhaus, A. et al. (2020). Occupational noise and hypertension risk: A systematic review and meta-analysis. International Journal of Environmental Research and Public Health, 17(17), 6281. DOI 10.3390/ijerph17176281. [Google Scholar] [CrossRef]
8. Golmohammadi, R., Darvishi, E. (2019). The combined effects of occupational exposure to noise and other risk factors−A systematic review. Noise & Health, 21(101), 125–141. [Google Scholar]
9. Yang, Y., Zhang, E., Zhang, J., Chen, S., Yu, G. et al. (2018). Relationship between occupational noise exposure and the risk factors of cardiovascular disease in China: A meta-analysis. Medicine, 97(30), 11720. DOI 10.1097/MD.0000000000011720. [Google Scholar] [CrossRef]
10. Mucci, N., Traversini, V., Lulli, L. G., Vimercati, L., Rapisarda, V. et al. (2021). Neurobehavioral alterations in occupational noise exposure: A systematic review. Sustainability, 13(21), 12224. DOI 10.3390/su132112224. [Google Scholar] [CrossRef]
11. Alimohammadi, I., Kanrash, F. A., Vosoughi, S., Shekaftik, S. O., Rahmani, K. et al. (2020). Relationship between noise annoyance and high blood pressure in workers exposed to chronic noise among the workers of an automotive industry. Indian Journal of Occupational and Environmental Medicine, 24(3), 153–156. DOI 10.4103/ijoem.IJOEM_259_19. [Google Scholar] [CrossRef]
12. Pretzsch, A., Seidler, A., Hegewald, J. (2021). Health effects of occupational noise. Current Pollution Reports, 7(3), 344–358. DOI 10.1007/s40726-021-00194-4. [Google Scholar] [CrossRef]
13. Sheppard, A., Ralli, M., Gilardi, A., Salvi, R. (2020). Occupational noise: Auditory and non-auditory consequences. International Journal of Environmental Research and Public Health, 17(23), 8963. DOI 10.3390/ijerph17238963. [Google Scholar] [CrossRef]
14. Zare, S., Nassiri, P., Monazzam, M. R., Pourbakht, A., Azam, K. et al. (2016). Evaluation of the effects of occupational noise exposure on serum aldosterone and potassium among industrial workers. Noise & Health, 18(80), 1–6. DOI 10.4103/1463-1741.174358. [Google Scholar] [CrossRef]
15. Cherminisoff, P. N., Cherminisoff, P. P. (2003). Industrial noise control. Michigan. Annal of Environmental Health, 58, 55–58. [Google Scholar]
16. Mousavi, S. M., Abbasi, M., Yazdanirad, S., Yazdanirad, M., Khatooni, E. (2019). Fuzzy AHP-TOPSIS method as a technique for prioritizing noise control solutions. Noise Control Engineering Journal, 67(6), 415–421. DOI 10.3397/1/376738. [Google Scholar] [CrossRef]
17. Ruiz-Padillo, A., Ruiz, D. P., Torija, A. J., Ramos-Ridao, Á. (2016). Selection of suitable alternatives to reduce the environmental impact of road traffic noise using a fuzzy multi-criteria decision model. Environmental Impact Assessment Review, 61, 8–18. DOI 10.1016/j.eiar.2016.06.003. [Google Scholar] [CrossRef]
18. Su, Z., Liu, E., Xu, Y., Xie, P., Shang, C. et al. (2019). Flow field and noise characteristics of manifold in natural gas transportation station. Oil & Gas Science and Technology–Revue d’IFP Energies Nouvelles, 74, 70. DOI 10.2516/ogst/2019038. [Google Scholar] [CrossRef]
19. Golmohammadi, R., Khaefi, N., Aliabadi, M. (2019). Assessment occupational noise and control plan presentation in town board stations. Journal of Sabzevar University of Medical Sciences, 26(3), 319–327. [Google Scholar]
20. Nikbakht, M., Sayyah, A., Zulkifli, N. (2010). Hazard identification and accident analysis on city gate station in natural gas industry. International Conference on Environmental Engineering and Applications, Singapore. [Google Scholar]
21. Gul, M. (2018). A review of occupational health and safety risk assessment approaches based on multi-criteria decision-making methods and their fuzzy versions. Human and Ecological Risk Assessment: An International Journal, 24(7), 1723–1760. DOI 10.1080/10807039.2018.1424531. [Google Scholar] [CrossRef]
22. Darko, A., Chan, A. P. C., Ameyaw, E. E., Owusu, E. K., Pärn, E. et al. (2019). Review of application of analytic hierarchy process (AHP) in construction. International Journal of Construction Management, 19(5), 436–452. DOI 10.1080/15623599.2018.1452098. [Google Scholar] [CrossRef]
23. Mousavi, S. M., Jahadi Naeini, M., YazdaniRad, S., Haghighat, M. (2021). Identification and ranking of noise control solutions by using fuzzy delphi approach, fuzzy analytic hierarchy analysis (FAHP) and fuzzy vikor in an oil refinery. Archives of Occupational Health, 5(1), 913–920. DOI 10.18502/aoh.v5i1.5263. [Google Scholar] [CrossRef]
24. Thani, A. A., Yarahmadi, R., Abolghasemi, J., Firoozbakhsh, M., Besharati, J. et al. (2021). Prioritization of noise control methods by the analytical hierarchy process (AHP) in a battery factory. Journal of Occupational Hygiene Engineering Volume, 8(1), 65–73. DOI 10.52547/johe.8.1.65. [Google Scholar] [CrossRef]
25. Saaty, T. L. (1988). What is the analytic hierarchy process? In: Mathematical models for decision support. Berlin: Springer. [Google Scholar]
26. Liu, Y., Eckert, C. M., Earl, C. (2020). A review of fuzzy AHP methods for decision-making with subjective judgements. Expert Systems with Applications, 161, 113738. DOI 10.1016/j.eswa.2020.113738. [Google Scholar] [CrossRef]
27. Chan, H. K., Sun, X., Chung, S. H. (2019). When should fuzzy analytic hierarchy process be used instead of analytic hierarchy process? Decision Support Systems, 125, 113114. DOI 10.1016/j.dss.2019.113114. [Google Scholar] [CrossRef]
28. Pawlaczyk-Łuszczyńska, M., Zamojska-Daniszewska, M., Zaborowski, K., Dudarewicz, A. (2019). Evaluation of noise exposure and hearing threshold levels among call centre operators. Archives of Acoustics, 44, 747–759. [Google Scholar]
29. ISO 9612 (2009). Acoustics-determination of occupational noise exposure-engineering method. Geneva, Switzerland: International Organization for Standardization. [Google Scholar]
30. Baldinelli, G., Bianchi, F., Costarelli, D., D’Alessandro, F., Scrucca, F. et al. (2021). Innovative techniques for the improvement of industrial noise sources identification by beamforming. Noise Mapping, 8(1), 129–137. DOI 10.1515/noise-2021-0010. [Google Scholar] [CrossRef]
31. Zagubień, A., Wolniewicz, K. (2021). Impact of measuring microphone location on the result of environmental noise assessment. Applied Acoustics, 172, 107662. DOI 10.1016/j.apacoust.2020.107662. [Google Scholar] [CrossRef]
32. Thiery, L., Ognedal, T. (2008). Note about the statistical background of the methods used in ISO/DIS 9612 to estimate the uncertainty of occupational noise exposure measurements. Acta Acustica United with Acustica, 94(2), 331–334. DOI 10.3813/AAA.918037. [Google Scholar] [CrossRef]
33. Monazzam, M. R., Golmohammadi, R., Nourollahi, M., Fard, S. M. B. (2011). Assessment and control design for steam vent noise in an oil refinery. Journal of Research in Health Sciences, 11(1), 14–19. [Google Scholar]
34. Golmohammadi, R., Monazzam, M. R., Nourollahi, M., Nezafat, A., Fard, M. B. S. (2010). Evaluation of noise propagation characteristics of compressors in Tehran oil refinery center and presenting control methods. Journal of Research in Health Sciences, 10(1), 22–30. [Google Scholar]
35. Alademomi, A., Okolie, C., Ojegbile, B., Daramola, O., Onyegbula, J. et al. (2020). Spatial and statistical analysis of environmental noise levels in the main campus of the university of lagos. The Journal of Engineering Research, 17(2), 75–88. [Google Scholar]
36. Golmohammadi, R., Aliabadi, M. (2010). Noise and vibration engineering. Hamadan: Student Publication. [Google Scholar]
37. Hassanvand, D., Zare, S., Ghotbi-Ravandi, M. R. (2019). Noise assessment and sound map projection using surfer and noise at work tools in a tire manufacturing complex in Iran, 2018. Journal of Occupational Health and Epidemiology, 8(2), 109–117. DOI 10.29252/johe.8.2.109. [Google Scholar] [CrossRef]
38. Crocker, M. J., Price, A. J. (2018). Noise and noise control. Boca Raton, Florida, USA: CRC Press. [Google Scholar]
39. Kutlu Gündoğdu, F., Kahraman, C. (2020). A novel spherical fuzzy analytic hierarchy process and its renewable energy application. Soft Computing, 24(6), 4607–4621. DOI 10.1007/s00500-019-04222-w. [Google Scholar] [CrossRef]
40. Ansah, R. H., Sorooshian, S., Bin Mustafa, S. (2015). Analytic hierarchy process decision making algorithm. Global Journal of Pure and Applied Mathematics, 11(4), 2393–2400. [Google Scholar]
41. Zare, S., Hemmatjo, R., ElahiShirvan, H., Malekabad, A. J., Ziaei, M. et al. (2021). Evaluation of individual and environmental sound pressure level and drawing noise-isosonic maps using surfer V.14 and noise at work V.5.0. Sound & Vibration, 55(2), 163–171. DOI 10.32604/sv.2021.09114. [Google Scholar] [CrossRef]
42. Golmohamadi, R., Biabani, A., Azadi, N., Abshang, I. (2020). Noise control and determination of economic indicators in an edible oil industry. Iran Occupational Health, 17(1), 964–977. [Google Scholar]
43. Zare, S., Hasheminejad, N., Shirvan, H. E., Hasanvand, D., Hemmatjo, R. et al. (2018). Assessing individual and environmental sound pressure level and sound mapping in Iranian safety shoes factory. Romanian Journal of Acoustics and Vibration, 15(1), 20–25. [Google Scholar]
44. Eshaghi, M., Golmohamadi, R., Riahi-Korram, M. (2012). Prioritizing of noise control methods in the hamadan glass company by the analytical hierarchy process (AHP). Journal of Occupational Health and Safety, 2(1), 75–84. [Google Scholar]
Cite This Article
 Copyright © 2022 The Author(s). Published by Tech Science Press.
This work is licensed under a Creative Commons Attribution 4.0 International License , which permits unrestricted use, distribution, and reproduction in any medium, provided the original work is properly cited.
 Downloads
 Citation Tools