
 Submit a Paper
 Open Access
ARTICLE

Prediction of Sound Transmission Loss of Vehicle Floor System Based on 1D-Convolutional Neural Networks
1 Guangzhou Automobile Group Co., Ltd., Automotive Research and Design Centre, Guangzhou, 511434, China
2 School of Mechanical Engineering, Southwest Jiaotong University, Chengdu, 610031, China
* Corresponding Author: Haibo Huang. Email:
Sound & Vibration 2024, 58, 25-46. https://doi.org/10.32604/sv.2024.046940
Received 19 October 2023; Accepted 02 January 2024; Issue published 06 February 2024
 View Full Text
 Download PDF
Abstract
The Noise, Vibration, and Harshness (NVH) experience during driving is significantly influenced by the sound insulation performance of the car floor acoustic package. As such, accurate and efficient predictions of its sound insulation performance are crucial for optimizing related noise reduction designs. However, the complex acoustic transmission mechanisms and difficulties in characterizing the sound absorption and insulation properties of the floor acoustic package pose significant challenges to traditional Computer-Aided Engineering (CAE) methods, leading to low modeling efficiency and prediction accuracy. To address these limitations, a hierarchical multi-objective decomposition system for predicting the sound insulation performance of the floor acoustic package has been developed based on an analysis of the noise transmission path. This approach involves introducing a 1D-Convolutional Neural Network (1D-CNN) model for predicting the sound insulation performance of the floor acoustic package, thereby avoiding the limitations of conventional CAE approaches that rely solely on “data-driven” methods. The proposed method was applied and tested using specific vehicle models, and the results demonstrated the effectiveness and superiority of the proposed approach relative to those obtained using 2D-CNN and Support Vector Regression (SVR) models.Keywords
Excessive noise affects passenger comfort and increases driver fatigue, which can lead to more accidents. Thus, reducing noise is crucial for improving traffic safety and passenger well-being [1]. The “vehicle acoustic package” refers to a combination of elements designed to reduce sound pressure, especially from air, affecting the vehicle’s interior acoustics [2]. The floor acoustic package, often a carpet, is key in car interiors for comfort and safety, absorbing internal noise and blocking external sounds [3]. The floor acoustic package is crucial for insulating against noise from the powertrain and tires, significantly affecting the vehicle’s overall NVH performance [4]. A well-conceived acoustic package design not only serves to markedly diminish in-cabin noise levels but also holds the potential to reduce costs and facilitate vehicular weight reduction. Consequently, the study of performance enhancements in automobile floor acoustic packages bears profound practical significance.
In the realm of traditional research pertaining to automotive acoustic packages, the prevalent approach has been the application of Statistical Energy Analysis (SEA) within engineering contexts [5]. The integration of SEA theory into automotive industry research has enabled a nuanced examination of the propagation of sound and vibrational energy within intricate structures [6]. Notably, advancements in simulation software, such as VA-One, have markedly augmented the analysis of high-frequency noise [7]. Conventional acoustic research typically uses SEA or FE-SEA models for precise simulation of medium and high-frequency noise, with significant contributions like Toyota’s Kobayashi et al.’s vehicle SEA model analyzing the relationship between acoustic packages and internal noise [8]. Ge et al. used the statistical energy method to create a SEA model, predicting and optimizing a vehicle’s internal noise for cost-effective acoustic packaging, achieving cost and weight reductions without compromising NVH quality [9]. Lu and colleagues developed a hybrid FE-SEA model to predict the acoustic package’s insertion loss at mid-frequencies and examined how design changes affect this loss [10]. Gao et al. employed SEA to prognosticate road noise transmitted via the vehicle’s air, culminating in the development of a comprehensive SEA model for the vehicle [11]. Teknos and team set high-frequency noise targets in vehicles using the statistical energy method, combining experimental and simulation methods to optimize the acoustic package to meet noise standards [12]. Using SEA, Lee et al. analyzed and optimized acoustic subsystems that affect vehicle noise, reducing the driver’s head area sound pressure by 1.1 dB (A) [13]. Che et al. developed a model based on SEA to predict and control interior noise in electric vehicles, focusing on the acoustics of primary panels [14]. Du et al. executed the establishment of SEA models for both the front and floor within the VA One software platform, thereby effecting the creation of an acoustic package, which facilitated the determination of transmission loss for the front and floor [15]. Peng and team created a noise transmission test method, identifying and fixing insulation weaknesses in a vehicle’s front wall, enhancing overall sound insulation and internal noise control [16]. Additionally, Norimasa et al. established a SEA model for a vehicle, addressing the quandary of high-frequency noise within the vehicle, and subsequently delving into the intricate interplay between acoustic package attributes and internal noise through the lens of the established model [17]. Jiang Dongming thoroughly evaluated a vehicle’s front acoustic package using FE-SEA and SEA methods, leading to a design that improved insulation and reduced weight [18]. Lee presents a new experimental method for evaluating transmission losses in multilayered solid materials by means of an improved transfer matrix method and experimentally verifies its feasibility on a wide range of materials for automotive and architectural soundproofing design [19]. Dell proposed a simplified model based on the transfer matrix method (TMM) for obtaining simple analytical expressions for the effective properties of acoustic systems in the low frequency range [20]. A general, efficient and stable method for predicting the acoustic properties of layered systems based on the transfer matrix method proposed by Song et al. [21].
The current method combines experiments and simulations to characterize materials for SEA models, but it is complex and efficiency is a challenge [22]. Consequently, factors of diverse nature compel simplification and adjustment of parameters in order to facilitate a comparison between the SEA-based simulation model and experimental findings, albeit within specific operational contexts [23]. In the automotive industry’s shift towards big data and AI, data-driven methods are key for engineering challenges, including assessing acoustic packages through data correlations, as demonstrated by Huang et al.’s use of algorithms and neural networks for vehicle noise analysis [24]. Zheng used SVR and Classification and Regression Tree (CART) to model and compare the sound insulation prediction of vehicle bodies [25]. Wang et al. used a neural network to predict the sound insulation of ultra-fine glass wool mat in vehicles, focusing on thickness, density, resin content, and sound loss at certain frequencies, achieving high predictive accuracy [26]. Schaefer et al. used neural networks and particle swarm optimization to relate front acoustic package materials to cost and weight, optimizing without losing sound properties and cutting weight by 15.21% [27]. Song and Oliazadeh studied sound transmission in foam-filled honeycomb panels, creating a detailed SEA-based analytical model, yielding a closed-form STL expression for accurate transmission loss predictions [28–30]. Huang and team conducted detailed analysis and prediction of vehicle front panel sound quality using a multi-objective, multi-level approach, and developed an optimization methodology for NVH design and fault diagnosis [31,32]. Song et al. [21] proposed a method based on a one-dimensional convolutional neural network (1D-CNN) to improve the accuracy of the acoustic performance prediction of automotive floor acoustic systems, and verified the validity of the model with experimental data [33]. Wang et al. in 2023 developed a diagnostic approach for MBR membrane fouling based on a modified residual neural network [34].
The acoustic package greatly affects comfort, yet its complex, interconnected subsystems make understanding its mechanisms challenging. It is worth noting that grounding data-driven methodologies in the pertinent engineering context not only diminishes reliance on the precision and scale of the data per se, but also augments the precision and applicability of the resultant models.
The Convolutional Neural Network (CNN) stands as a profound deep learning algorithm, distinguished by its exceptional feature extraction capabilities, rendering it highly proficient in the processing of extensive datasets. Leveraging the backpropagation algorithm for training purposes, CNN undergoes extensive data-driven training across various tiers of features, which in turn, exhibit commendable interpretability. Consequently, this algorithm furnishes a potent instrumental framework for the prediction of acoustic package performance. Tan developed a deep learning model using compressed sensing for noise reduction and a 1D-CNN with dropout regularization for acoustic event classification [35]. Abdoli et al. proposed an end-to-end method for ambient sound classification using a 1D-CNN that learns directly from audio signals and uses convolutional layers to capture temporal structures and relevant filters for the task [36].
The advantage of the data-driven approach to acoustic modeling is its ability to learn and reveal elusive patterns from large amounts of complex data. This approach is not constrained by the limitations of a priori knowledge required by traditional semi-analytical models and can handle nonlinear and non-stationary problems with higher accuracy. It is adaptively tuned by machine learning algorithms to show greater flexibility for unknown or variable phenomena. Once built, these models make predictions quickly, demonstrating computational efficiency in applications that require fast responses. They can easily update themselves with new data to improve model performance and have good scalability. Data-driven models can also handle large-scale and high-dimensional datasets, enabling the discovery of new acoustic patterns, which may be less feasible when using semi-analytical methods. Although the effectiveness of data-driven methods is dependent on the quality of the data and the construction of the model, they provide a unique and powerful tool in understanding and predicting complex acoustic systems.
Moreover, a direct establishment of the mapping model between the foundational design parameters of the acoustic package and the sound absorption and insulation performance of the floor system may potentially incur the risk of underfitting. This is attributable to the intricate nature of noise transmission characteristics in vehicles, where the sound absorption and insulation performance of the floor acoustic package system demonstrates a tenuous correlation with the underlying design parameters of the acoustic package—specifically, parameters encompassing material-level sound absorption and insulation performance, thickness, and their respective proportional distributions. Nevertheless, the direct establishment of a mapping relationship between the sound absorption and insulation performance of the floor system and the design parameters of the acoustic package’s bottom layer may inadvertently introduce a surge in the complexity of the relationship between said design parameters and the system’s overarching objectives. Consequently, this may potentially lead to a diminution in the model’s predictive accuracy. This occurrence is rooted in the fact that circumventing established mechanisms through exclusive reliance on data-driven modeling imposes stringent demands on the precision and scale of the underlying data.
To address this issue, this paper presents a new approach to predict the absorption and insulation performance of floor acoustic packages based on a vehicle noise propagation path perspective and system decomposition at the system level. The method not only contributes to the advancement of acoustic package performance research, but also provides valuable insights for future research in this area. The innovations of this study are (1) a data-driven floor acoustic performance analysis method is proposed and combined with a 1D-CNN convolutional neural network to improve the prediction efficiency and accuracy, and (2) a relevant mechanism, i.e., a multilevel target decomposition system for floor acoustic packages, is introduced in the corresponding engineering context. This enhancement enhances the interpretability of the model to a great extent. The advantage of this approach is that it can automatically learn and extract key features from a large amount of data, which reduces the reliance on traditional acoustic modeling experience and speeds up the analysis. Meanwhile, through the data-driven approach, we can reveal the complex nonlinear relationship between the performance of acoustic packages and their design parameters, thus providing more precise guidance for designing more optimized acoustic packages.
In summary, our study not only focuses on the performance enhancement of floor acoustic packages, but also emphasizes methodological innovations in the prediction of automotive acoustic package performance by introducing advanced 1D-CNN techniques. This provides a new research perspective for the automotive industry and points the way to the future development of acoustic packages. In the next sections, we will detail the application of 1D-CNN in floor acoustic package performance prediction and validate the effectiveness of its prediction model.
The novelty of this study lies in the use of a 1D-CNN to predict the sound isolation performance of multilayer acoustic systems, which demonstrates its unique advantages in processing time-series data when compared with traditional statistical methods or machine learning models, especially long-short-term memory networks. The 1D-CNN efficiently captures localized features in the acoustic signals through its convolutional layers and abstracts higher-level data representations through a multilayer structure, which not only enhances the processing accuracy but also improves the efficiency. 1D-CNN efficiently captures local features in sound signals through its convolutional layers and abstracts higher-level data representations through a multilayer structure, which not only improves the prediction accuracy but also increases the processing efficiency. Although Long Short-Term Memory (LSTM) performs well in processing long-term dependent time series data, 1D-CNN is more efficient and applicable in analyzing sound transmission problems with local temporal correlation, and in the specific application of sound propagation prediction, 1D-CNN is able to process complex acoustic signals, identify and learn patterns and trends in these signals. These properties of 1D-CNN make its application in sound propagation prediction is innovative and can provide more accurate and efficient prediction results than traditional data-driven methods. Overall, the application of 1D-CNN in this study represents a methodological innovation, which not only improves the accuracy of sound insulation performance prediction for multilayer systems, but also provides a new research direction and solution for this field.
In addition, the introduction of a multi-layered target system is intended to provide a more detailed and comprehensive approach to acoustic performance prediction. In acoustic modeling, single-target prediction methods often fail to capture the complexity and dynamics of multi-layer structured systems. By decomposing the objectives into multiple layers, this study not only allows the performance of acoustic packaging to be evaluated at different scales and dimensions, from material properties to detailed analysis of overall system performance, but this approach also promotes a deeper understanding of the factors influencing acoustic packaging design. By considering a wide range of variables, from single material layers to complex system structures, we are able to identify and optimize key factors that can significantly improve the overall performance of the acoustic package. This multidimensional analysis approach not only improves the accuracy and applicability of the predictive model, but also provides practical guidance for the innovative design of acoustic packaging, which can play an important role in improving ride comfort and reducing noise.
The paper is organized as follows: Section 2 describes the 1D-CNN neural network and integrates it with the floor acoustic package hierarchical target decomposition system to establish a multilayer prediction model for the sound insulation performance of floor acoustic packages. Section 3 describes the data collection process for sound absorption and sound insulation at all levels of the floor acoustic package. In Section 4, the 1D-CNN method is used to predict the sound insulation performance of the floor acoustic package, and the feasibility and superiority of the method are verified. Finally, Section 5 summarizes the results of the study and concludes the study based on the previous findings.
2.1 1D-CNN Network Introduction
CNN is a feed-forward neural network containing convolutional layers. It is one of the important algorithms for deep learning. It uses multi-layer perceptrons to detect, analyze and obtain features in data. This kind of network structure can be highly invariant to the observation data of tilt, rotation, scaling or translation, and can obtain the most significant features of the observation data. The sound absorption and insulation performance data of each level mentioned above can be regarded as a two-dimensional array, so the CNN model can better extract the characteristics of sound absorption and insulation performance of each level. The 1D-CNN model used in this paper is mainly composed of input layer, convolution layer, pooling layer, fully connected layer and output layer. Before the output layer, Softmax (for classification) or linear regression (for regression) function [37] is used to determine the output type. The typical network structure is shown in Fig. 1. The input layer is used to receive the data input by the user. The convolution layer includes multiple convolution kernels for image feature extraction. Usually, the first convolution layer extracts low-level features, and the latter convolution layer extracts more important features. After the convolution layer, the nonlinear activation function is generally used to convert the processing results into a nonlinear form to increase the expression and generalization ability of the network. After the fully connected layer, the output layer is connected to obtain the output data that the user needs to obtain.
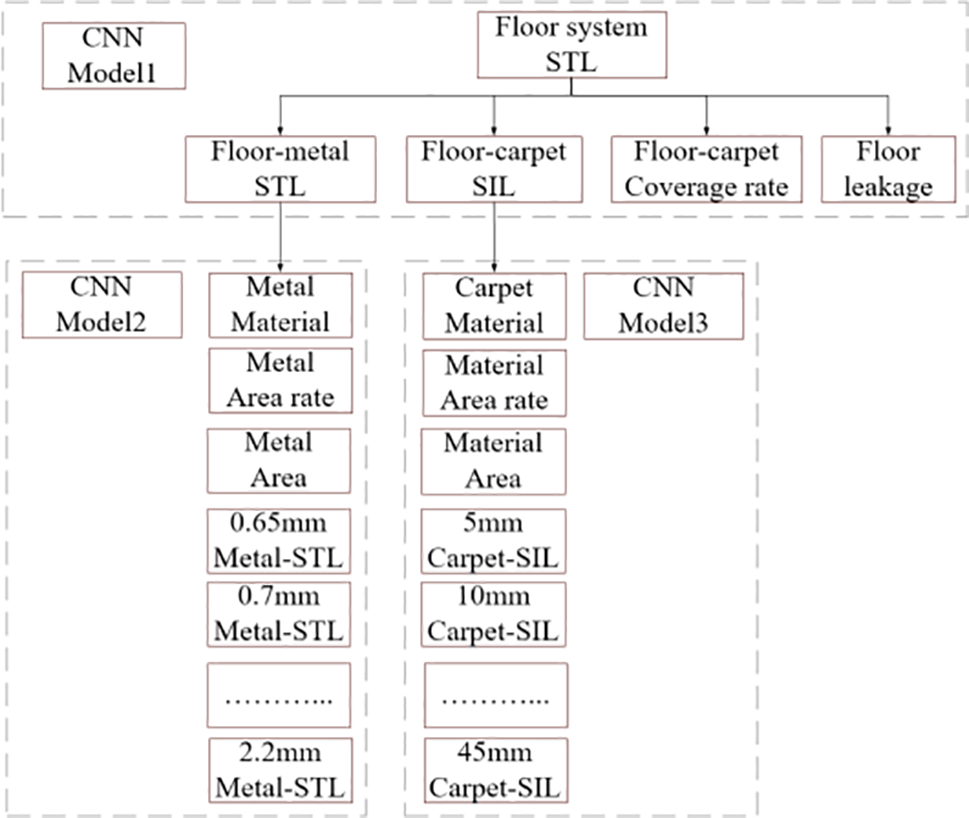
Figure 1: Floor acoustic package multi-level target decomposition system
In the formula, l is the number of convolution layers,
In the formula,
In addition to forward propagation, convolutional neural networks also have the characteristics of back propagation. The back propagation process updates the model parameters based on the error calculated by the loss function [39,40]. The loss function is an important index to determine the direction of the network training process. In regression problems, the root mean square error loss is used to evaluate the error and constrain the training process, which is defined as follows:
Among them,
where
In the field of acoustic modeling, 1D-CNN are used to extract features from one-dimensional sound signals. Compared to traditional multilayer perceptrons and other deep learning models, 1D-CNN has a significant advantage in processing time-domain signals by extracting local temporal features in the signals through convolutional layers and reducing the dimensionality of the features through pooling layers to achieve feature downscaling and abstraction. The advantage of 1D-CNN is its ability to automatically and efficiently learn useful representations from complex sound signals without complex pre-processing or feature engineering. For example, it can directly process raw audio waveforms to learn feature representations for classification or regression tasks. In addition, 1D-CNN is more efficient than fully connected networks in processing time-dependent data because it can exploit the temporal nature of the signal. However, 1D-CNN also has some limitations. First, although 1D-CNN performs well in extracting temporal features, additional processing steps may be required to extract frequency domain features when the sound signal contains complex frequency domain information. Second, the training of 1D-CNN requires a large amount of data and computational resources. If there are not enough training samples, the model may be overfitted, resulting in poor generalization ability. Finally, parameter tuning and network structure design of 1D-CNN require specialized knowledge, which may increase the difficulty of model design and debugging.
Despite these challenges, 1D-CNN has great potential for application in acoustic modeling. By designing suitable network structures and using appropriate regularization techniques, 1D-CNN can be effectively utilized for acoustic feature extraction and analysis, leading to accurate modeling and prediction in several acoustic applications.
2.2 Establishment of Floor Acoustic Package Hierarchical Target Decomposition System
Hierarchical decomposition represents an analytical approach that integrates theoretical foundations with practical engineering expertise. This method involves the systematic deconstruction of comprehensive technical metrics into constituent elements, thereby unveiling latent influencing factors [41]. The sound absorption and insulation efficacy of an entire vehicle is contingent upon the aggregate performance of numerous acoustic package components installed on the vehicle. Consequently, when scrutinizing the sound absorption and insulation properties of the overall vehicle, it is imperative to commence the analysis from the vantage point of the sound absorption and insulation characteristics of the underlying components. This approach enables a more precise assessment of the foundational determinants influencing the sound absorption and insulation attributes of the entire vehicle. Noise transmission pertains to the conveyance of sound waves from the source (with a specific focus in this study on tire-generated noise) to the human auditory system, traversing through the transmission pathway within the vehicle cabin. An in-depth examination of this noise transmission pathway facilitates a layered analysis of the sound absorption and insulation performance, commencing from the overall vehicle level and subsequently delving into the performance at the system and component levels. This progressive analysis culminates in the establishment of a multi-tiered target decomposition system for evaluating the sound absorption and insulation performance of the entire vehicle’s acoustic package.
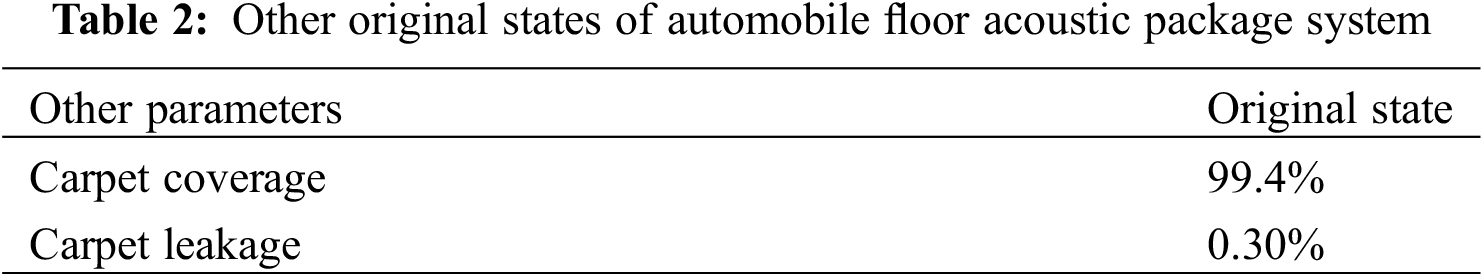
This study centers on evaluating the sound absorption and insulation capabilities of the acoustic package within the automotive floor system. Consequently, the primary design objective of the uppermost layer is to optimize the sound insulation performance of the automotive floor system’s acoustic package. The design variables at adjacent lower levels, which are intricately linked, encompass component-level performance metrics such as transmission loss through the floor sheet metal and insertion loss via the carpet. Additionally, process indicators including carpet coverage and potential leakage contribute to the design considerations. Further, the underlying design variables at the component level pertain to the composition of materials, their respective thicknesses, and the proportional distribution of each thickness. The depicted multi-level target decomposition system, as illustrated in Fig. 1, affords several distinct advantages: Firstly, the model’s formulation takes into account specific noise transmission pathways, thereby mitigating the risk of model under-fitting that can arise from solely data-driven approaches. Secondly, the inclusion of component-level considerations augments the hierarchical structure of the model, thereby minimizing nonlinearity between the uppermost and lowermost levels while concurrently enhancing the model’s interpretability [42].
Furthermore, it is important to note that the levels within the multi-level target decomposition system may not be uniformly interconnected, resulting in varying contributions of subsystem target performance from lower levels to the target performance of upper levels. Through the implementation of the constructed acoustic package target level decomposition system, both forward design from the uppermost level to the lowermost level and reverse performance verification from the lowermost level to the uppermost level can be achieved. This approach substantially mitigates the complexity inherent to acoustic package analysis, consequently enhancing the precision of performance assessment. In accordance with the hierarchical target decomposition system illustrated in Fig. 1, sound absorption and insulation performance data from each level are systematically gathered. Subsequently, a data-driven methodology is applied to model and establish a predictive framework for assessing the performance of the automotive floor acoustic package. The design variables are derived from the sound absorption and insulation performance data of each respective level. Specifically, the sound absorption and insulation performance data of the subsequent level are employed as predictive inputs, while the data from the adjacent upper level serve as the output, facilitating the establishment of a mapping relationship across levels, spanning from the lowermost to the uppermost tier.
2.3 Multi-Level Target Prediction of Sound Insulation Performance of Floor Acoustic Package with CNN
The establishment of the predictive model for the automotive floor acoustic package system’s performance is predicated upon the previously discussed multi-level target decomposition framework. As delineated in Fig. 2, predicting the sound absorption and insulation performance of the floor acoustic package system necessitates a comprehensive understanding of the quantitative interrelationships among the pertinent elements at each tier within the hierarchical target decomposition system. To address this, we have introduced a data-driven approach, specifically a 1D-CNN methodology, to discern and characterize these quantitative relationships.
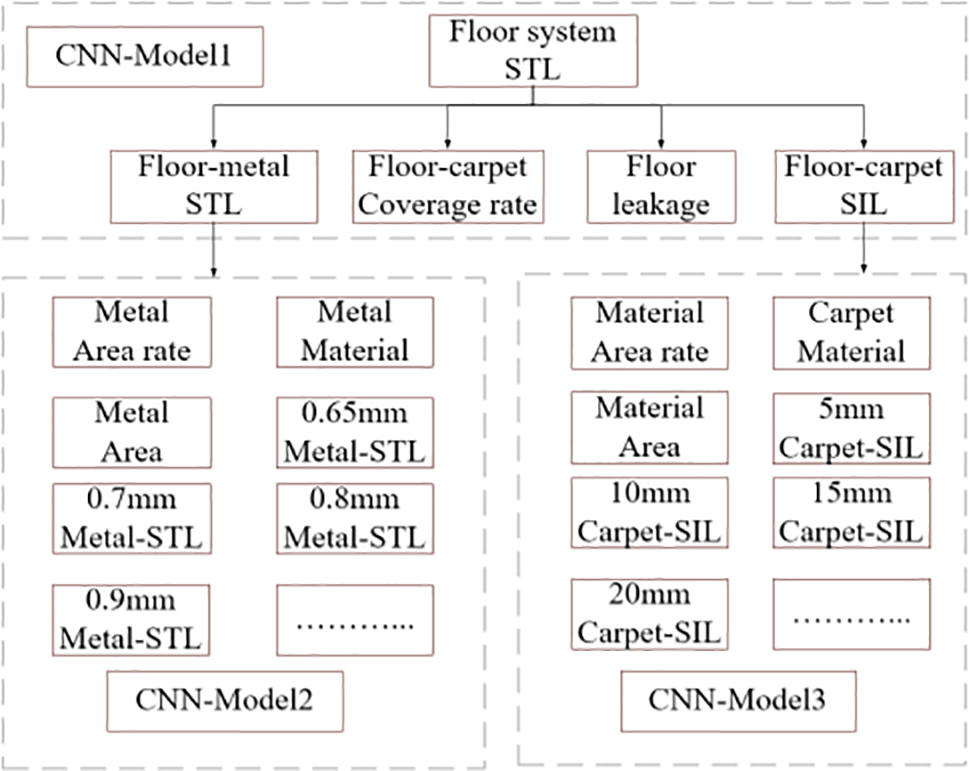
Figure 2: Prediction model of sound absorption and insulation performance of floor acoustic package system
The predictive model for the sound absorption and insulation performance of the automotive floor acoustic package system comprises multiple sub-models, each encapsulating the quantitative interdependence of the respective indicators associated with the system’s elements. Progressively, the sound absorption and insulation performance of the floor acoustic package system is forecasted through the sequential application of these 1D-CNN sub-models.
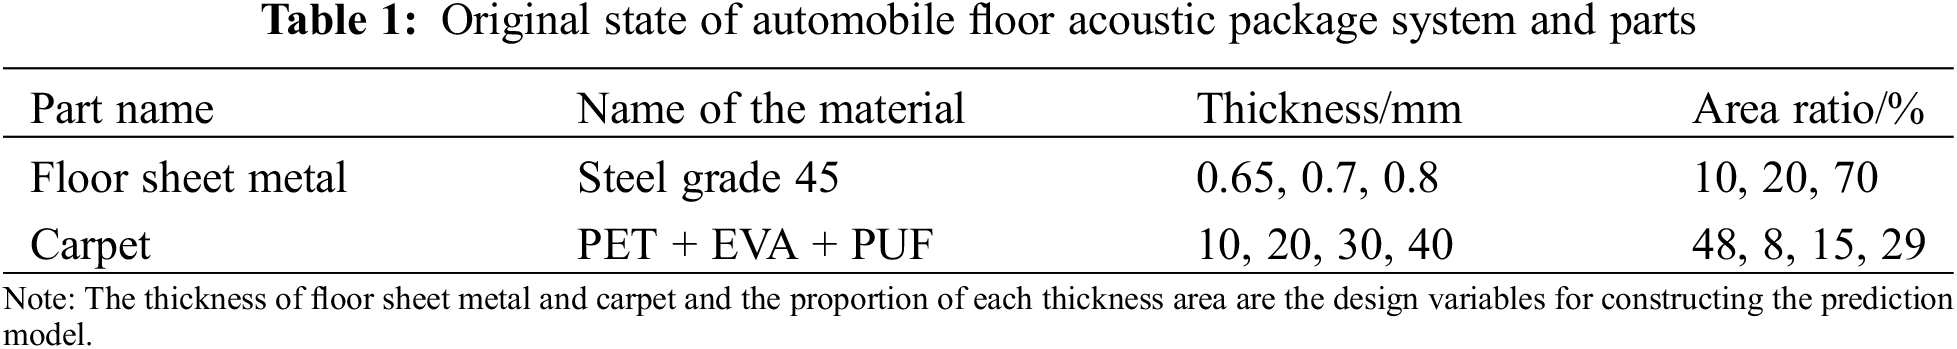
Specifically, the term “basic parameters” refers to the intrinsic and geometric properties of the materials that make up flooring sheet metal and carpet. Specifically, for flooring sheet metal, these parameters include the total area of the sheet metal (e.g., 1.529 m2 in its original state), the percentage of area in each thickness (e.g., 0.65, 0.7, 0.8 mm in its original state) category (e.g., 10%, 20%, 70% in its original state), and the sound transmission-loss characteristics of the sheet metal for each of these thicknesses. loss) of these different thicknesses of sheet metal. For carpet, the basic parameters include the total area (e.g., 1.519 m2 in the original state), the percentage of the area of each carpet thickness category (e.g., 48%, 8%, 15%, 19% in the original state), and the sound transmission loss of the carpet panels for each thickness.
Subsequently, the predicted outputs from each CNN sub-model at the third to second levels (encompassing parameters such as floor sheet metal transmission loss, carpet insertion loss, carpet sound absorption, and floor leakage) are employed as the predictive inputs for the CNN sub-model operating from the second level to the first level. The ultimate prediction output represents the sound absorption and insulation performance data specific to the floor system.
3.1 Data Acquisition and Sample Structure
We can use the transfer matrix method (TMM) to evaluate the sound absorption and insulation performance of flat panels, which is a feasible method. We produce test samples of acoustic package flat panel materials, and based on standing wave tube experiments we can more accurately obtain the acoustic absorption and insulation performance of acoustic package flat panels. The advantage of the data-driven acoustic modeling approach is that it is able to learn and reveal elusive patterns from a large amount of complex experimental data. This approach is not limited by the a priori knowledge required for traditional semi-analytical modeling, and can deal with nonlinear and non-stationary problems with higher accuracy. While the effectiveness of data-driven methods depends on the quality of the data and the construction of the model, they provide a unique and powerful tool for understanding and predicting complex acoustic systems.
The results of the test can effectively reflect the sound absorption and insulation performance of the floor acoustic package. The data used in this paper are collected in the reverberation chamber-semi-anechoic chamber. The test method refers to the International Society of Automotive Engineers standard SAEJ1400-2700 [43]. In the case of flat panels, we test the sound absorption and insulation properties of carpet acoustic package flat panels using flat circular samples in conjunction with a standing wave tube test. Specifically, we tested the sound absorption and isolation performance of the sheet metal parts containing 0.65, 0.7, and 0.8 mm flat sheets, and the acoustic package carpet flat sheets containing 10, 20, 30, and 40 mm flat sheets, respectively, in the standing wave tube test. For example, PET (Polyethylene Terephthalate) and PUF (Polyurethane Foam) materials were fabricated into 100 mm diameter and 10 mm thickness pancake shaped test specimens. As shown in Fig. 3, the sound absorption and insulation properties were tested in a standing wave tube. In the ‘reverberation chamber-semi-anechoic chamber window’ laboratory, the measured sample is installed in the window, and the sound source is placed in the reverberation chamber as the sound chamber. The excitation source uses white noise with a total energy of 120 dB, and four microphone sound pressure sensors are arranged in the reverberation chamber to measure the sound pressure level in the reverberation chamber. The semi-anechoic chamber is used as the receiving chamber, and the sound intensity level is measured by two sound intensity probes. According to the noise transfer formula, the transmission loss can be derived. The test site is shown in Figs. 4a and 4b. The STL of the floor system, the STL of the floor sheet metal and the SIL of the carpet were collected through experiments. Figs. 5a–5cshow the sound insulation performance of the floor system and the corresponding components.
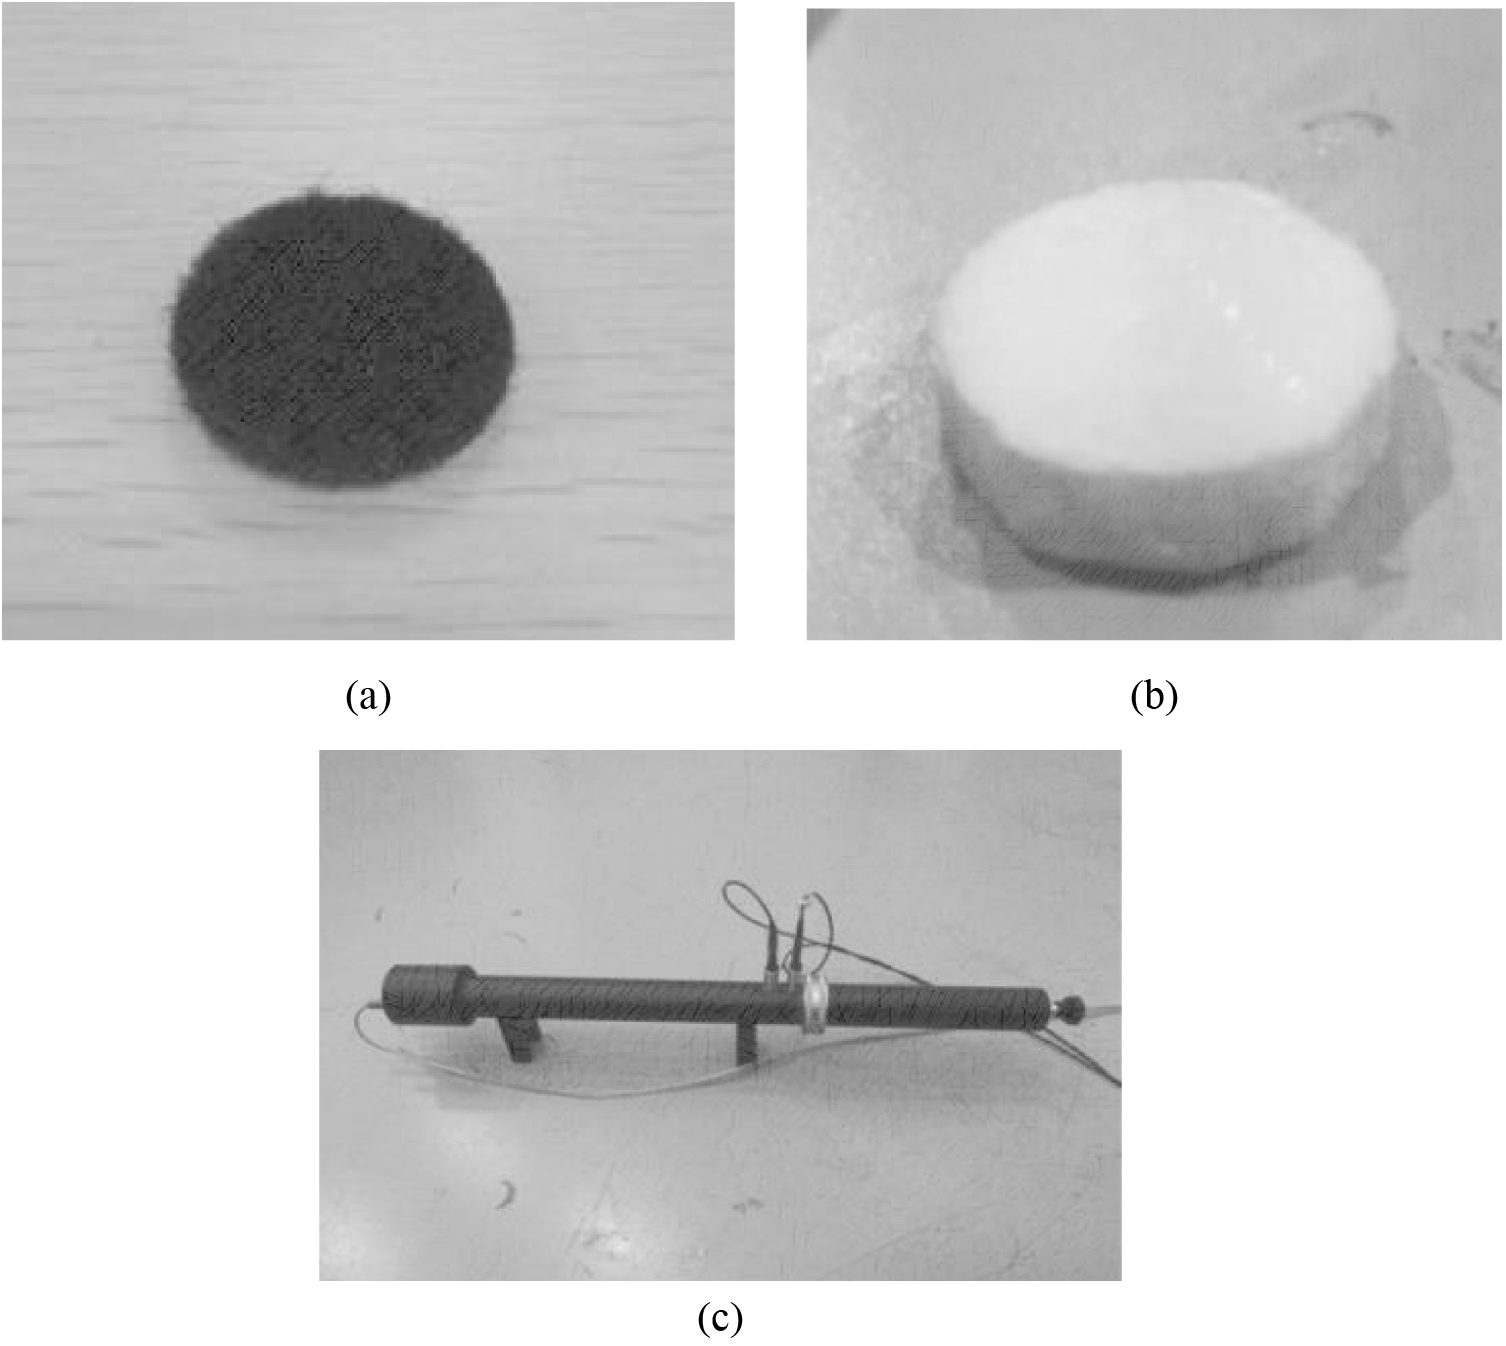
Figure 3: Standing wave tube experiment. (a) PET material test specimen (b) PUF material test specimen (c) Standing wave tube
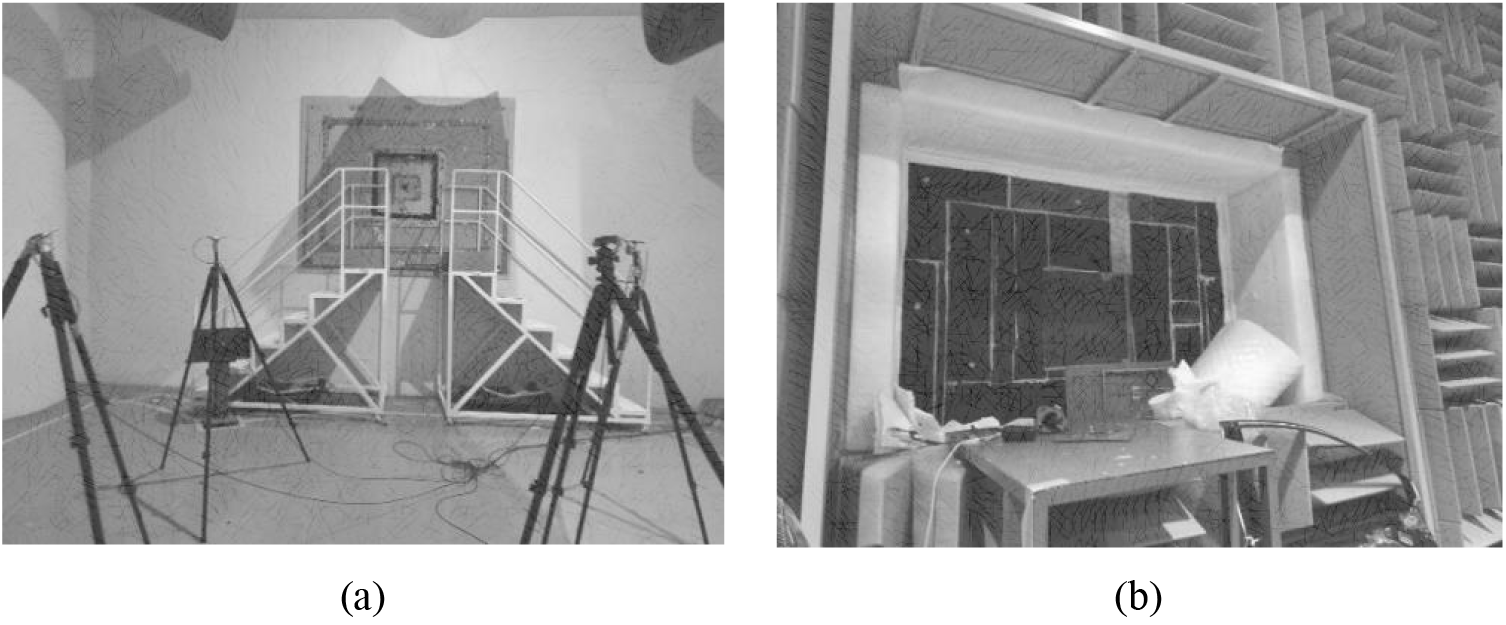
Figure 4: Reverberation chamber-semi-anechoic chamber window. (a) Sound insulation wall on one side of reverberation chamber (b) Sound insulation wall on one side of semi-anechoic room
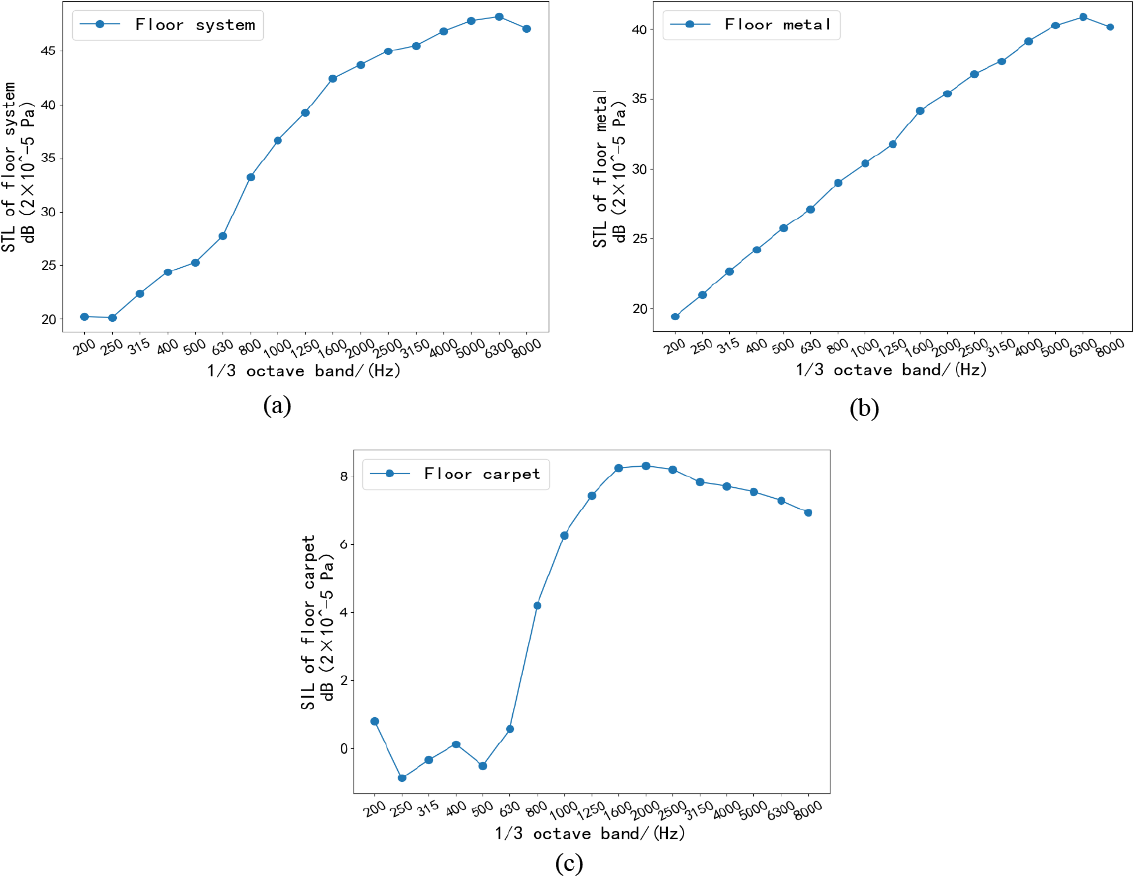
Figure 5: Sound insulation performance of floor acoustic package system and components under reverberation chamber-semi-anechoic chamber test. (a) Floor system STL. (b) Floor sheet metal STL. (c) Carpet SIL
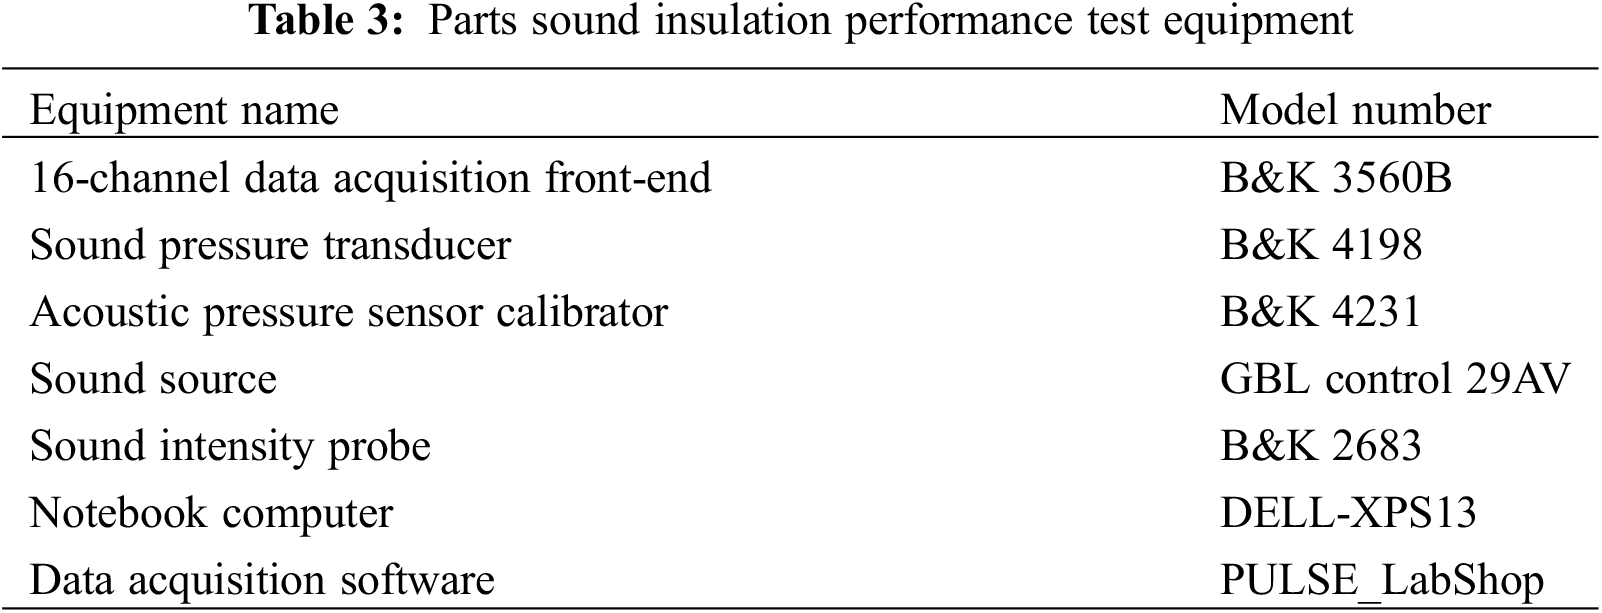
The floor sheet metal is organized by three thicknesses (0.65, 0.7, 0.8 mm) of sheet metal, with the area share of the three thicknesses of sheet metal being 10%, 20%, and 70%, respectively, and then carpeted components are covered on the floor sheet metal to form the flooring system. The carpet component consists of four different thicknesses (10, 20, 30, and 40 mm) of carpet, and the corresponding area share of the four thicknesses of carpet sheet metal parts is 48%, 8%, 15%, and 29%, respectively. For the four different thicknesses of the carpet, each layer is made of PET, EVA (Ethylene-Vinyl Acetate copolymer), and PUF. Each thickness of the carpet is made of three same thickness materials using the thickness of superimposed splicing, thickness ratio of 40%:40%:20%. In order to collect the number of samples needed to construct the prediction model, the Latin hypercube experimental design was used to construct the sample combination, in which the design factors were the thickness of the floor sheet metal and the carpet and the corresponding thickness area ratio. According to the engineering experience, the design variable factor is that the value of the original scheme changes by 10%, and the design level of the area corresponding to different thickness increases by 10%. At the same time, there is a limit that the sum of the area of different thickness is 100%. Tables 1 and 2show the original scheme of the car floor acoustic package. Through the Latin hypercube experimental design, 1000 sets of test samples were generated, including one set of original states. In the test, according to the standard SAEJ1400-2017, the transmission loss of the floor acoustic package system, the transmission loss of the floor sheet metal and the insertion loss of the carpet were obtained, respectively, in which the component holes were sealed by seals. The holes in the components are sealed by seals during the test, and the test specimen is left with holes connecting the source and receiver chambers. Acoustic sealing tapes are commonly used to close the holes during sound absorption and insulation performance tests. These tapes are effective in reducing sound and vibration and have a highly adhesive backing that adheres tightly to the sound insulating surface. With regard to the percentage of surfaces to be covered, this will vary depending on the specific test criteria and requirements. Typically, the tape should cover all possible acoustic leakage points to ensure accurate test results. The model of the test equipment used in the sound insulation performance test of the components in this paper is shown in Table 3. In acoustic applications, PET fibers can be used to make acoustic panels and acoustic fillers. Acoustic properties of PET materials derive from their fibrous structure, which traps and dissipates acoustic energy and reduces echoes and noise. EVA is a plastic that has rubber-like qualities, with good flexibility, high transparency, and excellent weathering, chemical stability, and ultraviolet resistance. In acoustics, EVA is often used as a soundproofing material due to its good shock-absorbing properties and waterproofing characteristics, helping to reduce sound and vibration transmitted by structures. PUF is a lightweight, porous material with excellent sound absorption and thermal insulation properties. Its open cell structure allows sound waves to enter the interior of the material and consume energy as they propagate through the porous material, resulting in acoustic absorption. PUF is often used for automotive interiors, furniture, building soundproofing and acoustic absorption, as well as other locations where acoustic improvements are needed. The three materials are often used in combination to utilize their individual properties to achieve higher acoustic performance.
4 Application and Validation of Method
Before building the sound insulation performance prediction model of the floor system, it is necessary to prepare relevant data and preprocess the data. The collection of samples is mainly obtained through relevant sound insulation performance tests, and the collected samples are cleaned to reduce data noise. After completing the data pre-processing, because the data dimension and value will have a certain impact on the modeling, it is necessary to further normalize the data set. Normalization is to convert the eigenvalues of the sample to the same dimension and map the data to the interval [0, 1]. The normalization function MinMaxScaler in the python-sklearn library is used to normalize the input data and denormalize the output results. The expressions are Eqs. (5) and (6).
where X: the data to be normalized, usually a two-dimensional matrix;
Through experiments, 1000 sets of more accurate STL and insertion loss SIL results of the floor acoustic package system and corresponding components and the underlying parameters obtained from the database were obtained. On this basis, the 1D-CNN method was introduced, and combined with the multi-level target decomposition system constructed above, the acoustic package forward development prediction model can be effectively established. Randomly, 800 of the 1000 groups of samples were used as training sets for learning, and the remaining 200 groups of samples were used as test sets.
The 1000 sample data sets obtained include transmission losses for the top-level floor acoustical package system, transmission losses for the floor sheet metal components, and insertion losses for the carpet. In addition, there are subfloor parameters for sheet metal and carpet components, including area, thickness, and percentage of area corresponding to each thickness, as well as sound absorption and sound insulation data for each thickness of sheet metal and carpet flat components. For the sound insulation performance objective, in constructing the third level to the second level model, a material-level base data prediction component-level transmission loss prediction model was built, with the area percentage of each thickness of the sheet metal and carpet acoustic matting material and the sound insulation corresponding to the 17 column 1/3-octave corresponding to each thickness as inputs, and the corresponding sheet metal and carpet component-level transmission losses as outputs. When constructing the second level to the first level model, the sheet metal and carpet component sound insulation quantities were used as inputs to the model, and the floor system sound insulation quantities were used as outputs of the model. The average value of the 10 operation results is taken as the evaluation preparation to reduce the random error. The 1D-CNN network with two layers of convolution is used as a sub-model for modeling. The number of input layer nodes of each sub-model is the input dimension of the prediction model described above, and the output layer is the output dimension of the prediction model described above. Table 4 corresponds to the specific parameters of each layer of the 1D-CNN network, and Fig. 6 is the corresponding 1D-CNN network architecture diagram.
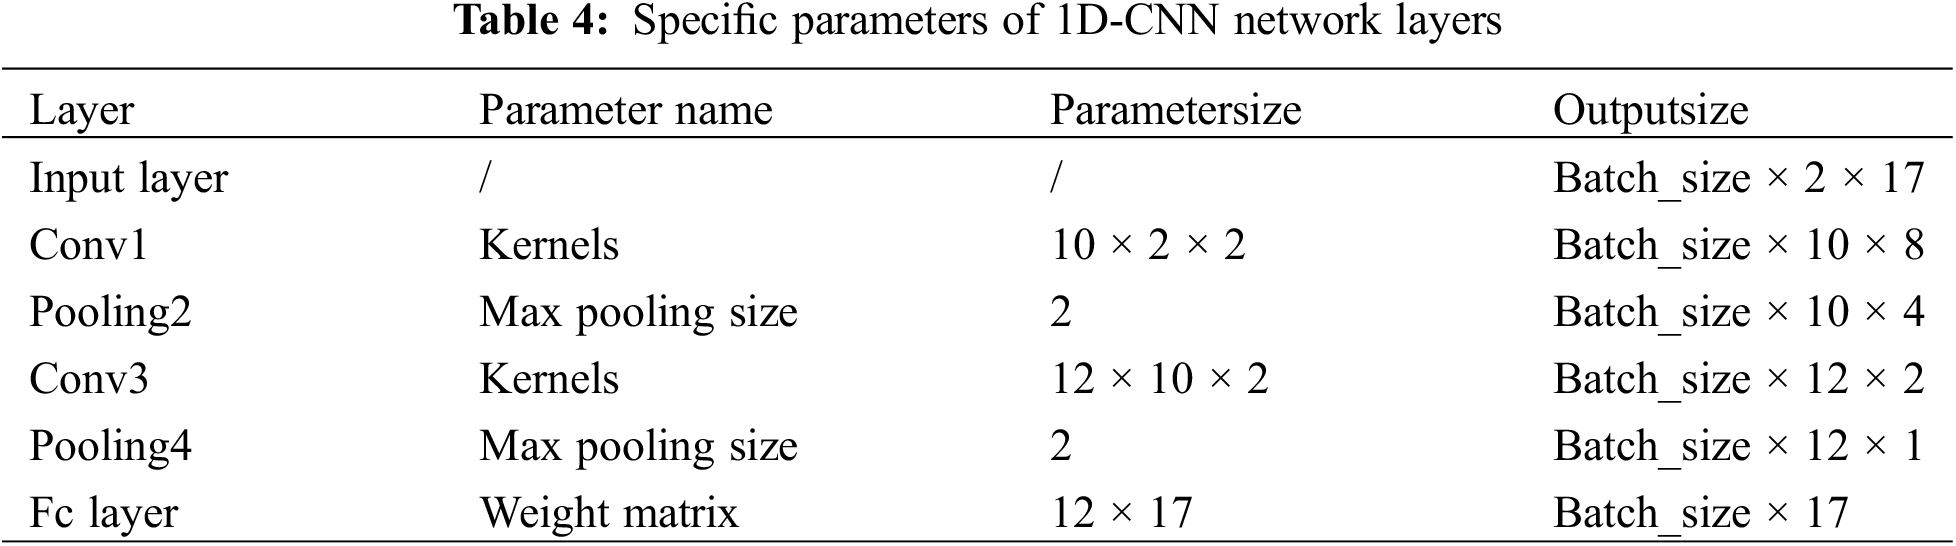
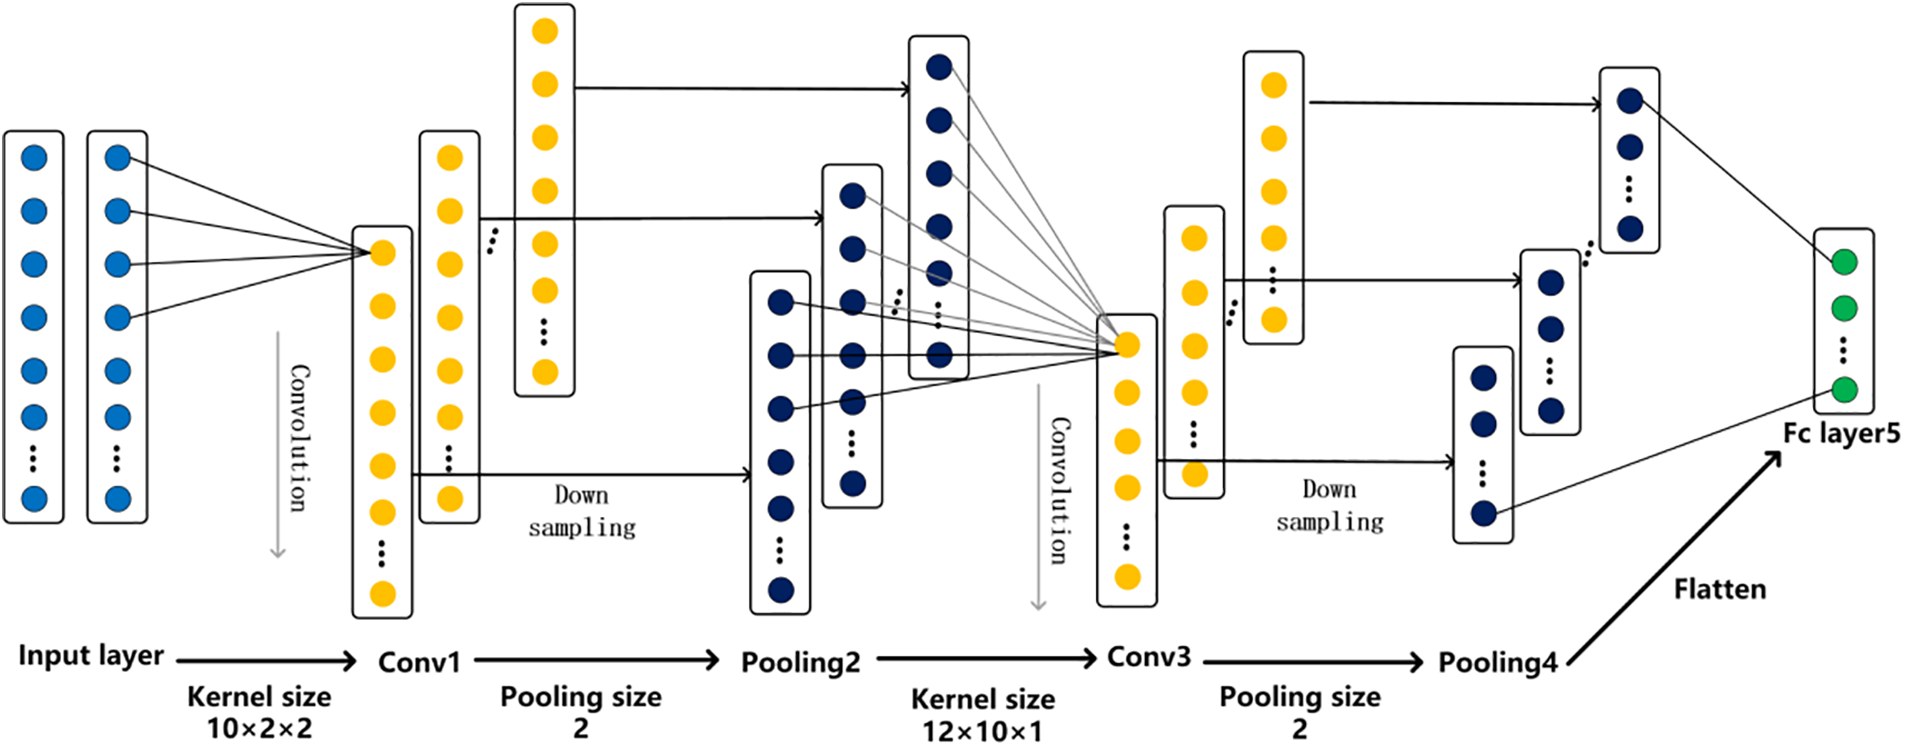
Figure 6: 1D-CNN structure diagram
The processor adopts AMD Ryzen 7 5800H with Radeon Graphics 3.20 GHz, 16 GB RAM memory, and the software development platform adopts Windows 10 64-bit operating system. Anaconda is used as the compiler environment of Python programming language, and vscode is used as the integrated development environment of Python. This platform can improve the efficiency of development. Combine Python third-party library tools to simplify code. Numpy and Pandas libraries are used as tools for data extraction, preprocessing and normalization. The deep learning model is established by using the torch.nn, torch.optimized, torch.autograd and other modules in the deep learning open source framework PyTorch. Use the Matplotlib graphics library to draw the results for analysis.
4.3 Model Prediction and Verification Based on 1D-CNN
After network learning, the prediction results and model accuracy under 17 one-third octaves can be obtained. Fig. 7 shows the prediction results and statistical errors of the 1D-CNN model in the training set and the test set. It can be seen that the fitting effect on the training set is better than that on the test set. The maximum absolute error of the above prediction model in the training set and the test set is 1.3 and 1.7 dB (reference sound pressure is 2.0 ×
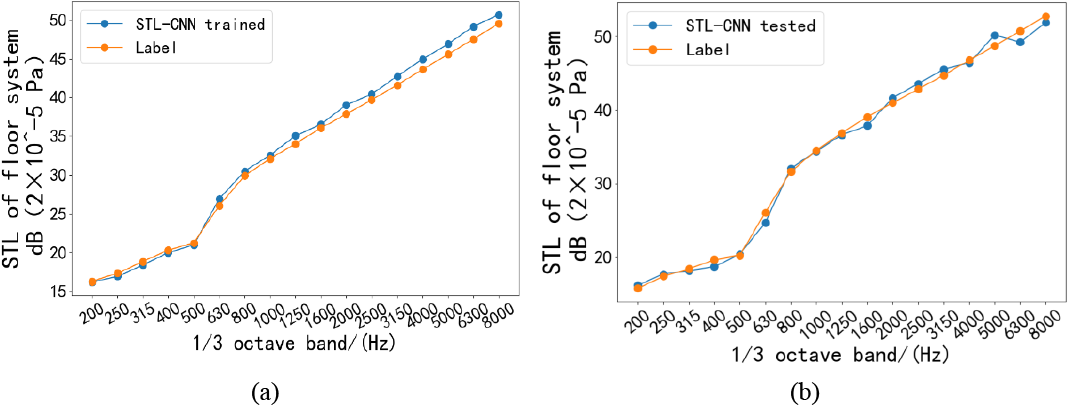
Figure 7: Prediction of sound insulation performance of floor acoustic package system. (a) Prediction effect of floor acoustic package system on training set. (b) The prediction effect of floor acoustic package system on the test set
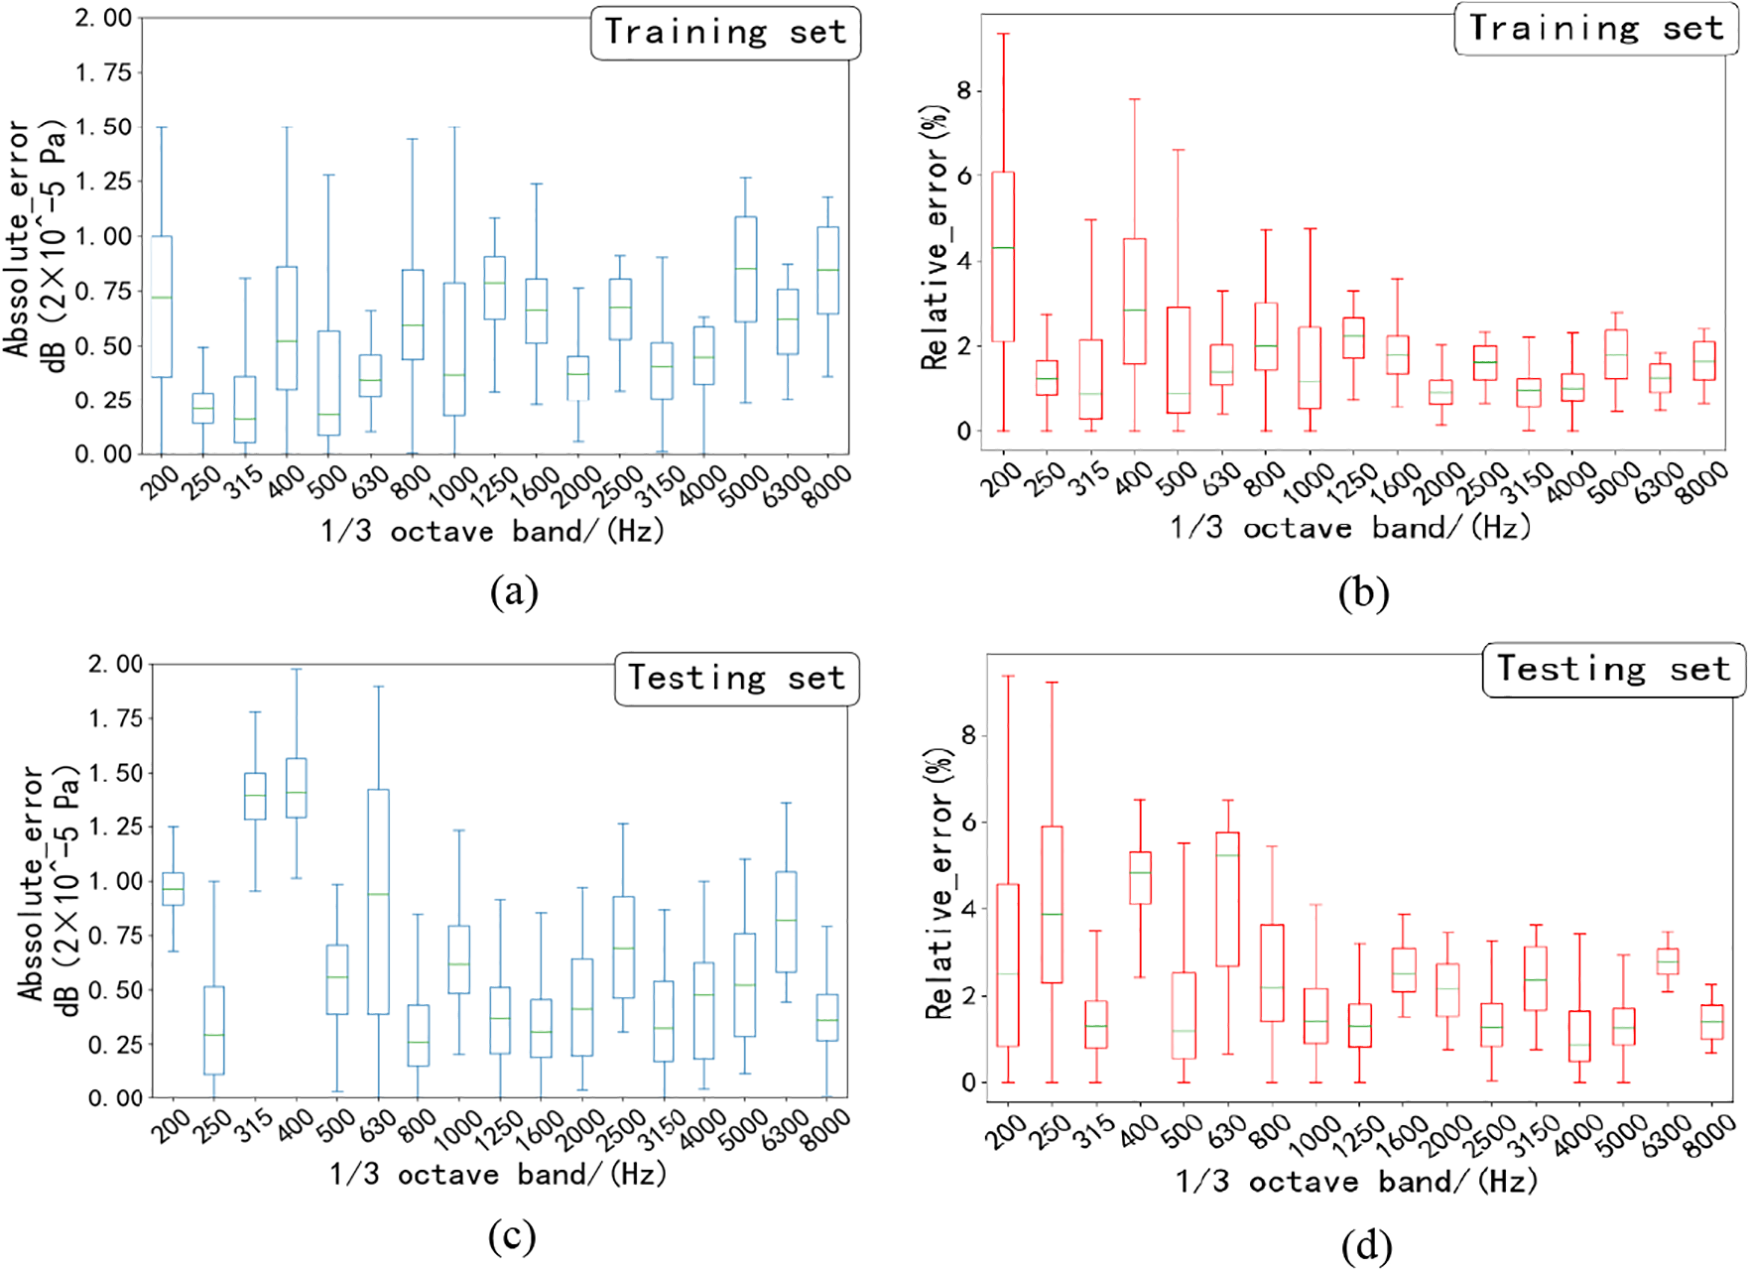
Figure 8: Prediction error of sound insulation performance of plate acoustic package system. (a) The prediction absolute error box diagram of the floor acoustic package system on the training set. (b) The prediction relative error box diagram of the floor acoustic package system on the training set. (c) The prediction absolute error box diagram of the floor acoustic package system on the test set. (d) The prediction relative error box diagram of the floor acoustic package system on the training set
In the process of 1D-CNN network training, in order to access the output of the middle layer, the forward hook function of PyTorch can be used. A hook can be added to any layer in the network structure. The hook will capture the output of the layer during the forward transfer, and use the visualization function visualize activations in matplotlib for visualization. The following five graphs show the output of each layer in the 1D-CNN model. Specifically. The abscissa axis usually represents the length of the feature map (i.e., the time step or the number of elements in the sequence), while the ordinate axis represents the value of the feature map (i.e., the activation value of each specific time step or position). Fig. 9a shows the feature activation values output by 10 output channels through the first layer convolution. Fig. 9b shows the feature activation values output by 10 output channels through the first pooling layer. Fig. 9c shows the feature activation values output by 12 output channels through the second layer convolution. In Fig. 9d, the feature activation values output by 12 output channels through the second pooling layer are shown. Fig. 9e is the output activation value of the fully connected layer.
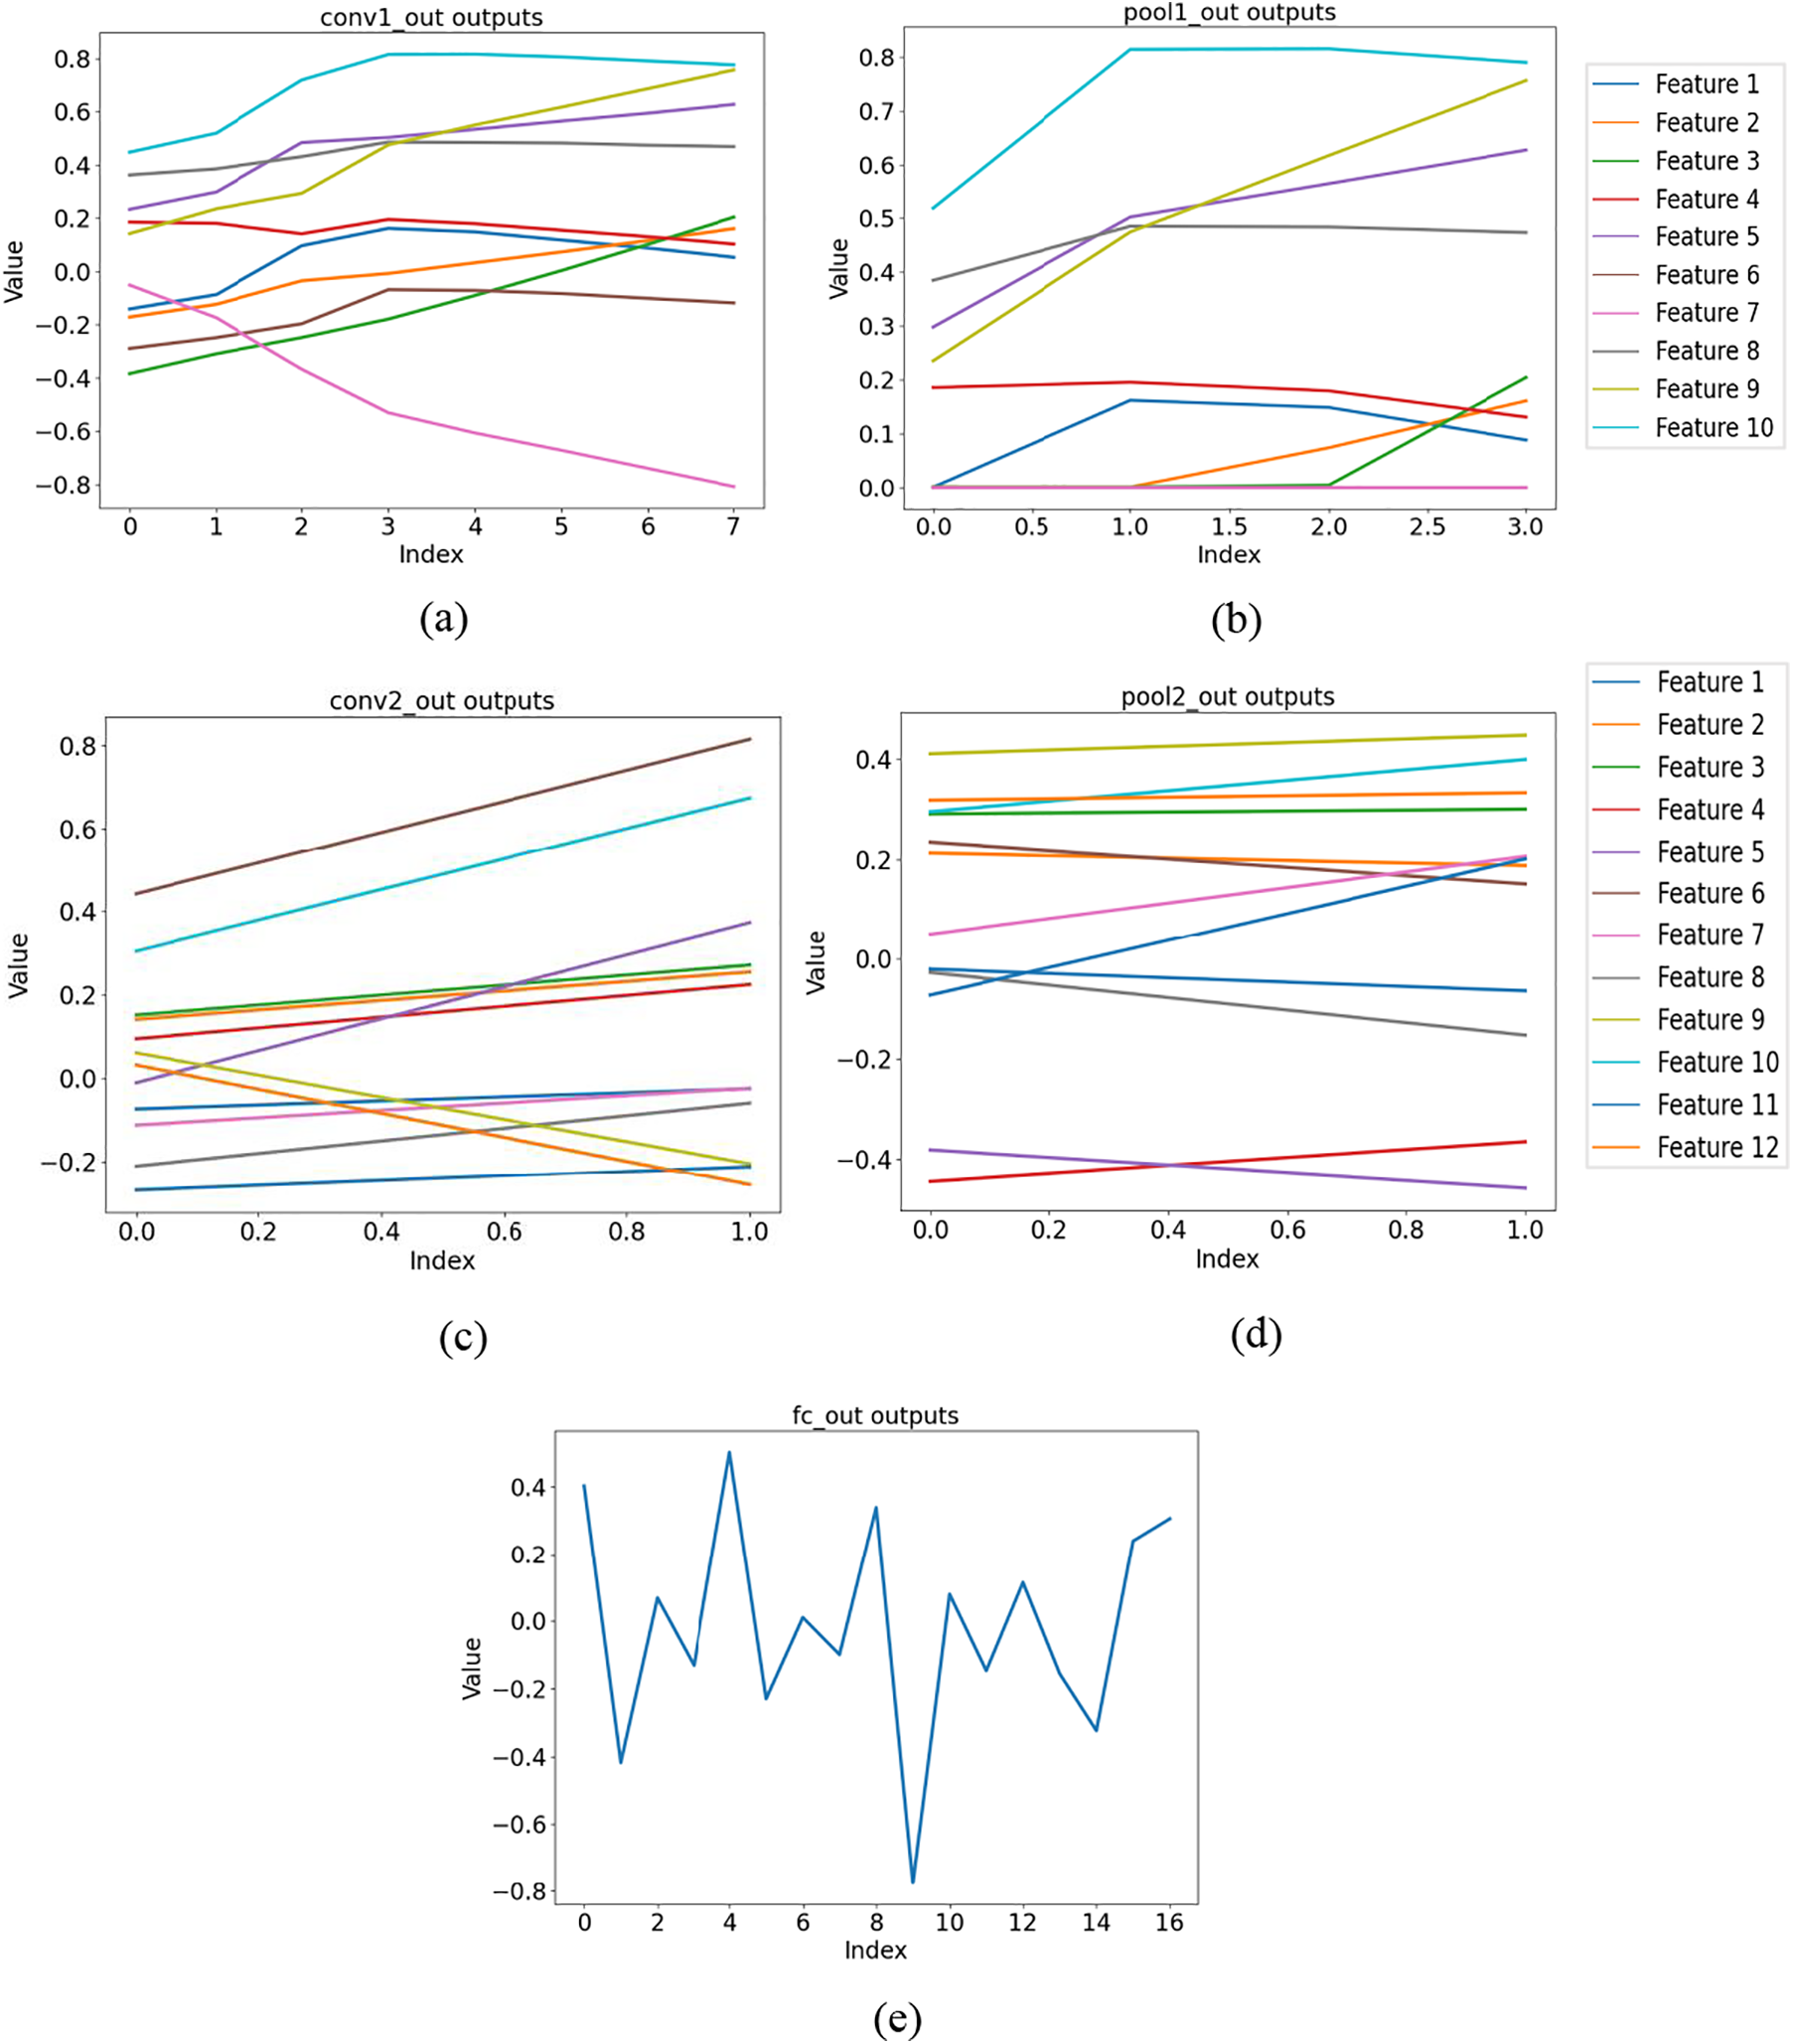
Figure 9: Visualization results of each middle layer of the network during the training of a single sample. (a) Output the result after the first layer of convolution. (b) Output results after the maximum pooling layer of the first layer. (c) The second layer outputs the result after convolution. (d) Output results after the maximum pooling layer of the second layer. (e) Full connection layer output results
This paper is also based on the prediction of the floor acoustic packet based on SEA simulation method, and the prediction results are shown in Fig. 10. It can be seen that the SEA simulation method predicts a higher gold ground when the frequency is above 800 Hz and the accuracy is slightly higher than that of the 1D-CNN prediction method, whereas the prediction accuracy of the SEA method is lower when the frequency is below the low-frequency, especially 800 Hz frequency domain. This is due to the fact that SEA is a computational method for estimating energy flows and resonances in complex dynamic systems. SEA provides higher accuracy at higher frequency ranges because at these frequencies the energy transfer and dissipation mechanisms of the system can be assumed to be random and evenly distributed. The specific frequency range depends on the specific parameters and boundary conditions of the system. For low frequencies, SEA is less accurate because in this range the wavelength is long relative to the structure size and the behavior of the system is more influenced by specific boundary conditions and structural details that are not adequately taken into account in the high-frequency assumptions of SEA. Therefore, SEA is not suitable for accurate prediction at low frequencies and is more applicable to statistical problems at high frequencies. The 1D-CNN method can make up for this shortcoming of the SEA simulation method, and a wider applicability exists.
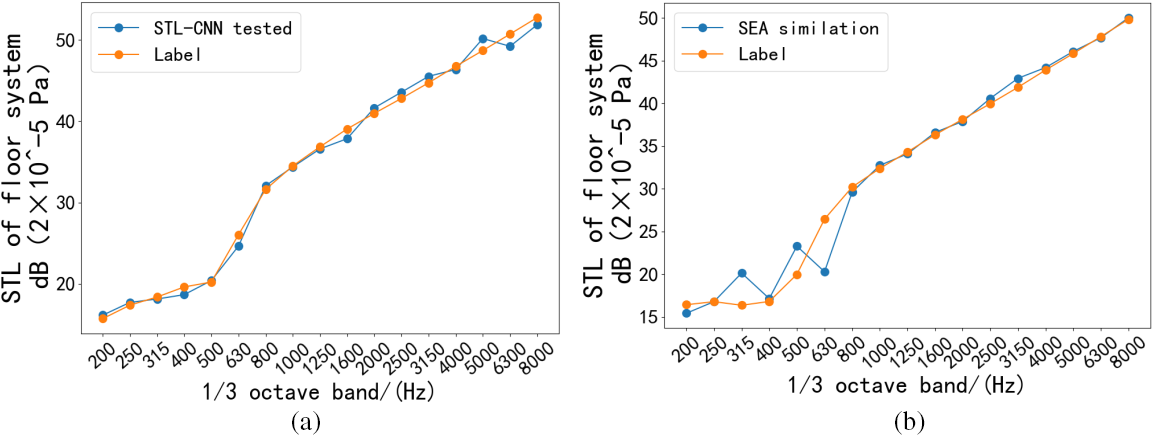
Figure 10: Visualization results of each middle layer of the network during the training of a single sample. (a) Prediction of sound insulation performance of floor acoustic package systems. (b) Predictive effectiveness of an SEA-based floor acoustic package system
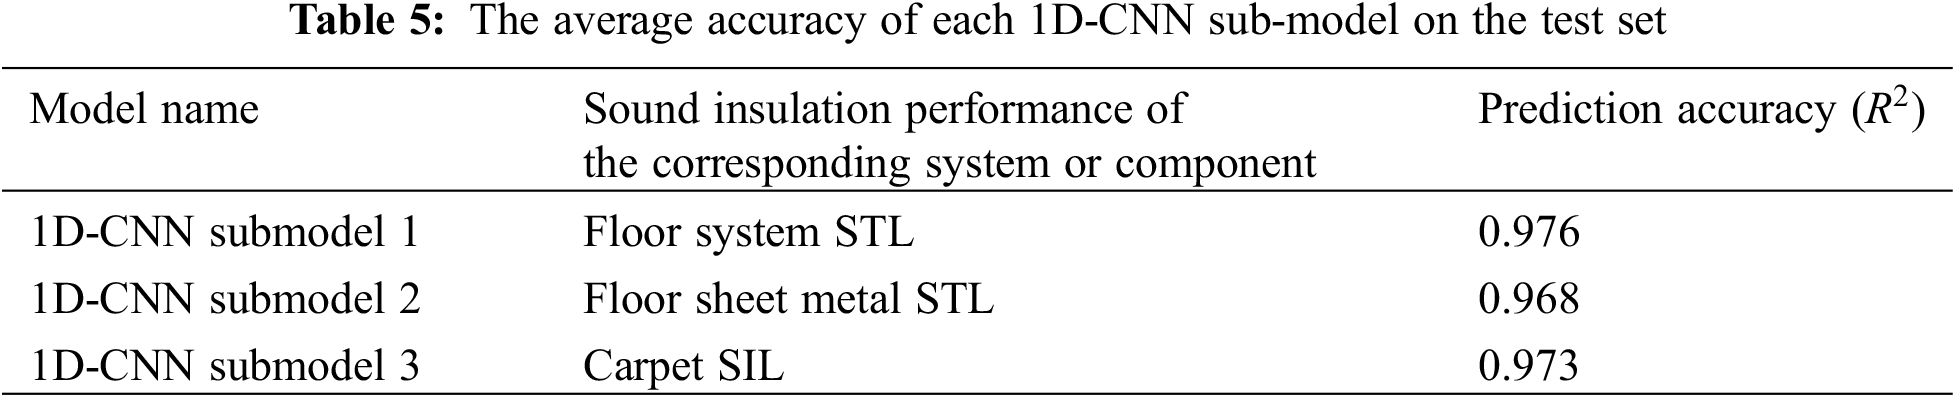
Table 5 shows the accuracy of each sub-model in the multi-level system in the test set. The conventional method is to introduce the mean square error MSE as the evaluation index. However, since the mean square error MSE uses the coefficient of determination to evaluate the upper and lower limits, the predicted data in different sub-models may have a large gap between the upper and lower peak levels. It can only be effective in vertical comparison, but it is relatively difficult to compare horizontally. Therefore, the coefficient of determination index R2 is introduced to evaluate. Among them, the average determination coefficient R2 of the prediction model of the sound absorption and insulation performance of the top floor system reaches 0.976, and the average determination coefficient R2 of the second floor model is not less than 0.968, which is at a good level, indicating the accuracy of the 1D-CNN method proposed in this paper in the prediction of the acoustic package of the automobile floor.
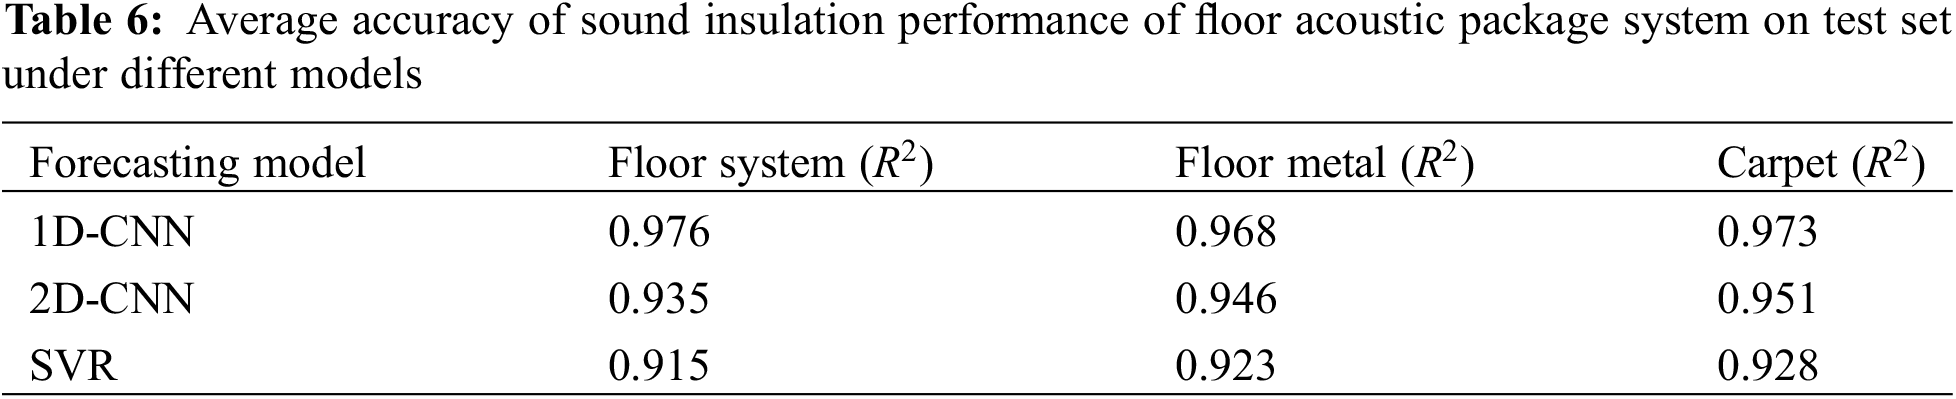
In order to verify the superiority of the proposed method, the commonly used SVR and 2D-CNN models are applied to the multi-level target decomposition system of the floor acoustic package system for modeling and prediction. The SVR uses Gaussian kernel function and is optimized by grid parameter search. Fig. 11 shows the prediction accuracy of different models for predicting the sound insulation performance of the floor system at different frequencies. Table 6 shows the comparison of the STL prediction results of the floor acoustic package system by the three models. It can be seen that the accuracy of SVR in the test set is relatively low. Its R2 in different sub-model STL prediction is 0.915, 0.923, 0.928; the accuracy of 2D-CNN and 1D-CNN is higher, and the R2 of 2D-CNN model is 0.935, 0.946 and 0.951 respectively in STL prediction of different sub-models. According to experience, 2D-CNN is more suitable for image data or two-dimensional data, while 1D-CNN is usually suitable for sequence data. The sound absorption and insulation data of our component systems are essentially one-dimensional data, so it may be more appropriate to use 1D-CNN. Combined with the prediction accuracy comparison of the 1D-CNN mentioned above, it can be seen that the 1D-CNN method has the highest R2 in the three prediction models, which verifies the superiority of the proposed method.
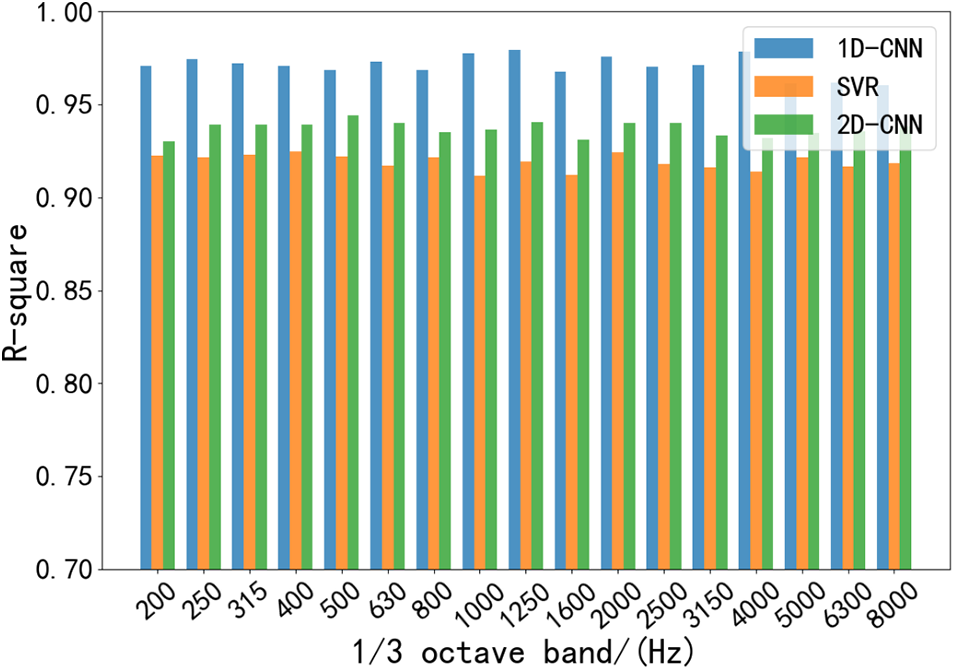
Figure 11: Accuracy of the floor acoustic package system under different models at each frequency of the test set
Regarding the limitations of our proposed method: our 1D-CNN model is trained on a specific dataset consisting of flooring systems with specific material compositions and number of layers. Since the predictive power of a machine learning model depends on the representativeness of its training data, the model may not be able to accurately predict the acoustic performance of a flooring system when it consists of different materials or structures. If the material or number of layers of the flooring system is significantly different from the training data, the model can be retrained using the new data to accommodate these changes. Regarding the validity of our proposed method: despite the limitations mentioned above, our model shows good predictive ability over its range of training data. The validity of the model has been verified on both the training and validation sets, showing a high degree of accuracy and relevance. However, in order to fully evaluate the effectiveness of the model, we plan to conduct more extensive tests on flooring systems with different materials and structures in future work. In acoustic modeling, if the floor system consists of different materials, the simulation of its acoustic performance needs to take into account the flat-piece acoustic absorption and isolation cardioplex data for more materials of each material. Variations in these materials can directly affect the sound absorption and acoustic performance of the floor system. Our future work will extend the model to incorporate more types of floor system configurations and model the acoustic properties of different materials to improve the model’s generalization ability and prediction accuracy.
This study introduces a novel approach utilizing the 1D-CNN method for the prediction of sound absorption and insulation performance within automotive floor acoustic packages. Leveraging insights derived from the structural composition of the floor acoustic package and the mechanics of noise transmission, a hierarchical decomposition system for the automotive floor acoustic package is established. Subsequently, a multi-level target performance prediction methodology for the acoustic package is proposed, predicated on the 1D-CNN model. The accuracy of the proposed performance prediction targets consistently exceeds 0.968, surpassing the performance of traditional models such as SVR and 2D-CNN. This substantiates the precision and superiority of the proposed method.
Furthermore, the prediction model undergoes rigorous training and testing using accumulated experimental data. The model’s performance undergoes iterative refinement and self-learning as the dataset expands, endowing it with the capacity for continuous evolution. Additionally, the multi-level decomposition system implemented for the floor acoustic package simplifies the interdependencies between data points across the entire model. By adopting a data-driven approach to predict floor acoustic package performance, this study considers the pertinent mechanisms within the corresponding engineering context, thereby markedly enhancing the accuracy and interpretability of the prediction model.
Acknowledgement: The authors would like to acknowledge the support from the Sichuan Provincial Natural Science Foundation and the facilities provided by the Institute of Energy and Power Research at Southwest Jiaotong University for the experimental research.
Funding Statement: This research was funded by the SWJTU Science and Technology Innovation Project (2682022CX008).
Author Contributions: Writing-original draft: Cheng Peng, Siwei Cheng; supervision, funding acquisition: Haibo Huang; methodology, experiment: Min Sun, Chao Ren; validation, writing-review and editing: Siwei Cheng, Jun Song. All authors reviewed the results and approved the final version of the manuscript.
Availability of Data and Materials: The data used to support the findings of this study are available from the corresponding author upon request.
Conflicts of Interest: The authors declare that they have no conflicts of interest to report regarding the present study.
References
1. Zhang, Y., E, L. (2006). Discussion on automobile noise hazard and control. China Science and Technology Information, 108(6), 110. [Google Scholar]
2. Huang, H., Huang, X., Ding, W., Yang, M., Yu, X. et al. (2023). Vehicle vibro-acoustical comfort optimization using a multi-objective interval analysis method. Expert Systems with Applications, 213, 119001. https://doi.org/10.1016/j.eswa.2022.119001 [Google Scholar] [CrossRef]
3. Chang, L., Jiang, A., Rao, M., Ma, F., Huang, H. et al. (2021). Progress of low-frequency sound absorption research utilizing intelligent materials and acoustic metamaterials. RSC Advances, 11(60), 37784–37800. https://doi.org/10.1039/D1RA06493B [Google Scholar] [PubMed] [CrossRef]
4. Wu, Y., Liu, X., Huang, H., Wu, Y., Ding, W. et al. (2023). Multi-objective prediction and optimization of vehicle acoustic package based on ResNet neural network. Sound & Vibration, 57, 73–95. https://doi.org/10.32604/sv.2023.044601 [Google Scholar] [CrossRef]
5. Khalil, M., McGough, A. S., Pourmirza, Z., Pazhoohesh, M., Walker, S. (2022). Machine learning, deep learning and statistical analysis for forecasting building energy consumption—A systematic review. Engineering Applications of Artificial Intelligence, 115, 105287. https://doi.org/10.1016/j.engappai.2022.105287 [Google Scholar] [CrossRef]
6. Lee, J. J., Powell, R. E., Ni, A. E., Tsou, P. (1999). Integration of SEA tire model with vehicle model. SAE Technical Paper, 108, 2626–2632. https://doi.org/10.4271/1999-01-1700 [Google Scholar] [CrossRef]
7. Fan, D., Dai, P., Yang, M., Jia, W., Jia, X. et al. (2022). Research on maglev vibration isolation technology for vehicle road noise control. SAE International Journal of Vehicle Dynamics, Stability, and NVH, 6, 233–245. https://doi.org/10.4271/10-06-03-0016 [Google Scholar] [CrossRef]
8. Kobayashi, N., Hisanori, T. (2003). Development of a luxury vehicle acoustic package using SEA full vehicle model. SAE Technical Paper, USA. https://doi.org/10.4271/2003-01-1554 [Google Scholar] [CrossRef]
9. Ge, F., Li, Y., Gu, Y. (2012). The application of SEA in automobile acoustic package cost reduction design. Shanghai Automobile, 31(7), 45–48. https://doi.org/10.3969/j.issn.1007-4554.2012.07.12 [Google Scholar] [CrossRef]
10. Lu, Z., Hao, Z., Zheng, X., Yang, J. (2012). Study on the mid-band insertion loss of plate acoustic packaging under mechanical excitation. Vibration and Shock, 31(3), 162–167. https://doi.org/10.3969/j.issn.1000-3835.2012.03.033 [Google Scholar] [CrossRef]
11. Gao, Y. (2016). A review of the research on the full-band noise problem in automobiles based on VA one. Technology News, 14(9), 61–63. https://www.cqvip.com/qk/87241x/201609/669837280.html [Google Scholar]
12. Teknos, T., Liu, W., Musser, C. T. (2009). Use of SEA to support sound package design studies and vehicle target setting. SAE Technical Paper, USA. https://doi.org/10.4271/2009-01-2206 [Google Scholar] [CrossRef]
13. Lee, H. R., Kim, H. Y., Jeon, J. H., Kang, Y. J. (2019). Application of global sensitivity analysis to statistical energy analysis: Vehicle model development and transmission path contribution. Applied Acoustics, 146, 368–389. https://doi.org/10.1016/j.apacoust.2018.11.023 [Google Scholar] [CrossRef]
14. Che, Y., Liu, H., Guo, S., Wang, Q. (2013). Prediction of interior noise of pure electric vehicle based on SEA model. Journal of Wuhan University of Technology (Information and Management Engineering Edition), 35(5), 627–630 (In Chinese). [Google Scholar]
15. Du, A., Shao, C., Shao, J., Wei, L. (2015). Optimization of front and floor acoustic packages under engine acoustic excitation. Journal of Jiamusi University (Natural Science Edition), 33(5), 641–646 (In Chinese). [Google Scholar]
16. Peng, C., Xu, F., Sun, M., Pan, W., Wang, X. (2016). Evaluation and application of acoustic package based on vehicle sound transfer function. Machinery, 43(6), 42–46. [Google Scholar]
17. Norimasa, K., Hisanori, T. (2003). A sea-based optimizing approach for sound package design. SAE Paper, USA. https://doi.org/10.4271/2003-01-1556 [Google Scholar] [CrossRef]
18. Jiang, D. (2018). Analysis and optimization of sound absorption and insulation performance of automobile front acoustic package (Master Thesis). Southwest Jiaotong University, Chengdu, China. [Google Scholar]
19. Lee, C. M., Xu, Y. (2009). A modified transfer matrix method for prediction of transmission loss of multilayer acoustic materials. Journal of Sound and Vibration, 326(1–2), 290–301. https://doi.org/10.1016/j.jsv.2009.04.037 [Google Scholar] [CrossRef]
20. Dell, A., Krynkin, A., Horoshenkov, K. (2021). The use of the transfer matrix method to predict the effective fluid properties of acoustical systems. Applied Acoustics, 182, 108259. https://doi.org/10.1016/j.apacoust.2021.108259 [Google Scholar] [CrossRef]
21. Song, G., Mo, Z., Bolton, J. S. (2023). A transfer-matrix-based approach to predicting acoustic properties of a layered system in a general, efficient, and stable way. SAE Technical Paper, USA. https://doi.org/10.4271/2023-01-1052 [Google Scholar] [CrossRef]
22. Huang, H., Huang, X., Ding, W., Yang, M., Fan, D. et al. (2022). Uncertainty optimization of pure electric vehicle interior tire/road noise comfort based on data-driven. Mechanical Systems and Signal Processing, 165, 108300. https://doi.org/10.1016/j.ymssp.2021.108300 [Google Scholar] [CrossRef]
23. Chaudhari, V. V., Radhika, V., Vijay, R. (2017). Frontloading approach for sound package design for noise reduction and weight optimization using statistical energy analysis. SAE International Journal of Vehicle Dynamics, Stability, and NVH, 1, 66–72. https://doi.org/10.4271/2017-26-0222 [Google Scholar] [CrossRef]
24. Huang, H., Huang, X., Ding, W., Zhang, S., Pang, J. (2023). Optimization of electric vehicle sound package based on LSTM with an adaptive learning rate forest and multiple-level multiple-object method. Mechanical Systems and Signal Processing, 187, 109932. https://doi.org/10.1016/j.ymssp.2022.109932 [Google Scholar] [CrossRef]
25. Zheng, Z. (2022). Prediction of sound insulation performance of vehicle body system based on machine learning (Master Thesis). Southwest Jiaotong University, Chengdu, China. [Google Scholar]
26. Wang, F., Chen, Z., Wu, C., Yang, Y. (2019). Prediction on sound insulation properties of ultrafine glass wool mats with artificial neural networks. Applied Acoustics, 146, 164–171. https://doi.org/10.1016/j.apacoust.2018.11.018 [Google Scholar] [CrossRef]
27. Schaefer, N., Bergen, B., Keppens, T., Desmet, W. (2017). A design space exploration framework for automotive sound packages in the mid-frequency range. SAE Technical Paper, USA. https://doi.org/10.4271/2017-01-1751 [Google Scholar] [CrossRef]
28. Song, Y., Hao, N., Ruan, S., He, C., Ma, Q. (2023). Free vibration properties of beetle elytron plate: Composite material, stacked structure and boundary conditions. Mechanics of Materials, 185, 104754. https://doi.org/10.1016/j.mechmat.2023.104754 [Google Scholar] [CrossRef]
29. Hao, N., Wang, Z., Song, Y., Ruan, S., He, C. et al. (2022). Free vibration and sound transmission properties of beetle elytron plate: Structural parametric analysis. Heliyon, 8(11), E11683. https://doi.org/10.1016/j.heliyon.2022.e11683 [Google Scholar] [PubMed] [CrossRef]
30. Oliazadeh, P., Farshidianfar, A., Crocker, M. J. (2022). Experimental study and analytical modeling of sound transmission through honeycomb sandwich panels using SEA method. Composite Structures, 280, 114927. https://doi.org/10.1016/j.compstruct.2021.114927 [Google Scholar] [CrossRef]
31. Huang, H. B., Li, R. X., Yang, M. L., Lim, T. C., Ding, W. P. (2017). Evaluation of vehicle interior sound quality using a continuous restricted Boltzmann machine-based DBN. Mechanical Systems and Signal Processing, 84, 245–267. https://doi.org/10.1016/j.ymssp.2016.07.014 [Google Scholar] [CrossRef]
32. Huang, H., Wu, J., Lim, T. C., Yang, M., Ding, W. (2021). Pure electric vehicle nonstationary interior sound quality prediction based on deep CNNs with an adaptable learning rate tree. Mechanical Systems and Signal Processing, 148, 107170. https://doi.org/10.1016/j.ymssp.2020.107170 [Google Scholar] [CrossRef]
33. Golhosseini, S. M. J., Aliabadi, M., Golmohammadi, R., Farhadian, M., Akbari, M. et al. (2022). Combined effects of exposure to noise and vibration on human postural equilibrium under simulated driving conditions. Sound & Vibration, 56(1), 37–49. https://doi.org/10.32604/sv.2022.014616 [Google Scholar] [CrossRef]
34. Wang, Z., Zeng, J., Shi, Y., Ling, G. (2023). MBR membrane fouling diagnosis based on improved residual neural network. Journal of Environmental Chemical Engineering, 11(3), 109742. https://doi.org/10.1016/j.jece.2023.109742 [Google Scholar] [CrossRef]
35. Tan, P. S., Lim, K. M., Tan, C. H., Lee, C. P., Kwek, L. C. (2023). ComSense-CNN: Acoustic event classification via 1D convolutional neural network with compressed sensing. Signal, Image and Video Processing, 17(3), 735–741. https://doi.org/10.1007/S11760-022-02281-5 [Google Scholar] [CrossRef]
36. Abdoli, S., Cardinal, P., Koerich, A. L. (2019). End-to-end environmental sound classification using a 1D convolutional neural network. Expert Systems with Applications, 136, 252–263. https://doi.org/10.1016/j.eswa.2019.06.040 [Google Scholar] [CrossRef]
37. Qi, B., Zhang, G., Yu, L. (2023). Blind image quality assessment based on deep residual regression network and image block pre-confidence. Journal of Southwest Normal University (Natural Science Edition), 4(7), 21–30 (In Chinese). [Google Scholar]
38. Zhou, N., Ouyang, X. (2021). Convolutional neural network development. Journal of Liaoning University of Science and Technology, 44(5), 349–356. https://doi.org/10.3778/j.issn.1673-9418.2008016 [Google Scholar] [CrossRef]
39. Lv, X., Zhang, S. Y., Song, Y. N., Wang, C. Z., Li, H. Q. et al. (2021). Convolutional neural network parameter learning based on deep learning. Journal of Bohai University (Natural Science Edition), 42(4), 369–375. [Google Scholar]
40. Zhang, J., Pang, J., Zhang, S. (2015). A lightweight dash insulator development and engineering application for the vehicle NVH improvement. SAE Technical Paper, USA. https://doi.org/10.4271/2015-01-2342 [Google Scholar] [CrossRef]
41. Tian, Y., Pang, J. (2022). An alternative algorithm for the symmetry classification of ordinary differential equations. Sound & Vibration, 56(1), 65–76. https://doi.org/10.32604/sv.2022.014547 [Google Scholar] [CrossRef]
42. Huang, H., Lim, T. C., Wu, J., Ding, W., Pang, J. (2023). Multitarget prediction and optimization of pure electric vehicle tire/road airborne noise sound quality based on a knowledge-and data-driven method. Mechanical Systems and Signal Processing, 197, 110361. https://doi.org/10.1016/J.YMSSP.2023.110361 [Google Scholar] [CrossRef]
43. Original Power Document (2019). Laboratory measurement of the airborne sound barrier performance of flat materials and assemblies. Southwest Jiaotong University Library, China. https://www.lib.swjtu.edu.cn/asset/detail/0/20513746950 [Google Scholar]
Cite This Article
 Copyright © 2024 The Author(s). Published by Tech Science Press.
This work is licensed under a Creative Commons Attribution 4.0 International License , which permits unrestricted use, distribution, and reproduction in any medium, provided the original work is properly cited.
 Downloads
 Citation Tools