
 Submit a Paper
 Propose a Special lssue
 Open Access
ARTICLE

Green Synthesis and Characterization of ZnS and ZnS@Ag2S Core–Shell Nanoparticles Using Mint Leaf Extract
Department of Physics, College of Science for Women, University of Baghdad, Baghdad, Iraq
* Corresponding Author: Nada K. Abbas. Email:
Chalcogenide Letters 2026, 23(3), 5 https://doi.org/10.32604/cl.2026.078934
Received 11 January 2026; Accepted 04 March 2026; Issue published 03 April 2026
 View Full Text
 Download PDF
Abstract
In this study, zinc sulfide nanoparticles (ZnS NPs) and zinc sulfide @ Silver sulfide core-shells (ZnS@Ag2S NPs) were prepared using the green method with mint leaf extract as a reducing and coating agent, at varying concentrations of silver nitrate (AgNO3) (0.005, 0.01, and 0.02 M). X-ray diffraction analysis (XRD) results showed the formation of a cubic phase of ZnS NPs and a monoclinic phase of Ag2S with increasing silver nitrate concentration. The average crystalline size of ZnS NPs was calculated to be 2.01 nm and (2.78, 2.65, and 2.13 nm) after Ag2S formation, while the shell (Ag2S) was found to be (7.47, 5.89, and 3.83 nm). Transmission Electron Microscopy (TEM) analysis revealed the formation of an Ag2S shell around ZnS, with the shell becoming more uniform at the silver nitrate concentration (0.01 M). Energy Dispersive X-Ray (EDX) analysis showed the presence of the core’s main elements, zinc and sulfur, and an increase in silver (Ag) content with increasing silver nitrate concentration in the core-shells. Fourier Transform Infrared Analysis (FTIR) results showed vibrational frequencies belonging to the organic compounds of the plant extract, in addition to the appearance of zinc-sulfur bonds and peaks between 450 and 900 cm−1 indicating S-Ag-related vibrations. Finally, UV-Visible results showed an improvement in UV absorption capacity with increasing silver nitrate concentration. The optical energy gap of ZnS NPs was approximately 3.77 eV, while it was 3.61, 3.72, and 3.74 eV for ZnS@Ag2S NPs at different concentrations of silver nitrate (0.005, 0.01, and 0.02 M), respectively.Keywords
Nanotechnology is one of the most prominent scientific fields, having experienced significant progress in recent decades [1,2]. It focuses on the study and synthesis of materials at the nanoscale, ranging from 1 to 100 nm [3]. Through this technology, we have been able to access new materials and properties that were not available in traditional materials, contributing to the development of a wide range of applications in fields such as electronics, medicine, renewable energy, and sensing [4]. One of the materials that has garnered significant attention in this context is zinc sulfide (ZnS) nanoparticles. ZnS is a promising material from the second and fifth groups of the periodic table, typically found in two structures: zinc blend and wurtzite, with direct energy gaps of 3.54 eV and 3.91 eV, respectively [5]. ZnS NPs exhibit distinct properties compared to their bulk counterparts due to their surface-to-volume ratio, these nanoparticles can be synthesized using a variety of physical and chemical methods, though some methods have certain limitations [6]. As a result, green synthesis methods are considered an environmentally friendly, simple, and cost-effective alternative [7]. ZnS NPs have been widely explored for diverse applications, including bioimaging [8], skin regeneration [9], dye degradation [10], catalysis [11], electronic devices [12], sensing and optoelectronic technologies [13]. Nanoparticle coating is a method used to enhance the optical and chemical properties of nanomaterials by adding an outer layer to the surface of the nanoparticles, the core-shell system is an innovative design where the core is made of a nanomaterial such as zinc sulfide, while the shell is made of another material such as silver sulfide (Ag2S) [14]. Silver sulfide contributes to enhanced stability and improved light absorption, making these particles more effective in photovoltaic applications such as solar cells and light-emitting devices [15,16].
This research aims to use a novel method for preparing zinc sulfide nanoparticles as a core, coating them with silver sulfide as a shell, using mint leaf extract as a reducing agent and coating the nanoparticles, and then studying their structural, morphological, and optical properties for suitable applications.
2.1 Materials Employed in the Preparation
Mint leaves purchased from local markets, Zinc nitrate Zn (No3)2·6H2O (HiMedia Laboratories Pvt. Ltd., India, 99–100%), Sodium sulfide Na2S·xH2O (Daryaganj, Delhi, India), Silver nitrate (CDH, India, 99.9%), Deionized water (DW) and ethanol (96%).
2.2 Preparation of Zinc Sulfide Nanoparticles
Zinc nitrate Zn (NO3)2·6H2O with (0.2 M) was dissolved in 50 mL of deionized water, then 30 mL of mint leaf extract was prepared by taking 10 g of dried leaves and adding 250 mL of DW to them was added dropwise to the solution. Then, sodium sulfide Na2S·XH2O at (0.2 M) dissolved in 50 mL of deionized water is added to the mixture with continuous stirring for one hour at room temperature. The resulting precipitate was separated by centrifugation at 4000 rpm for 30 min and then washed three times, twice with DW and once with ethanol for 30 min, and left to air dry overnight at room temperature.
2.3 Preparation of ZnS@Ag2S Core–Shell NPs
0.3 g of the previously prepared ZnS NPs were weighed and 20 mL of DW was added, followed by mixing using a magnetic stirrer for approximately 15 min. After that, 30 mL of mint leaf extract was added dropwise and then concentrations of silver nitrate (0.005, 0.01, 0.02) M dissolved in 50 mL of DW were added. The reaction was left with continuous stirring for an hour. The precipitate was separated and washed twice with DW and once with ethanol for 30 min. The precipitate was left to dry overnight at room temperature and the resulting precipitate was black. Fig. 1 shows the steps for preparing ZnS@Ag2S.
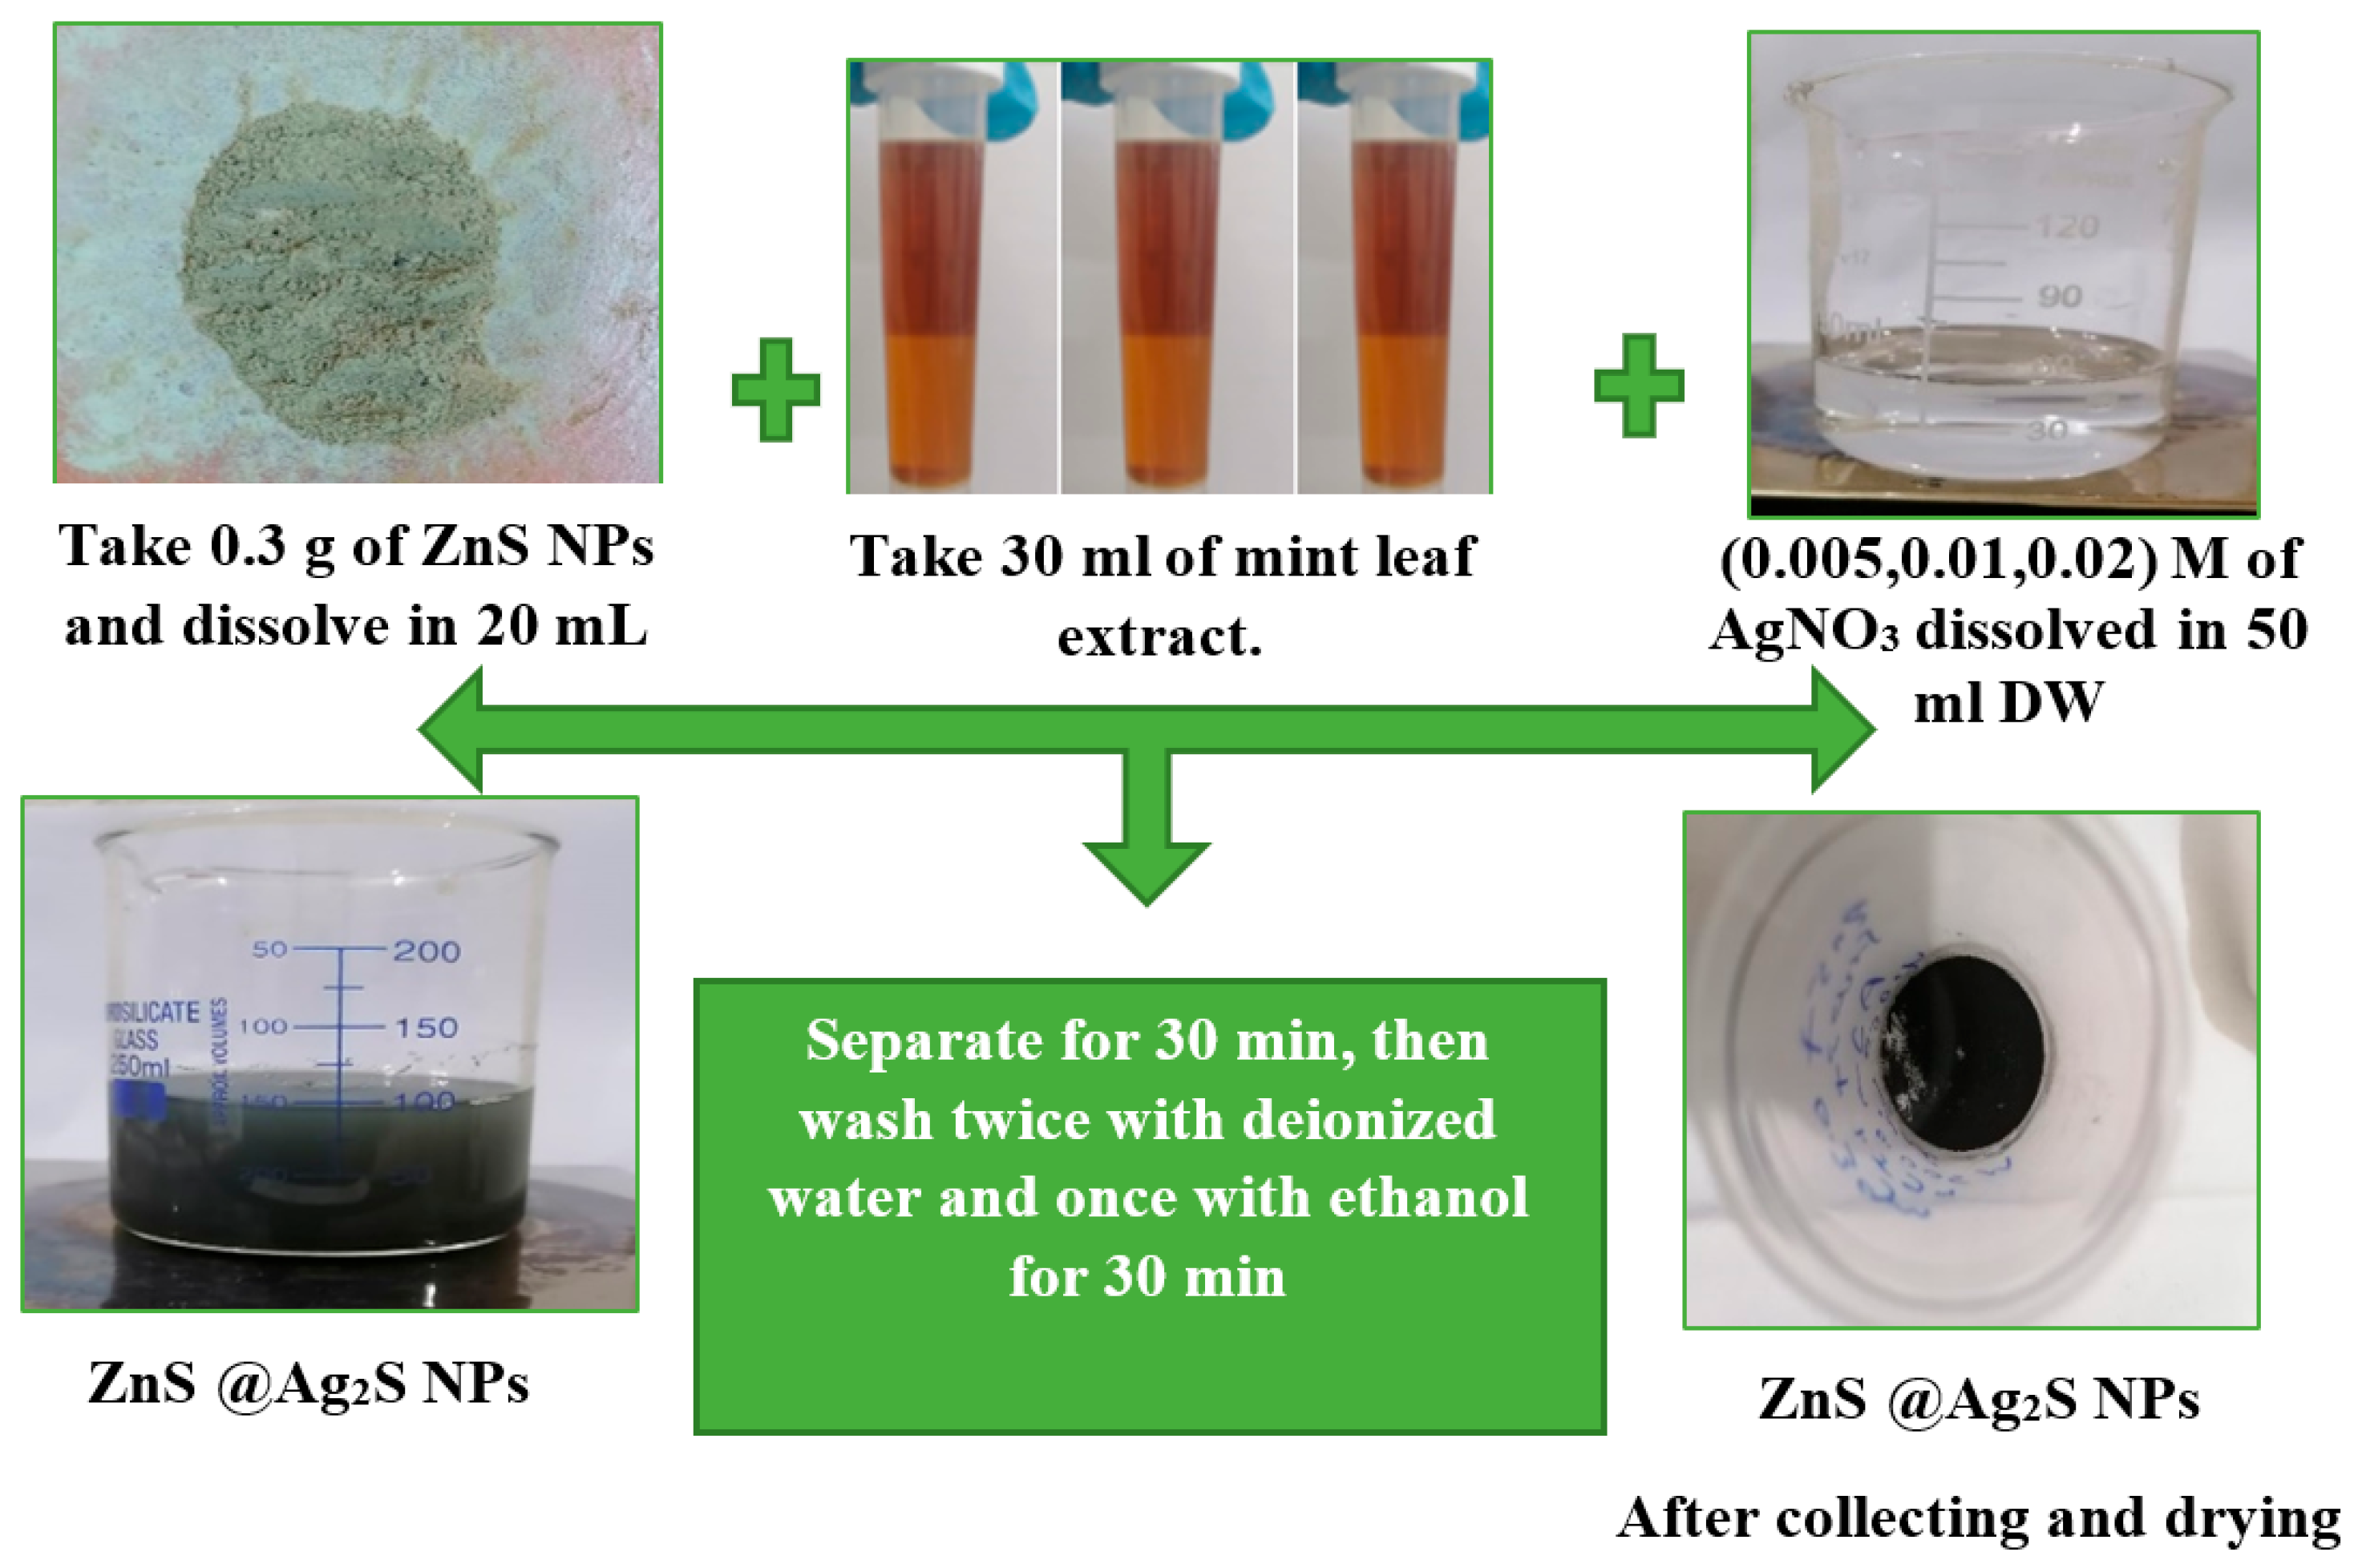
Figure 1: The steps for preparing ZnS@Ag2S core–shell NPs using the green method.
2.4 Characterization Techniques
XRD pattern of ZnS NPs and ZnS@Ag2S NPs were recorded using an Aeris Research Edition X-ray diffractometer (Malvern Panalytical) equipped with Cu Kα (λ = 0.154 nm) radiation. The instrument provides a high angular resolution of less than 0.04° (2θ), enabling accurate phase identification and crystallite size estimation. The particles morphology was examined by (TEM) PHILIPS, CM120, The Netherland. EDX analysis was performed using a Thermo Scientific™ Axia™ ChemiSEM (Thermo Fisher Scientific) to examine the elemental composition of the synthesized nanoparticles. The properties related to the functional groups on the surface in addition to the chemical bonds of the basic elements have been examined by FTIR analysis (Perkin Elmer TWO, USA), the spectra have been scanned in range (4000–400 cm−1) at resolution (0.5 cm−1). The optical absorbance spectrum was measured using a Shimadzu UV-1800 spectrophotometer (the wavelength ranging from 190–1100 nm). In addition, the particle size distribution was determined from TEM micrographs by measuring the diameter of 20 individual nanoparticles using ImageJ software.
3.1 X-Ray Diffraction Analysis for ZnS NPs and ZnS@Ag2S NPs Prepared Using Mint Leaf Extract
XRD analysis was performed to analyze the crystal structure and phase purity of ZnS NPs and ZnS@Ag2S NPs which were prepared using mint leaf extract with different concentrations of silver nitrate (0.005, 0.01, and 0.02 M), as shown in Fig. 2. The XRD results showed the ZnS NPs exhibited a cubic phase and polycrystalline nature with peaks at 2θ = 29.16° (hkl = 111), 2θ = 48.02° (hkl = 220), and 2θ = 56.92° (hkl = 311), correspond to JCPDS card (5-566) [17]. While XRD results for ZnS@Ag2S NPs showed that the cubic phase of ZnS NPs appeared at 2θ = 29.3014° (hkl = 111), 2θ = 48.3094° (hkl = 220), and 2θ = 57.0874° (hkl = 311) at a concentration of 0.005 M, and at 2θ = 29.2794° (hkl = 111), 2θ = 48.3094° (hkl = 220), and 2θ = 57.0874° (hkl = 311), at a concentration of 0.01 M, and at 2θ = 28.5314° (hkl = 111), 2θ = 47.3194° (hkl = 220), and 2θ = 56.2294° (hkl = 311), at a concentration of 0.02 M, while peaks appeared at 2θ = 34.7684° (hkl = 022) and 2θ = 37.4524° (hkl = 103), reverts to Ag2S in the monoclinic phase, but with low intensity at a concentration of 0.005 M [18]. As the silver nitrate concentration increased to 0.01 M and 0.02 M, an increase in the intensity of the monoclinic peaks was observed, along with the appearance of new peaks for Ag2S at 2θ = 40.4664° (hkl = 031), and 2θ = 44.0634° (hkl = 103) for 0.01 M and 2θ = 40.2244° (hkl = 031), and 2θ = 43.0954° (hkl = 122) for 0.02 M, correspond to JCPDS card (14-0072) [19]. These changes indicate that increasing the silver nitrate concentration contributed to improved crystallization and enhanced silver sulfide formation in the monoclinic phase, which is in agreement with [20].
Also, the average crystalline size was calculated using Scherrer’s equation Eq. (1) [21,22], where it was found for ZnS NPs 2.01 nm. However, after the formation of Ag2S NPs at a shell, an increase in the crystal size of the ZnS was observed, reaching to (2.78, 2.65, and 2.13 nm) for the concentration of silver nitrate (0.005, 0.01, and 0.02 M), respectively. The change in ZnS nanocrystal size during the formation of ZnS@Ag2S NPs is attributed to the structural interaction between the two phases and the differential crystal structures of the two phases, leading to lattice mismatch and the generation of crystallographic stress at the interface [23]. As for the Ag2S, it was observed that the average crystal size decreases with increasing concentration of silver nitrate, where it was (7.47, 5.89, and 3.83 nm) for (0.005, 0.01 and 0.02 M), respectively, this decrease is may be due to the rapid reaction between silver ions (Ag+) and sulfur ions (S2−) which leads to rapid saturation of the ZnS surface with Ag2S, thus reducing the opportunity for crystal growth in the shell [24]. Furthermore, the change in the values of the interfacial distances (dhkl) indicates the occurrence of internal network distortions resulting from the strong interaction between the two phases [25]. Table 1 shows the structural parameters of ZnS NPs and ZnS@Ag2S core–shell NPs.
D = K λ/β cosθ(1)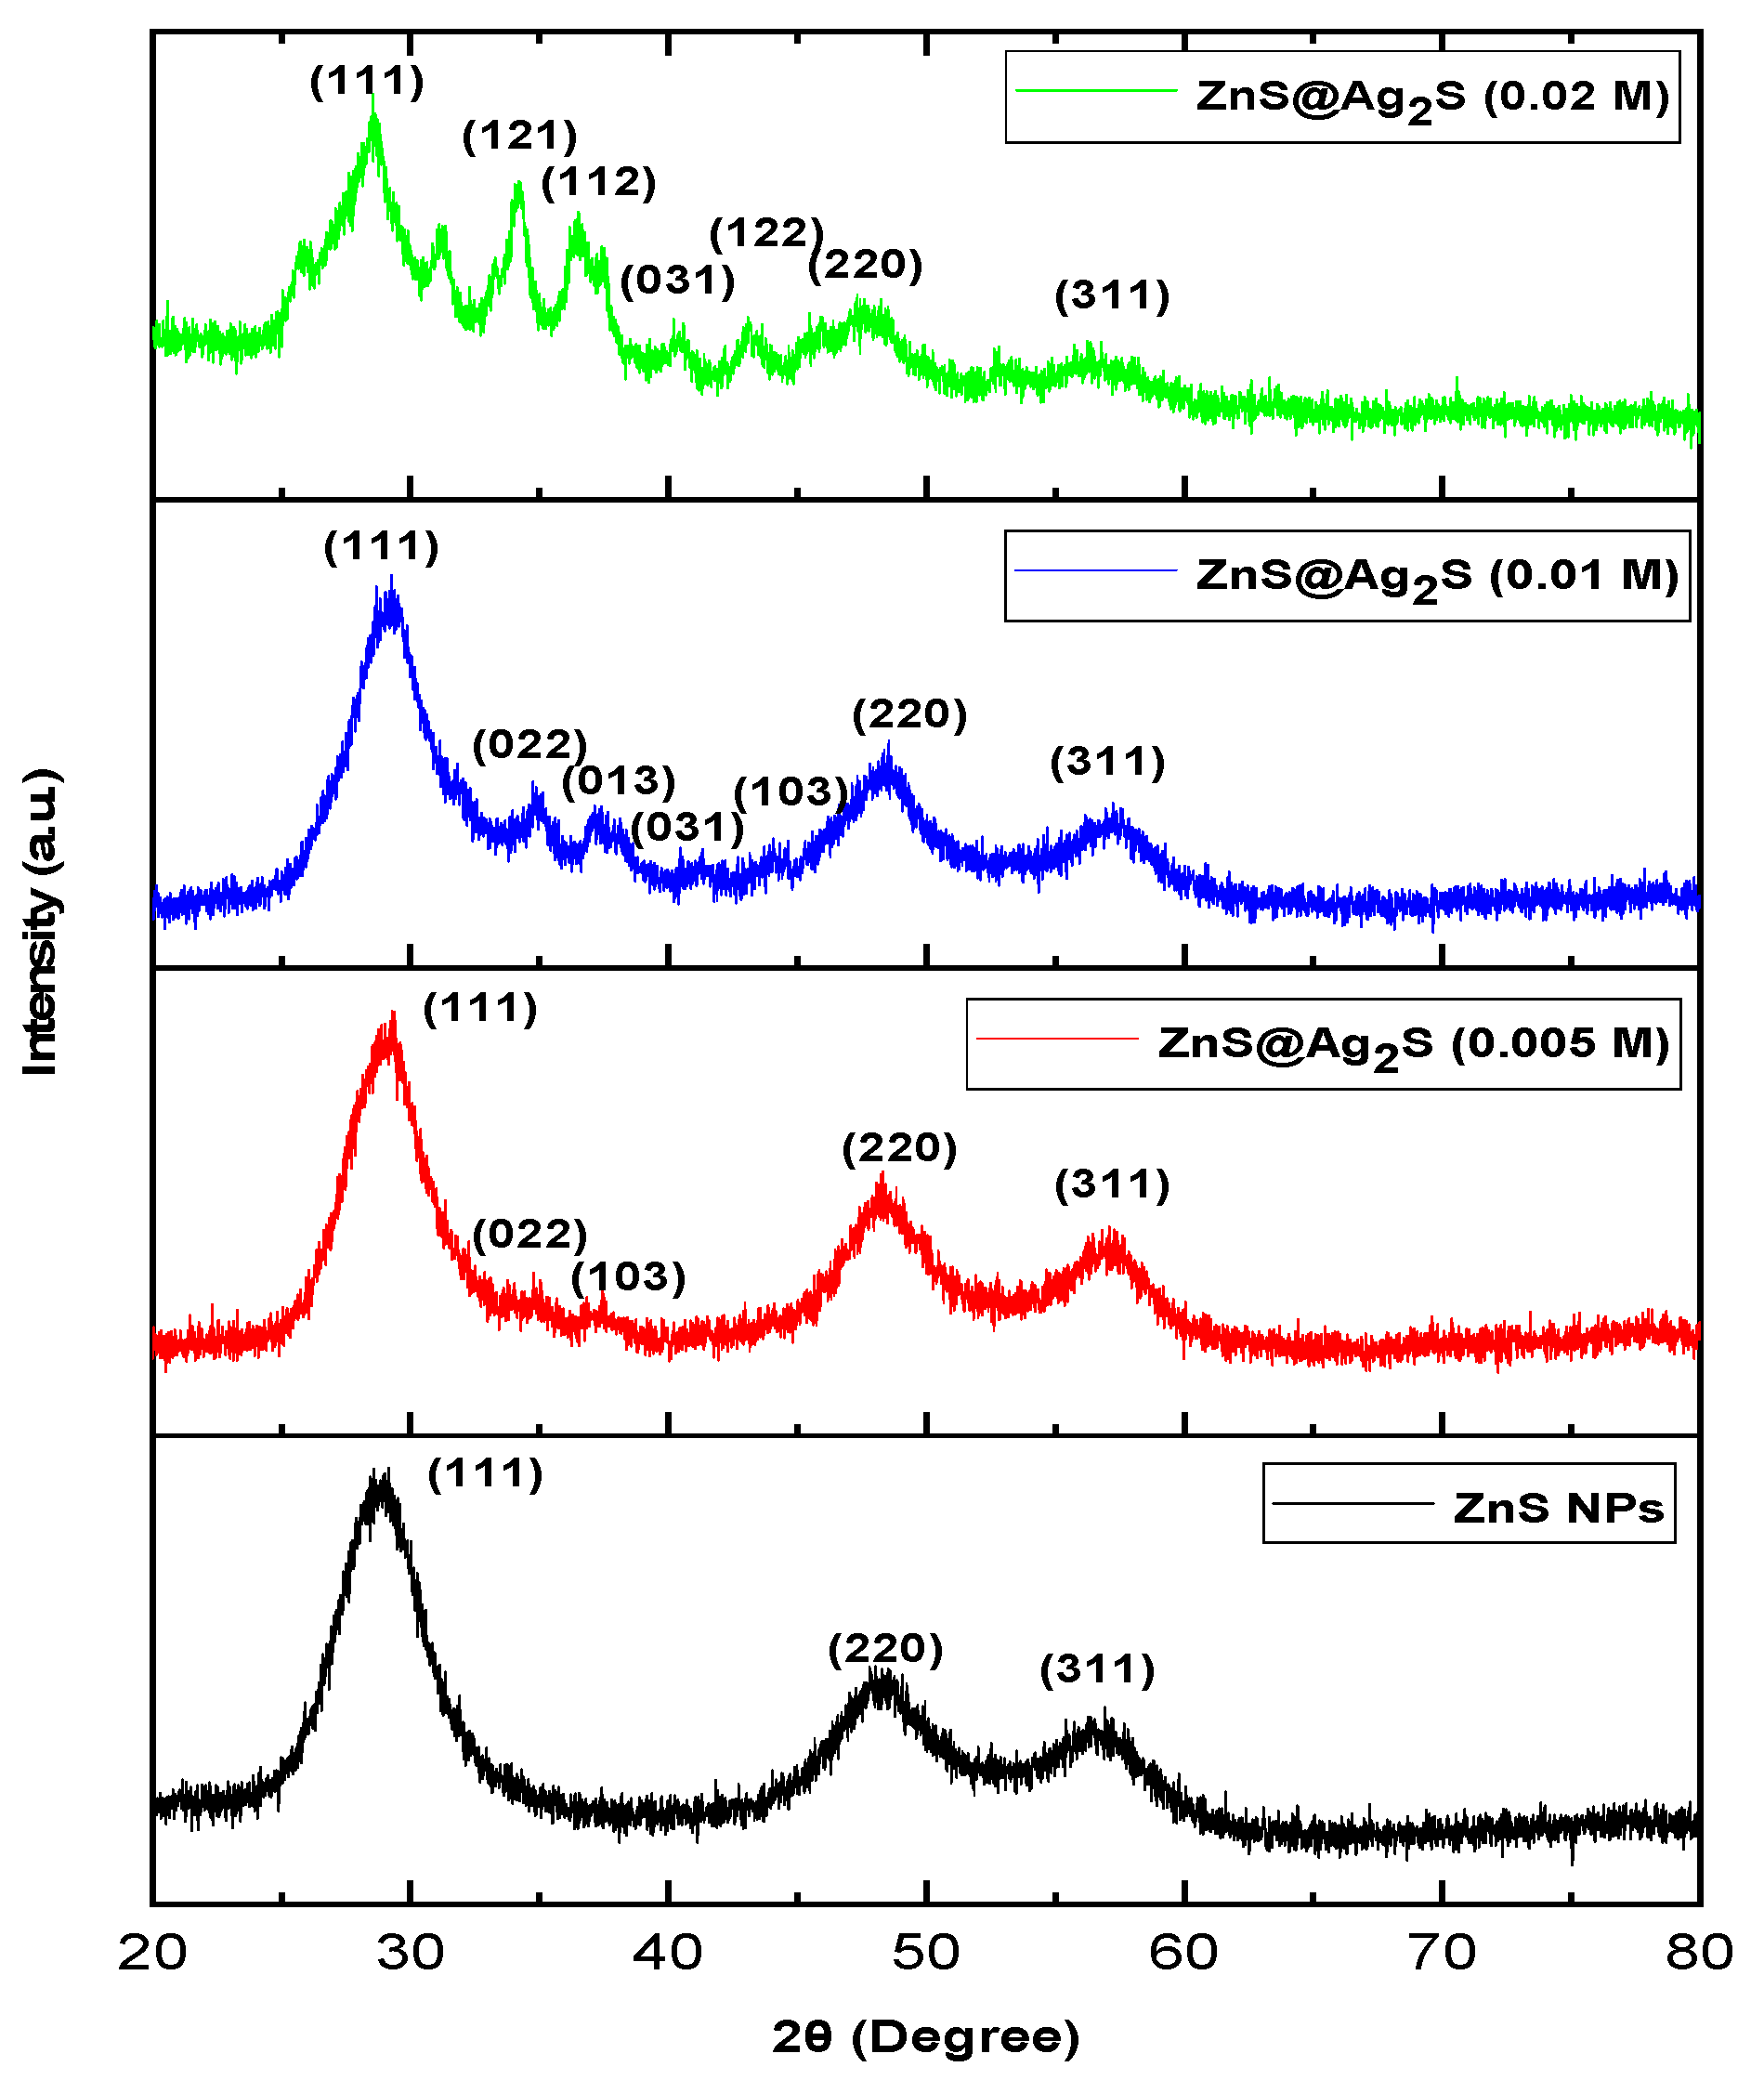
Figure 2: Represent to XRD pattern of ZnS NPs and ZnS@Ag2S NPs with different concentrations of AgNO3 (0.005, 0.01, and 0.02 M).
Table 1: The structural parameters of ZnS NPs and ZnS@Ag2S core–shell NPs with varying concentrations of AgNO3 (0.005, 0.01 and 0.02) M.
| Samples | 2θ (Deg.) | FWHM (Deg.) | dhkl Exp. (Å) | C.S (nm) | hkl | Phase |
|---|---|---|---|---|---|---|
| ZnS NPs | 29.1644 | 4.03072 | 3.0596 | 2.04 | (111) | Cub. ZnS |
| 48.0184 | 4.44872 | 1.8932 | 1.96 | (220) | Cub. ZnS | |
| 56.9174 | 4.40746 | 1.6165 | 2.05 | (311) | Cub. ZnS | |
| ZnS @ Ag2S 0.005 M | 29.3014 | 3.35875 | 3.0456 | 2.45 | (111) | Cub. ZnS |
| 48.3094 | 3.39219 | 1.8824 | 2.57 | (220) | Cub. ZnS | |
| 57.0874 | 2.68195 | 1.6121 | 3.37 | (311) | Cub. ZnS | |
| 34.7684 | 1.03906 | 2.5782 | 8.02 | (022) | Monoclinic Ag2S | |
| 37.4524 | 1.21197 | 2.3993 | 6.92 | (103) | Monoclinic Ag2S | |
| ZnS @ Ag2S 0.01 M | 29.2794 | 3.30484 | 3.0478 | 2.49 | (111) | Cub. ZnS |
| 48.5404 | 3.0884 | 1.8740 | 2.82 | (220) | Cub. ZnS | |
| 57.2304 | 3.41762 | 1.6084 | 2.65 | (311) | Cub. ZnS | |
| 34.7574 | 1.82362 | 2.5790 | 4.57 | (022) | Monoclinic Ag2S | |
| 37.1334 | 1.95158 | 2.4192 | 4.30 | (013) | Monoclinic Ag2S | |
| 40.4664 | 1.36095 | 2.2273 | 6.22 | (031) | Monoclinic Ag2S | |
| 44.0634 | 1.00959 | 2.0535 | 8.49 | (103) | Monoclinic Ag2S | |
| ZnS @ Ag2S 0.02 M | 28.5314 | 3.62136 | 3.1260 | 2.26 | (111) | Cub. ZnS |
| 47.3194 | 4.8451 | 1.9195 | 1.79 | (220) | Cub. ZnS | |
| 56.2294 | 3.83554 | 1.6346 | 2.35 | (311) | Cub. ZnS | |
| 34.2074 | 2.05125 | 2.6192 | 4.05 | (121) | Monoclinic Ag2S | |
| 36.5284 | 2.43698 | 2.4579 | 3.43 | (112) | Monoclinic Ag2S | |
| 40.2244 | 1.89186 | 2.2402 | 4.47 | (031) | Monoclinic Ag2S | |
| 43.0954 | 2.52866 | 2.0973 | 3.38 | (122) | Monoclinic Ag2S |
3.2 Transmission Electron Microscopy (TEM) Studies for ZnS NPs and ZnS@Ag2S NPs (Core/Shell)
Fig. 3 shows TEM images for ZnS NPs and ZnS@Ag2S NPs, with different concentrations of silver nitrate (0.005, 0.01, and 0.02 M), the image (A) shows clusters of ZnS NPs, lacking any silver sulfide layer [26]. However, when different concentrations of silver nitrate were added to ZnS NPs, a core and shell were observed around it, as shown in the images (B, C, and D). The image B (at 0.005 M) shows a combination of the core and shell, but it is less regular and homogeneous compared to image C (at 0.01 M), which shows a more regular and homogeneous arrangement of spherical particles. While, the image D (at 0.02 M) shows clusters of the core that are less homogeneous and surrounded by a regular shell, this is an agreement with [27]. Also, Fig. 4 shows the particle size distribution histograms, revealing that the homogeneity of the nanoparticles is clearly dependent on the silver nitrate concentration. ZnS NPs (A) exhibited a relatively narrow distribution within 10–20 nm, with the highest frequency in the 10–12 nm range. Upon incorporation of Ag2S as shell (0.005 M), (B) the distribution shifted toward larger sizes (10–35 nm) with a dominant frequency around 15–20 nm, indicating enhanced growth. At higher concentrations (0.01 M and 0.02 M, C and D), the distributions became comparatively narrower (10–22 nm and 6–22 nm, respectively), with the highest frequency centered near 16–18 nm and 12–14 nm. These results demonstrate a concentration-dependent modulation of particle size and frequency, confirming that Ag2S content significantly influences the nucleation–growth mechanism of the nanostructures.
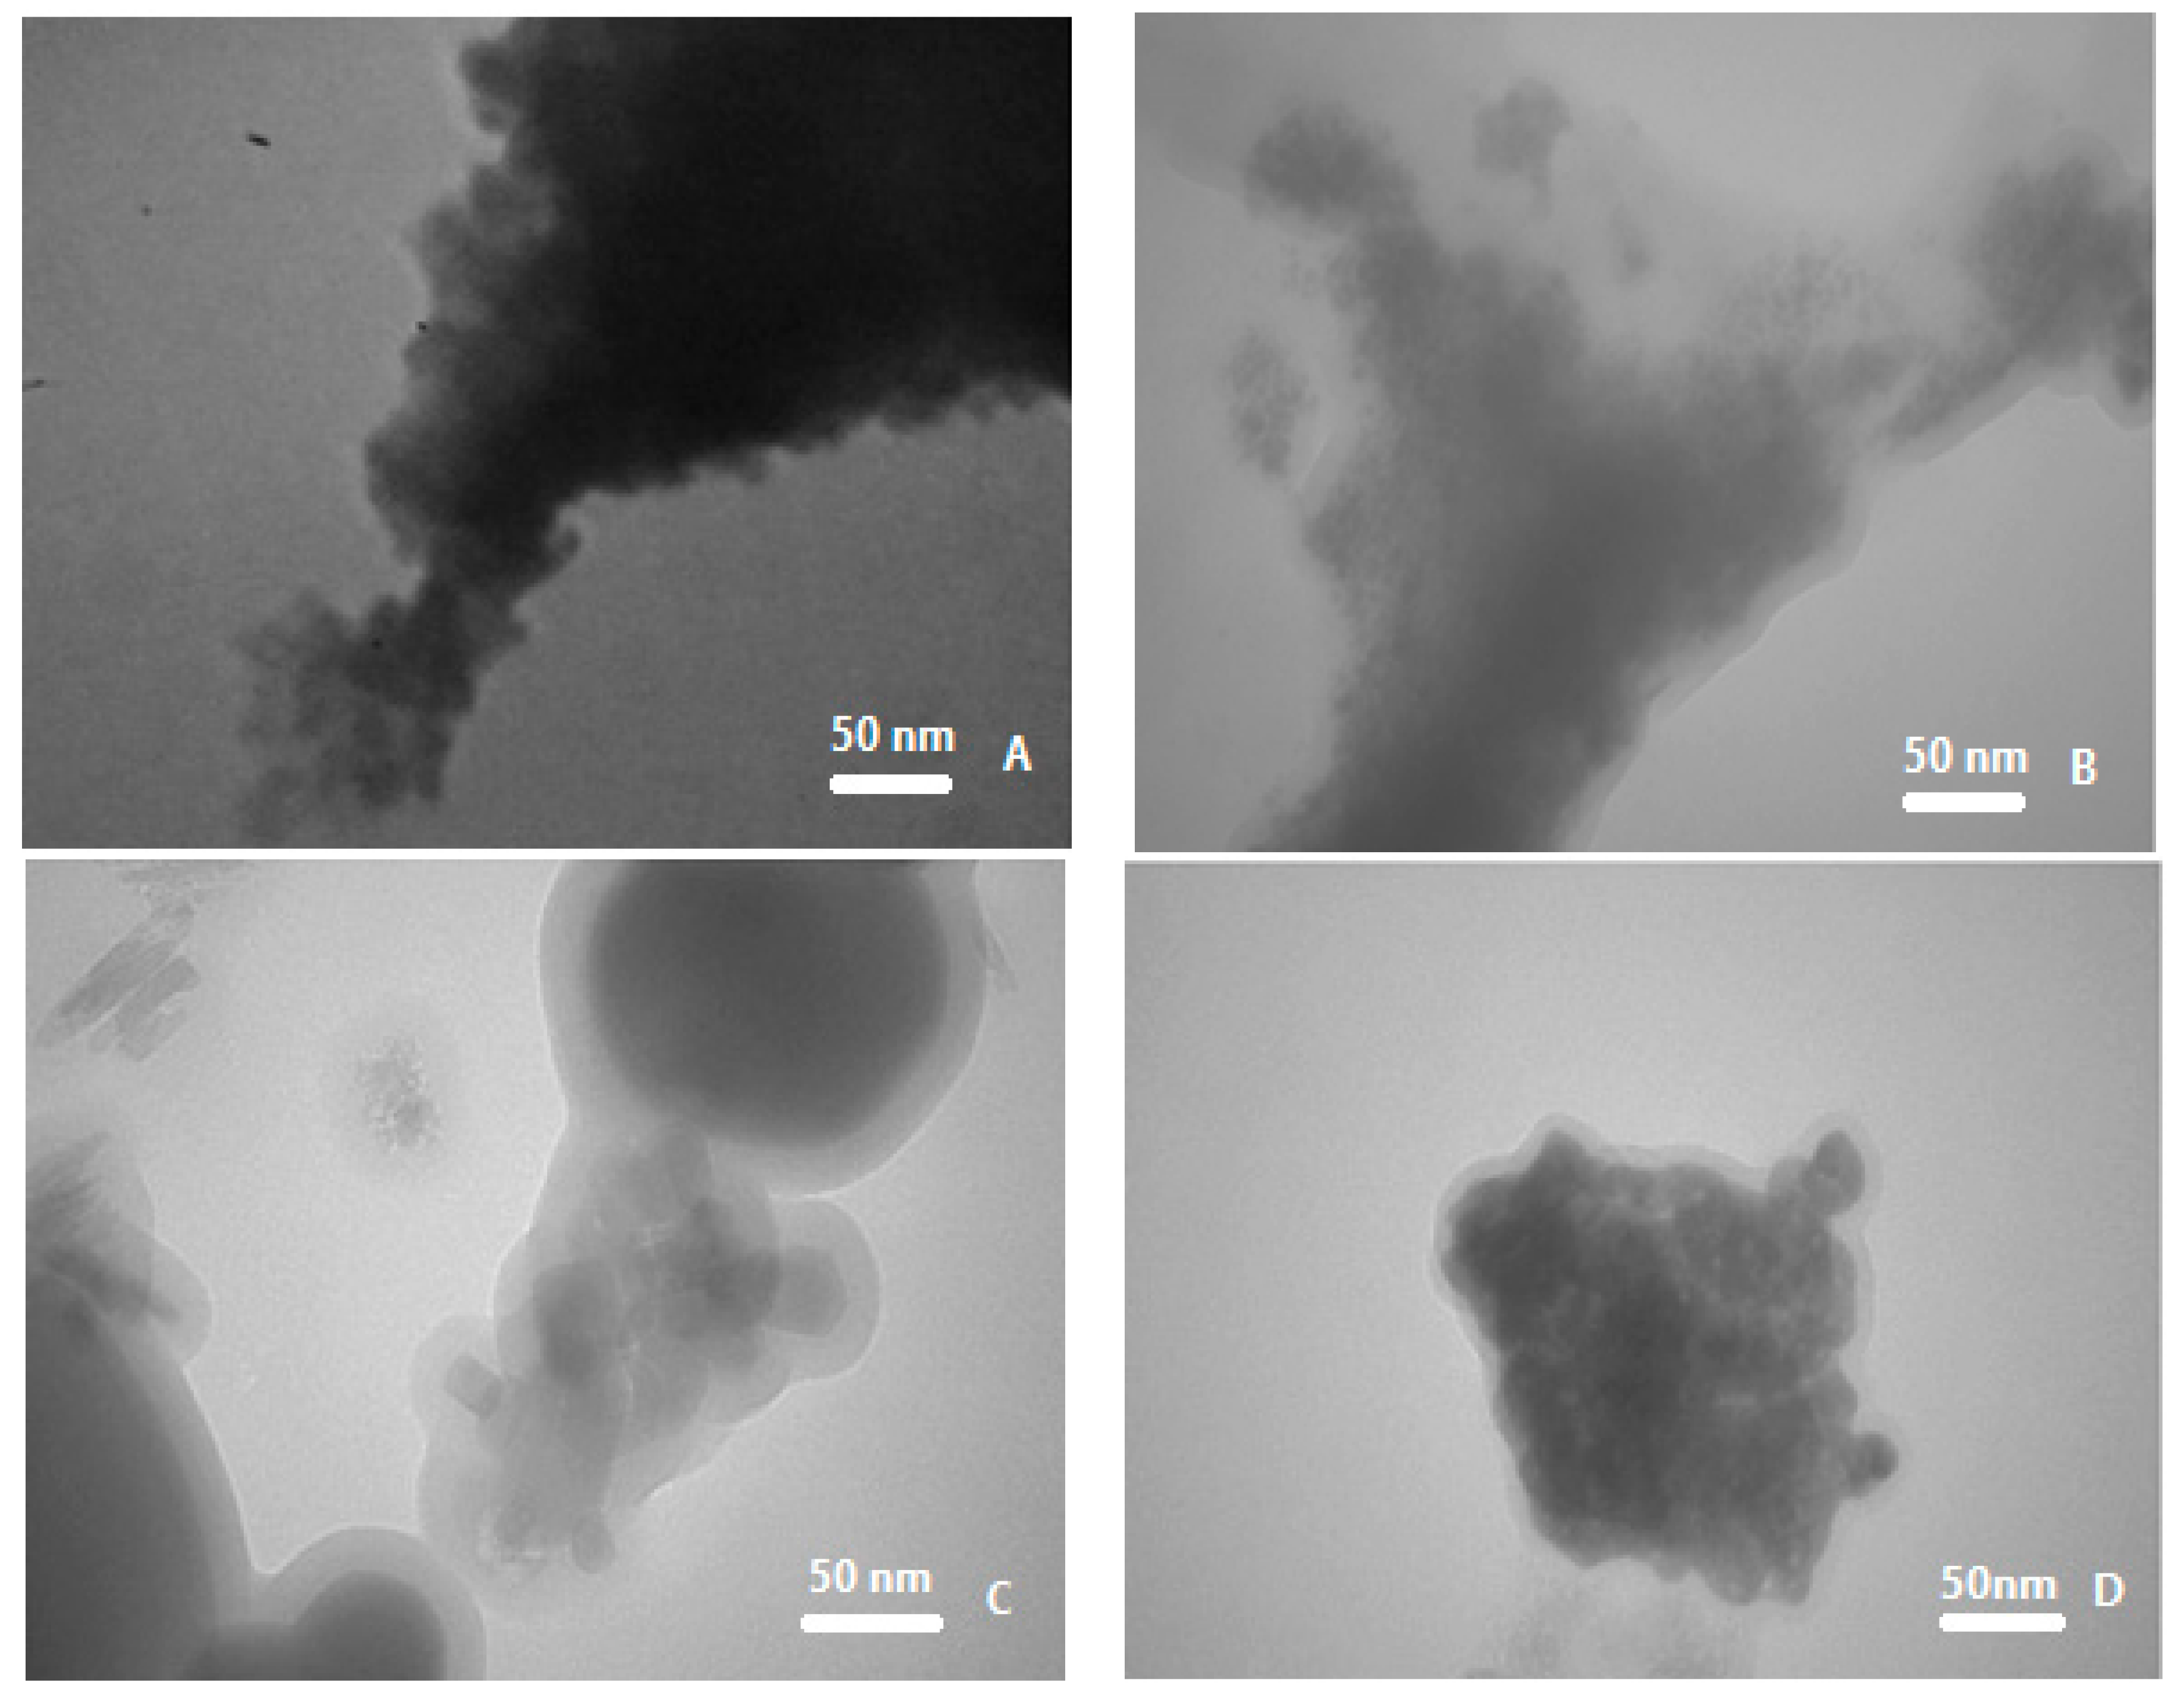
Figure 3: TEM images for (A) ZnS NPs, (B) ZnS@Ag2S NPs (0.005 M), (C) ZnS@Ag2S NPs (0.01 M), (D) ZnS@Ag2S NPs (0.02 M).
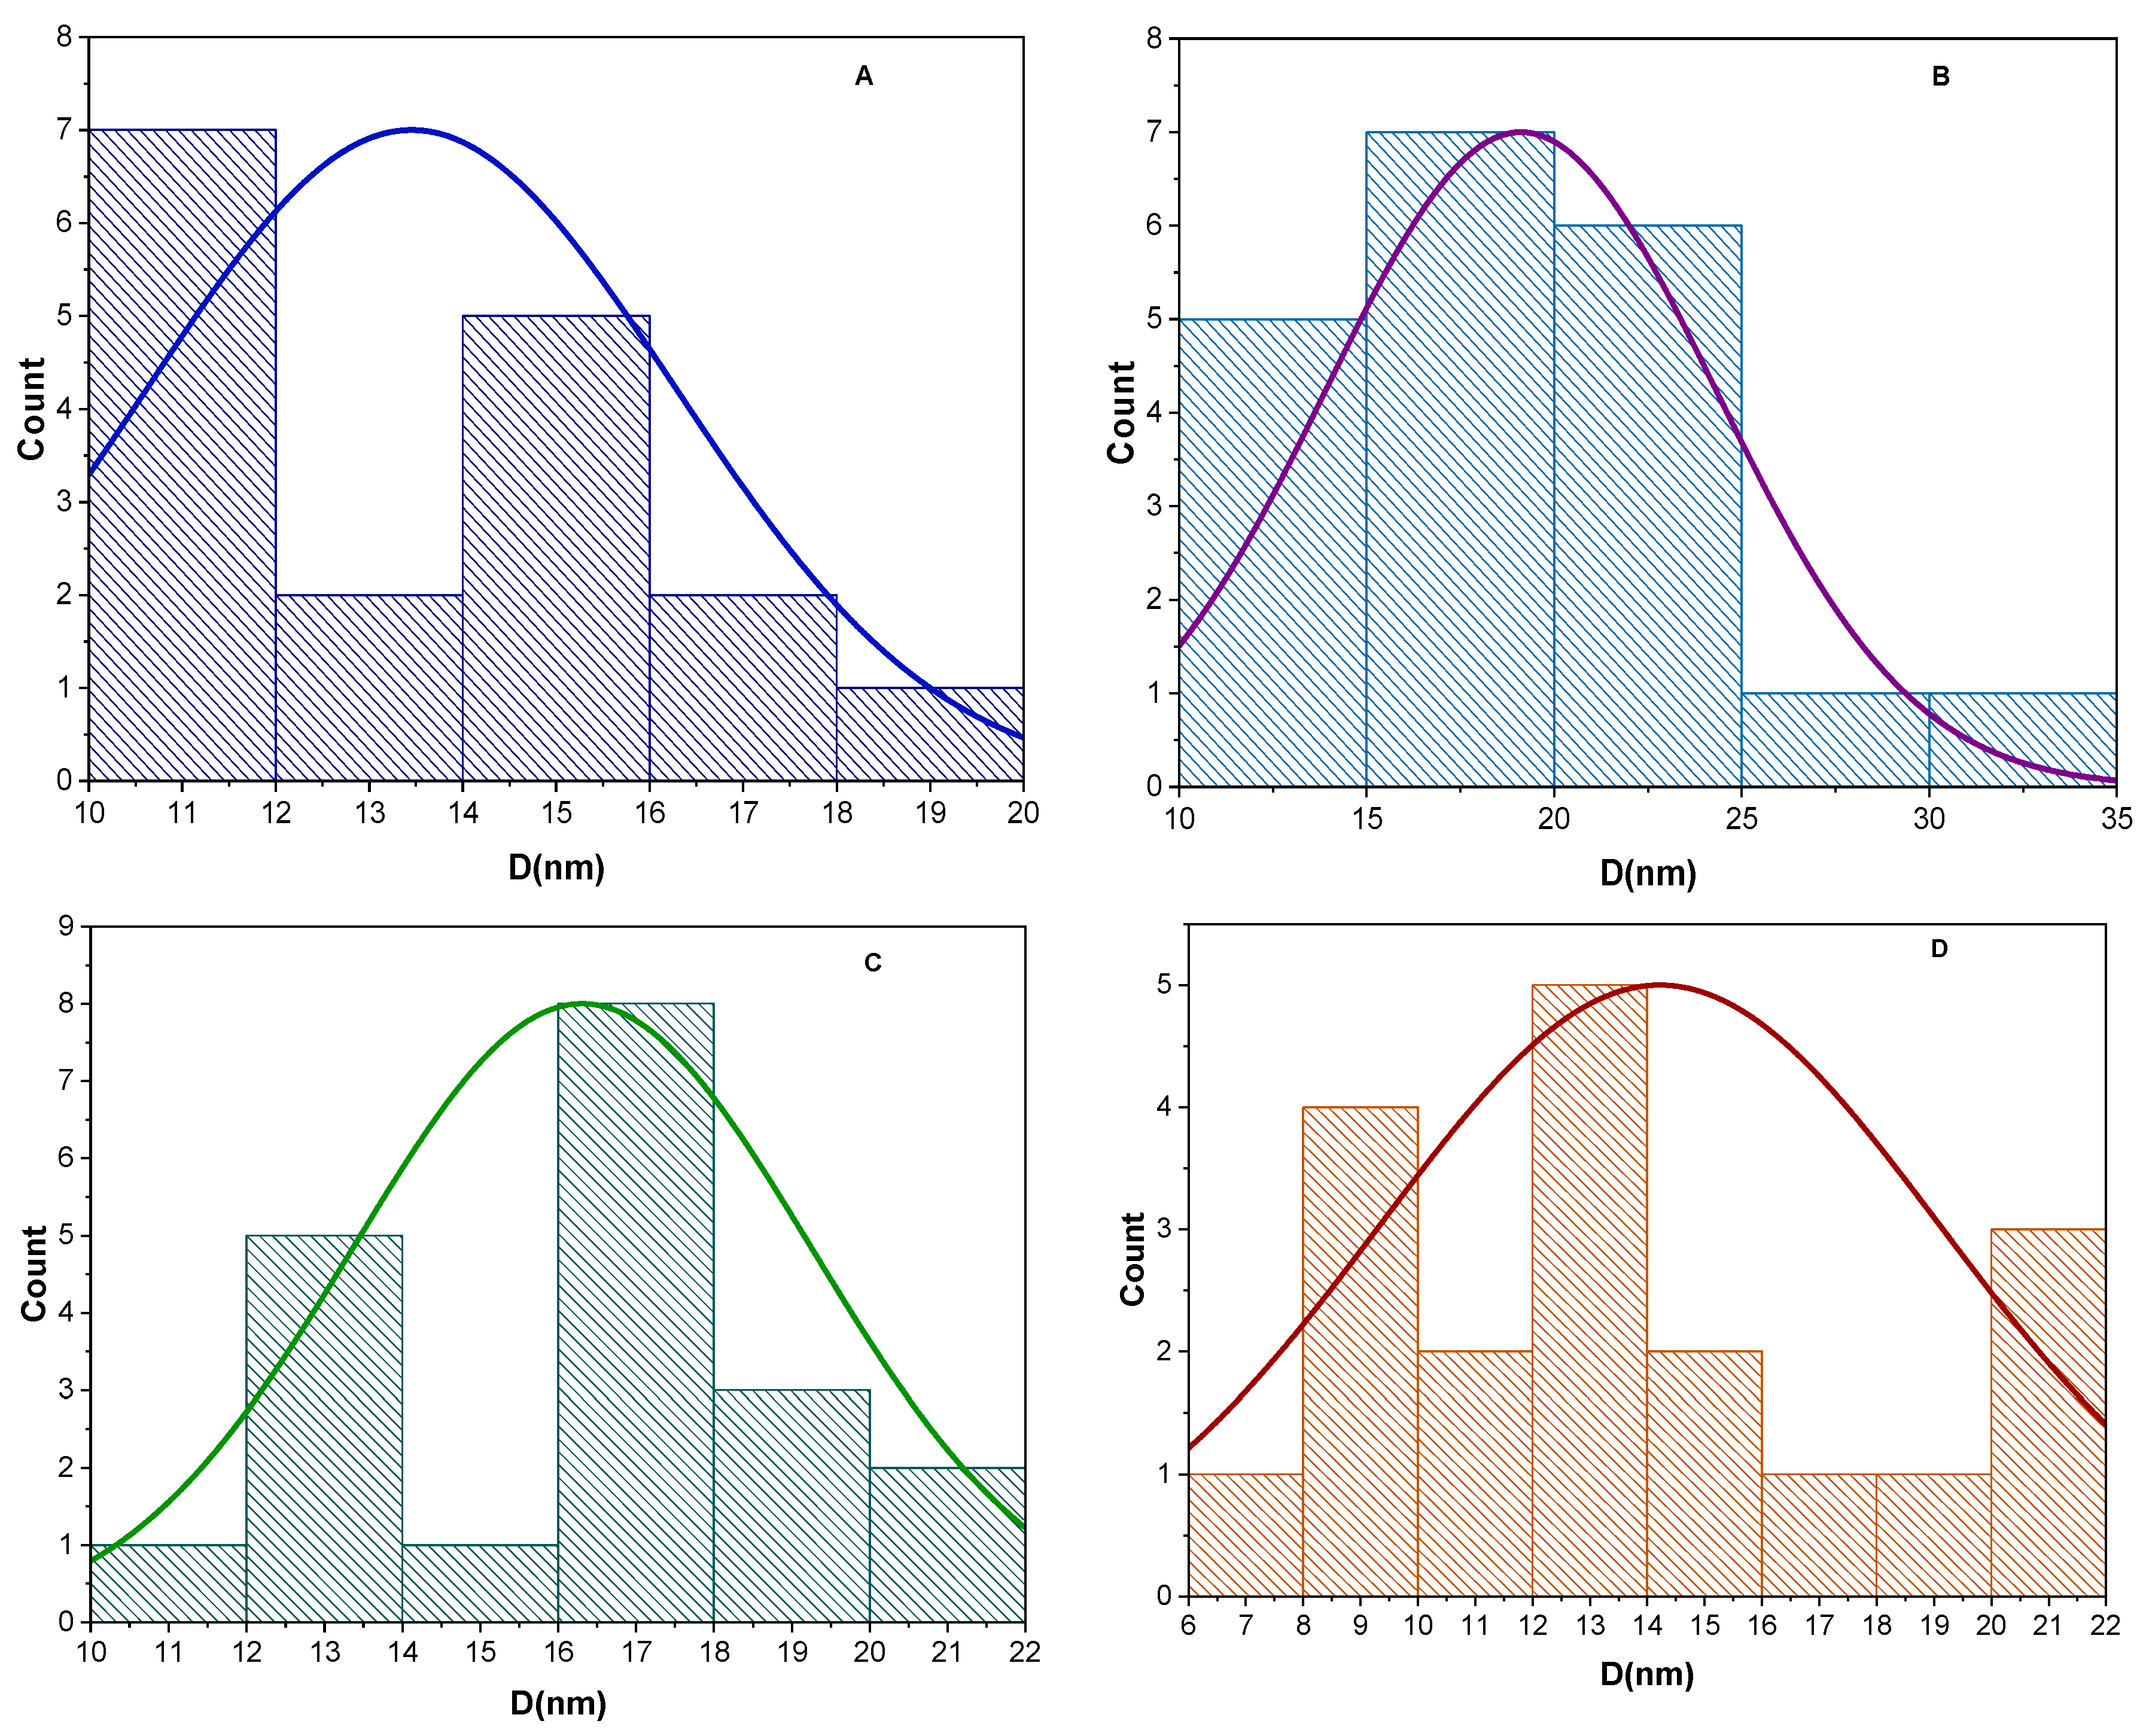
Figure 4: Particle size distribution histograms for (A) ZnS NPs, (B) ZnS@Ag2S NPs (0.005 M), (C) ZnS@Ag2S NPs (0.01 M), (D) ZnS@Ag2S NPs (0.02 M).
3.3 Energy Dispersive X-Ray (EDX) Analysis for ZnS NPs and ZnS@Ag2S NPs (Core/Shell)
In EDX analysis of ZnS NPs and ZnS@Ag2S NPs with AgNO3 (0.005, 0.01, and 0.02 M), as shown in Fig. 5, the primary elements in ZnS NPs (A) were found to be (Zn) and (S) [28]. Also, carbon (C), and oxygen (O) were present which attributed to the components of the mint leaf extract used in the preparation, in addition to the apparent Na content originates from the overlap between Na Kα and Zn L lines or may be indicate the actual presence of Na, this is in agreement with Senapati et al. [29]. While, in ZnS@Ag2S NPs (B–D) at different concentrations of silver nitrate, the results showed that zinc (Zn) and sulfur (S) remained balanced within the core/shell structure, in addition to the continued presence of oxygen and carbon in the composition, this indicates the ongoing influence of the organic extract [30]. As the concentration of silver nitrate increased from 0.005 to 0.02 M, a significant increase in the silver (Ag) content was observed, reaching 35.1% by weight and 12.6% by atomic ratio. These changes reflect the formation of silver sulfide (Ag2S) around the zinc sulfide (ZnS) [31]. The weight and atomic ratios of the elements for ZnS and ZnS@Ag2S NPs are shown in Table 2.
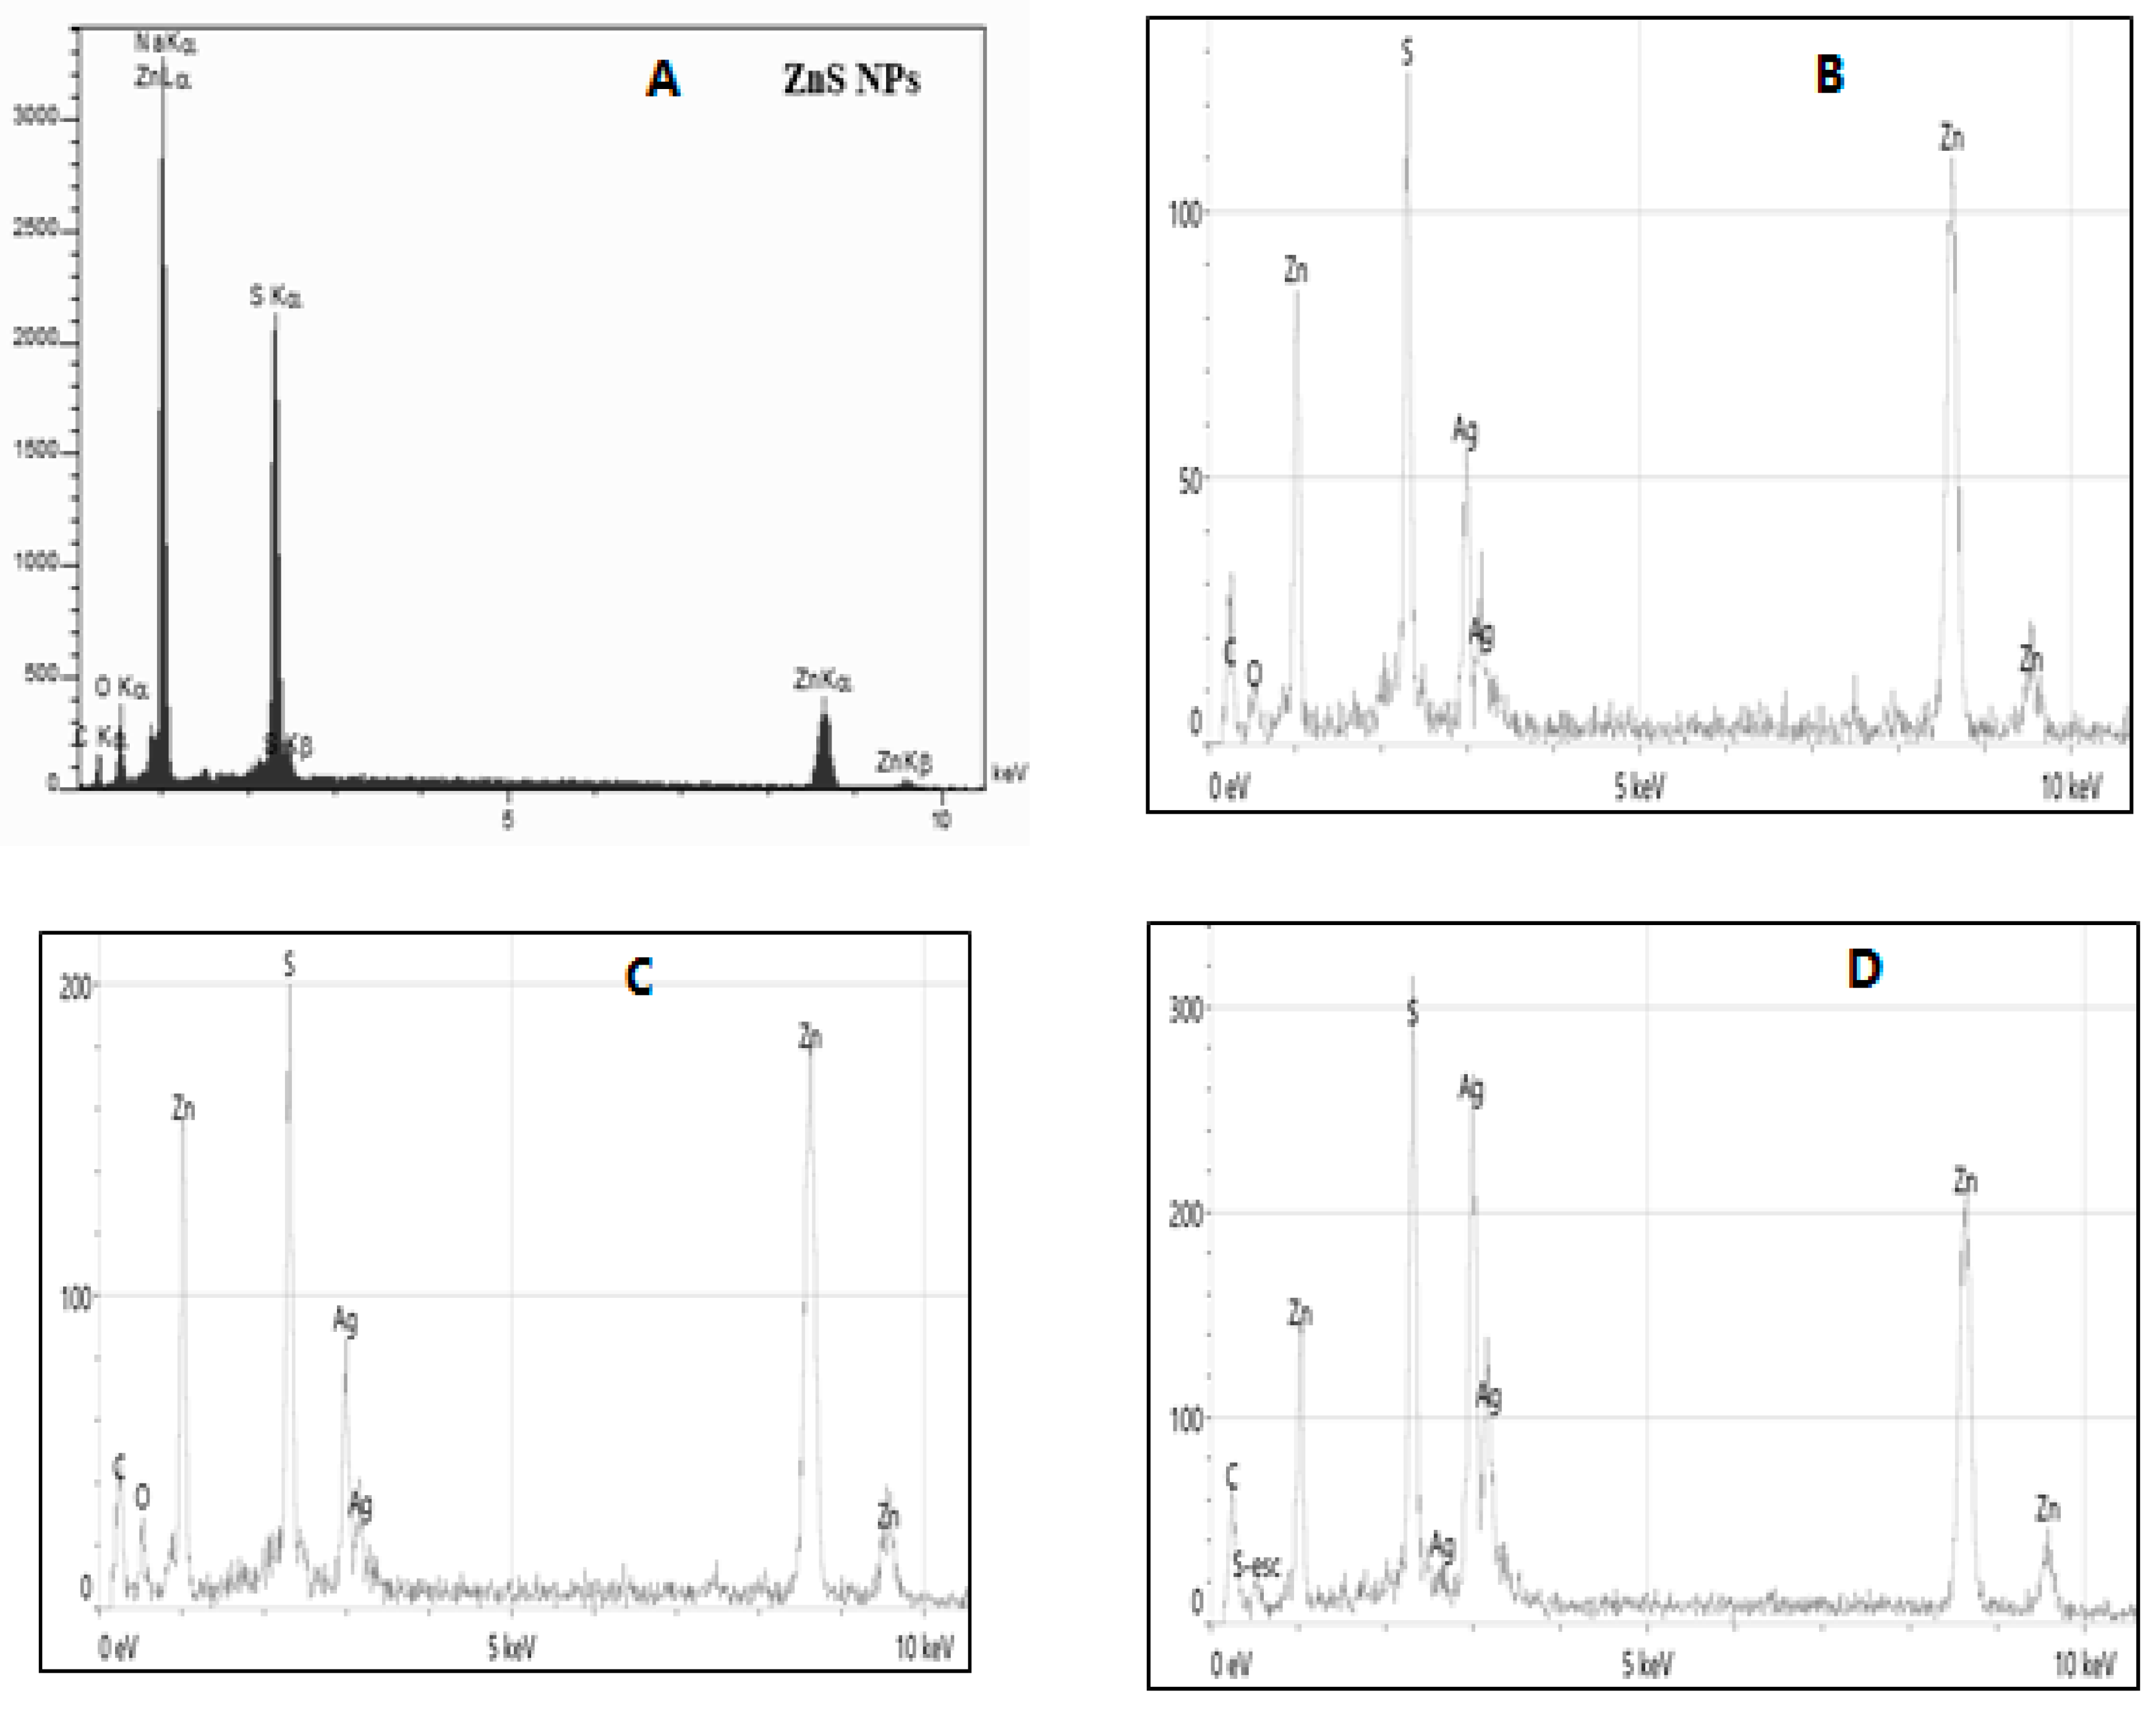
Figure 5: EDX analysis for for (A) ZnS NPs, (B) ZnS@Ag2S NPs (0.005 M), (C) ZnS@Ag2S NPs (0.01 M), (D) ZnS@Ag2S NPs (0.02 M).
Table 2: The weight and atomic ratios of the elements for ZnS and ZnS@Ag2S NPs with different concentrations of AgNO3.
| Samples | Elements | Weight % | Atomic % |
|---|---|---|---|
| ZnS NPs | C | 15.40 | 35.51 |
| Na | 16.28 | 19.61 | |
| O | 7.64 | 13.22 | |
| S | 13.54 | 11.69 | |
| Zn | 47.14 | 19.97 | |
| ZnS @ Ag2S 0.005 M | C | 18.0 | 47.9 |
| O | 5.1 | 10.2 | |
| S | 13.9 | 13.9 | |
| Zn | 48.1 | 23.5 | |
| Ag | 14.9 | 4.4 | |
| ZnS @ Ag2S 0.01 M | C | 17.1 | 45.8 |
| O | 6.5 | 13.2 | |
| S | 12.5 | 12.5 | |
| Zn | 48.7 | 24.0 | |
| Ag | 15.2 | 4.6 | |
| ZnS @ Ag2S 0.02 M | C | 15.3 | 49.5 |
| S | 13.7 | 16.6 | |
| Zn | 35.9 | 21.3 | |
| Ag | 35.1 | 12.6 |
3.4 Fourier Transform Infrared Analysis (FTIR) for ZnS NPs and ZnS@Ag2S NPs Core/Shell
The FTIR results of ZnS NPs and ZnS@Ag2S NPs, prepared using mint leaf extract at different concentrations of silver nitrate (0.005, 0.01, and 0.02 M) were analyzed, are shown in Fig. 6. The vibrational frequencies at the peaks 3413.94 cm−1, 3426.12 cm−1, 3435.98 cm−1, and 3426.26 cm−1 for ZnS NPs and ZnS@Ag2S NPs, respectively indicate to stretching vibrations of the hydroxyl (O-H) groups present in menthol and other polyphenolic compounds from the mint extract, which acting as reducing and stabilizing agents for the nanoparticles, as well as contributing to controlling their growth and preventing agglomeration [32]. Vibrational frequencies at (2924.47 cm−1, 2924.97 cm−1, 2925.13 cm−1 and 2924.70 cm−1), (2853.95 cm−1, 2854.28 cm−1, 2854.42 cm−1, and 2854.03 cm−1), for ZnS and ZnS@Ag2S NPs, respectively indicate to stretching vibrations of C-H bonds in hydrocarbon compounds, reflecting the chemical composition of organic compounds in the extract [33]. Also, the frequencies at (1384.73 cm−1, 1384.90 cm−1, 1384.94 cm−1, and 1384.93 cm−1) for ZnS and ZnS@Ag2S NPs, respectively and 1464.92, 1465.48, and 1465.82 cm−1 for ZnS@Ag2S NPs indicate the bending vibrations of C–H groups in saturated hydrocarbons, particularly the methyl (CH3) and methylene (CH2) groups found in alkanes, the presence of these frequencies is indicative of the presence of organic compounds such as menthol and other terpenes found in mint leaf extract [34]. The frequencies at 1607.26 cm−1, 1630.99 cm−1, 1631.47 cm−1 and 1631.18 cm−1 for ZnS and ZnS@Ag2S NPs, respectively indicate C=C stretching vibrations in aromatic compounds such as phenols or menthol [17]. The frequencies at 1263.83 cm−1, 1263.27 cm−1, 1269.36 cm−1, and 1269.05 cm−1 for ZnS and ZnS@Ag2S NPs, respectively refer to C-O stretching vibrations of alcohol and phenolic groups originating from menthol in the mint extract [35]. Also, the frequencies at 1114.75 cm−1, 1113.21 cm−1, 1112.53 cm−1, and 1114.12 cm−1 for ZnS and ZnS@Ag2S NPs, respectively indicate to C-O or C-N bonds [36]. The frequencies at 622.62 cm−1, 619.03 cm−1, 619.55 cm−1, and 618.33 cm−1 for ZnS and ZnS@Ag2S NPs, respectively indicate S-Zn bonds in zinc sulfide nanoparticles [37]. FTIR results also show significant changes in the spectrum of ZnS@Ag2S NPs compared to ZnS NPs, the transmittance (T%) increasing with increasing silver nitrate concentration, this suggests the formation of Ag2S as a coating around ZnS, furthermore, small peaks were observed between 450 and 900 cm−1 in the spectrum of ZnS@Ag2S NPs, possibly indicating vibrations associated with S-Ag bonds [38]. FTIR bonds for ZnS and ZnS @Ag2S NPs synthesized by different concentrations of silver nitrate are listed in Table 3.
Figure 6: FTIR results of ZnS NPs and ZnS@Ag2S NPs with different concentrations of AgNO3.
Table 3: FTIR bonds for ZnS and ZnS @Ag2S NPs.
| Bonds | ZnS NPs | ZnS@Ag2S 0.005 M | ZnS@Ag2S 0.01 M | ZnS@Ag2S 0.02 M |
|---|---|---|---|---|
| O–H stretching vibrations | 3413.94 | 3426.12 | 3435.98 | 3426.26 |
| C–H stretching vibrations | 2924.47 | 2924.97 | 2925.13 | 2924.70 |
| 2853.95 | 2854.28 | 2854.42 | 2854.03 | |
| C–H bending vibrations | 1384.73 | 1384.90 | 1384.94 | 1384.93 |
| 1464.92 | 1465.48 | 1465.82 | ||
| C=C stretching vibrations | 1607.26 | 1630.99 | 1631.47 | 1631.18 |
| C–O stretching vibrations | 1263.83 | 1263.27 | 1269.36 | 1269.05 |
| 1114.75 | 1113.21 | 1112.53 | 1114.12 | |
| Zn–S bond | 622.62 | 619.03 | 619.55 | 618.33 |
3.5 UV-Visible Spectra for ZnS NPs and ZnS@Ag2S NPs Core/Shell
The optical absorption spectra and Tauc plot analysis of ZnS NPs and ZnS@Ag2S NPs synthesized with different AgNO3 concentrations (0.005, 0.01, and 0.02 M), as shown in Fig. 7, demonstrate a pronounced absorbance in the ultraviolet region [39]. The estimated optical band gap energies were found to be higher than that of bulk ZnS, which can be attributed to the quantum confinement effect arising from the nanoscale dimensions of the particles [40]. The band gap values were calculated to be 3.77, 3.61, 3.72, and 3.74 eV for ZnS NPs and ZnS@Ag2S NPs with AgNO3 of 0.005, 0.01, and 0.02 M, respectively [41], using the Tauc relation (Eq. (2)) [42,43]. Furthermore, a slight reduction in the band gap was observed after coating ZnS NPs with Ag2S NPs, which can be ascribed to the formation of interfacial energy levels and electronic coupling between ZnS and Ag2S [44].
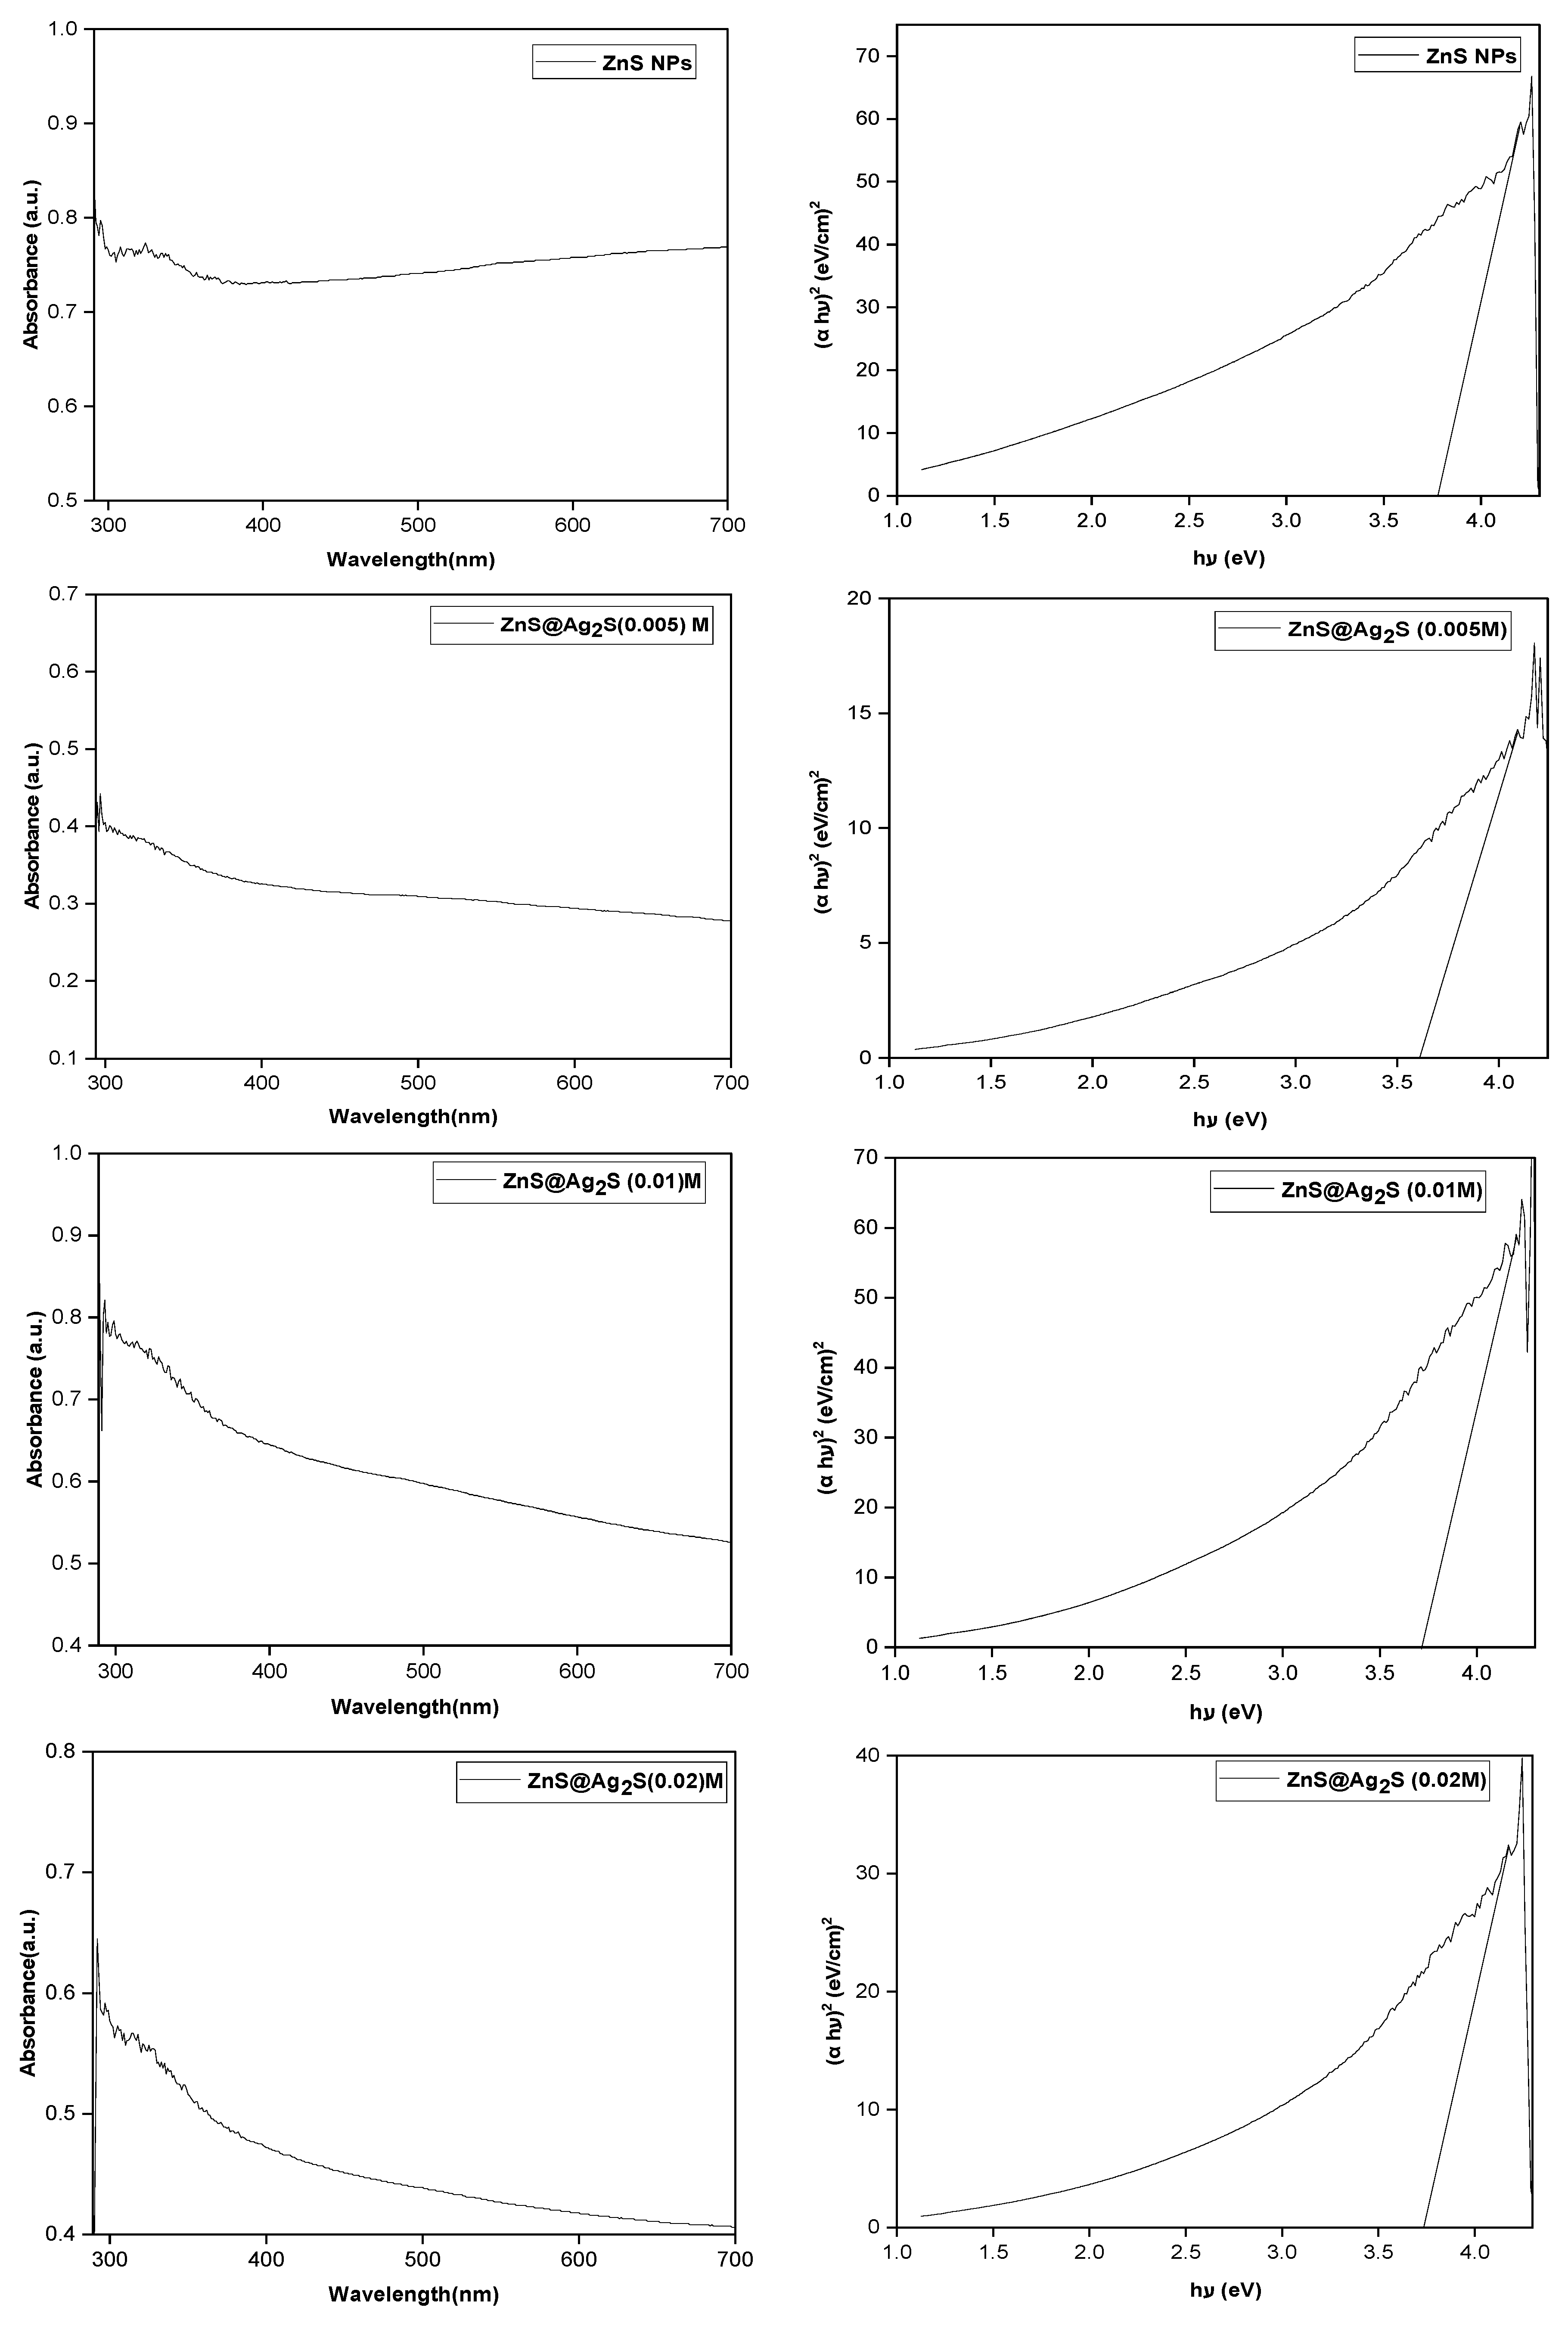
Figure 7: The optical absorption and Tauc plot analysis for ZnS NPs and ZnS@Ag2S NPs with AgNO3 (0.005, 0.01, and 0.02 M).
In this study, ZnS NPs and ZnS@Ag2S NPs were prepared using a green and environmentally friendly method that utilized peppermint leaf extract as both a reducing and coating agent. (XRD) results confirmed the successful formation of both ZnS and Ag2S phases, with an improvement in crystallinity as the silver nitrate concentration increased, indicating the controlled growth of the Ag2S layer around the ZnS core. Furthermore, the results showed an increase in ZnS crystal size after shell formation, while a gradual decrease in Ag2S crystal size was observed with increasing silver nitrate concentration. This can be attributed to an increase in the number of crystallization centers and a restriction of crystal growth at higher concentrations. (TEM) images revealed a clear core-shell structure, with the Ag2S layer becoming more uniform and homogeneous at the silver nitrate concentration (0.01 M). EDX analysis confirmed a gradual increase in silver content with increasing concentration, indicating efficient and uniform encapsulation of ZnS particles within the Ag2S layer. FTIR revealed Zn–S and S–Ag bonds, along with characteristic vibrations of organic compounds present in the mint leaf extract, confirming the extract’s dual role in reducing and surface stabilizing the nanoparticles. As for the ultraviolet-visible measurements, they showed a marked improvement in absorption behavior, with the absorption range expanding towards short wavelengths as the concentration of silver nitrate increased. This indicates an improvement in the ability of the composite nanoparticles to absorb radiation in the ultraviolet.
The improved optical absorption and the formation of a core-shell structure make these materials promising for various applications, such as photocatalysis, photonics, environmental applications, and antimicrobial applications. This study also confirms that using plant extracts is not only an environmentally friendly alternative to traditional chemical methods but also provides effective control over the structural and functional properties of nanoparticles.
Acknowledgement:
Funding Statement: The authors received no specific funding for this study.
Author Contributions: Ruqayah A. Ulwali contributed to the methodology of the study, Nada K. Abbas contributed to writing and discussing the results, and both authors carried out the final revisions of the manuscript. All authors reviewed and approved the final version of the manuscript.
Availability of Data and Materials: No datasets were generated or analyzed during the current study.
Ethics Approval: Not applicable.
Conflicts of Interest: The authors declare no conflicts of interest.
References
1. Patel B , Darji P , Fnu PIJ , Nalla S , Khatri V , Parikh S . A comprehensive review and insight into the latest advancements in nanotechnology. Biosci Biotech Res Asia. 2024; 21( 3): 985– 1000. doi:10.13005/bbra/3279. [Google Scholar] [CrossRef]
2. Shaker DS , Abass NK , Ulwali RAU . Preparation and study of the Structural, Morphological and Optical properties of pure Tin Oxide Nanoparticle doped with Cu. Baghdad Sci J. 2022; 19( 3): 660. doi:10.21123/bsj.2022.19.3.0660. [Google Scholar] [CrossRef]
3. Sohail A . Progress in nanomaterials: Synthesis, characterization, and applications. Next Nanotechnol. 2025; 8: 100263. doi:10.1016/j.nxnano.2025.100263. [Google Scholar] [CrossRef]
4. Hlali S , Kalboussi A , Souifi A . Nanomaterials and nanoelectronics: Synthesis, properties, and applications for nanotechnology. In: Silicon carbide—From materials science to nanotechnology and microelectronics. London, UK: IntechOpen; 2025. doi:10.5772/intechopen.1007972. [Google Scholar] [CrossRef]
5. Emegha JO , Onyenike K , Jolayemi RO , Ejelonu CA , Efe F , Ojo OT . Synthesis and characterization of zinc cobalt sulphide nanofilms for optoelectronic applications. Chem Inorg Mater. 2024; 4: 100068. doi:10.1016/j.cinorg.2024.100068. [Google Scholar] [CrossRef]
6. Al-Mobydeen A , AlShamaileh E , Lahlouh B , Al-Qderat M , AL-Masri AN , Mahmoud W , et al. Synthesis of ZnS nano-powders and fabrication of ZnS thin films via electron-beam evaporation: Structural and optical characterization. Coatings. 2025; 15( 7): 796. doi:10.3390/coatings15070796. [Google Scholar] [CrossRef]
7. Suppiah DD , Julkapli NM , Sagadevan S , Johan MR . Eco-friendly green synthesis approach and evaluation of environmental and biological applications of iron oxide nanoparticles. Inorg Chem Commun. 2023; 152: 110700. doi:10.1016/j.inoche.2023.110700. [Google Scholar] [CrossRef]
8. He H , Huang S , Ma J , Cui J , Zhang X . Research progress on zinc sulfide quantum dots in tumor in vivo imaging. OALib. 2024; 11( 4): 1– 11. doi:10.4236/oalib.1111480. [Google Scholar] [CrossRef]
9. Han B , Fang WH , Zhao S , Yang Z , Hoang BX . Zinc sulfide nanoparticles improve skin regeneration. Nanomedicine. 2020; 29: 102263. doi:10.1016/j.nano.2020.102263. [Google Scholar] [CrossRef]
10. Alagarsamy V , Venkatesh N , Roshan SA , Pandurengan S , Gnanasekaran L , Viswanathan K , et al. NiS-ZnS quantum dots as visible-light photocatalysts for enhanced dye degradation in sustainable wastewater treatment. Chem Phys Impact. 2025; 11: 100912. doi:10.1016/j.chphi.2025.100912. [Google Scholar] [CrossRef]
11. Kaur H , Kumar S , Kumar P , Ghfar AA , Bouzid G . Tailoring ZnS nanostructures through precipitation-cum-hydrothermal synthesis for enhanced wastewater purification and antibacterial treatment. Environ Res. 2024; 259: 119534. doi:10.1016/j.envres.2024.119534. [Google Scholar] [CrossRef]
12. Kumari P , Chattopadhyay S , Samanta S . A comprehensive review on rare earth metal doped ZnS nanoparticles: Structure, synthesis, properties, and applications in the realm of nanotechnology. Discov Appl Sci. 2025; 7( 9): 1011. doi:10.1007/s42452-025-07672-0. [Google Scholar] [CrossRef]
13. Chakrabarti A , Alessandri E . Syntheses, properties, and applications of ZnS-based nanomaterials. Appl Nano. 2024; 5( 3): 116– 42. doi:10.3390/applnano5030010. [Google Scholar] [CrossRef]
14. Abdullah M , Obayedullah M , Shuvo MSI , Khair MA , Hossain D , Islam MN . A review on multifunctional applications of nanoparticles: Analyzing their multi-physical properties. Results Surf Interfaces. 2025; 21: 100635. doi:10.1016/j.rsurfi.2025.100635. [Google Scholar] [CrossRef]
15. Öberg VA , Zhang X , Johansson MB , Johansson EMJ . Solution-processed environmentally friendly Ag2S colloidal quantum dot solar cells with broad spectral absorption. Appl Sci. 2017; 7( 10): 1020. doi:10.3390/app7101020. [Google Scholar] [CrossRef]
16. Iqbal T , Munir K , Afsheen S , Zafar M , Abrar M , Qureshi MT , et al. Green synthesis of Ag2S/ZnS composites and their application for seeds germination to explore critical aspect. J Inorg Organomet Polym Mater. 2022; 32( 6): 2221– 34. doi:10.1007/s10904-022-02293-1. [Google Scholar] [CrossRef]
17. Abed A , Al Hindawi A , Alesary H . Green synthesis of zinc sulfide nanoparticles for the removal of methylene blue dye from aqueous solution. Nano World J. 2022; 8( 3): 79– 84. doi:10.17756/nwj.2022-103. [Google Scholar] [CrossRef]
18. Haghighatzadeh A , Kiani M , Mazinani B , Dutta J . Facile synthesis of ZnS–Ag2S core–shell nanospheres with enhanced nonlinear refraction. J Mater Sci Mater Electron. 2020; 31( 2): 1283– 92. doi:10.1007/s10854-019-02640-y. [Google Scholar] [CrossRef]
19. Awwad AM , Salem NM , Aqarbeh MM , Abdulaziz FM . Green synthesis, characterization of silver sulfide nanoparticles and antibacterial activity evaluation. Chem Int. 2020; 6( 1): 42– 8. [Google Scholar]
20. Viter R , Zabolotnii V , Sahul M , Čaplovičová M , Tepliakova I , Sints V , et al. Novel core-shell metal oxide nanofibers with advanced optical and magnetic properties deposited by co-axial electrospinning. Nanomaterials. 2025; 15( 13): 1026. doi:10.3390/nano15131026. [Google Scholar] [CrossRef]
21. Obead AH , Abbas NK . Green synthesis of MgO nanoparticles via two different methods and studying their structural, morphological, and optical properties. Baghdad Sci J. 2025; 22( 8): 2638– 46. doi:10.21123/2411-7986.5027. [Google Scholar] [CrossRef]
22. Mohamed ZK , Mutter MM , Khalil SG . Preparation and characterization of Au/TiO2: CdS thin film as photocatalysis for degradation of MB dye in water. Iraqi J Phys. 2025; 23( 4): 143– 58. doi:10.30723/ijp.v23i4.1429. [Google Scholar] [CrossRef]
23. Muthukumaran S , Gopalakrishnan R . Structural, FTIR and photoluminescence studies of Cu doped ZnO nanopowders by co-precipitation method. Opt Mater. 2012; 34( 11): 1946– 53. doi:10.1016/j.optmat.2012.06.004. [Google Scholar] [CrossRef]
24. Madhubala V , Kalaivani T . Phyto and hydrothermal synthesis of Fe3O4@ZnO core-shell nanoparticles using Azadirachta indica and its cytotoxicity studies. Appl Surf Sci. 2018; 449: 584– 90. doi:10.1016/j.apsusc.2017.12.105. [Google Scholar] [CrossRef]
25. Mote V , Purushotham Y , Dole B . Williamson-Hall analysis in estimation of lattice strain in nanometer-sized ZnO particles. J Theor Appl Phys. 2012; 6( 1): 6. doi:10.1186/2251-7235-6-6. [Google Scholar] [CrossRef]
26. Wei S , Zheng Q . Biosynthesis and characterization of zinc sulphide nanoparticles produced by the bacterium Lysinibacillus sp. SH74. Ceram Int. 2024; 50( 2): 2637– 42. doi:10.1016/j.ceramint.2023.10.246. [Google Scholar] [CrossRef]
27. Arévalo-Cid P , Isasi J , Caballero AC , Martín-Hernández F , González-Rubio R . Effects of shell-thickness on the powder morphology, magnetic behavior and stability of the chitosan-coated Fe3O4 nanoparticles. Boletín De La Soc Española De Cerámica Y Vidr. 2022; 61( 4): 300– 12. doi:10.1016/j.bsecv.2020.12.001. [Google Scholar] [CrossRef]
28. Karthick J , Sreenivasan VJ . Enhanced photocatalytic and antibacterial performance of ZnO and ZnS synthesized using natural fuel: Influence of green synthesis, particle size, and morphology. Indian J Chem Technol. 2025; 32( 6): 710– 22. doi:10.56042/ijct.v32i6.21749. [Google Scholar] [CrossRef]
29. Senapati US , Athparia R . Green synthesis of ZnS nanoparticles using Allium sativum L. extract and study of their structural, optical and electrical properties. Chalcogenide Lett. 2022; 19( 3): 203– 16. doi:10.15251/cl.2022.193.203. [Google Scholar] [CrossRef]
30. Kpega TC , Habila JD , Okon IE , Ekwumemgbo PA . Green synthesis and characterization of zinc oxide nanoparticles using Corchorus olitorius leaf extract. Aceh Int J Sci Technol. 2023; 12( 3): 358– 67. doi:10.13170/aijst.12.3.34013. [Google Scholar] [CrossRef]
31. Imran HJ , Hubeatir KA , Aadim KA . A novel method for ZnO@NiO core-shell nanoparticle synthesis using pulse laser ablation in liquid and plasma jet techniques. Sci Rep. 2023; 13( 1): 5441. doi:10.1038/s41598-023-32330-z. [Google Scholar] [CrossRef]
32. Pasieczna-Patkowska S , Cichy M , Flieger J . Application of Fourier transform infrared (FTIR) spectroscopy in characterization of green synthesized nanoparticles. Molecules. 2025; 30( 3): 684. doi:10.3390/molecules30030684. [Google Scholar] [CrossRef]
33. Varadhan SR . Identification of physical clues by FTIR spectroscopy. Orient J Chem. 2020; 36( 5): 958– 63. doi:10.13005/ojc/360523. [Google Scholar] [CrossRef]
34. Mushtaq A , Hanif MA , Nadeem R , Mushtaq Z . Development of methodology for molecular crystallization of menthol. Heliyon. 2024; 10( 19): e38394. doi:10.1016/j.heliyon.2024.e38394. [Google Scholar] [CrossRef]
35. Taylan O , Cebi N , Sagdic O . Rapid screening of Mentha spicata essential oil and L-menthol in Mentha piperita essential oil by ATR-FTIR spectroscopy coupled with multivariate analyses. Foods. 2021; 10( 2): 202. doi:10.3390/foods10020202. [Google Scholar] [CrossRef]
36. Ali Alhaidrai SA . Phytochemical screening by FTIR spectroscopic analysis in the methanolic extracts coffee (C. Arabica L.) to seeds and peels (unroasted and roasted) cultivars grown in Yemen. Bioequiv Bioavailab Int J. 2022; 6( 2): 1– 8. doi:10.23880/beba-16000179. [Google Scholar] [CrossRef]
37. Moon H , Kim S , Joo SW , Kim M , Park NK , Baek JI , et al. Design and selective photocatalytic activity of highly concentrated C, N, O co-doped Zn, S co-defective ZnS particles mediated by ethylenediamine derivatives. Nano Today. 2023; 49: 101785. doi:10.1016/j.nantod.2023.101785. [Google Scholar] [CrossRef]
38. Zamiri R , Abbastabar Ahangar H , Zakaria A , Zamiri G , Shabani M , Singh B , et al. The structural and optical constants of Ag2S semiconductor nanostructure in the Far-Infrared. Chem Cent J. 2015; 9: 28. doi:10.1186/s13065-015-0099-y. [Google Scholar] [CrossRef]
39. Riazian M , Yekrangisendi A . Synthesis of ZnS nanoparticles via a sonochemical method: Photocatalytic activity and optical properties. Phys Chem Res. 2023; 11( 3): 575– 87. doi:10.22036/pcr.2022.341626.2099. [Google Scholar] [CrossRef]
40. Zhang J , Qi K , Pitcheri R , Duan C . Engineering ZnS quantum dots for photocatalysis: Synthesis, modifications, and multifunctional applications. J Photochem Photobiol C Photochem Rev. 2025; 65: 100722. doi:10.1016/j.jphotochemrev.2025.100722. [Google Scholar] [CrossRef]
41. Alwany AB , Youssef GM , Samir OM , Algradee MA , A. Yahya NA , Swillam MA , et al. Annealing temperature effects on the size and band gap of ZnS quantum dots fabricated by co-precipitation technique without capping agent. Sci Rep. 2023; 13( 1): 10314. doi:10.1038/s41598-023-37563-6. [Google Scholar] [CrossRef]
42. Bhushan M , Jha R , Bhardwaj R . Reduced band gap and diffusion controlled spherical n-type ZnS nanoparticles for absorption of UV-Vis region of solar spectrum. J Phys Chem Solids. 2019; 135: 109021. doi:10.1016/j.jpcs.2019.05.018. [Google Scholar] [CrossRef]
43. AlSultani MJ , Alias MFA . Impact of graphene oxide concentration and anthocyanin dye on the structural, morphological and optical properties of GO: TiO2 thin films. Iraqi J Sci. 2025; 66( 6): 2336– 49. doi:10.24996/ijs.2025.66.6.12. [Google Scholar] [CrossRef]
44. Sadovnikov SI , Ishchenko AV , Weinstein IA . Synthesis and optical properties of nanostructured ZnS and heteronanostructures based on zinc and silver sulfides. J Alloys Compd. 2020; 831: 154846. doi:10.1016/j.jallcom.2020.154846. [Google Scholar] [CrossRef]
Cite This Article
 Copyright © 2026 The Author(s). Published by Tech Science Press.
This work is licensed under a Creative Commons Attribution 4.0 International License , which permits unrestricted use, distribution, and reproduction in any medium, provided the original work is properly cited.
 Downloads
 Citation Tools