
 Submit a Paper
 Propose a Special lssue
 Open Access
ARTICLE
An Effective Machine-Learning Based Feature Extraction/Recognition Model for Fetal Heart Defect Detection from 2D Ultrasonic Imageries
1 College of Engineering, Huaqiao University, Quanzhou, 362021, China
2 Department of Ultrasound, The Second Affiliated Hospital of Fujian Medical University, Quanzhou, 362021, China
3 Collaborative Innovation Center for Maternal and Infant Health Service Application Technology, Quanzhou Medical College, Quanzhou, 362021, China
* Corresponding Author: Guorong Lv. Email:
(This article belongs to the Special Issue: Enabled and Human-centric Computational Intelligence Solutions for Visual Understanding and Application)
Computer Modeling in Engineering & Sciences 2023, 134(2), 1069-1089. https://doi.org/10.32604/cmes.2022.020870
Received 20 December 2021; Accepted 14 March 2022; Issue published 31 August 2022
 View Full Text
 Download PDF
Abstract
Congenital heart defect, accounting for about 30% of congenital defects, is the most common one. Data shows that congenital heart defects have seriously affected the birth rate of healthy newborns. In Fetal and Neonatal Cardiology, medical imaging technology (2D ultrasonic, MRI) has been proved to be helpful to detect congenital defects of the fetal heart and assists sonographers in prenatal diagnosis. It is a highly complex task to recognize 2D fetal heart ultrasonic standard plane (FHUSP) manually. Compared with manual identification, automatic identification through artificial intelligence can save a lot of time, ensure the efficiency of diagnosis, and improve the accuracy of diagnosis. In this study, a feature extraction method based on texture features (Local Binary Pattern LBP and Histogram of Oriented Gradient HOG) and combined with Bag of Words (BOW) model is carried out, and then feature fusion is performed. Finally, it adopts Support Vector Machine (SVM) to realize automatic recognition and classification of FHUSP. The data includes 788 standard plane data sets and 448 normal and abnormal plane data sets. Compared with some other methods and the single method model, the classification accuracy of our model has been obviously improved, with the highest accuracy reaching 87.35%. Similarly, we also verify the performance of the model in normal and abnormal planes, and the average accuracy in classifying abnormal and normal planes is 84.92%. The experimental results show that this method can effectively classify and predict different FHUSP and can provide certain assistance for sonographers to diagnose fetal congenital heart disease.Keywords
Congenital heart defect is one of the most common fetal congenital defects with an incidence rate of about 30% to 40%, affecting 1% of newborns worldwide, and an incidence rate of 0.5% to 9% in China, which means that nearly 90,000–150,000 newborns with congenital heart defects are introduced in China every year [1]. This has become a sad experience for many families. Prenatal diagnosis is the key link in screening fetal heart abnormalities [2]. Parents-to-be can observe the abnormal situation of fetus through prenatal diagnosis and take reasonable measures in follow-up treatments.
2D ultrasound is the primary technical way to check the health status of the fetus at this stage [2,3]. It has the advantages of low cost, portability, no radiation, no trauma and real-time imaging, which plays an important role in fetal anatomy, diagnosis and treatment of congenital defects. Sonographers can observe and diagnose the fetus with congenital defects through various standard planes collected by ultrasound probes, which provide reliable guiding value for the follow-up clinical treatment plan. However, in practical clinical work with the development of science and technology and popularization of ultrasonic image application, more and more 2D ultrasonic images need to be manually identified by qualified sonographers. In recent years, due to the popularity of prenatal ultrasound diagnosis and standardized training of sonographers, the professional skills of prenatal sonographers have been greatly improved [2]. However, image recognition itself is a tedious and complex job and there are still factors that affect the manual identification of sonographers in daily ultrasound work. Factors such as lack of experience, different cognitive levels and work fatigue will lead to misjudgment of subsequent diagnosis. In this case, it is necessary to study a method that can not only improve the influence of different qualifications of sonographers, but also improve the recognition accuracy.
Through detailed prenatal fetal heart ultrasound examination, the structure and function of the fetal heart are observed. The relationship between atrioventricular position, atrioventricular connection, ventricular artery connection, aorta and pulmonary artery are analyzed in detail [4]. It is possible to find and diagnose congenital heart diseases with obvious abnormal morphology, such as abnormal heart position, abnormal heart cavity, abnormal atrial septum and so on. In 2021, on Nature Medicine, Arnaout et al. [5] took five standard planes dominated by abdomen (ABDO) to define the FHUSP. However according to the latest international definition FHUSP [6], abdomen (ABDO) is no longer applicable to analyze fetuses with congenital heart defects. The first step is to scan and diagnose congenital heart disease from a 2D ultrasound video, including the apical three-vessel catheter plane (3VC), the three-vessel trachea plane (3VT), the apical four-lumen cardiac plane (A4C), the right ventricular outflow tract plane (RVOT) and the left ventricular outflow tract plane (LVOT). Fig. 1 is a schematic diagram of the above five standard planes [7]. Fig. 2 shows some common abnormal conditions of the fetal heart.

Figure 1: The figure mainly shows five main FHUSP images: (a) 3VC, (b) 3VT, (c) A4C, (d) RVOT, (e) LVOT

Figure 2: A is normal FHUSP, is LOVT, A4C, 3VC; from top to bottom; B are common congenital fetal heart defects: (a) Single atrium and single ventricle defect, (b) Ventricular septal defect, (c) Tetralogy of Fallot
The purpose of this study is to improve the recognition and classification efficiency of FHUSP and reduce the influence of subjective factors on the recognition of FHUSP. From the point of view of how to identify and obtain various FHUSP, a more convenient and quick artificial intelligence method is adopted in the scanning stage to provide an automatic identification scheme for sonographers, so as to minimize the dependence on sonographers’ qualifications. The influence of different ultrasonic devices in obtaining the FHUSP can improve the efficiency of ultrasonic examination of fetal heart.
With the application of artificial intelligence in different fields [8–11], computers have gradually emerged in medical research, realizing the cross-application between artificial intelligence and medicine and automatically identifying and classifying ultrasonic standard planes through artificial intelligence methods. However, 2D ultrasound imaging of the fetal heart itself has some problems:
1. Because its ultrasonic imaging realizes ultrasonic scanning, the image effect is greatly affected by noise, and the image quality of ultrasonic acquisition equipment from different manufacturers are different.
2. According to the reason of sonographer’s artificial image acquisition and fetal dynamic problems, the anatomical structure of each plane shows a changing position and direction of the relationship.
3. There are individual differences in fat layer thickness, fetal growth cycle, amniotic fluid volume, fetal birth mode and fetal orientation of pregnant women, which lead to different problems in acquired images.
4. Different sonographers have different qualifications and work experience, which makes the acquired images different.
As a result, artificial intelligence cannot adopt diversified methods for automatic recognition and classification of FHUSP like other fields and needs more targeted methods. In the field of image processing, recognition, classification and machine learning methods are based on traditional manual features and deep learning methods based on depth features are generally adopted.
The machine learning method based on traditional manual features is a semi-supervised learning method and its core steps are feature extraction and feature selection. In 2008, Liu et al. [12] automatically searched for the best cross-section of heart 3D ultrasound by template matching method and the method based on entropy correlation coefficient achieved high accuracy, which proved that the artificial intelligence method was superior to manual search in searching these cross-sections. In 2013, Ni et al. [13] proposed a new positioning scheme of abdominal standard plane, using the radial model to describe the key anatomical structure of the abdominal plane, and realized the preliminary positioning of the standard plane. Then, in the same year, Zhang et al. [14] successfully screened the two-dimensional ultrasound standard plane by using cascaded AdaBoost classifier and local context information and put forward the concept of “intelligent ultrasound scanning”. In 2014, Lei et al. [15] proposed a method of bottom features combined with Fisher vector feature coding to assist in locating the standard plane. Due to the limitations of feature selection, the method still has room for improvement. In 2015, Lei et al. [16] adjusted the underlying features and realized the classification of the standard plane of the fetal face by using the densely sampled root scale invariant feature transform (root SIFT) combined with the Fisher vector classifier. In 2017, Christopher et al. [17] of Oxford University used the method of random forest regression to predict the visibility, position and direction of fetal heart ultrasound images in order to determine the FHUSP from each video frame and obtained the same accuracy as experts. In the same year, Oktay et al. [18] used a hierarchical decision tree to segment and locate the anatomical structure of MRI cardiac image with high accuracy, and it was superior to the method based on standard regression and classification.
Since the development of artificial intelligence entered the 2020s, deep learning began to be excavated and accepted by people. Methods based of deep learning suddenly flooded into all walks of life in society, including the medical field. Image recognition based on deep learning is slowly involved in the field of ultrasound [19,20]. This fully automatic learning method can better reflect the intelligent mode of artificial intelligence. In 2015, Chen et al. [21] proposed the standard plane location in fetal ultrasound by using the domain transfer depth neural network. By comparing with the original CNN network, the ability of preventing over-fitting was greatly improved. In 2017, Baumgartner et al. [22] proposed a deep learning method Sono-Net, which is based on convolutional neural network and can be used to locate 13 standard sections of the fetus. In the same year, Chen et al. [23] proposed a composite neural network, which replaced ultrasonic image recognition with video recognition, and made great progress in various indicators. In 2019, Lin et al. [24] proposed a new faster regional convolutional neural network (MFR-CNN) to control the quality of ultrasonic recognition in a multi-task framework. In 2021, Wang et al. [25] proposed an adaptive soft attention scheme to directly explore the raw antenatal ultrasound video data. In the same year, Pu et al. [26] proposed an automatic fetal ultrasonic standard plane recognition model based on deep learning in the Industrial Internet of Things (IIoT) environment, which combined the components of Convolutional Neural Network (CNN) and Recycling Neural Network (RNN) to effectively improve the accuracy and robustness of image recognition by the model.
Most of the scholars in the above articles have made good progress in their respective research fields, which provided a solid foundation for the development of medical artificial intelligence and smart medical care. However, there are also large and small problems in the research above:
1. The applicability of the research field is low and it is difficult to expand to other ultrasonic images.
2. Some methods are not suitable for the current progress of ultrasonic images and artificial intelligence, so they cannot be compared with the new methods in evaluation index.
3. The deep learning convolution network model is complex, difficult to build, takes a long time to train, and requires advanced computer equipment.
To solve the problems above, this study proposes a classification method of FHUSP based on traditional manual features. It has been proved that the LBP-HOG method is suitable for other ultrasonic fetal standard planes [27]. In this study, the visual Bag of Words (BOW) feature is added to LBP-HOG, which improves the accuracy of classification and makes good progress. With the approval and examination of the ethics committee, and with the patient’s knowledge, 1,236 prenatal fetal heart images were collected and used as the training automatic classification model, of which 80% were used in training and 20% were used in the test. The fetal heart images were used in the automatic classification model designed in this study. Finally, the models designed in this study were compared and analyzed under the condition of multiple evaluation indexes.
The main contributions of this study are as follows:
1. It is expected to establish a large domestic fetal heart ultrasound database by collecting 2D ultrasound fetal heart standard planes in stages.
2. In this study, an automatic classification model of FHUSP based on texture features (Local Binary Pattern LBP and Histogram of Oriented Gradient HOG) and visual Bag of Words (BOW) model coding features of accelerated stability features (SURF) is proposed. After verification of several evaluation criteria, it is proved that this method can effectively identify and classify FHUSP and has the potential to assist sonographers in screening FHUSP.
3. Also, this model also has a good performance in identifying normal and abnormal fetal heart plane, which can provide a certain basis for ultrasound doctors to diagnose congenital heart disease.
Although some prenatal fetal heart ultrasound databases can be found from the Internet, this data is not easy to obtain because of the privacy of patients. Because the ultrasonic data is not easy to obtain, the data of five ultrasonic standard planes of the fetal heart (the three-vessel tracheal plane, the three-vessel catheter plane, the apical four-chamber cardiac plane, the right ventricular outflow tract plane and the left ventricular outflow tract plane), normal and abnormal fetal heart plane involved in this study were provided by the second affiliated hospital of Fujian Medical University, first-class hospital at Grade 3. This data was collected and further screened by professional sonographers through GE, Mindray, Philips and other ultrasonic instruments, which were agreed to be used after the patient was informed. The size of the obtained data is 720 × 960 or 852 × 1136, which ensures the accuracy of the experimental data to the greatest extent. Finally, a total of 1236 (788 + 448) plane data of fetal cardiac ultrasound were added to the experiment. The data were collected from pregnant women who were diagnosed during 18–22 weeks of pregnancy. The data volume of various planes and the distribution principle of experimental data sets are shown in Table 1. The data distribution of normal and abnormal fetal heart plane is shown in Table 2.


The model designed in this study is mainly to overcome a series of problems caused by sonographers scanning ultrasound images, such as angle and scale problems caused by ultrasound imaging, manpower and time problems caused by scanning ultrasound images, etc. In the method of artificial intelligence deep learning, the training of deep features takes a lot of time, so this study adopts the method based on traditional manual features to save manpower and time. Aiming at the imaging and angle problems of the ultrasonic image, this study proposes a global texture feature method: Texture feature extraction using Local Binary Pattern (LBP) with gray scale invariance and Histogram of Oriented Gradient (HOG) with direction invariance. In order to solve the problem of different image scales caused by ultrasonic probe scanning and post-imaging, this study proposes a visual word bag feature method: Speeded Up Robust Features (SURF) with scale invariance and rotation invariance, from feature vectors through Bag of Words (BOW), and solves the problem of different scales of ultrasonic image imaging. After feature fusion and Principal Component Analysis (PCA) dimension reduction, texture features and visual word bag features are learned by the support vector machine, automatic recognition and classification of FHUSP are realized. The detailed experimental design process is shown in Fig. 3. In addition, we compared this method with some existing methods. The method of the model is introduced in detail:

Figure 3: Model flow chart. First, the original image is preprocessed. The image is divided into two parts: Training set and test set. Then, the texture feature extraction and visual word bag feature extraction are carried out on the training set and the test set, respectively. The extracted features are connected in series and then PCA is used to reduce dimension for feature selection. Finally, it is handed over to SVM classifier for classification
The original 2D ultrasound images we obtained contain a lot of redundant information, such as the medical record information of pregnant women and the source of information in related pictures. In addition, 2D ultrasound images have excessive speckle noise and low contrast [28,29]. Problems such as imaging angle, imaging scale, and position relationship in the process of probe scanning will lead to distortion of some images. This will greatly limit the ability of the computer to extract texture and visual word bag features. We preprocessed the collected images. First, we cut out the ROI area of the original image, kept the key information area with large contrast, cut out the 256 * 256 ROI from the original image, then preprocessed the cut image. The preprocessing method adopted in this study is mainly Anisotropic Filter [30]. For Anisotropic Filter, the whole image is regarded as a heat field and each pixel is regarded as a heat flow. The flow of the heat depends on the relationship between the current pixel and the surrounding pixels. If the neighboring pixel is an edge pixel, its flow diffusion coefficient will be relatively small, that is, the heat flow will not diffuse to the neighboring pixels, or the diffusion will be weakened. If it is not an edge pixel, the diffusion coefficient changes toward the flowing direction, and the flowing place becomes smooth, so that the noise area is smoothed while the edge is kept. The effect after pretreatment is shown in Fig. 4.
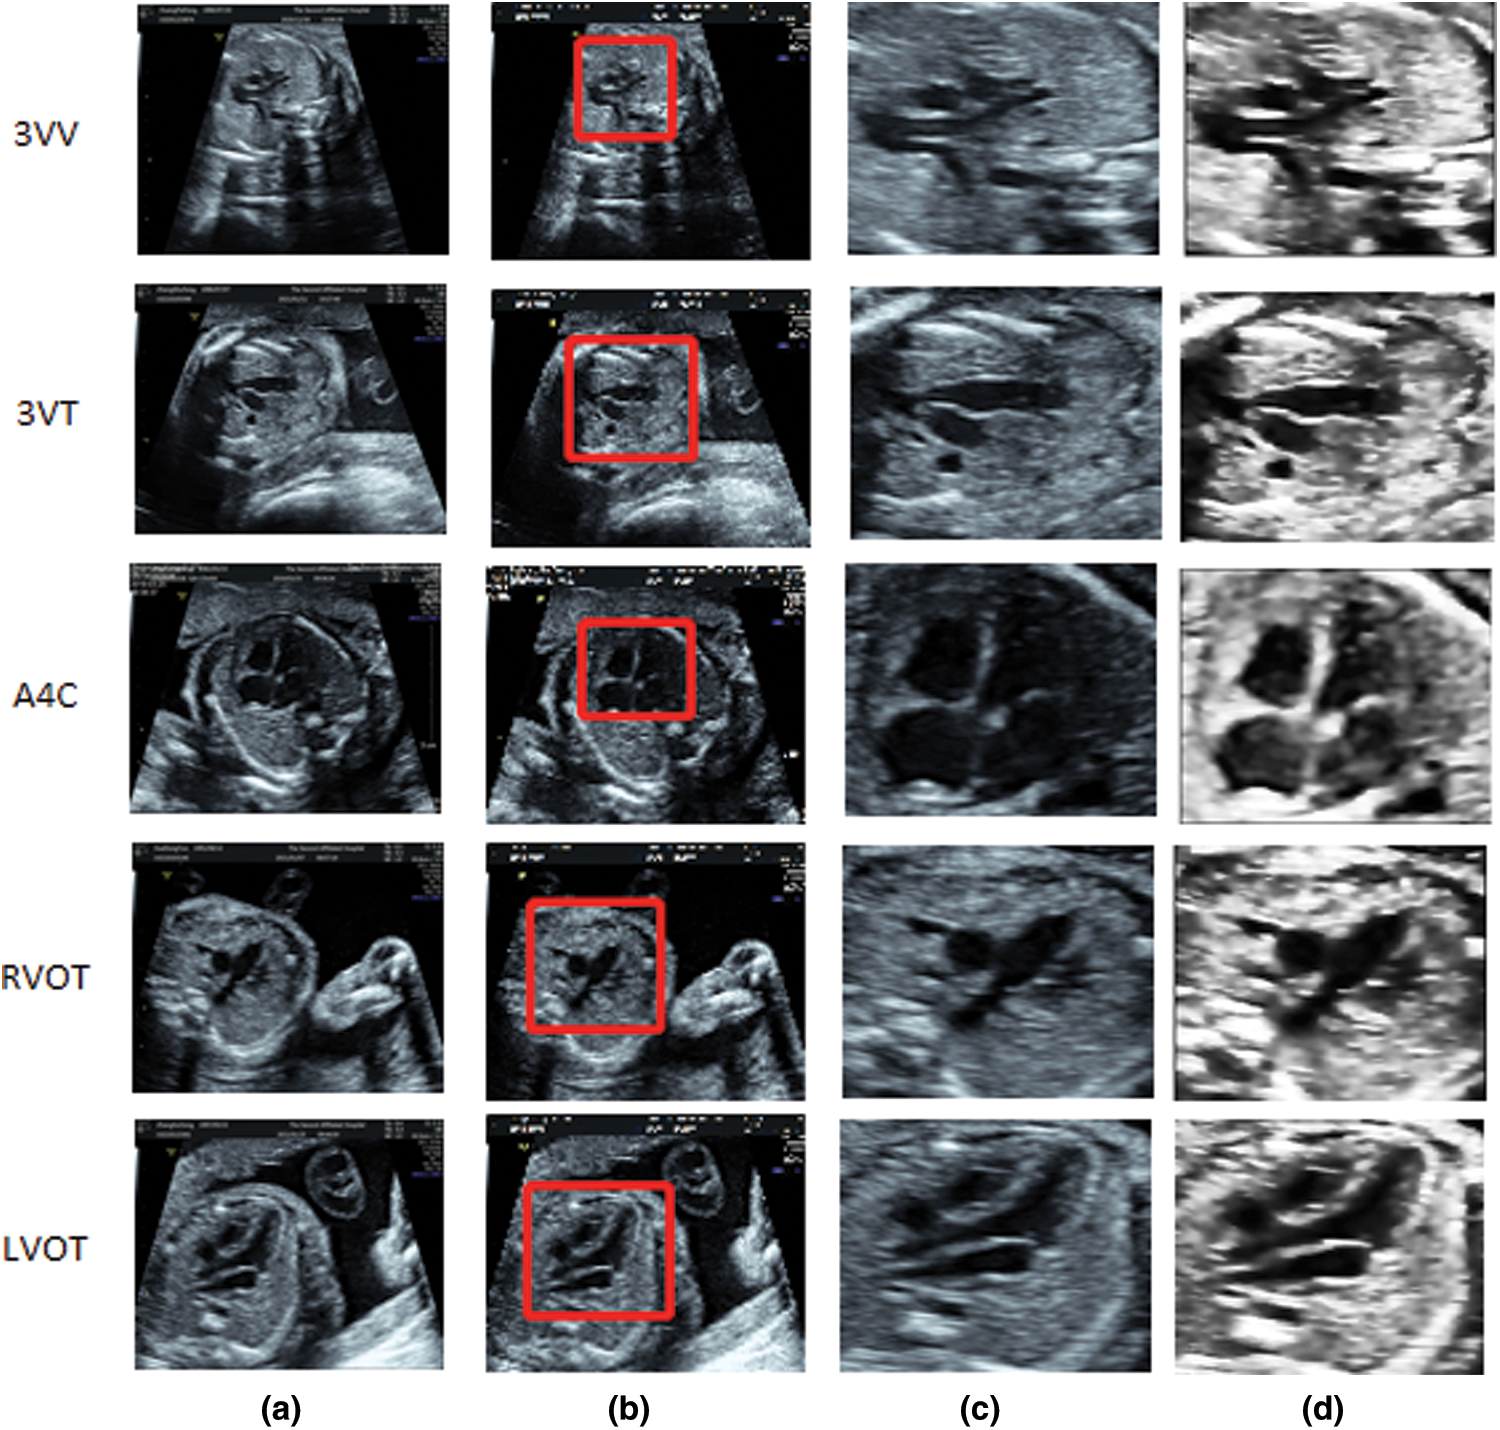
Figure 4: Flow chart of smooth denoising and schematic diagram of effect after smooth denoising: (a) Original picture entered, (b) Clipping ROI area, (c) Clipped ROI area, (d) Preprocessing the smoothed image
3.2.2 Texture Feature Extraction
LPB is one of the best methods to describe texture features at present [31]. Compared with most texture feature methods, LPB has remarkable advantages such as rotation invariance and gray scale invariance. In this study, the original LBP operator is extended. The original LBP operator is defined in the 3 * 3 neighborhood of eight pixels formed by the central pixel and its surrounding matrix and takes the central pixel as the threshold. Formula (1) represents the original LBP imputation method, which in this experiment extends the operator to above 20 * 20. Formula (2) serves as a determination formula for the central and surrounding pixels.
The specific calculation formula of LBP is as follows:
HOG is one of the most important texture feature extraction methods in the field of computer vision at present [32]. It has been proved to have a good application in grayscale images, especially in the fields of object detection and tracking. For each central pixel, the idea of gradient direction histogram is to use gradient operators
where
In the phase of texture feature extraction, we divide the target image according to Cellsize, and reshape LBP feature and HOG feature into many adjacent cell arrays to access the histogram of each cell. Histogram parameters determine how to aggregate the distribution of binary pattern and gradient direction histogram on the image to generate output features. The binary pattern is calculated for each Cell, and the histogram of gradient direction is obtained. Each Cell has the same size and does not overlap to obtain different position information. Calculate the number of cells as Cellsize. Specific problem feature extraction is shown in Fig. 5.
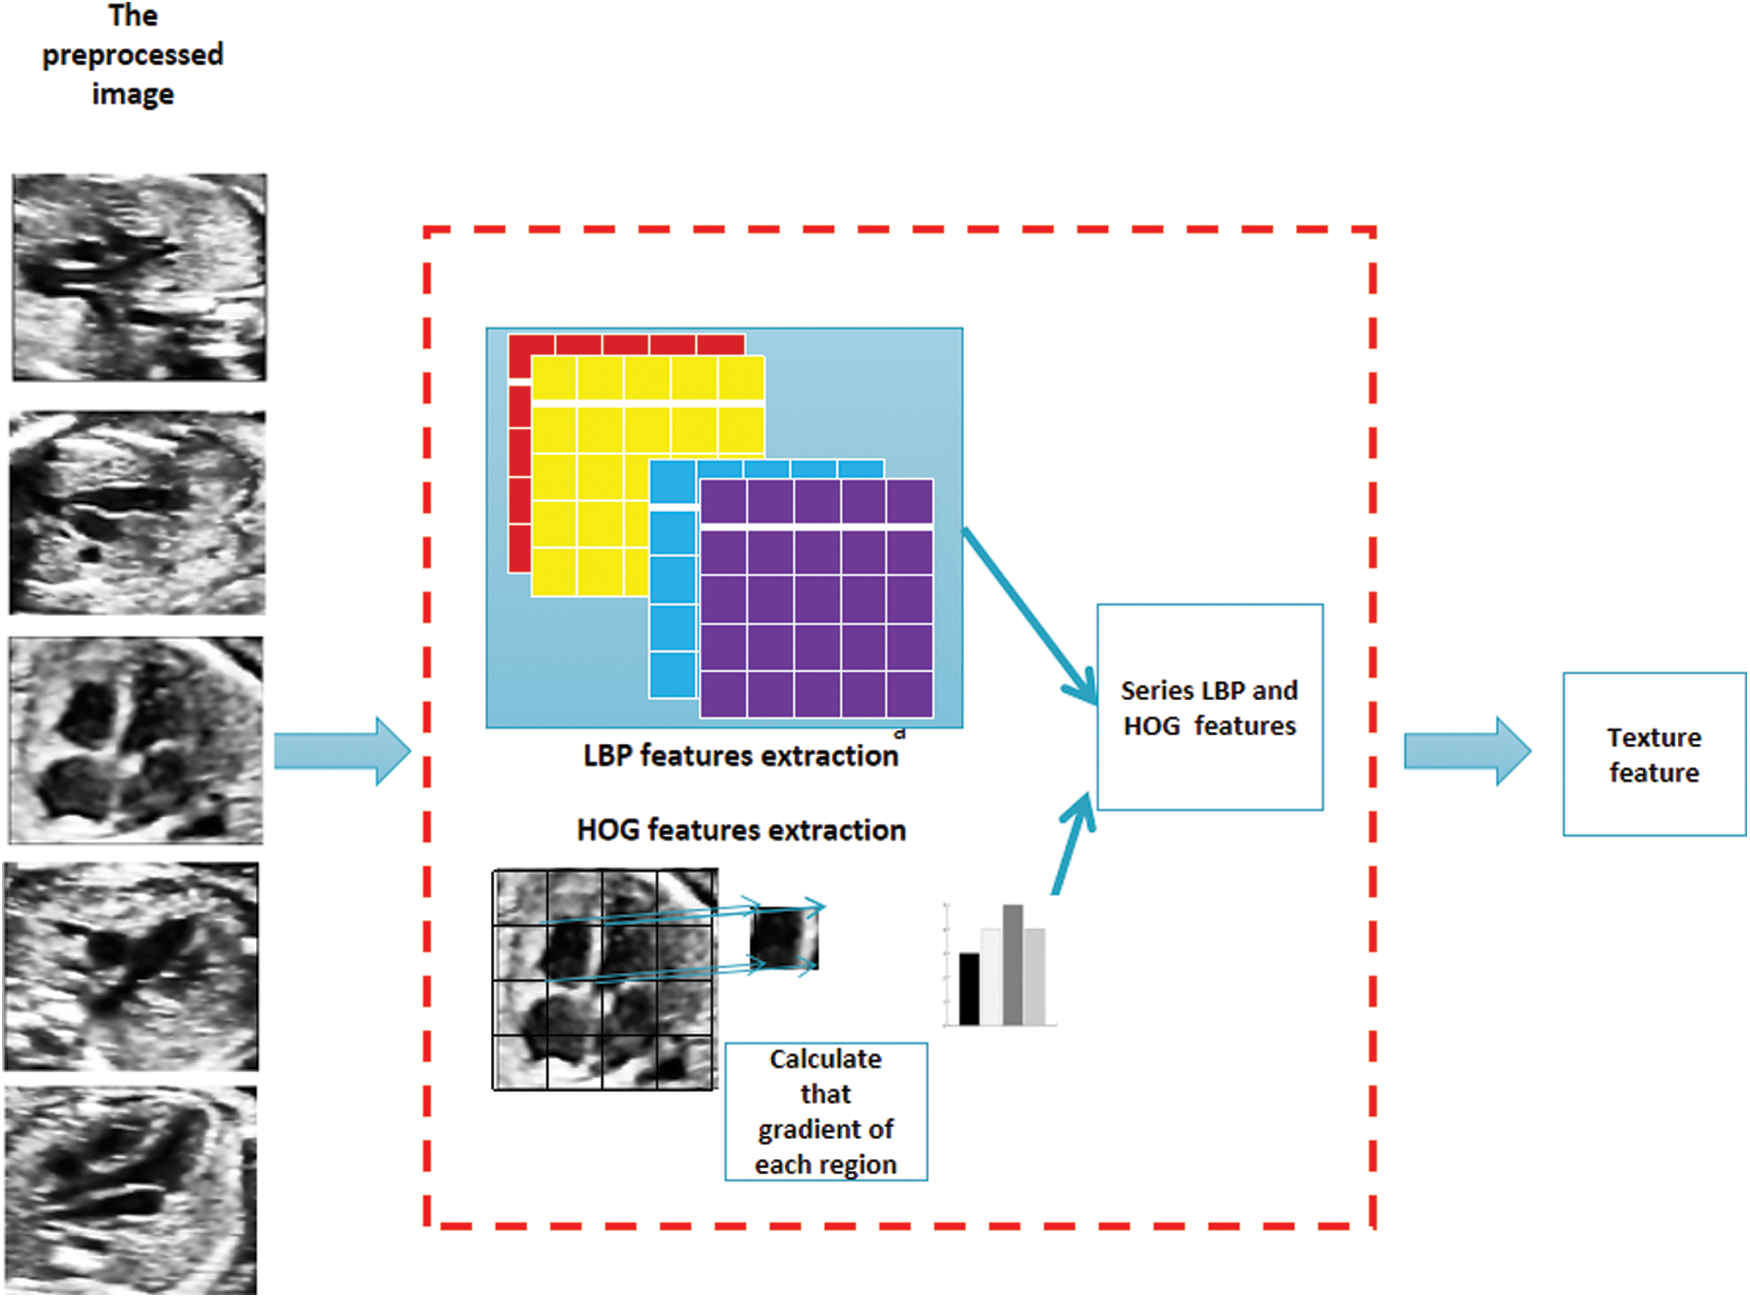
Figure 5: After the preprocessed image is obtained, the part above is LBP feature extraction operation, and the following part is HOG feature extraction operation. After concatenation, it is the texture feature to be extracted in this paper
In 1999, a new feature description algorithm, Scale Invariant Feature Transform (SIFT), was proposed by Canadian professor David Lowe [33] and was approved in 2004 [34]. SIFT is an image local feature description algorithm based on scale space and has good robustness because of the reason of constructing local scale space.
In 2008, Herbert et al. proposed a local feature operator Speeded up Robust Features (SURF) [35], which is faster and can guarantee stability. SURF is an improved version based of SIFT, because it not only keeps the stability of SIFT, but can significantly improve the speed. The data consumed by SURF on the same data set is only one third to one seventh of SIFT, so SURF has been widely used. The specific implementation process is divided into five steps: construct the Hessian matrix, generate scale space, locate feature points, determine the main direction, and generate feature descriptors.
BOW was originally used in text classification [36] and has been widely used in natural language processing in the application field of computer vision. Its basic idea is to assume that for a text, its word order, grammar and syntax are ignored. It is only regarded as a collection of some words, and each word in the text is independent. In the field of images, people gradually find that images are transformed into matrices or vectors, which can be regarded as the lexical expression of BOW [37]. To express images as vectors of BOW, the first thing is to get the “vocabulary” of images. Usually, it is necessary to extract the local features of the image in the whole image database, and then use the clustering method (K-means) to merge the similar features. The center of the cluster can look at visual vocabulary one by one, and the collection of visual vocabulary constitutes a visual dictionary. After the visual vocabulary set is obtained, the frequency of each visual vocabulary in the image is counted and the BOW representation of the image is obtained. Fig. 6 briefly introduces the framework of the word bag model.
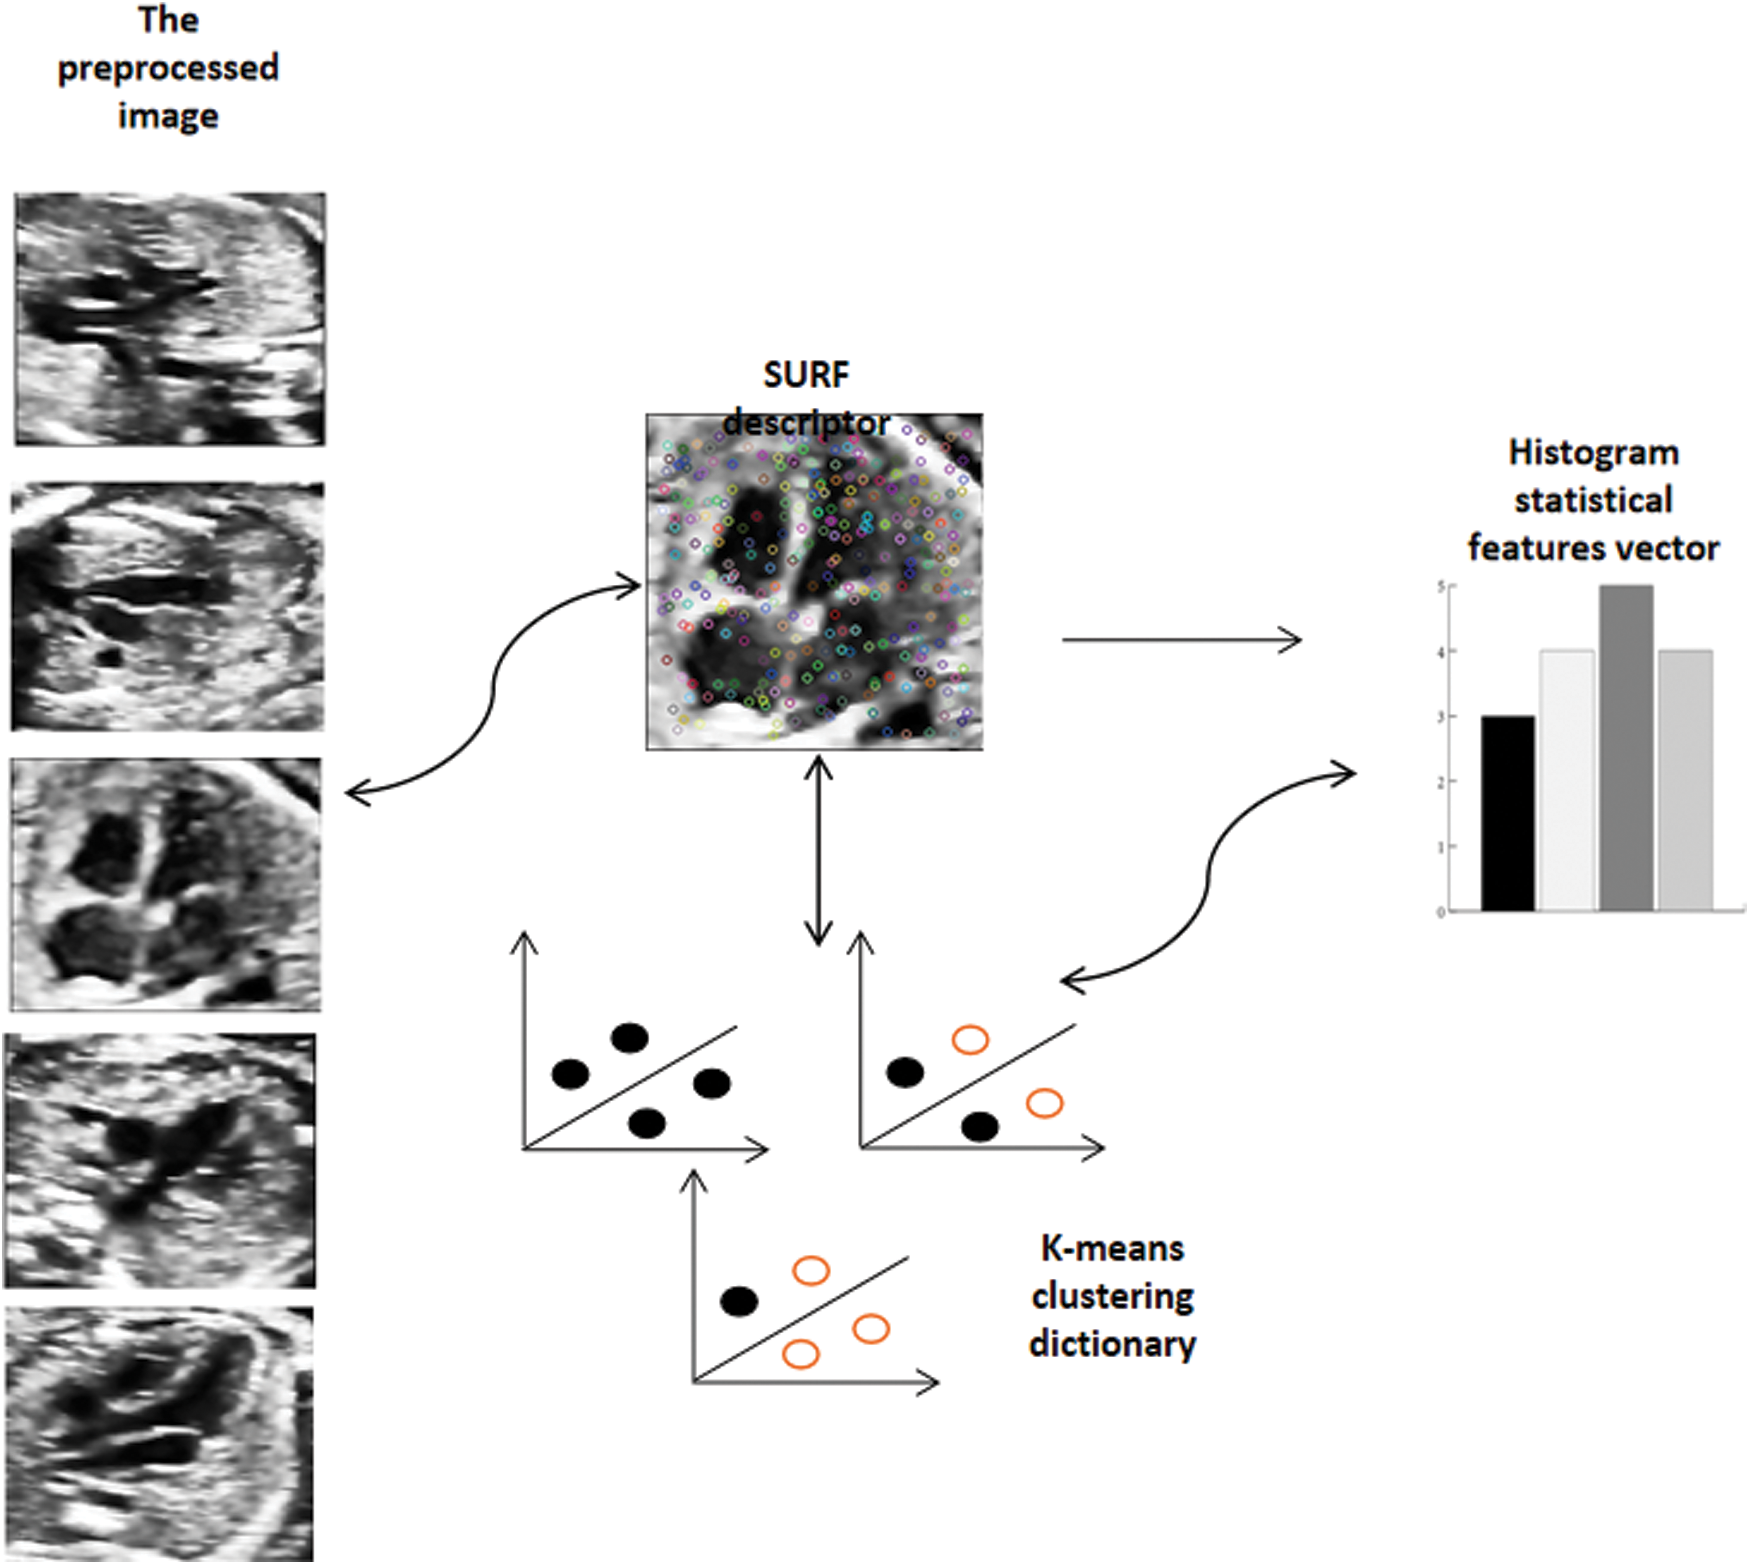
Figure 6: Carry out K-means clustering on the extracted SURF feature descriptors, cluster them into a visual dictionary, and extract the visual word bag features according to the distance between each feature descriptor and the cluster center
3.3 Feature Fusion and Feature Selection
At the end of the feature extraction stage, each picture can extract the three feature vectors in the upper part as 1 * M, 1 * N and 1 * P, where 1 represents the number of pictures, and M, N and P represent the feature vectors extracted by the three feature extraction methods above. There are three situations of feature fusion, which are feature fusion in feature layer, feature score layer and classification layer. In this study, the fusion at feature layer is adopted, but the reason why the fusion at feature score layer is not adopted is because the experimental results are not good after normalization. The reason why the classification layer is not adopted is that this method has a great influence on the actual verification results. In this study, the three feature vectors above are operated in series. Finally, the features extracted from a single picture are changed into 1 * (M + N + P) complex feature vectors. PCA [38] was adopted to reduce the dimension and remove the redundant features, thereby increasing the training speed, reducing the testing time and improving the efficiency of this model.
3.4 Multiclassification Classifier
Support vector machines (SVM) [39], as one of the best classifiers in traditional methods, has an unshakable position in the field of target recognition and classification. SVM uses statistical learning theory and the structural risk minimization principle to find the global optimal solution. Traditional SVM is a binary classification model, which maps the provided feature vectors to a plane. Its purpose is to find the hyperplane that best distinguishes two types, so as to classify the two types. However, this study studies the problem of five classifications, adopting a one-to-many scheme, which takes one class as A first and the other classes as B. After five experiments in turn, five two-classified SVM classifiers are obtained, and the purpose of five classifications is achieved after combination.
In the formula above,
In this experiment, the computer configuration is as follows: Intel(R)Core(TM)i7-10700K is used as CPU, NVIDIA GeForce GTX-1080Ti is used as GPU, with 16 G video memory and 32G memory, 64-bit Windows10 as computer operating system, MATLABR2018b and PyCharm 2020.2.2 x64 as programming software.
Important evaluation indexes for the multi-classification model used are accuracy, precision and recall. They are used for testing the advantages and disadvantages of the algorithm model. However, in some scenarios, there are some contradictions in the operation modes of recall rate and precision rate. Here, we introduce the commonly used comprehensive evaluation index F-Measure, which is the weighted harmonic average of precision rate and recall rate. The higher the F value, the more effective the model is. The above evaluation indexes are given in the following corresponding calculation formulas:
True Positive (TP) refers to the number that has been correctly classified after testing. False Positive (FP) refers to the number of non-classes that have been wrongly classified by experiments. True negative (TN) refers to the number of non-native classes that have been correctly classified by experiments. False Negative (FN) refers to the number that has been wrongly classified by experiments.
In our limited data set, we divide the data set into five parts A, B, C, D and E by five-fold cross validation. The model is trained through the flowchart in Fig. 3 the experimental results show that the overall recognition average accuracy of this model for FHUSP is as high as 87.35%, the average precision is 87.94%, the average recall is 87.43%, and the F1 coefficient is 87.58%, Table 3 shows the detailed results of five-fold cross validation. From the analysis of the results, it can be seen that the overall model effect is above 85%. In order to better distinguish the advantages and disadvantages of this model, the experimental performances of this model and other known models are carried out, respectively.

As this model adopts multiple fusion models, this comparative experiment is mainly compared with a single model and the deep learning model, which has been successfully applied to FHUSP at present. The experiment is carried out in the same environment with the same data. Table 4 shows the experimental comparison between this model and LBP [31], HOG [32], BOW model [35,37], LBP+HOG [27], Res-Net18 [5] and Sono-Net32 [20].
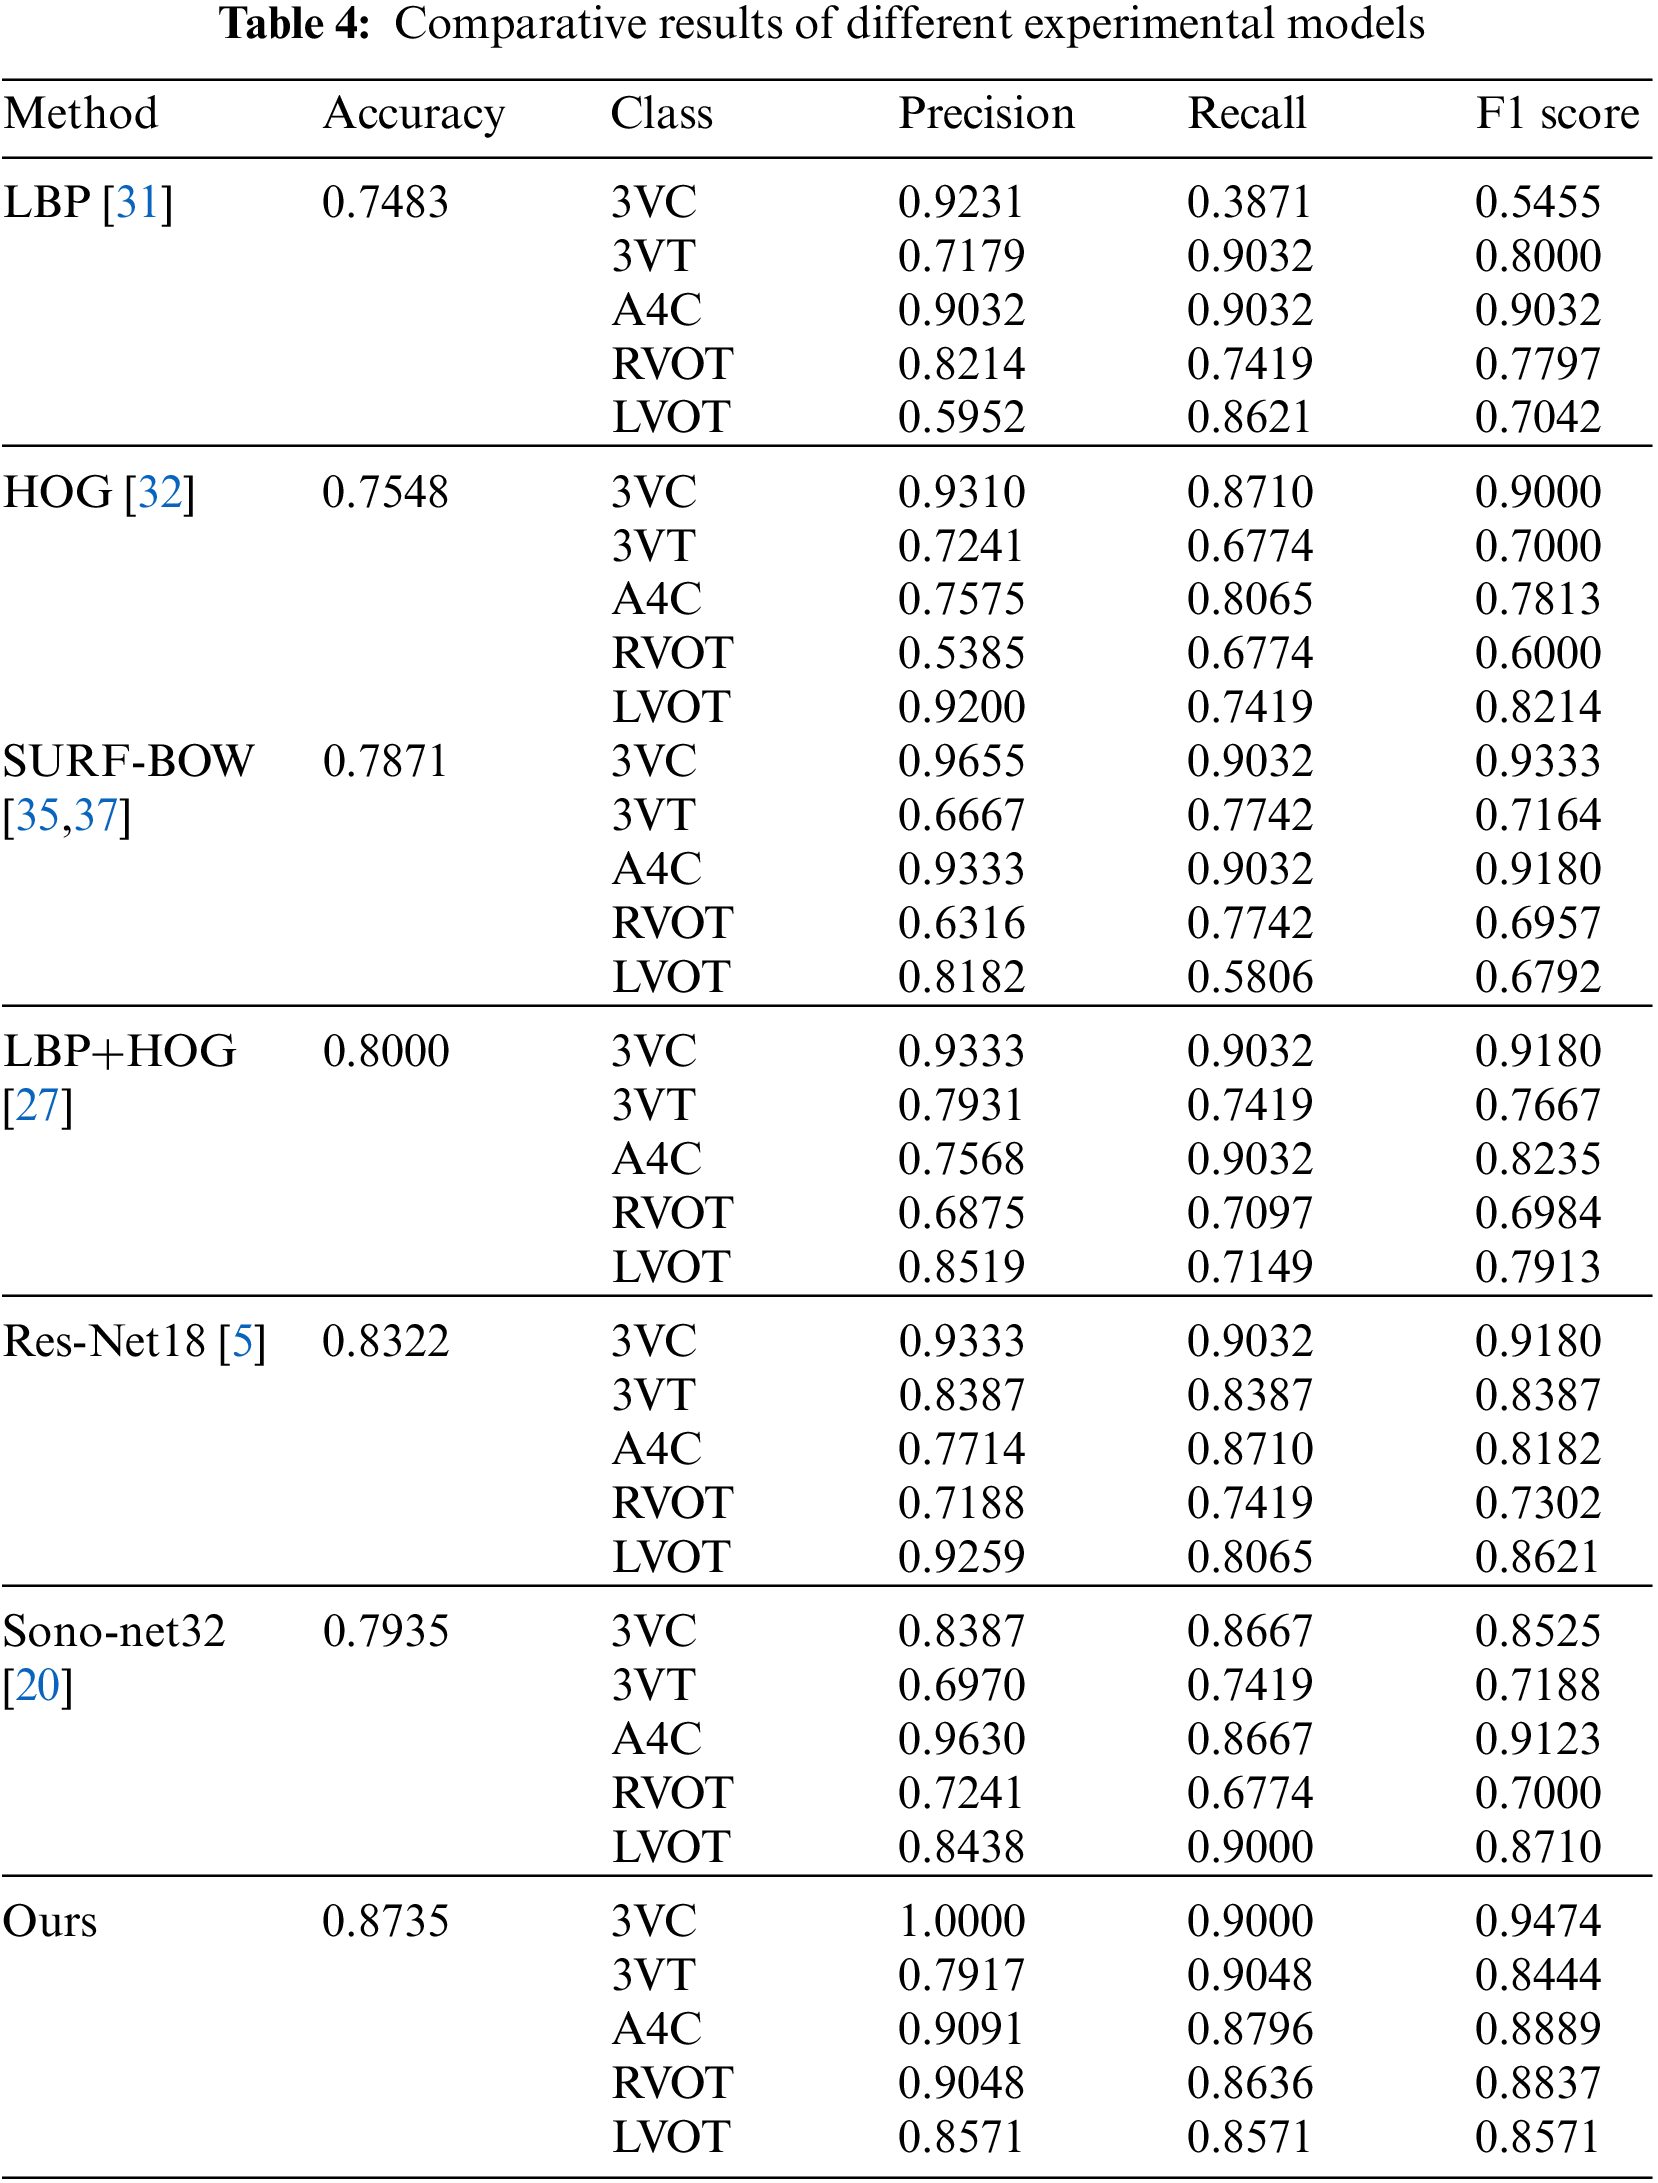
It can be seen from each evaluation index that the model adopted in this experiment had achieved very good results. The accuracy rate of the model proposed in this study was 87.35%, which is the result of parameter optimization. It is carried out when the clustering center of word bags is 400, and the Cellsize of LBP and HOG is [30 * 30]. The accuracy rate is much higher than that of single models such as LBP, HOG and the visual word bag model. Experiments show that the performance of this method is excellent.
Compared with the method of deep learning Res-Net18 [5] and Sono-Net32 [20], all the evaluation indexes in this paper are slightly lower than Sono-Net32 in A4C plane and are improved in the other four planes. In the process of classification, this study has the same problems as Sono-Net32, and the accuracy of 3VT and RVOT planes has declined. To analyze the reason:
1. The overall structure of A4C plane is easy to identify, and it is composed of four independent atria and ventricles. Compared with the other four planes, the features that the model needs to extract are more comparative. Although the medium-term training of Sono-Net32 takes a lot of time, the deep learning of Sono-Net32 is more like a black box, and the extracted depth features are more abundant, which is unmatched by our model.
2. Because there are similar anatomical structures between 3VT and RVOT, which can be observed through (a) and (d) of Fig. 1, which leads to the misjudgment of the experimental model in real classification. In the later communication with professional sonographers we also confirmed this point. The observed anatomical structure 3VT is composed of (main pulmonary artery, ascending aorta, superior vena cava), and RVOT is composed of (main pulmonary artery, aortic arch, superior vena cava). After being confirmed by medical standards, the similarity between these two planes is very high.
3. Different from Res-Net18, it has achieved excellent results in Nature medicine, and the accuracy of classification has reached 99%. The number of images collected by the laboratory of the University of California, San Francisco has reached 107,823. Our experiments show that deep learning is excellent in identifying large samples, but the effect of deep learning on small and medium samples is not good enough. In the process of reappearance, it takes 6–8 h for Res-Net18 to train and test data, and there may be a problem of hardware configuration. Under the condition of the same data set, this model should be completely superior to Res-Net18. After expanding the data set in the future, we will continue to explore different series of networks such as Res-Net50 and Res-Net101.
Next, the parameter optimization of this model will be discussed.
4.5 Parameter Optimization Experiment
4.5.1 Cellsize Optimization of Texture Features
LPB and HOG feature extraction methods are designed to extract local texture features by dividing the image into several independent cell operators, so texture features are essentially the distribution features between pixels and the design of cell operator size directly determines the quality of texture features extracted later. Therefore, in this study, the optimal parameters of the cell operator are extracted experimentally. The experimental range is from [20 * 20] to [30 * 30], as one value is taken every two steps. Twelve experiments are carried out on the basis of keeping the bag clustering center of the visual bag model at 400. The specific experimental results and average indexes are shown in Table 5.
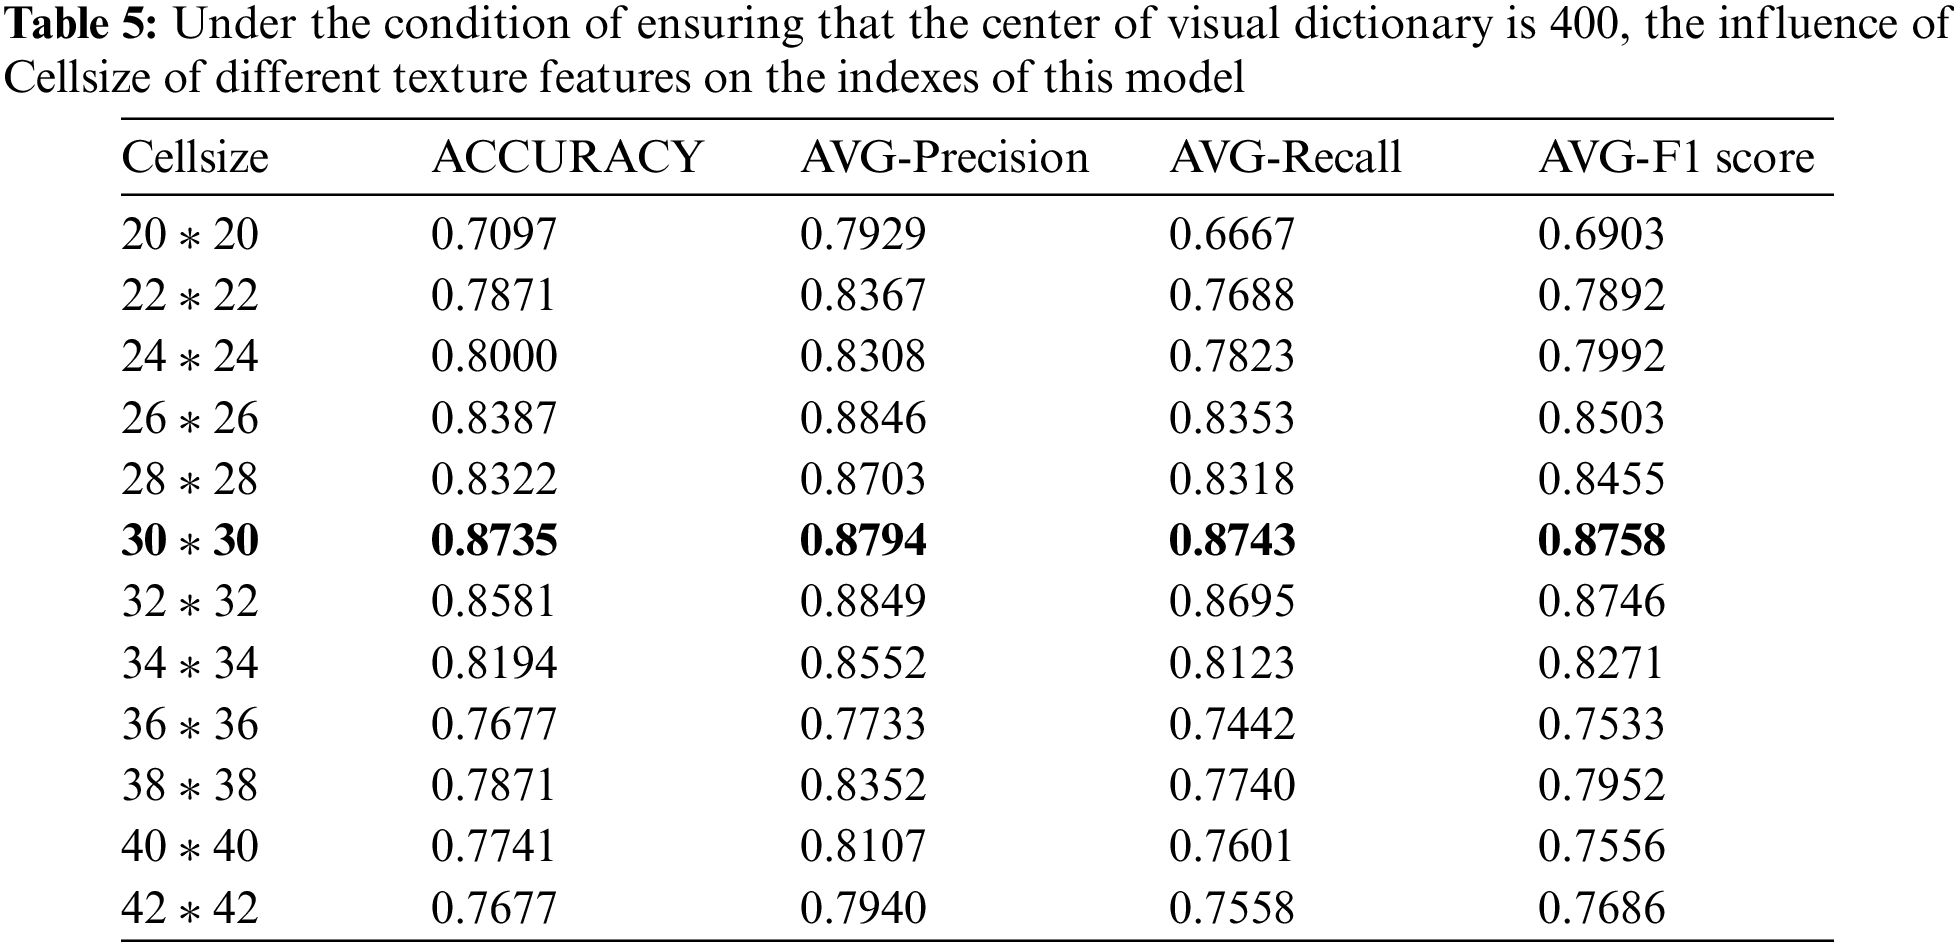
After 12 rounds of parameter training, the optimal operator is obtained when the value of the cell operator is [30 * 30]. Experimental results show that the cell operator with LPB and HOG features is an index that affects the performance of the model and presents a benign change trend to the experimental results.
4.5.2 Optimization of Bow Center
In this part, we have conducted parameter optimization experiments aiming at the influence of visual word bag center size on classification performance. The word bag model in the algorithm adopted in this study takes K-means algorithm as the clustering core of visual word bags, and the performance index based on the word bag model is determined by the K value of the clustering center point. The size of the word bag center directly determines the distance between the extracted SURF feature descriptor and the center point, which will lead to the performance of extracting visual dictionary features from dictionaries. The experimental range of adjusting the center of the word bag is 50–600 center points, and 12 rounds of experiments are carried out with every 50 steps in turn (experiments are carried out on the basis of keeping LPB and HOG cell operators as [30 * 30]). The specific experimental results are shown in Table 6.
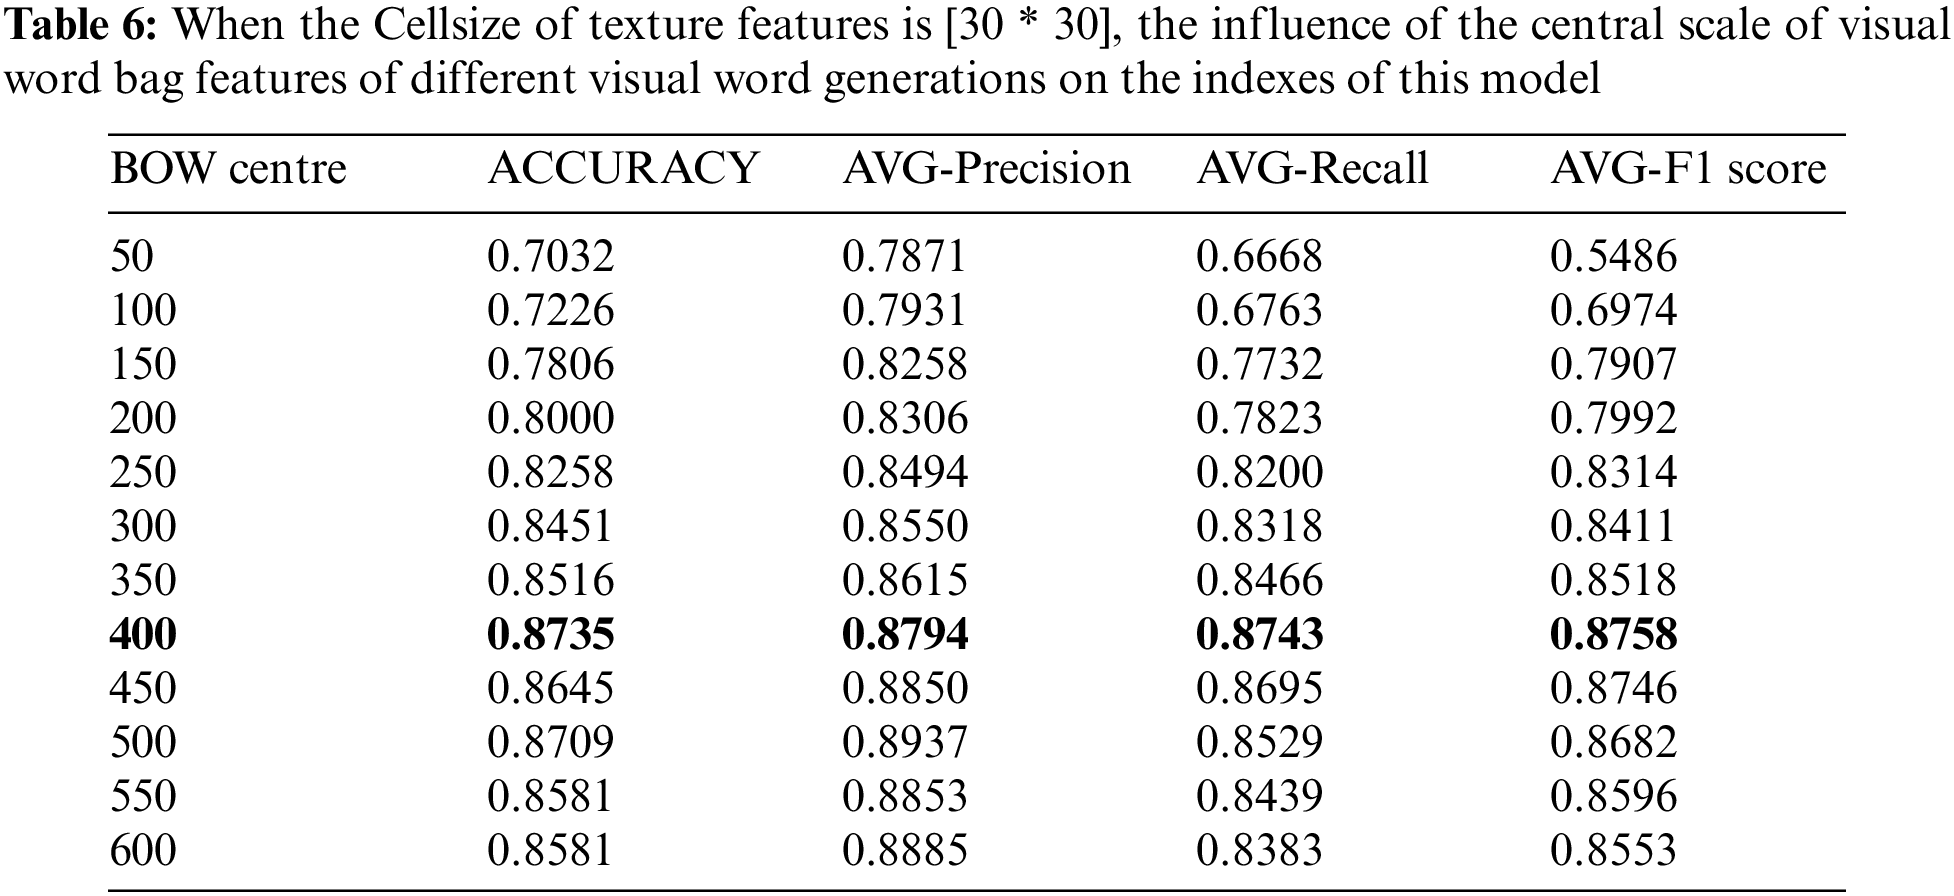
It can be seen from Table 6 of the above-mentioned changes in the size of the center of the word bag, that when the center changes from small to large, all the evaluation indicators will show an upward trend. When the cluster center is 400, the best indexes are obtained. When the size of the word bag continues to transition, this index tends to be stable and fluctuates between 85% and 87%. It can be proved by experiments that the size of the center of the word bag affects the performance of the classifier. When the center of the word bag is small, there are few center points. Therefore, when calculating the distance between the feature descriptor and the small word bag, many descriptors are replaced, resulting in poor classification performance. When the center of the word bag reaches a certain scale, the classification performance is gradually optimized and tends to a stable trend.
4.6 Abnormal and Normal Plane Classification Experiment
During the later evaluation, we further verified the recognition performance of the model in normal and abnormal fetal heart sections. Similarly, in this supplementary experiment, we took the same steps as Fig. 3 In the case of five-fold cross validation, the results are shown in Table 7.
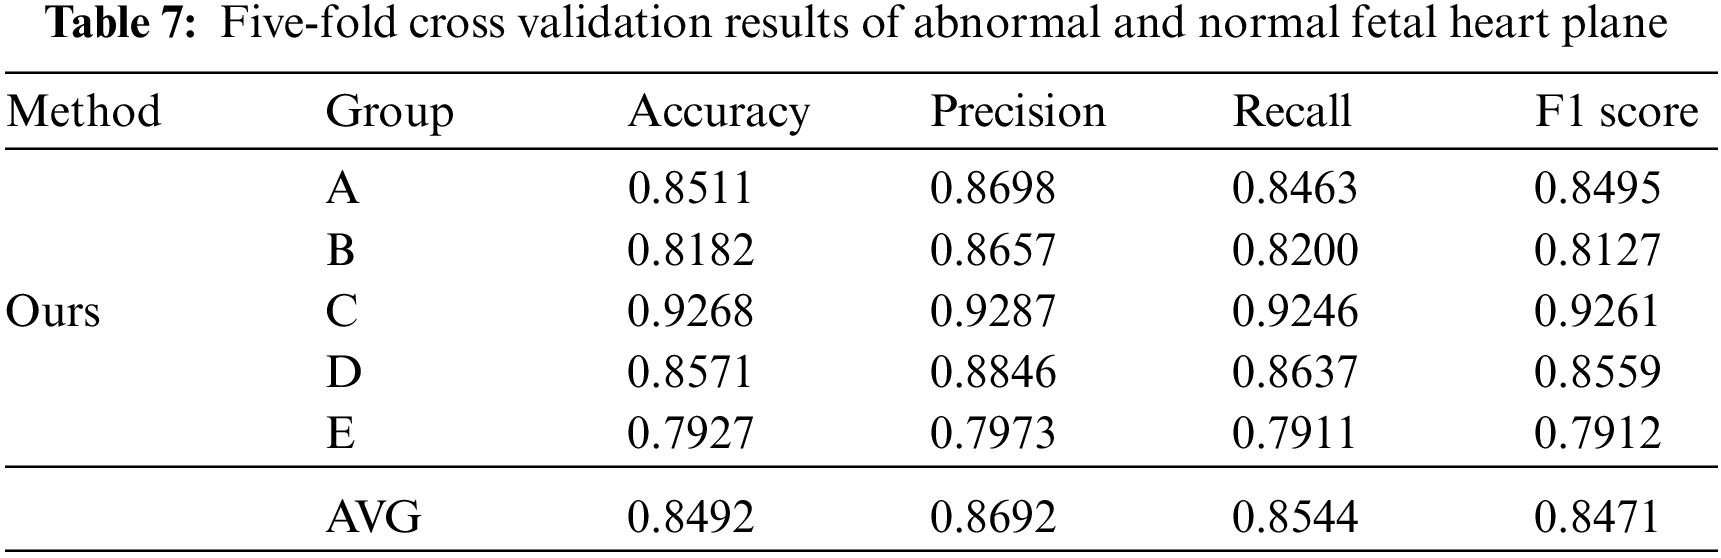
The results of the five-fold cross validation show that the average accuracy of the model in identifying abnormal and normal planes has reached 84.92%. Through the later analysis with professional sonographers, this result is superior to the diagnosis results of most junior sonographers, which further proves the advantages of the model and can provide some reference value for sonographers to diagnose congenital heart disease.
Prenatal 2D ultrasound is one of the important methods to check fetal congenital heart defects at present. At present, sonographers have found that 9–11 ultrasonic planes of fetal heart are very important in the examination of fetal congenital heart defects. The most fetal heart structural malformations can be screened and diagnosed through these planes. In the process of clinical screening:
1. The number of pregnant women who do prenatal screening every day is large, and the qualifications of different sonographers are different.
2. The fetal heart is different from other organs. Factors such as the small size of the fetal heart and the fetal position makes it difficult to scan FHUSP.
This requires sonographers to spend more time observing with human eyes. Based on this, the study puts forward a classification model of FHUSP with faster speed and more accurate classification effect, which is promising in the future and has the potential to be used in clinics to provide help to sonographers.
Experiments show that the proposed texture features combined with visual BOW can effectively and accurately classify FHUSP. The classification model of machine learning based on traditional methods is not a black box like deep learning in the model. It can make greater use of the characteristics of feature methods to solve problems for extracted features. To a great extent, it solves the problems of training difficulties, complex processes and slow operation caused by deep learning in the process of training and testing, while achieving accurate classification while ensuring efficiency.
However, there are still some shortcomings in this study, which will be the goal of the later research. First, this study uses the classification model. Whether it is the modification of the model method or the application of different ultrasound fetal standard planes, the model in this study is worth further digging. Studying more representative models will be the focus and core of the later period. Secondly, it is necessary to identify the specific anatomical structure of different standard planes, explore the design of the identification and positioning model, find standard and non-standard planes, provide risk assessment for congenital heart defect pathology, and provide favorable auxiliary conditions for the diagnosis and treatment of congenital heart defects in the later stage. Finally, we will continue to collect enough data to build a larger database of FHUSP.
In this study, an effective automatic recognition and classification model of 2D FHUSP based on texture features and visual BOW is proposed. This is used to improve the automatic classification performance of FHUSP, and can solve the inconvenience caused by prenatal fetal screening more quickly and accurately at this stage. First, 788 images of FHUSP were preprocessed to reduce speckle noise and enhance the contrast of ROI. Then, the preprocessed image is subjected to texture feature extraction (Local Binary Pattern (LBP) and Histogram of Oriented Gradient (HOG)) and visual BOW extraction. Next, the extracted texture features and visual BOW are fused. Because the high-dimensional redundant features will affect the classification efficiency, the fused features are selected by principal component analysis (PCA). Finally, Support Vector Machine (SVM) is used to learn the processed features to classify FHUSP. Compared with some other methods and the single method model, the classification accuracy of our model has been obviously improved, with the highest accuracy reaching 87.35%. Similarly, we also verify the performance of the model in normal and abnormal planes, and the average accuracy in classifying abnormal and normal planes is 84.92%. Experiments show that the model proposed in this study can effectively identify and classify FHUSP images, which lays a foundation for the automatic standardization of prenatal fetal ultrasound examination procedures, so it is worthy of further exploration. In addition, this method can effectively save manpower and time to improve work efficiency in clinical work. It is also expected to provide more concise training and learning methods for junior qualified sonographers.
Funding Statement: This work was supported by Fujian Provincial Science and Technology Major Project (No. 2020HZ02014); by the grants from National Natural Science Foundation of Fujian (2021J01133, 2021J011404); by the Quanzhou Scientific and Technological Planning Projects (Nos. 2018C113R, 2019C028R, 2019C029R, 2019C076R and 2019C099R).
Conflicts of Interest: The authors declare that they have no conflicts of interest to report regarding the present study.
References
1. Cao, J., Wu, X., Chen, J., Zhang, H., Wang, H. et al. (2021). Stay true to our original aspiration and founding mission: The creation and inheritance of the congenital heart desease in China. Chinese Journal of Cardiovascular Research, 19(7), 577–581. [Google Scholar]
2. Xu, Y., Ru, T., Hu, Y., Gu, Y., Yang, Y. et al. (2016). Quality control of fetal images in the assessment of traine ecompetence at second-trimester structure screening. Progress in Obstetrics and Gynecology, 25(8), 589–592. [Google Scholar]
3. Li, S., Wen, H. (2010). Fetal anatomic ultrasound sections and their values in the second-trimester of pregnancy. Chinese Journal of Medical Ultrasound (Electronic Edition), 7(3), 366–381. [Google Scholar]
4. International Society of Ultrasound in Obstetrics & Gynecology (2006). Cardiac screening examination of the fetus: Guidelines for performing the ‘basic’ and ‘extended basic’ cardiac scan. Ultrasound in Obstetrics and Gynecology, 27(1), 107–113. [Google Scholar]
5. Arnaout, R., Curran, L., Zhao, Y., Levine, J., Chinn, E. et al. (2021). An ensemble of neural networks provides expert-level prenatal detection of complex congenital heart disease. Nature Medicine, 27(5), 882–891. [Google Scholar]
6. Carvalho, J. S., Allan, L. D., Chaoui, R., Copel, J. A., DeVore, G. R. et al. (2013). ISUOG Practice Guidelines (updatedSonographic screening examination of the fetal heart. Ultrasound in Obstetrics & Gynecology, 41(3), 348–359. DOI 10.1002/uog.12403. [Google Scholar] [CrossRef]
7. Lee, W., Allan, L., Carvalho, J. S., Chaoui, R. (2008). ISUOG consensus statement: What constitutes a fetal echocardiogram? Ultrasound in Obstetrics and Gynecology, 32(2), 239–242. DOI 10.1002/uog.6115. [Google Scholar] [CrossRef]
8. Zhang, M., Liu, X., Xu, D., Cao, Z., Yu, J. (2013). Vision-based target-following guider for mobile robot. IEEE Transactions on Industrial Electronics, 66(12), 9360–9371. DOI 10.1109/TIE.2019.2893829. [Google Scholar] [CrossRef]
9. Sun, Y., Wang, X., Tang, X. (2013). Deep convolustional network cascade for facial point detection. 2013 IEEE Conference on Computer Vision and Pattern Recognition, pp. 3476–3483. Portland, America. [Google Scholar]
10. Thadeshwar, H., Shah, V., Jain, M., Chaudhari, R., Badgujar, V. (2020). Artificial intelligence based self-driving car. 2020 4th International Conference on Computer, Communication and Signal Processing (ICCCSP), pp. 1–5. Chennai, India. [Google Scholar]
11. Clemente, C., Pallotta, L., Gaglione, D., Maio, A. D., Soraghan, J. J. (2017). Automatic target recognition of military vehicles with krawtchouk moments. IEEE Transactions on Aerospace and Electronic Systems, 53(1), 493–500. DOI 10.1109/TAES.2017.2649160. [Google Scholar] [CrossRef]
12. Liu, X. P., Yang, X., Wu, L. P., Sun, K. (2008). Automatic search for the best cross-sections of the three-dimensional_ultrasound image of heart by template matching. Journal of Biomedical Engineering, 25(3), 491–496. [Google Scholar]
13. Ni, D., Li, T., Yang, X., Qin, J., Li, S. et al. (2013). Selective search and sequential detection for standard plane localization in ultrasound. International MICCAI Workshop on Computational and Clinical Challenges in Abdominal Imaging, 8191, 203–211. [Google Scholar]
14. Zhang, L., Chen, S., Chin, C. T., Wang, T., Li, S. (2012). Intelligent scanning: Automated standard plane selection and biometric measurement of early gestational sac in routine ultrasound examination. Medical Physics, 39(8), 5015–5027. [Google Scholar]
15. Lei, B., Liu, Z., Chen, S., Li, S., Wang, T. (2014). Automatic recognition of fetal standard plane in ultrasound image. 2014 IEEE 11th International Symposium on Biomedical Imaging (ISBI), pp. 85–88. Beijing, China. [Google Scholar]
16. Lei, B., Tan, E. L., Chen, S., Zhuo, L., Li, S. et al. (2015). Automatic recognition of fetal facial standard plane in ultrasound image via fisher vector. PLoS One, 10(5), 1–20. DOI 10.1371/journal.pone.0121838. [Google Scholar] [CrossRef]
17. Christopher, P. B. A., Christos, I. B., Noble, J. A. (2017). Automated annotation and quantitative description of ultrasound videos of the fetal heart. Medical Image Analysis, 36(3), 147–161. DOI 10.1016/j.media.2016.11.006. [Google Scholar] [CrossRef]
18. Oktay, O., Bai, W., Guerrero, R., Ra Jchl, M., Marvao, A. D. et al. (2017). Stratified decision forests for accurate anatomical landmark localization in cardiac images. IEEE Transactions on Medical Imaging, 36(1), 332–342. DOI 10.1109/TMI.2016.2597270. [Google Scholar] [CrossRef]
19. Huang, Q., Fan, Z., Li, X. (2018). Machine learning in ultrasound computer-aided diagnostic systems: A survey. BioMed Research International, 2018(7), 1–10. DOI 10.1155/2018/5137904. [Google Scholar] [CrossRef]
20. Liu, F., Zhang, J., Yang, H. (2018). Research progress of medical image recognition based on deep learning. Chinese Journal of Biomedical Engineering, 37(1), 86–94. [Google Scholar]
21. Chen, H., Ni, D., Qin, J., Li, S., Yang, X. et al. (2015). Standard plane localization in fetal ultrasound via domain transferred deep neural networks. IEEE Journal of Biomedical and Health Informatics, 19(5), 1627–1636. DOI 10.1109/JBHI.2015.2425041. [Google Scholar] [CrossRef]
22. Baumgartner, C. F., Kamnitsas, K., Matthew, J., Fletcher, T. P., Smith, S. et al. (2017). SonoNet: Real-time detection and localisation of fetal standard scan planes in freehand ultrasound. IEEE Transactions on Medical Imaging, 36(11), 2204–2215. DOI 10.1109/TMI.2017.2712367. [Google Scholar] [CrossRef]
23. Chen, H., Ni, D., Qin, J., Li, S., Yang, X. et al. (2017). Ultrasound standard plane detection using a composite neural network framework. IEEE Transactions on Cybernetics, 47(6), 1576–1586. DOI 10.1109/TCYB.2017.2685080. [Google Scholar] [CrossRef]
24. Lin, Z., Li, S., Ni, D., Liao, Y., Lei, B. (2019). Multi-task learning for quality assessment of fetal head ultrasound images. Medical Image Analysis, 58, 1361–8415. DOI 10.1016/j.media.2019.101548. [Google Scholar] [CrossRef]
25. Wang, J., Liu, X., Wang, F., Zheng, L., Wang, B. (2021). Automated interpretation of congenital heart disease from multi-view echocardiograms. Medical Image Analysis, 69, 1361–8415. DOI 10.1016/j.media.2020.101942. [Google Scholar] [CrossRef]
26. Pu, B., Li, K., Li, S., Zhu, N. (2021). Automatic fetal ultrasound standard plane recognition based on deep learning and IIoT. IEEE Transactions on Industrial Informatics, 17(11), 7771–7780. DOI 10.1109/TII.2021.3069470. [Google Scholar] [CrossRef]
27. Wang, X., Liu, Z., Du, Y., Diao, Y., Zhang, H. (2021). Recognition of fetal facial ultrasound standard plane based on texture feature fusion. Computational and Mathematical Methods in Medicine, 2021(2), 1–12. DOI 10.1155/2021/4530180. [Google Scholar] [CrossRef]
28. Rahmatullah, B., Papageorghiou, A. T., Noble, J. A. (2012). Integration of local and global features for anatomical object detection in ultrasound. Medical Image Computing and Computer-assisted Intervention: MICCAI. International Conference on Medical Image Computing and Computer-Assisted Intervention, pp. 402–409. France, Nice. [Google Scholar]
29. Maraci, M., Napolitano, R., Papageorghiou, A. T., Noble, J. A. (2014). P22.03: Searching for structures of interest in an ultrasound video sequence with an application for detection of breech. Ultrasound in Obstetrics & Gynecology, 44(S1), 315. DOI 10.1002/uog.14429. [Google Scholar] [CrossRef]
30. Ohtake, Y., Belyaev, A. G., Seidel, H. P. (2002). Mesh smoothing by adaptive and anisotropic gaussian filter applied to mesh normals. Proceedings of the Vision, Modeling, and Visualization Conference 2002, Erlangen, Germany. [Google Scholar]
31. Ojala, T., Pietikäinen, M., Harwood, D. (1996). A comparative study of texture measures with classification based on featured distributions. Pattern Recognition, 29(1), 51–59. DOI 10.1016/0031-3203(95)00067-4. [Google Scholar] [CrossRef]
32. Dalal, N., Triggs, B. (2005). Histograms of oriented gradients for human detection. 2005 IEEE Computer Society Conference on Computer Vision and Pattern Recognition (CVPR’05), vol. 1, pp. 886–893. San Diege, CA, USA. [Google Scholar]
33. David Lowe, G. (1999). Object recognition from local scale-invariant features. Proceedings of the Seventh IEEE International Conference on Computer Vision, vol. 2, pp. 1150–1157. Kerkyra, Greece. [Google Scholar]
34. David Lowe, G. (2004). Distinctive image features from scale-invariant keypoints. International Journal of Computer Vision, 60(2), 91–110. DOI 10.1023/B:VISI.0000029664.99615.94. [Google Scholar] [CrossRef]
35. Herbert, B., Andreas, E., Tinne, T., Luc, V. G. (2008). Speeded-up robust features (SURF). Computer Vision and Image Understanding, 110, 346–359. [Google Scholar]
36. Zhang, Y., Jin, R., Zhou, Z. H. (2004). Understanding bag-of-words model: A statistical framework. International Journal of Machine Learning and Cybernetics, 1(1–4), 43–52. DOI 10.1007/s13042-010-0001-0. [Google Scholar] [CrossRef]
37. Zhang, Y., Jin, R., Zhou, Z. H. (2018). From BoW to CNN: Two decades of texture representation for texture classification. International Journal of Computer Vision, 127(1), 74–109. [Google Scholar]
38. Abdi, H., Williams, L. J. (2010). Principal component analysis. Wiley Interdisciplinary Reviews Computational Statistics, 2(4), 433–459. DOI 10.1002/wics.101. [Google Scholar] [CrossRef]
39. Chang, C. C., Lin, C. J. (2011). LIBSVM: A library for support vector machines. ACM Transactions onIntelligent Systems and Technology, 2(3), 1–27. DOI 10.1145/1961189.1961199. [Google Scholar] [CrossRef]
Cite This Article
 Copyright © 2023 The Author(s). Published by Tech Science Press.
This work is licensed under a Creative Commons Attribution 4.0 International License , which permits unrestricted use, distribution, and reproduction in any medium, provided the original work is properly cited.
 Downloads
 Citation Tools