
 Submit a Paper
 Propose a Special lssue
 Open Access
ARTICLE

An Analysis Model of Learners’ Online Learning Status Based on Deep Neural Network and Multi-Dimensional Information Fusion
1 College of Computer and Information Science, Chongqing Normal University, Chongqing, 401331, China
2 Chongqing Engineering Research Center of Educational Big Data Intelligent Perception and Application, Chongqing, 401331, China
* Corresponding Author: Yan Wei. Email:
(This article belongs to the Special Issue: Enabled and Human-centric Computational Intelligence Solutions for Visual Understanding and Application)
Computer Modeling in Engineering & Sciences 2023, 135(3), 2349-2371. https://doi.org/10.32604/cmes.2023.022604
Received 17 March 2022; Accepted 12 July 2022; Issue published 23 November 2022
 View Full Text
 Download PDF
Abstract
The learning status of learners directly affects the quality of learning. Compared with offline teachers, it is difficult for online teachers to capture the learning status of students in the whole class, and it is even more difficult to continue to pay attention to students while teaching. Therefore, this paper proposes an online learning state analysis model based on a convolutional neural network and multi-dimensional information fusion. Specifically, a facial expression recognition model and an eye state recognition model are constructed to detect students’ emotions and fatigue, respectively. By integrating the detected data with the homework test score data after online learning, an analysis model of students’ online learning status is constructed. According to the PAD model, the learning state is expressed as three dimensions of students’ understanding, engagement and interest, and then analyzed from multiple perspectives. Finally, the proposed model is applied to actual teaching, and procedural analysis of 5 different types of online classroom learners is carried out, and the validity of the model is verified by comparing with the results of the manual analysis.Keywords
Due to the rapid development of Internet technology, network users are also increasing. According to Cisco’s “Visual Network Index-Global Mobile Data Traffic Forecast”. The number of global mobile device users will increase to 5.4 billion in 2020, accounting for 70% of the world’s total population. According to the “China Internet Development Report (2021)”, by 2021, the number of online education users in China will reach 342 million, accounting for 34.6% of the total netizens. It can be seen that with the integration and development of Internet technology and education, informatization will lead to the development of education and promote the innovation of education [1], online learning will become an indispensable way for students today. Compared with traditional education, online education places more emphasis on learners’ autonomous learning. Take synchronous distance teaching as an example, due to its special teaching method and numerous learners, teachers cannot intuitively feel the learning status of learners, and cannot better acquire students’ learning, which will greatly reduce learning efficiency. Therefore, it is very necessary to analyze the learning status of online learners through intelligent technology, it can intuitively give feedback on the learning status of learners, effectively help teachers to regulate teaching strategies and optimize teaching design. At present, the analysis of the learning status of learners is mainly carried out by means of human eye observation or machine algorithm [2]. Through the collection of a large amount of data, it is found that most researchers analyze the learning status unilaterally through single-dimensional or multi-dimensional information. However, much detection information is associated with multiple learning states. For example, learning emotion can not only reflect the learner’s learning engagement state, but also the state of interest and understanding. Therefore, it is necessary to find the connection and definition between the three and analyze it from multiple angles.
In order to make the detection more accurate and the learner’s learning status assessment more comprehensive, this research made the following improvements:
(1) An analysis model of learners’ learning status in online classes is proposed, as shown in Fig. 1. According to the correlation between the test data and the learning status, this paper analyzes the students’ learning status in online class from three perspectives: the students’ understanding of class, their involvement in class and their interest in class.
(2) The quantitative methods of emotion and fatigue information were studied. On the basis of the existing methods of emotion detection and fatigue detection, the emotion information was quantified according to Wundt’s emotion theory and PAD 3D emotion model, and the fatigue information of learners was quantified according to the expert survey method. The two methods were used to describe the information related to the learning state in a numerical way.
(3) A hierarchical information fusion method adapted to this model is proposed. Existing multidimensional information fusion methods do not take into account the guidance of learning state analysis model, so it is difficult to accurately understand the learning state of learners. In this study, all secondary information under the primary information is fused first, and then the primary information is fused in a unified subjective and objective way to make the fused data more accurate and reasonable.
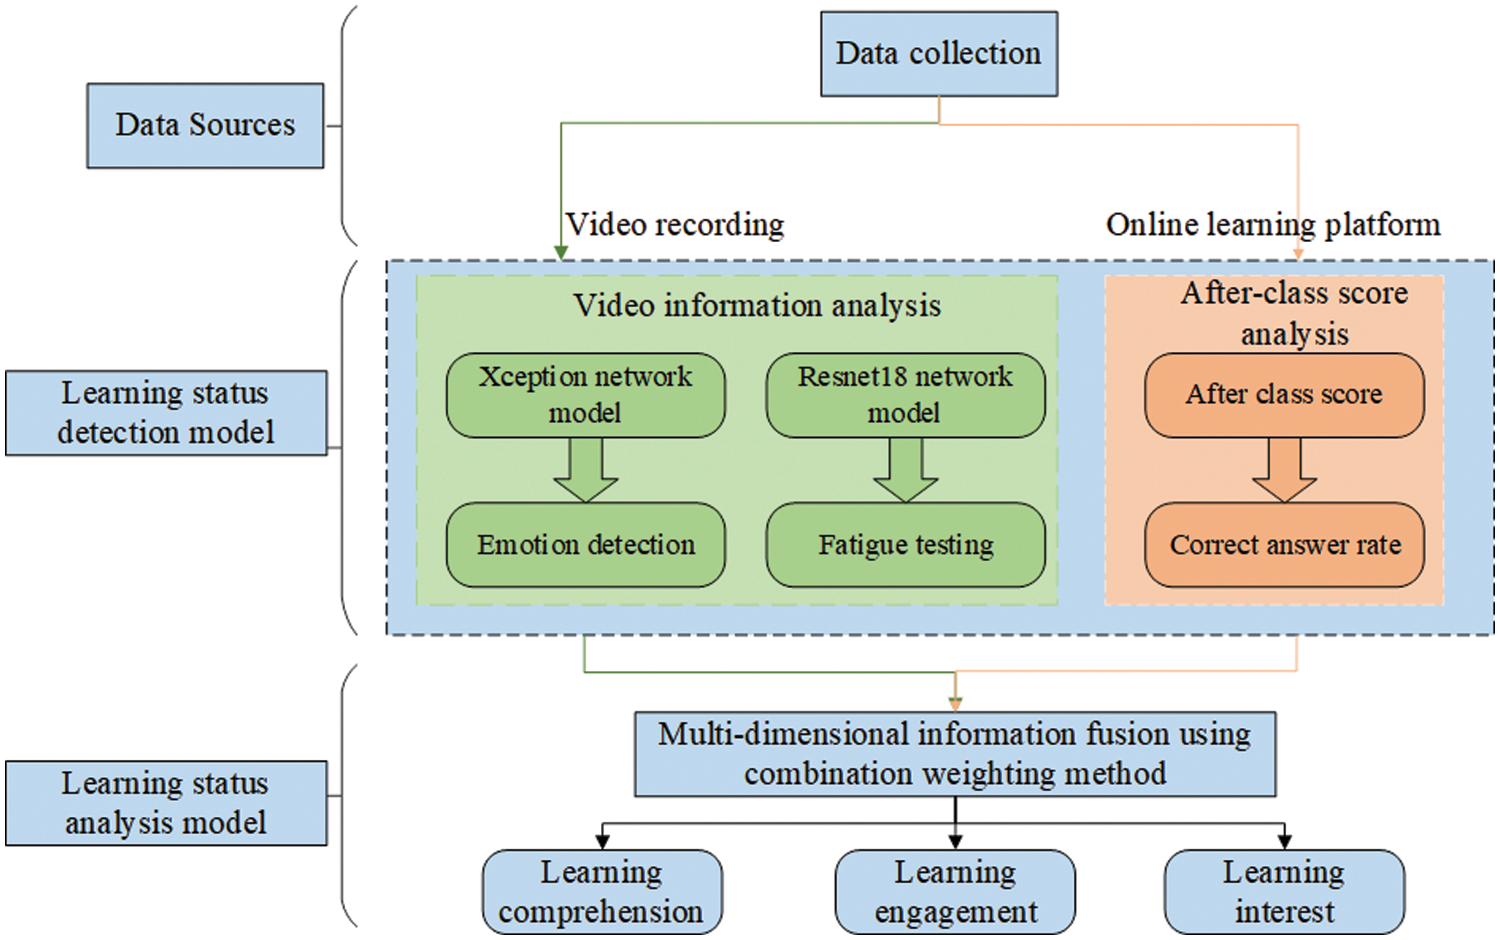
Figure 1: Learning state analysis mode
Condition analysis model based on the above study, multi-dimensional information identification, quantification, and fusion method to carry out the experiment, the experimental results show that this model can identify the differences of different learners learning state, can well reflect the learners of different learning state, at the same time, the model test results compared with the teacher’s evaluation, the feasibility and effectiveness of the method was verified.
The rest of the structure of this paper is arranged as follows. The second section summarizes the related research work on the analysis of learners’ learning state, the third section introduces the process of emotion detection and quantification, the fourth section introduces the fatigue detection process and determination method, and the fifth section introduces the multi-dimensional information fusion process and calculation method, the sixth section is to apply the model to the actual teaching for analysis, and the seventh section summarizes this article.
In this section, we mainly summarize the research status of emotion recognition or fatigue detection in the field of online education, as well as the learning status analysis of online learners by integrating multidimensional information.
Psychological studies show that emotion is a very important non-intellectual factor in teaching activities. In teaching activities, emotion cannot only affect memory, reasoning operation and problem solving, but also affect learners’ perception, hinking, executive control and decision-making. Many researchers mainly use facial expression recognition, gesture recognition, speech and text recognition or multi-modal recognition of learner emotions to evaluate learners’ learning status. D’mello et al. [3] used the AutorTutor intelligent tutoring system to extract learners’ natural dialogue features, and verified through multiple regression analysis that the dialogue features can predict learners’ learning emotions, and test their impact on learners’ learning status. Bahreini et al. [4] proposed the FILTWAM framework in 2016, which recognizes the emotional state of students in real time through expressions and tones and provides online classroom feedback, which is convenient for teachers to adjust teaching in time and promote learners’ learning. Zakka et al. [5] developed a platform that uses symbiotic neural networks to detect, predict, and analyze learners’ facial emotions, generate emotion maps of learning influence, and give feedback on learners’ level of understanding. Other ways of identifying emotions that have been explored include using sensors to detect body gestures, as well as physiological signals such as breathing and heart signals.
The fatigue state of online learners is also an important factor affecting their learning state. Most studies on the learning fatigue state of students in class are the content of education and psychology, and the application of fatigue detection technology in the field of education is limited, mainly focusing on the field of motor vehicle driving. Wood et al. [6] proposed a new UnityEyes method for rapid synthesis of variable eye region images, which combined a new 3D generation model of the eye region with a real-time rendering framework to recognize complex eye structures and eyelids. Knapik et al. [7] located the face by detecting the canthus, and determined whether there was a yawn, and ultimately determined the fatigue of the person. Gou et al. [8] proposed a method that could simultaneously detect the eye and estimate the eye state, calculating the eye region through a cascade regression algorithm, simultaneously calculating the probability of the eye being blocked by the eyelid, and iteratively calculating the eye position and the probability of the eye opening. In the field of education, many researchers have done related research on students’ eye status. Kanematsu [9] reviewed the literature on the effects of physiological data and blink times on online classrooms and distance learning, and found that blinking behavior can reflect students’ online learning. Therefore, the author believes that blinking can reflect students’ online learning performance to a certain extent. Krithika et al. [10] believed that students’ attention levels can be understood through the detection of eyes and head movements. In that paper, a system that can identify and monitor students’ emotions in an online learning environment is proposed. The system is able to assess learner engagement and interest. Dana et al. introduced a blinking system for virtual characters. Through tests, it was proved that difficult problems will make students emotionally unstable and the number of blinks will increase. Therefore, the system can analyze students’ responses well, so as to achieve better results.
However, the use of single-dimensional information to analyze the learning state detection results is not accurate enough. Some researchers use sensors or neural networks to detect learners’ emotions, gestures, and fatigue status. Kamath et al. [11] and others constructed a deep neural network (DCNN) for facial expression recognition and a deep recurrent neural network (DRNN) for the relationship between eye fixation and participation intensity to observe the learner’s interest and measure the student’s Learning participation. MIT Mota et al. [12] used pressure sensors to identify learners’ sitting postures to evaluate learners’ learning interests. Different sitting postures represent different levels of interest. Asteriadis et al. [13] used the camera to detect the learner’s head posture, eye state, and behavioral movements in the spontaneous state to evaluate the learner’s learning interest and participation. Mubarak et al. [14] and others analyzed the learner’s learning video through a deep learning model, and used the LSTM model to extract a set of invisible functions from the video click data for prediction, thereby predicting the learner’s learning performance.
To sum up, many scholars have done a lot of research on the learning emotion, learning state and learning behavior in the online learning environment. Image recognition technology and advanced detection and sensing technology are widely used in online learning, and have achieved good results. In this research, facial expression recognition and eye state recognition are performed by constructing a deep separable convolution model and a deep convolutional neural network. Finally, the fusion calculation is carried out according to the sequence changes of the learners’ facial expressions, the results of fatigue detection and the results of answering questions after class, obtaining the values of learner understanding, engagement and interest in each time period, and draw the change curve of the three at the same time.
Learning emotion is the most intuitive manifestation of a student’s learning state. Learners will show different emotions according to the difficulty of the course, their own receptive ability and the teaching method of teachers. As early as the end of the last century, the American scholar Paul Ekman’s experiment defined universal human emotions as six types, namely, anger, disgust, fear, happiness, sadness, and surprise. According to the FACS (Facial Action Coding System) proposed by Friesen et al. [15,16], studies have shown that, without interference from other factors, if the subject emits some kind of external stimulus to himself Signal or makes a certain reaction, the correct rate of reflecting the emotional state from facial expressions is 88%. According to the experimental results of psychologist Mchrabian, emotional expression = 55% of facial expressions +38% of voices +7% of words. Therefore, this research constructs a facial expression recognition model through convolutional neural networks and maps a certain expression to a certain emotion. The model construction process is shown in Fig. 2.
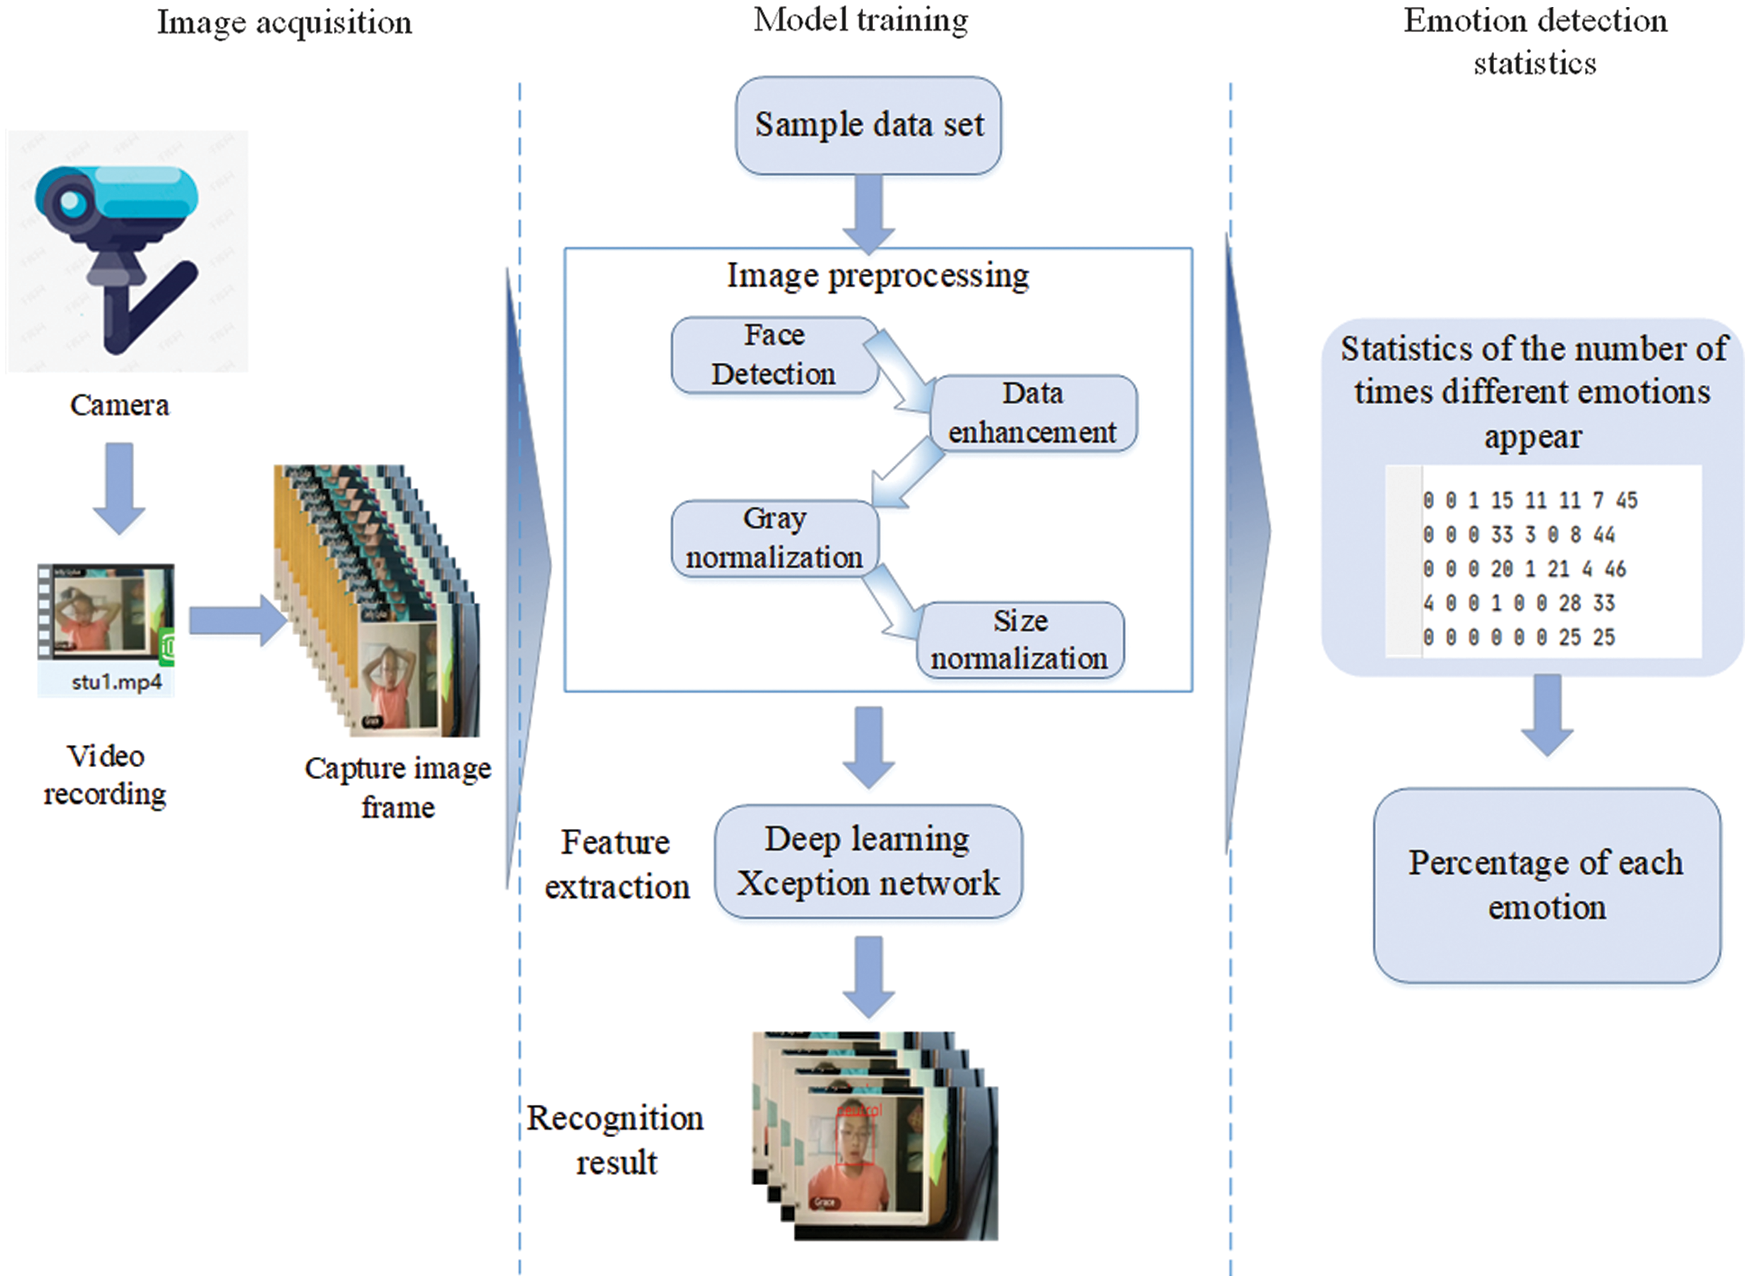
Figure 2: Flow chart of emotion detection
The emotion detection process is as follows: (1) Obtain the learning videos of learners in online classes through the camera and convert the videos into image sequences; (2) Load the face detection model and the trained expression recognition model for batch recognition of image sequences; (3) Count the recognized images in segments, and count the frequency and percentage of various expressions in each period of time. In the training process of the model, by selecting an appropriate facial expression data set and preprocessing it, the processed images are subjected to feature extraction and expression classification, and the classification method adopts the basic emotion classification proposed by Ekman.
3.1.1 Feature Extraction Model
This research builds a deep separable convolutional network model based on the Inception network proposed by Szegedy et al. [17,18], and its network structure is shown in Fig. 3. It replaces the basic Inception module in the Inception network with DW (Depthwise) convolution + PW (Pointwise) convolution, plus Residual connection, thereby improving the convergence speed and accuracy of the model. DW convolution is to perform channel-wise spatial convolution first, and then merge with PW convolution. PW convolution is also called 1 × 1 convolution and is mainly used for data dimensionality reduction. The whole network is divided into three parts, the input layer, the hidden layer and the output layer, which contains a total of 36 convolutional layers, which are divided into 14 modules, of which the hidden layer contains 8 repeated modules, in this study, the network is adjusted in combination with the input data size, and the results are shown in Fig. 3.
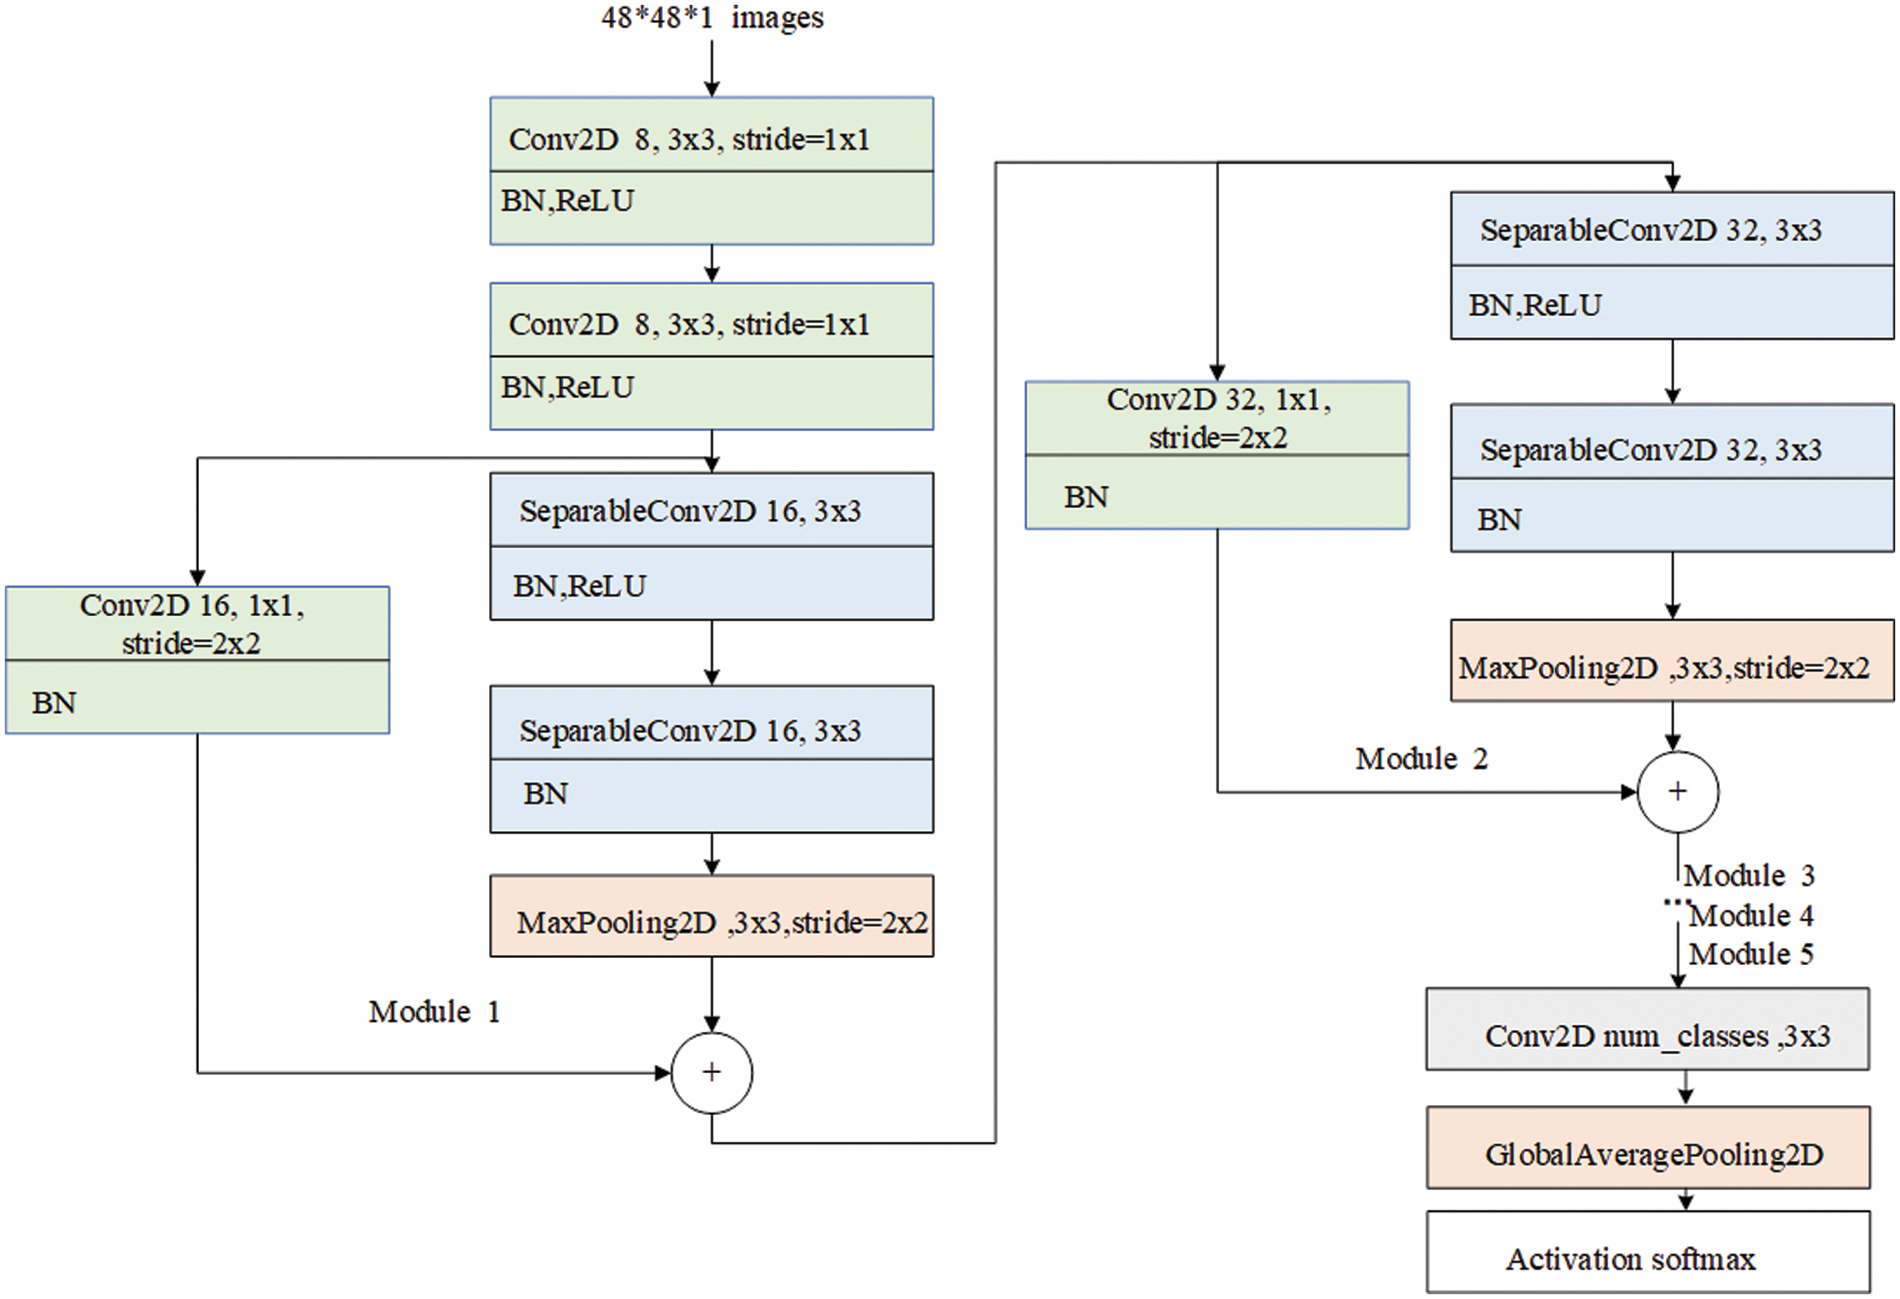
Figure 3: Xception network structure for emotion recognition
The model omits 4 repeated modules in the hidden layer, and adjusts the number, size and moving step size of the convolution kernel. In order to prevent the gradient from disappearing or exploding, the BN regularization method is selected to control the numerical range before activation, and speed up model convergence at the same time. During model training, the Adam algorithm is used for optimization, the loss function adopts the cross entropy function, and the data enhancement adopts the built-in data generator of Keras. The fer2013 data set was trained and tested in a 4:1 manner, and the model training accuracy reached 72.14%. In order to prove the effectiveness of the model, this study compares the experimental results with other algorithms. Table 1 shows the comparison results of fer2013 dataset recognition accuracy with other algorithms.

3.1.2 Data Quantification for Emotion Detection
Mehrabian and Russell proposed a three-dimensional emotion model, PAD for short. The model divides emotions into three dimensions: pleasure, activation, and dominance [22]. Each dimension has positive and negative characteristics. Various specific emotions in the emotional space can be well quantified through the PAD three-dimensional emotional model. On this basis, the Institute of Psychology of the Chinese Academy of Sciences has developed a simplified version of the PAD emotional scale [23]. The raters score the items in the scale one by one according to the images to be measured. After the calculation of formulas (1)–(3), the PAD parameters can be normalized.
S1∼S12 are the 12 items of the scale, after normalization, the value range of each dimension of PAD is

At the same time, according to the emotional dimension space theory, the corresponding relationship between the emotional learning space and the learning state space can be established. Corresponding to the three dimensions of Wundt’s three-dimensional emotion model [25], the three dimensions in the learning state space are understanding, engagement, and interest. When the facial expressions are happy or surprised, the students are in a state of more understanding, and when there are emotions such as sadness, fear, etc., they are considered to be in a state of less understanding; When there are expressions of anger, surprise, etc., the emotional activation is high, which is regarded as an engaged state, otherwise, fatigue and sadness are regarded as a non-engaged state; When the learner is attracted to the classroom as relaxed and happy, he is regarded as interested, and when he is in a state of disinterest when he has strong self-control emotions such as fear and disgust. Wundt’s three-dimensional emotional model is a qualitative description of emotions, and PAD’s three-dimensional emotional model is a quantitative description of emotions. The two definitions of three-dimensional emotions are basically the same, as shown in Fig. 4.
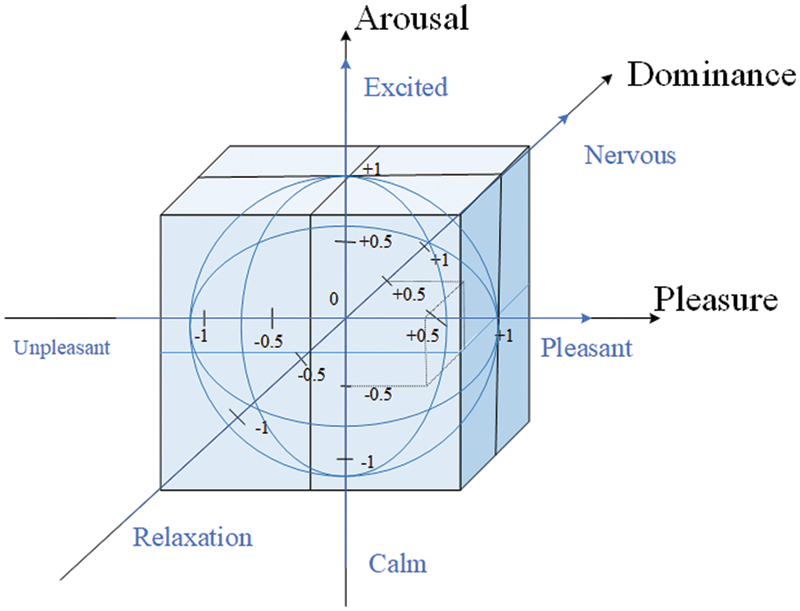
Figure 4: Wundt’s and PAD emotional model
Therefore, according to the learning state and the P value, A value, and D value of the PAD three-dimensional emotional space, the corresponding model as shown in Fig. 5 is established.
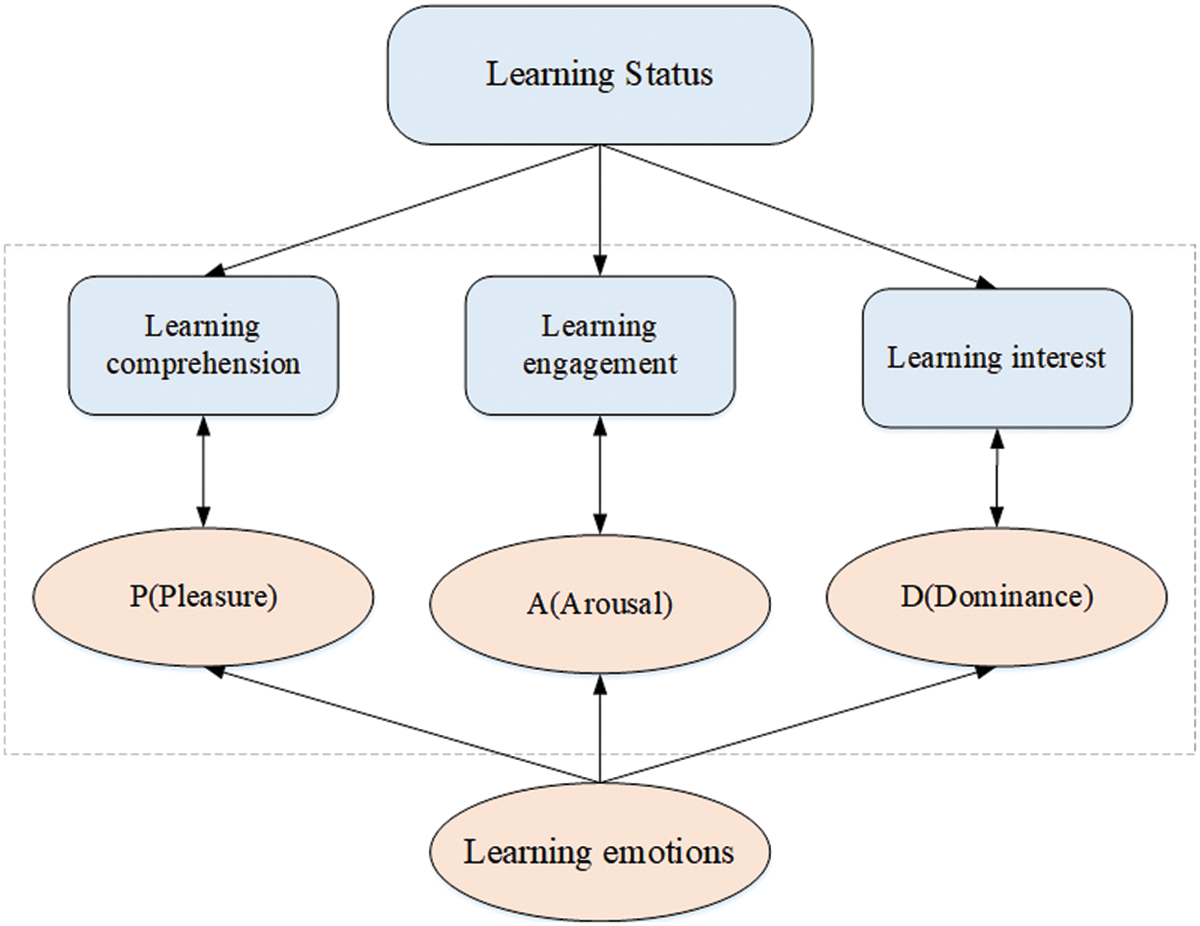
Figure 5: Learning state mapping model
According to the mapping relationship of the learning state in Fig. 5, the level of understanding, engagement, and interest are divided into five levels according to the P value and D range with 0.2 as an interval. And assign [0, 0.25, 0.5, 0.75, 1] different weights to the emotions within the range, because the data distribution range of A value is not large. Therefore, the learning engagement is divided into three levels: engagement, no engagement and neutral, and assign [0.33, 0.66, 1] different weights to it. According to formula (4), the value of students’ comprehension, engagement and interest during this period is calculated.
In order to prevent the single-dimensional information incompleteness caused by emotion detection in the evaluation of students’ learning state, this paper uses fatigue detection as a dimension of learning state evaluation, and again uses convolutional neural network to build a human eye state recognition model to detect student fatigue [26,27], classify images with eyes open and eyes closed. By recording the number of closed eyes of students in a period of time to evaluate the degree of student fatigue.
3.2.1 Eye State Recognition Model
In the process of eye state recognition, this paper selects the CEW closed-eye data set (https://hyper.ai/datasets/9161) for model training. The data set contains 1192 closed-eye images and 1231 open-eye images, and the face image is adjusted to 100 × 100 pixels in size. The extracted eye images are uniformly resized to 24 × 24 pixels in size. In this experiment, the ResNet18 network model structure was built in the Pytorch environment [28], the network contains 17 convolutional layers and 1 fully connected layer (not including pooling layer and BN layer), it is divided into 6 modules. The first module is the first convolutional layer (Conv1), it uses 64 convolution kernels with a convolution size of 7 × 7 to perform convolution operations, and performs maximum pooling after completion; Modules Conv2_x, Conv3_x, Conv4_x, Conv5_x all contain two consecutive convolution layers, using 64, 128, 256, 512 convolution kernels for convolution operations, and each convolution layer uses a 3 × 3 size convolution kernel, and also performs shortcut processing on the output of the previous layer. In order to be consistent with the result structure of the two convolutional layers, in the shortcut process, the kernel size is set to 1, stride is set to 2. The sixth module is a fully connected layer used to implement classification tasks, the network parameters are shown in Table 3.

During the training process, the recognition accuracy rate of the model in the training set and the test set was mainly recorded. The accuracy rate on the training set reached 97.40%, and the accuracy rate on the test set reached 92.43%. To illustrate the effectiveness of the model, we compare the experimental results with the classical network model lenet-5 and the existing machine learning algorithms, as shown in Table 4.

It can be seen from Table 4 that the model has good recognition effect on CEW data set and high accuracy. It shows that the design of the model framework and the adjustment of various parameters play a key role in the performance of the model.
According to the PERCLOS measurement method proposed by the Carjimelon Institute in the 1980s [31], it can effectively detect human fatigue. This method determines the degree of human fatigue by measuring the percentage of the pupil area and the area of the eyelid area. Currently, it is mostly used to determine the fatigue of motor vehicles [32–34]. Generally, there are three kinds of PERCLOS fatigue judgment standards: P70, P80, EM, that is, the percentage of closed eyelids is 70%, 80%, and 50%. Since the time corresponds to the image sequence in the video, the number of image frames can be used to calculate the PERCLOS value according to formula (5) [35].

3.3 Multi-dimensional Information Fusion
3.3.1 Multidimensional Information Weight Assignment
Since each dimension information has different effects on the learning state, it is necessary to assign weights to each dimension information. In this paper, the combination weighting method is used to determine the information weight of each dimension, and the combination method adopts the “multiplication” synthesis [37,38], the subjective weighting method uses Analytic Hierarchy Process (AHP) [39], the objective weighting method adopts the entropy value method. The steps to determine the weights in the AHP method are:
(1) According to the correlation and affiliation between three-dimensional information, a multi-level analysis structure model of understanding, engagement, and interest is formed, respectively.
(2) A positive and negative matrix is established according to the model, and the value of the matrix is given by the decision maker using Santy’s 1–9 scaling method, the values of the upper and lower triangular regions of the matrix are opposite. If the value of the i-th row and the j-th column is, then the value of the j-th row and the i-th column is.
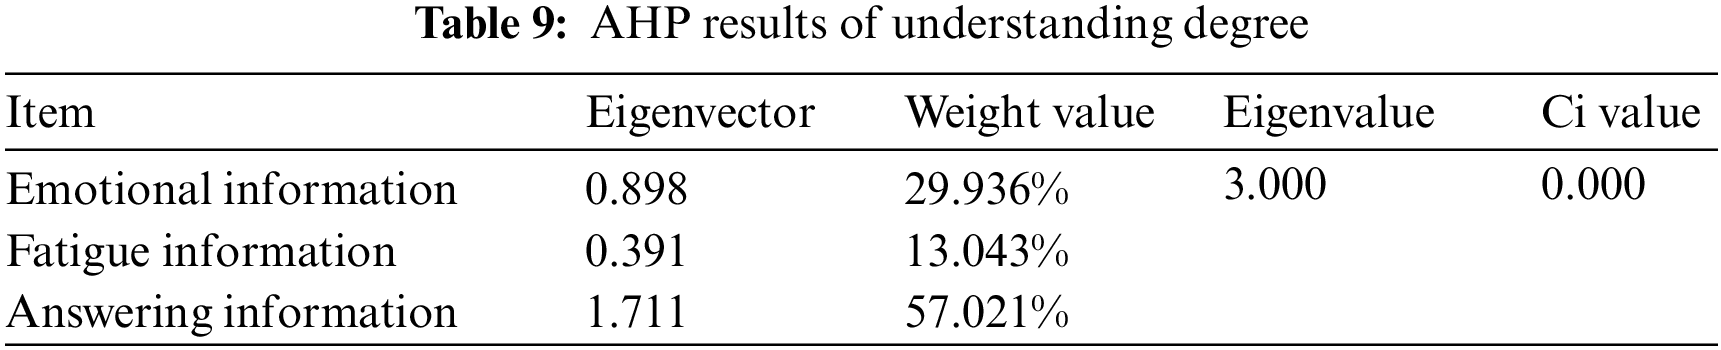
(3) Solve the weight vector, calculate the average value of each analysis item, and then divide the average value to obtain the judgment matrix. The larger the average value, the higher the importance and the higher the weight, as shown in Tables 6–8.


(4) Use the sum-product method to obtain the weight of each dimension information, it is to add the normalized judgment matrix by row according to formula (7), n represents the information dimension, i represents the row of the matrix, j represents the column of the matrix,
Then normalize according to formula (8) to obtain the feature vector of each dimension information.
At the same time, the maximum eigenroot of the judgment matrix is calculated according to formula (9) and the eigenvector, and BW is the multiplication result of the positive and negative matrix and the eigenvector.
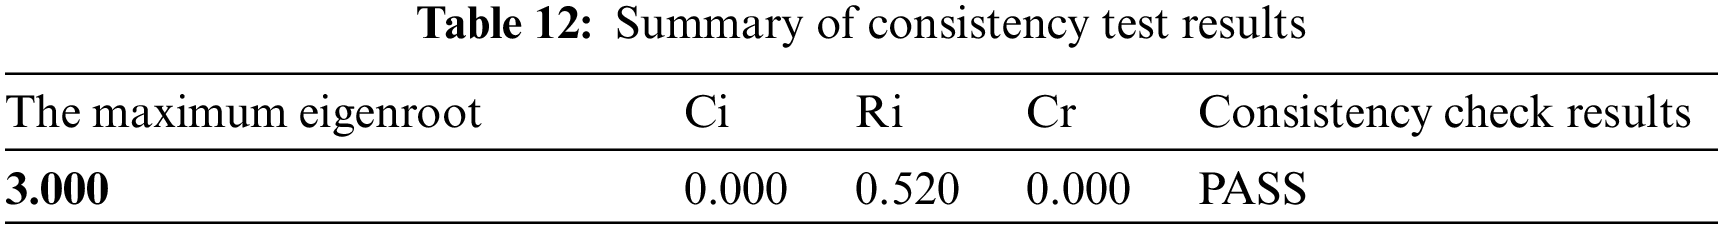
Finally, the consistency test is carried out according to formula (10) (to test whether the matrix has satisfactory consistency), and the results are shown in Tables 9–11.


Consistency Indicator:
(5) Consistency test is carried out according to formula (11).
CR represents the random consistency ratio of the matrix, RI represents the average random consistency index of the third-order matrix (RI = 0.52), if CR < 0.1, it means that the matrix has satisfactory consistency. The CI values of the matrix constructed in this paper are all 0, and the consistency test is passed. The test results are shown in Table 12.
The calculation steps of the entropy method are as follows: (1) Draw up a survey scale on the impact of three-dimensional information on learning status, and invite 2 field experts and 4 researchers to score each item in the scale. (2) According to the scoring data of each expert, the decision matrix of the three-dimensional information weight problem is constructed as:
At the same time, calculate the proportion of the score of the j-th expert under the i-th dimension information according to formula (13).
Then calculate the entropy value of each dimension information according to formula (14) and the proportion of scoring.
And calculate the weight of each dimension information according to formula (15).
Finally, the AHP weight and the entropy method weight are multiplied and synthesized according to formula (16) to obtain the final weight of each dimension information. Tjrepresents the AHP weight, and Sj represents the entropy method weight, Wjrepresents the final weight.
The weight distribution is shown in Tables 13–15.


3.3.2 Three-Dimensional Information Fusion
How to integrate three-dimensional information is a key issue in evaluating students’ learning status. This paper adopts the method of decision-level fusion to carry out level-by-level fusion. The mathematical explanation is as follows: if there are N students participating in the test, the sample set is represented as
There are a variety of second-level information under the first-level information, denoted as
This paper selects 17 students in the seventh grade of a middle school in Chongqing as the subjects, and analyzes the learning state process and overall analysis by obtaining their learning videos during class and after-class answering data. The learning videos are collected in an environment with bright light and clear face contours. The video is about 45 min long, and the learning content is the same teaching course at the same time.
4.1 Learning State Process Analysis
First, 5 different types of students were selected from these 17 students, namely positive, sad, irritable, natural, and tired or sleepy. They have different personality characteristics and listening status. It typically reflects the daily learning status of students. Through the learning state process detection and fusion calculation of these five students, the following detection results are obtained, as shown in Figs. 6–8.
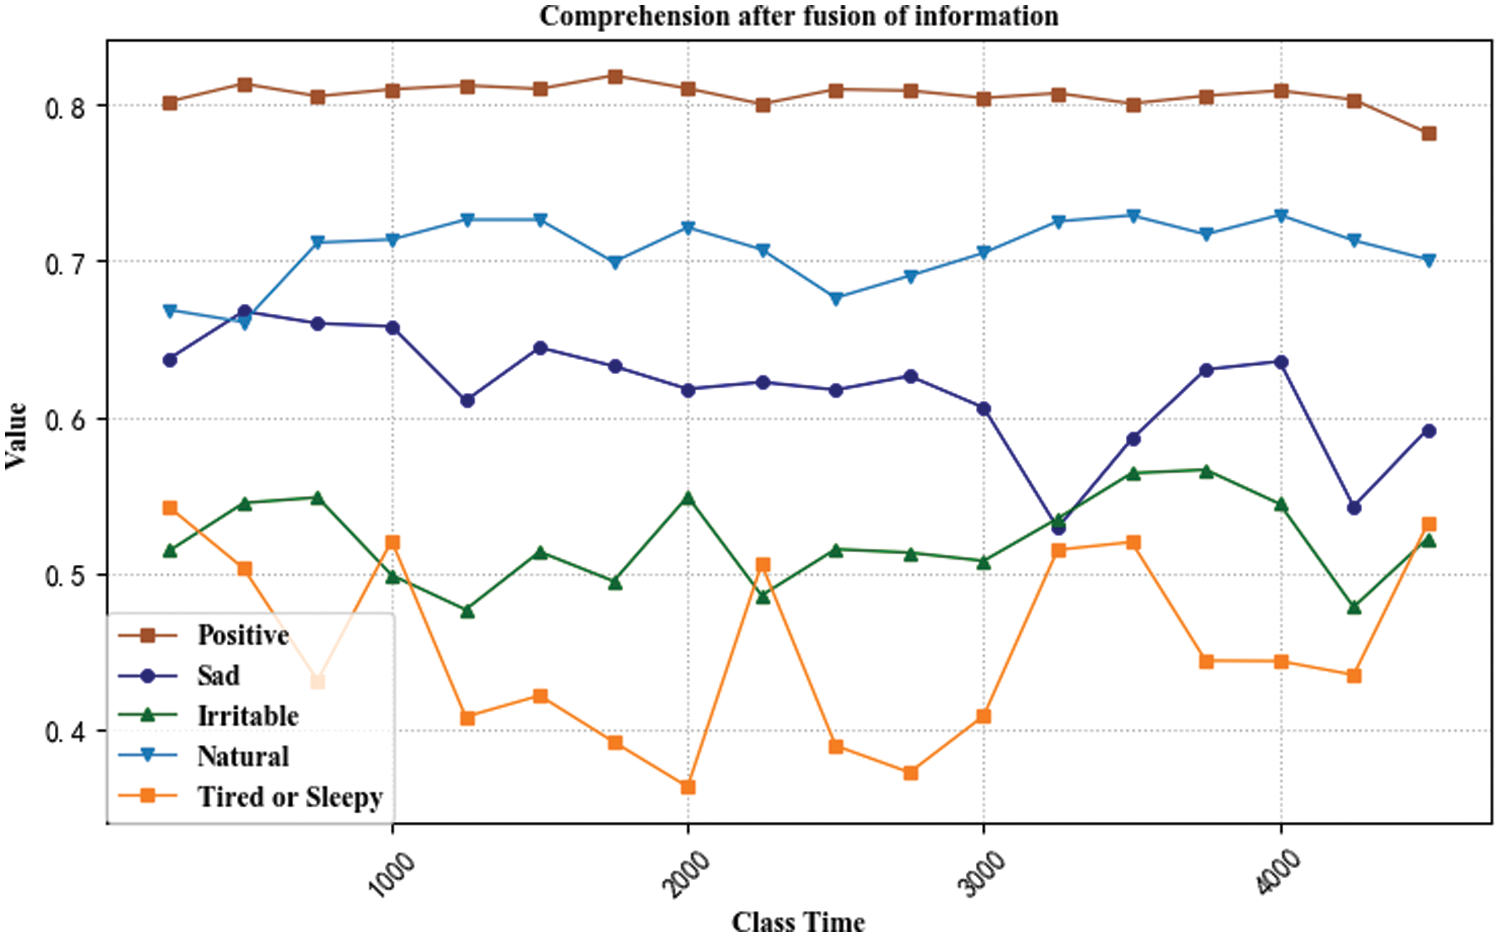
Figure 6: Analysis result of understanding degree after fusion of information
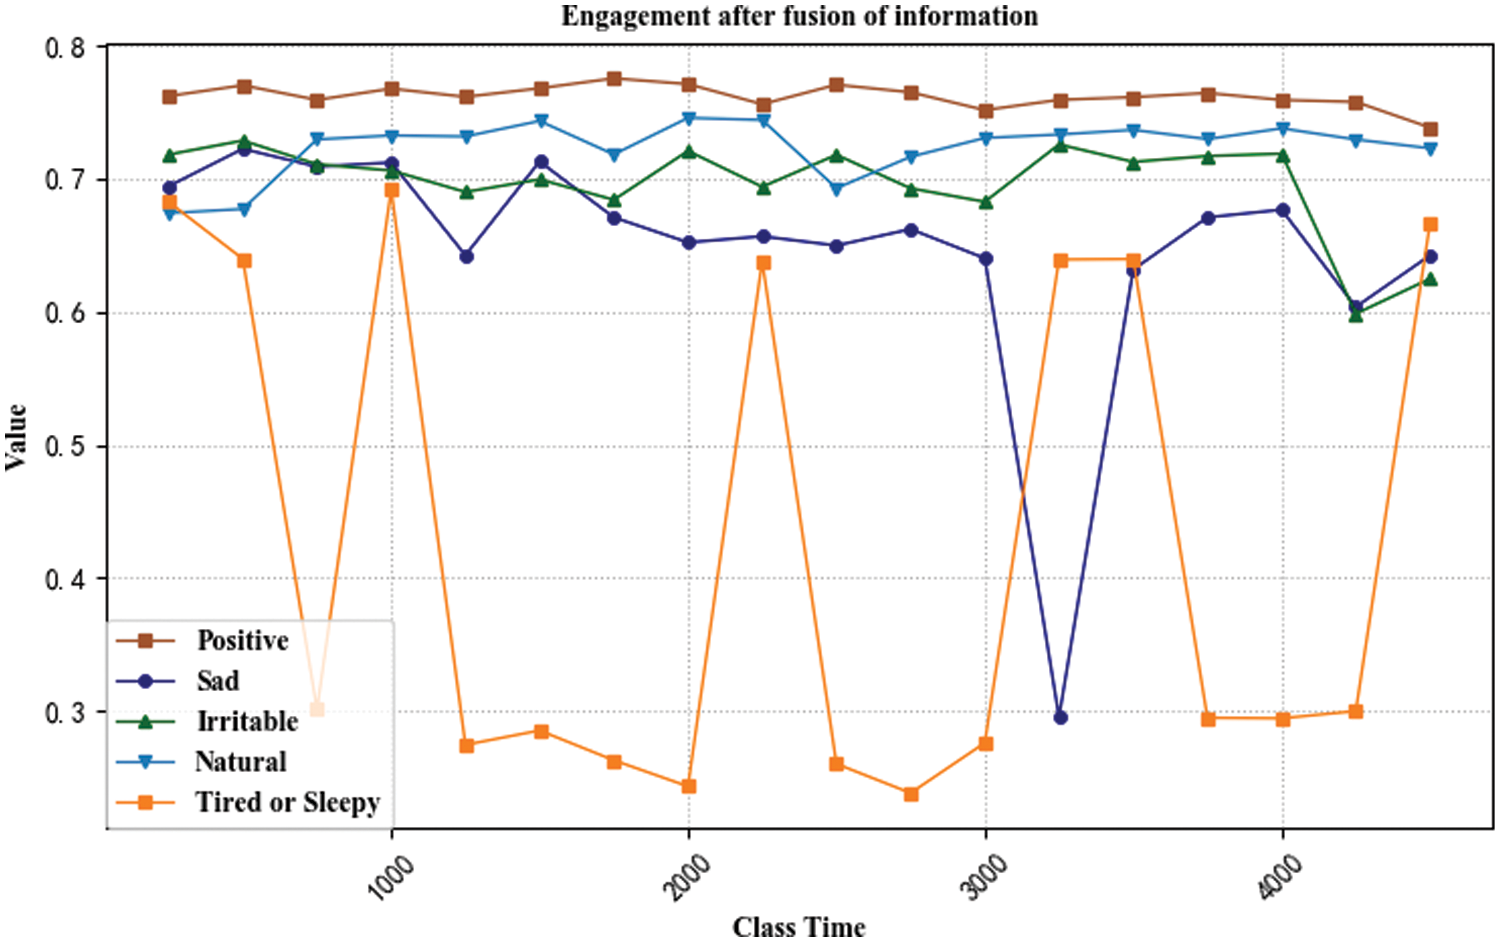
Figure 7: Analysis result of engagement after fusion of information
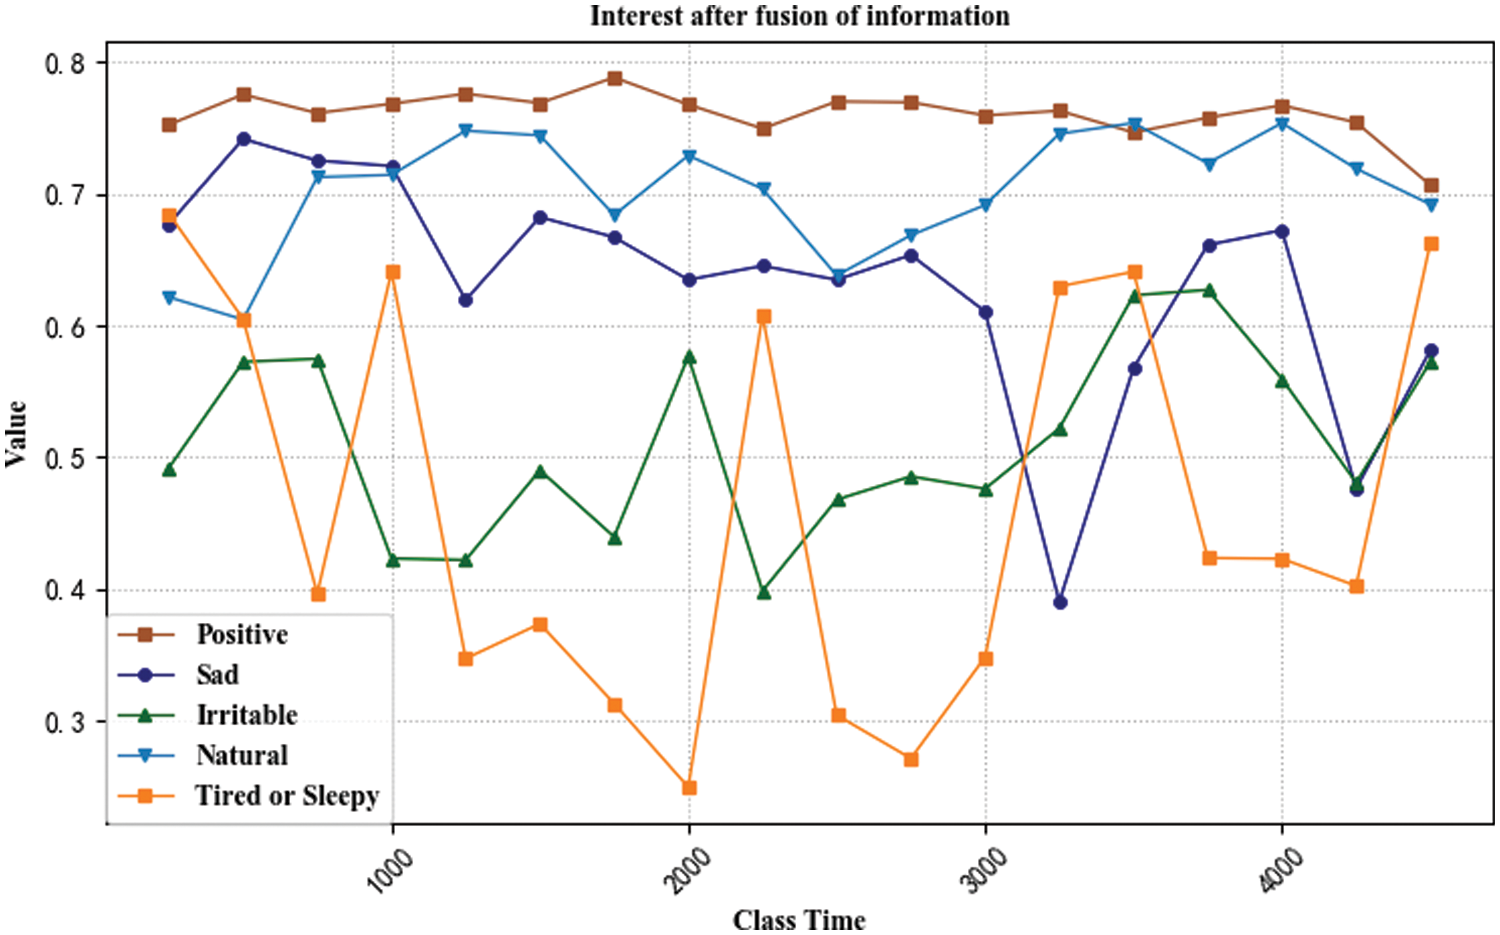
Figure 8: Analysis result of interesting degree after fusion of information
From Fig. 6, it can be seen that the students’ comprehension degree in the positive state has always remained above 0.8, and the students’ understanding degree of the class in the natural state has reached above 0.7, and they have a good understanding of knowledge; Students in the negative and sad state have a basic understanding between 0.6 and 0.7, and are in a state of basic understanding; the overall understanding of irritable students is between 0.5 and 0.6, and they have little understanding of knowledge; For a student in a tired state, his comprehension fluctuates greatly, mostly below 0.5, and is below 0.4 many times, thus it is judged that the student is in a state of incomprehension.
From Fig. 7, the positive and natural students’ engagement in the class remains above 0.7. The student’s engagement is also above 0.7 in the irritable state, but the understanding degree is below 0.6, and the interest degree is around 0.5, indicating that the student has a strong negative emotion, resulting in a high degree of engagement and a low degree of interest. The overall engagement of the students in the negative and sad state is between 0.6 and 0.7, occasionally lower than 0.3, and they are in a state of less engagement; the learners in the fatigue state are often lower than 0.3, and they are in a state of no engagement.
From Fig. 8, the students’ interest degree in the positive state remains above 0.75, and they are very interested in the classroom; Students in the natural state have a low interest degree in the first 8 min, the value is around 0.6, the interest state remains neutral, and the interest degree fluctuates around 0.7 after 8 min, indicating that they are relatively interested in the classroom; Students in the negative and sad state have a high interest degree in the first 10 min, but after 10 min, the interest degree drops to between 0.6 and 0.7, and in 30 to 32.5 min, the interest degree is as low as 0.4. Overall, the student’s interest in class remains neutral. The interest degree of the students in the irritable state and the students in the exhausted state fluctuated greatly, but most of them were lower than 0.6. The interest degree of the students in the irritable state mostly fluctuated around 0.5, which showed that they were less interested in the classroom. In a tired state, the interest degree of students is lower than 0.4 or even lower than 0.3 many times, and occasionally remains neutral, and most of them are in a state of disinterest.
According to the test results, it is fully proved that the model can effectively identify the difference in learning status of different learners, and can effectively identify different learners’ understanding, commitment and interest in the course. To ensure the validity of the model detection, by inviting teachers to rate the understanding, engagement and interest of these 5 learners according to the video and answering scores. If the score is 80–100, it is considered as excellent, 60–80 is qualified, and below 60 is unqualified. The results of manual evaluation and model detection are shown in Table 16.

From the information in the table, it can be seen that the model in this paper can basically reflect the real learning state of the learners in class. The understanding of the students in the sad state is on the edge of passing, which is different from the artificial scoring, but the overall impact is not large. Therefore, the comparison can confirm that the model detection is feasible and effective.
4.2 Overall Analysis of Learning Status
In order to evaluate the learning quality of the entire class, this experiment randomly selected 12 students to test through the model, and calculated the overall understanding, engagement, and interest of the entire class. The test results are shown in Table 17.
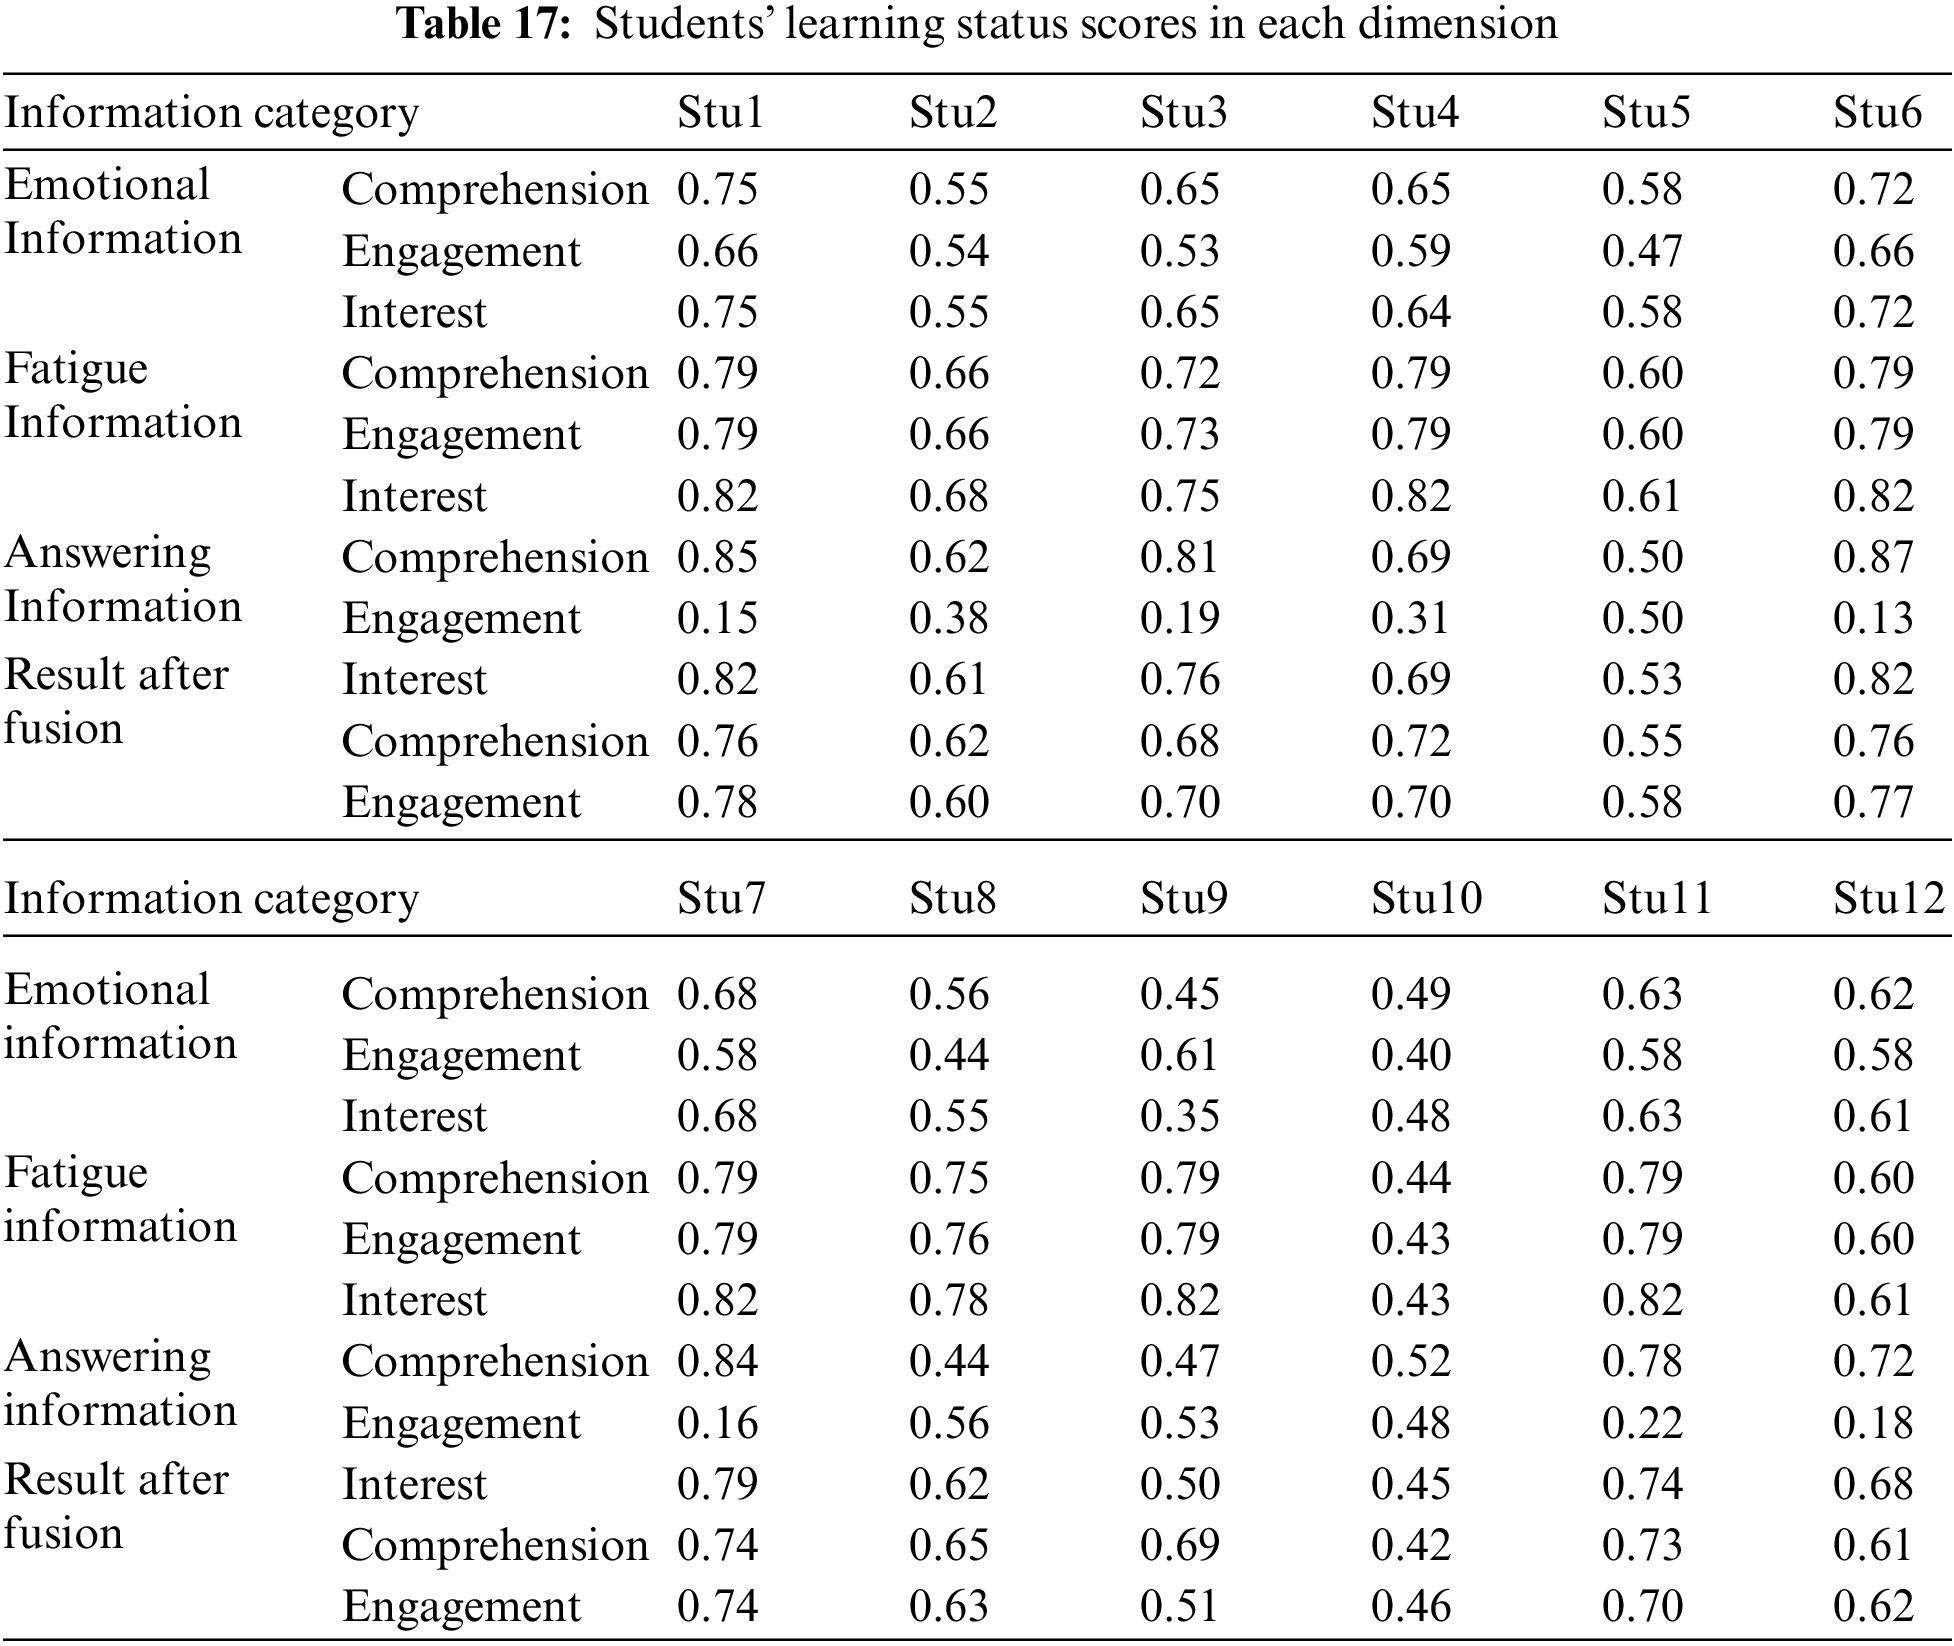
It can be seen from the table that the learning status of students 1 and 6 is very good. According to the information after the integration, these two students have a high degree of understanding, a good grasp of knowledge, and the degree of engagement and interest are both above 0.75. The learning status of students 3, 4, 7, and 11 is relatively good. Judging from the information after integration, the understanding, engagement and interest of the four students are all around 0.7, Among them, students 3 and 7 have a high degree of understanding, have a good understanding of knowledge, and are generally more engaged and interested in the classroom; students 2, 8, and 12 have poor learning status. According to the results after integration, the three students’ understanding, engagement, and interest are all around 0.6, and their concentration and interest in the classroom are not strong. The learning status of students 5, 9, and 10 is very poor. Judging from the results after integration, except for student 9, whose engagement is higher than 0.6, the other values are between 0.4 and 0.6. They have a poor understanding of knowledge and are not interested in the classroom, the concentration of learning is very low, and the final learning effect is not good.
According to the statistical data of the experimental results, the learning status data of 12 students after multi-dimensional information fusion are displayed graphically as shown in Fig. 9. The figure shows that there are certain differences in the overall comprehension, engagement and interest of the 12 students. The lowest point of comprehension, engagement and interest is close to 0.4, and the highest point of comprehension is higher than 0.8, the highest point of engagement and interest is close to 0.8, and different students have different degrees of understanding, engagement and interest. Therefore, from the overall analysis results, it can be seen that the model can effectively identify the learning status of different students.
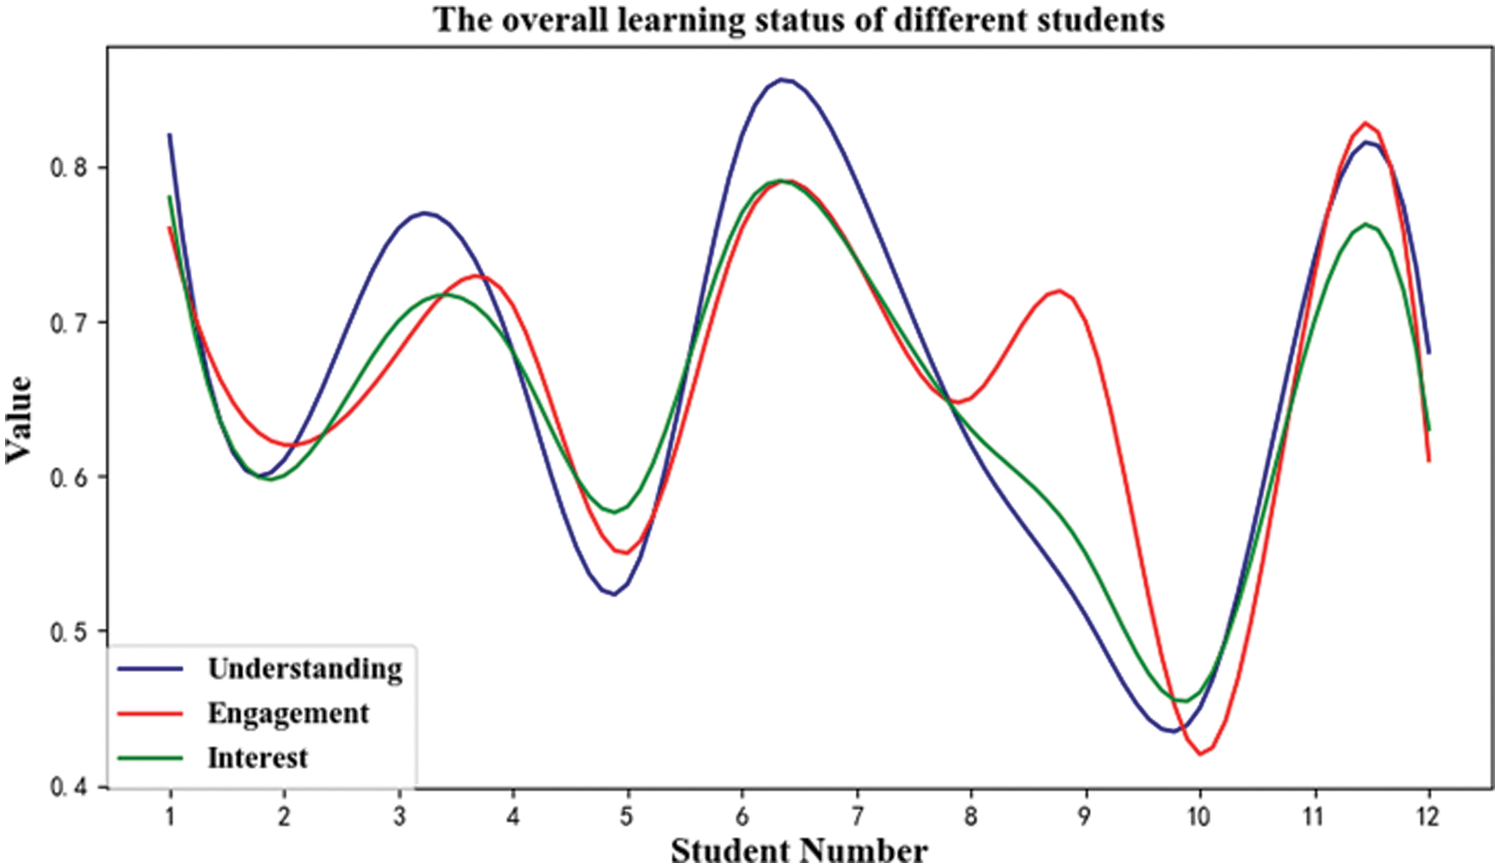
Figure 9: The overall learning status of the 12 students
This research proposes an online learner learning state analysis model based on multi-dimensional information fusion, and analyzes it from three aspects: Understanding, engagement and interest according to the correlation between detection data and learning state. Combined with the learning state analysis model proposed in this paper, the process analysis and overall analysis of 17 online learners are carried out, which proves that the model can effectively identify the students’ process learning state and overall learning state. At the same time, the teacher’s score is compared with the model detection results to verify the effectiveness of the model.
Funding Statement: The work reported in this paper is partially supported by the Chongqing Normal University Graduate Scientific Research Innovation Project (Grants YZH21014 and YZH21010).
Conflicts of Interest: The authors declare that they have no conflicts of interest to report regarding the present study.
References
1. Wu, D., Li, C. C., Zhou, W. T., Tsai, C. C., Lu, C. (2019). Relationship between ICT supporting conditions and ICT application in Chinese urban and rural basic education. Asia Pacific Education Review, 20(1), 147–157. DOI 10.1007/s12564-018-9568-z. [Google Scholar] [CrossRef]
2. Shin, J., Chen, F., Lu, C., Bulut, O. (2022). Analyzing students’ performance in computerized formative assessments to optimize teachers’ test administration decisions using deep learning frameworks. Journal of Computers in Education, 9(1), 71–91. DOI 10.1007/s40692-021-00196-7. [Google Scholar] [CrossRef]
3. D’mello, S. K., Craig, S. D., Witherspoon, A., McDaniel, B., Graesser, A. (2008). Automatic detection of learner’s affect from conversational cues. User Modeling and User-Adapted Interaction, 18(1), 45–80. [Google Scholar]
4. Bahreini, K., Nadolski, R., Westera, W. (2016). Towards real-time speech emotion recognition for affective e-learning. Education and Information Technologies, 21(5), 1367–1386. DOI 10.1007/s10639-015-9388-2. [Google Scholar] [CrossRef]
5. Zakka, B. E., Vadapalli, H. (2019). Detecting learning affect in e-learning platform using facial emotion expression. International Conference on Soft Computing and Pattern Recognition, pp. 217–225. Cham, Springer. [Google Scholar]
6. Wood, E., Baltrušaitis, T., Morency, L. P., Robinson, P., Bulling, A. (2016). Learning an appearance-based gaze estimator from one million synthesised image. Proceedings of the Ninth Biennial ACM Symposium on Eye Tracking Research & Applications, pp. 131–138. New York, NY, USA. [Google Scholar]
7. Knapik, M., Cyganek, B. (2019). Driver’s fatigue recognition based on yawn detection in thermal images. Neurocomputing, 338, 274–292. DOI 10.1016/j.neucom.2019.02.014. [Google Scholar] [CrossRef]
8. Gou, C., Wu, Y., Wang, K., Wang, K. F., Wang, F. Y. et al. (2017). A joint cascaded framework for simultaneous eye detection and eye state estimation. Pattern Recognition, 67, 23–31. DOI 10.1016/j.patcog.2017.01.023. [Google Scholar] [CrossRef]
9. Kanematsu, H., Ogawa, N., Shirai, T., Kawaguchi, M., Kobayashi, T. et al. (2016). Blinking eyes behaviors and face temperatures of students in YouTube lessons-for the future e-learning class. Procedia Computer Science, 96, 1619–1626. DOI 10.1016/j.procs.2016.08.209. [Google Scholar] [CrossRef]
10. Krithika, L. B., GG, L. P. (2016). Student emotion recognition system (SERS) for e-learning improvement based on learner concentration metric. Procedia Computer Science, 85, 767–776. DOI 10.1016/j.procs.2016.05.264. [Google Scholar] [CrossRef]
11. Kamath, S., Singhal, P., Jeevan, G., Annappa, B. (2022). Engagement analysis of students in online learning environments. In: Misra, R., Shyamasundar, R. K., Chaturvedi, A., Omer, R. (Eds.Machine learning and big data analytics, pp. 34–47. Cham: Springer. [Google Scholar]
12. Mota, S., Picard, R. W. (2008). Automated posture analysis for detecting learner’s interest level. IEEE International Conference on Computer Vision and Pattern Recognition Workshop (CVPRW), vol. 5, Madison, WI, USA. [Google Scholar]
13. Asteriadis, S., Tzouveli, P., Karpouzis, K., Kollias, S. (2009). Estimation of behavioral user state based on eye gaze and head pose–application in an e-learning environment. Multimedia Tools and Applications, 41(3), 469–493. DOI 10.1007/s11042-008-0240-1. [Google Scholar] [CrossRef]
14. Mubarak, A. A., Cao, H., Ahmed, S. A. (2021). Predictive learning analytics using deep learning model in MOOCs’ courses videos. Education and Information Technologies, 26(1), 371–392. DOI 10.1007/s10639-020-10273-6. [Google Scholar] [CrossRef]
15. Friesen, E., Ekman, P. (1978). Facial action coding system: A technique for the measurement of facial movement. Palo Alto, 3(2). [Google Scholar]
16. Limbrecht-Ecklundt, K., Werner, P., Traue, H. C., Al-Hamadi, A., Walter, S. (2016). Erratum zu: Mimische aktivität differenzierter schmerzintensitäten. Korrelation der merkmale von facial action coding system und elektromyographie. Schmerz, 30(3), 294. DOI 10.1007/s00482-016-0121-x. [Google Scholar] [CrossRef]
17. Szegedy, C., Vanhoucke, V., Ioffe, S., Shlens, J., Wojna, Z. (2016). Rethinking the inception architecture for computer vision. IEEE Conference on Computer Vision and Pattern Recognition, pp. 2818–2826. Las Vegas, NV. [Google Scholar]
18. Chollet, F. (2017). Xception: Deep learning with depth wise separable convolutions. Proceedings of the IEEE Conference on Computer Vision and Pattern Recognition, pp. 1251–1258. Honolulu, HI, USA. [Google Scholar]
19. Minaee, S., Minaei, M., Abdolrashidi, A. (2021). Deep-emotion: Facial expression recognition using attentional convolutional network. Sensors, 21(9), 3046. DOI 10.3390/s21093046. [Google Scholar] [CrossRef]
20. Pramerdorfer, C., Kampel, M. (2016). Facial expression recognition using convolutional neural networks: State of the art. arXiv preprint arXiv,1612.02903. [Google Scholar]
21. Fard, A. P., Mahoor, M. H. (2022). Ad-corre: Adaptive correlation-based loss for facial expression recognition in the wild. IEEE Access, 10, 26756–26768. DOI 10.1109/ACCESS.2022.3156598. [Google Scholar] [CrossRef]
22. Mehrabian, A. (1996). Pleasure-arousal-dominance: A general framework for describing and measuring individual differences in temperament. Current Psychology, 14(4), 261–292. DOI 10.1007/BF02686918. [Google Scholar] [CrossRef]
23. Li, X. M., Fu, X. L., Deng, G. F. (2008). Preliminary application of the abbreviated PAD emotion scale to Chinese undergraduates. Chinese Mental Health Journal, 22(5), 327–329. [Google Scholar]
24. Wei, Q., Sun, B., He, J., Yu, L. (2017). BNU-LSVED 2.0: Spontaneous multimodal student affect database with multi-dimensional labels. Signal Processing: Image Communication, 59, 168–181. [Google Scholar]
25. Fontaine, J. R. J., Scherer, K. R., Roesch, E. B., Ellsworth, P. C. (2015). The world of emotions is not two-dimensional. Psychological Science, 18(12), 1050–1057. DOI 10.1111/j.1467-9280.2007.02024.x. [Google Scholar] [CrossRef]
26. Cui, Z., Sun, H. M., Yin, R. N., Gao, L., Sun, H. B. et al. (2021). Real-time detection method of driver fatigue state based on deep learning of face video. Multimedia Tools and Applications, 80(17), 25495–25515. DOI 10.1007/s11042-021-10930-z. [Google Scholar] [CrossRef]
27. Zhao, L., Wang, Z., Zhang, G., Qi, Y., Wang, X. (2018). Eye state recognition based on deep integrated neural network and transfer learning. Multimedia Tools and Applications, 77(15), 19415–19438. DOI 10.1007/s11042-017-5380-8. [Google Scholar] [CrossRef]
28. Li, B., Li, R., Lima, D. (2021). Facial expression recognition via ResNet-18. In: Multimedia technology and enhanced learning, pp. 290–303. Cham: Springer. [Google Scholar]
29. Wu, Y. S., Lee, T. W., Wu, Q. Z., Liu, H. S. (2010). An eye state recognition method for drowsiness detection. 2010 IEEE 71st Vehicular Technology Conference, pp. 1–5. Taipei, Taiwan. IEEE. [Google Scholar]
30. Song, F., Tan, X., Liu, X., Chen, S. (2014). Eyes closeness detection from still images with multi-scale histograms of principal oriented gradients. Pattern Recognition, 47(9), 2825–2838. DOI 10.1016/j.patcog.2014.03.024. [Google Scholar] [CrossRef]
31. Kim, S., Wisanggeni, I., Ros, R. (2020). Detecting fatigue driving through PERCLOS: A review. International Journal of Image Processing, 14(1). [Google Scholar]
32. Dwivedi, K., Biswaranjan, K., Sethi, A. (2014). Drowsy driver detection using representation learning. 2014 IEEE International Advance Computing Conference (IACC), pp. 995–999. Gurgaon, India. [Google Scholar]
33. Khunpisuth, O., Chotchinasri, T., Koschakosai, V. (2016). Driver drowsiness detection using eye-closeness detection. International Conference on Signal-Image Technology & Internet-Based Systems, pp. 661–668. Naples, Italy. [Google Scholar]
34. Batista, J. P. (2005). A real-time driver visual attention monitoring system. In: Marques, J. S., Pérez de la Blanca, N., Pina, P. (Eds.Pattern recognition and image analysis, pp. 200–208. Berlin, Heidelberg: Springer. [Google Scholar]
35. Singh, M., Kaur, G. (2012). Drowsy detection on eye blink duration using algorithm. International Journal of Emerging Technology and Advanced Engineering, 2(4), 363–365. [Google Scholar]
36. Rowe, G., Wright, G. (2001). Expert opinions in forecasting: The role of the Delphi technique. In: Principles of forecasting, pp. 125–144. Boston, MA: Springer. [Google Scholar]
37. Wang, J. J., Miao, Z. H., Cui, F. B., Liu, H. C. (2018). Robot evaluation and selection with entropy-based combination weighting and cloud TODIM approach. Entropy, 20(5), 349. DOI 10.3390/e20050349. [Google Scholar] [CrossRef]
38. Liu, H. J., Hu, Y. R. (2015). An evaluating method with combined assigning-weight based on maximizing variance. Scientific Programming, 2015, 3. [Google Scholar]
39. Nagpal, R., Mehrotra, D., Bhatia, P. K. (2016). Usability evaluation of website using combined weighted method: Fuzzy AHP and entropy approach. International Journal of System Assurance Engineering and Management, 7(4), 408–417. DOI 10.1007/s13198-016-0462-y. [Google Scholar] [CrossRef]
Cite This Article
 Copyright © 2023 The Author(s). Published by Tech Science Press.
This work is licensed under a Creative Commons Attribution 4.0 International License , which permits unrestricted use, distribution, and reproduction in any medium, provided the original work is properly cited.
 Downloads
 Citation Tools