
 Submit a Paper
 Propose a Special lssue
 Open Access
ARTICLE

Low-Frequency Oscillation Analysis of Grid-Connected VSG System Considering Multi-Parameter Coupling
1 Shenyang University of Technology, Shenyang, 110870, China
2 Electric Power Research Institute of State Grid Liaoning Electric Power Supply Co., Ltd., Shenyang, 110006, China
3 State Grid Liaoning Electric Power Supply Co., Ltd., Shenyang, 110006, China
* Corresponding Author: Junyou Yang. Email:
(This article belongs to the Special Issue: Artificial Intelligence in Renewable Energy and Storage Systems)
Computer Modeling in Engineering & Sciences 2023, 135(3), 2373-2386. https://doi.org/10.32604/cmes.2023.024461
Received 31 May 2022; Accepted 08 August 2022; Issue published 23 November 2022
 View Full Text
 Download PDF
Abstract
With the increasing integration of new energy generation into the power system and the massive withdrawal of traditional fossil fuel generation, the power system is faced with a large number of stability problems. The phenomenon of low-frequency oscillation caused by lack of damping and moment of inertia is worth studying. In recent years, virtual synchronous generator (VSG) technique has been developed rapidly because it can provide considerable damping and moment of inertia. While improving the stability of the system, it also inevitably causes the problem of active power oscillation, especially the low mutual damping between the VSG and the power grid will make the oscillation more severe. The traditional time-domain state-space method cannot reflect the interaction among state variables and study the interaction between different nodes and branches of the power grid. In this paper, a frequency-domain method for analyzing low-frequency oscillations considering VSG parameter coupling is proposed. First, based on the rotor motion equation of the synchronous generator (SG), a second-order VSG model and linearized power-frequency control loop model are established. Then, the differences and connections between the coupling of key VSG parameters and low-frequency oscillation characteristics are studied through frequency domain analysis. The path and influence mechanism of a VSG during low-frequency power grid oscillations are illustrated. Finally, the correctness of the theoretical analysis model is verified by simulation.Keywords
With the development of distributed energy technology, power systems have been equipped with a large number of power electronic inverters. Unlike the traditional synchronous generator (SG), the inverter power supply cannot provide inherent inertia to respond to changes in grid frequency, thus providing insufficient inertia and weak frequency regulation of the power system [1–3]. To solve this problem, some scholars have proposed a virtual synchronous generator (VSG) to simulate the frequency support characteristics of a synchronous generator, in which the rotor motion equation is usually used to design an active power-frequency control loop [4–6]. However, in power system transient analysis, low-frequency oscillation is a power-angle stability problem caused by small disturbances. Due to the inconsistency of the coordination control between the VSGs and SGs, the low-frequency oscillation may be easily caused when the damping effect of the power system is limited. Thus, it is necessary to analyze the low-frequency oscillation mechanism to improve the power system stability [7–9].
Power systems with insufficient damping caused by the interaction between the SG and the power grid often suffer from low-frequency oscillation, a classic small-disturbance stability problem [10,11]. At present, the stability analysis of grid-connected VSG systems with small disturbances, especially regarding the influence mechanism of low-frequency oscillations of the system, is a key issue in current research [12,13]. In one study, the influence of a phase-locked loop (PLL) in a power system with a VSG was analyzed, and the cause of low-frequency oscillation was determined to be the negative damping phenomenon caused by the PLL [14]. Other works established a complete state-space model of multiple inverters in the microgrid, including inverters, power lines, and loads [15,16]. In [17], a small-signal model of the synchronous generator was studied in connected and independent modes, and the oscillation of the output active power was analyzed by establishing a state-space model. In [18], another study introduced an active power strategy to suppress transient power oscillation caused by differences in inertia by analyzing the stability of the power-angle. In [19], the difference between VSG control and virtual inertia control of the PLL in terms of system stability was compared and analyzed based on the small-signal linearization model. In summary, all existing methods use time-domain analysis to study VSG using a high-order state-space model. But the scale of state space matrix will increase rapidly with the complexity of control strategy and network structure, making the model more complex. Therefore, a frequency-domain analysis method considering multi-parameter coupling is proposed in this paper. The VSG model is equivalent to a port network to establish the transfer function. The grid-connected inverter is equivalent to an ideal controlled voltage source in series with a constant output impedance, which simplifies the analysis process and extends the multi-machine system expediently. A Bode diagram is used to analyze the oscillation characteristics of the system in combination with the damping ratio and natural frequency, which is a clearer and more intuitive approach.
Focusing on the factors influencing the low-frequency oscillation of a grid-connected VSG system, this study considers an inverter power supply based on virtual inertia control as the research object. Based on an analysis of the expansion structure and power-frequency control loop of the VSG circuit, the frequency-domain analysis method is adopted to simplify the model into a second-order form. The possible factors influencing the VSG connection and the key parameters causing low-frequency oscillation are systematically analyzed through the damping ratio and natural frequency. Finally, the simulation is used to verify the accuracy of the model analysis results.
2.1 Mathematical Model of Synchronous Generator
The classical Phillips-Heffron model of a synchronous generator describes the inertia, damping, and synchronization characteristics of the generator through a linearized rotor motion equation [20]. To characterize the synchronous generator, virtual synchronous generator technology adopts a second-order model [21], as shown in Eqs. (1) and (2).
where E is the excitation electromotive force; U is the armature voltage, I is the armature current, J is the moment of inertia, D is the damping coefficient; θ is the electrical angle; Pm and Pe are the prime motor output mechanical power and generator output electromagnetic power, respectively; ω0 is the rated angular frequency; ωg is the reference angular frequency; ω is the virtual angular frequency; Δωg is the difference between the reference angular frequency and the virtual angular frequency; ra is the armature resistance; and xt is the synchronous reactance.
2.2 Frequency-Domain Analysis of VSG
The control block diagram of the inverter based on VSG is shown in Fig. 1. Here, Udc is the DC side voltage; Lf is the filter inductance; Cf is the filter capacitor; Uabc and Iabc are the VSG output three-phase voltage and current, respectively; and Zg is the power grid impedance.
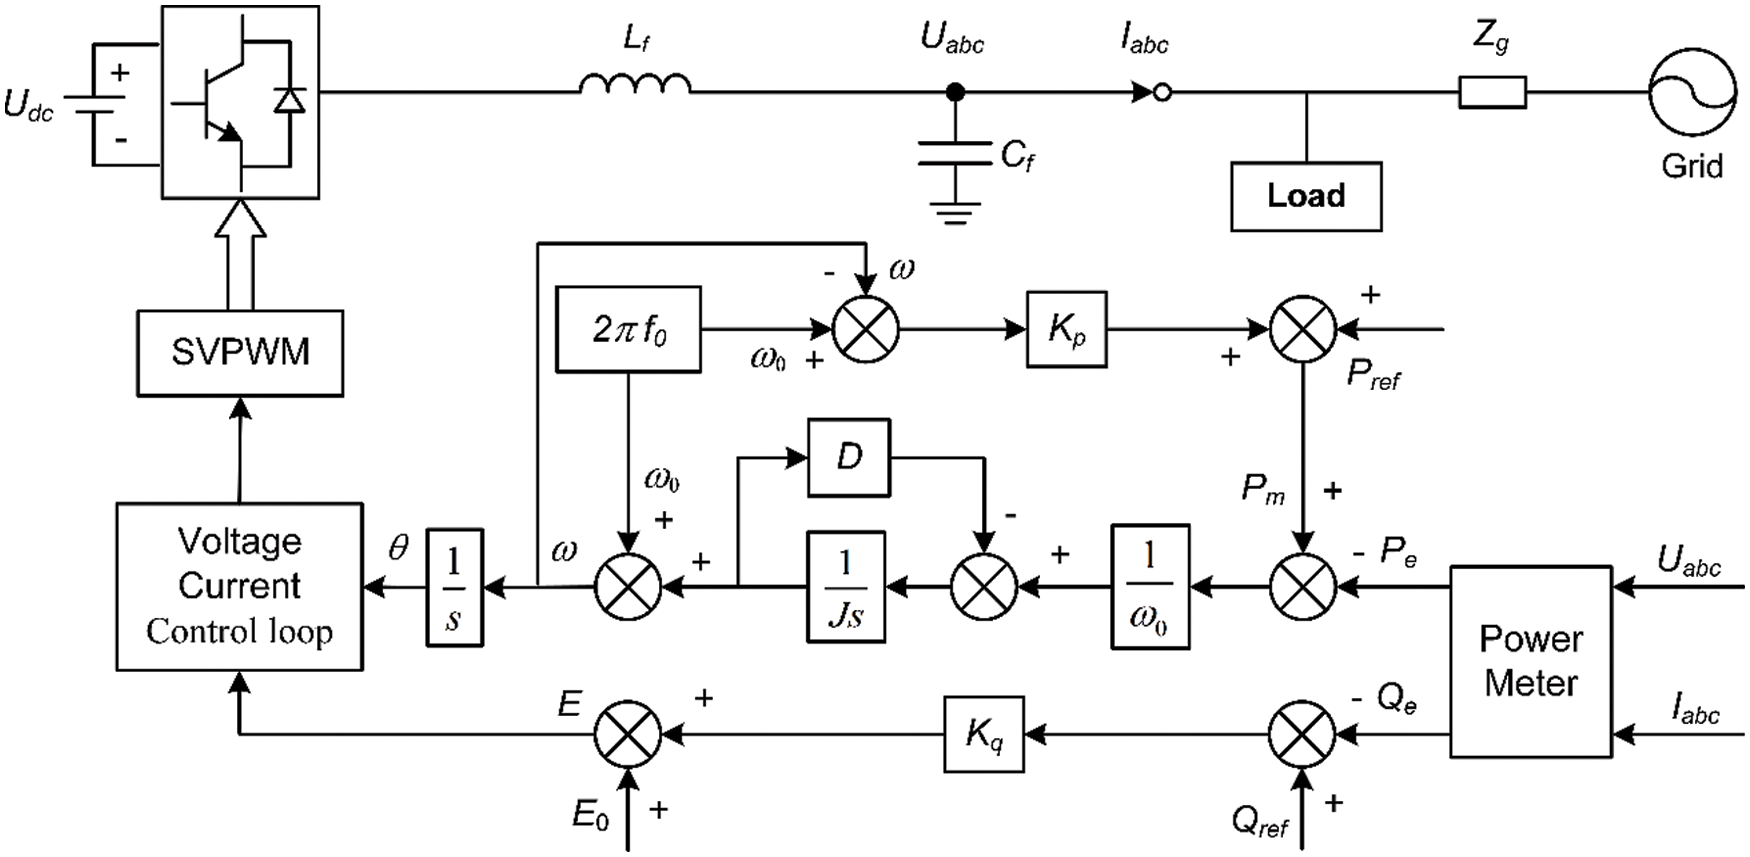
Figure 1: VSG topology and control strategy
The active and reactive power controllers of the VSG simulate the droop characteristics of the traditional synchronous generator governor and exciter, respectively, such that the inverter can perform frequency and voltage regulation [22], as in Eqs. (3) and (4).
where Pref and Qref are the given values of VSG active and reactive power, respectively; Qe is the VSG reactive power; Kp and Kq are the VSG active and reactive power droop coefficients, respectively; and E0 is the reference voltage amplitude.
The VSG output voltage Uabc and output current Iabc signals are collected from the point of common coupling and transformed into electromagnetic power using the power calculation module. The output phase and electromotive force are obtained through the VSG controller, and the output phase and electromotive force are then modulated by the voltage and current double-loop controller. Finally, the drive signal of the inverter is obtained using the space vector pulse width modulation module [23].
To analyze the influence of the key VSG parameters on low-frequency oscillation, the grid-connected VSG is equivalent to a steady-state circuit, as shown in Fig. 2. Here, δ is the phase angle of the VSG output voltage, Ug is the grid voltage amplitude, X is the VSG transmission reactance including the filter reactance and line reactance, and ZL is the equivalent load.
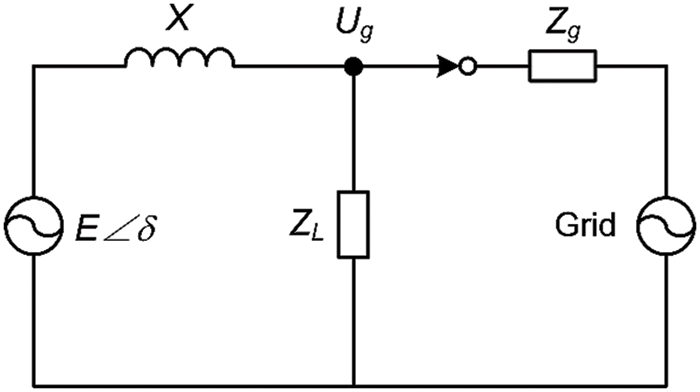
Figure 2: Steady-state circuit of grid-connected VSG
According to Fig. 2 and the principle of transmission power, the VSG active power can be expressed by Eq. (5).
where
According to frequency-domain analysis theory, the voltage and current inner loop are more sensitive in the high-frequency region, whereas the power outer loop is more sensitive in the low-frequency region, and the response speed of the inner loop is much faster than that of the outer loop [24]. Therefore, the influence of the dynamic process of the inner loop of voltage and current on the outer loop of power was ignored in this study.
To enable the VSG to support the power grid frequency, part of the voltage synchronization was added to the active power control loop in Fig. 1, and the power-frequency model of the VSG was synthesized, as shown in Fig. 3.
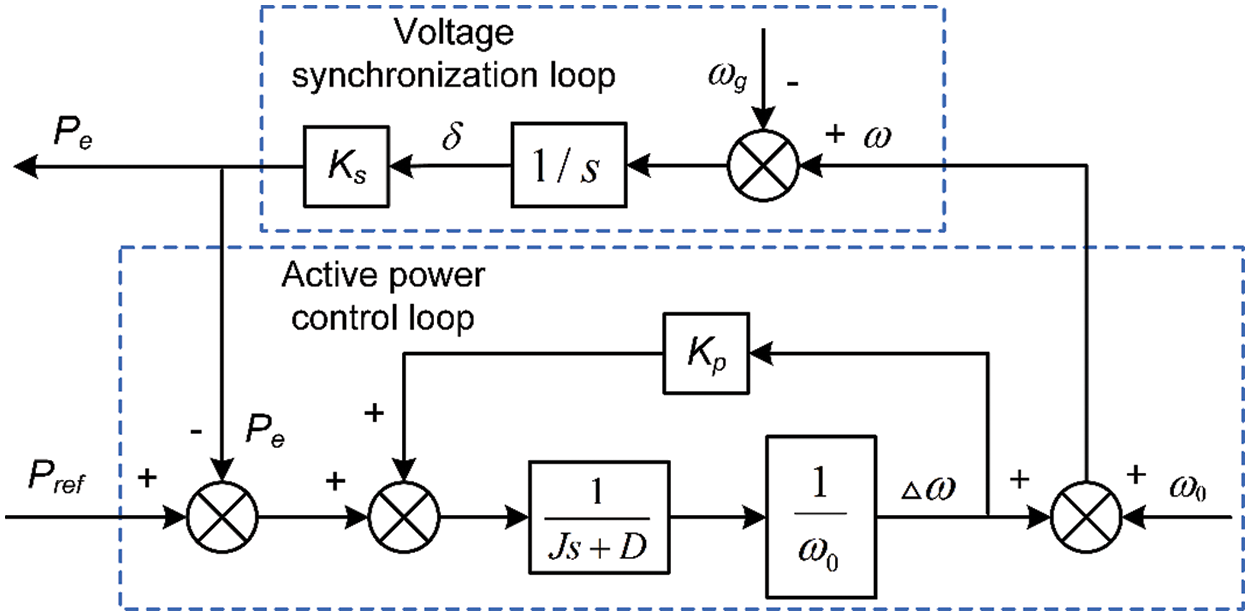
Figure 3: Power-frequency control loop of VSG
The active power-frequency model in the frequency domain can be obtained from Fig. 3, as shown in Eqs. (6)–(8).
where G(s) is the transfer function of the VSG output active power response under the active power instruction, and H(s) is the transfer function of the VSG output active power response under the angular frequency deviation of the power grid.
According to the final value theorem of the Laplace transform, when s→0, the steady-state expression of the output power can be obtained as
The effect of the grid frequency deviation on the VSG output power is shown in Fig. 4. As can be seen from the Bode diagram, the grid frequency deviation has only a slight impact on the VSG output power at low frequencies, and the slope is very small, indicating that the system has good stability at low frequencies. The grid frequency mainly influences the VSG steady-state accuracy, whereas the transient process of the active power is mainly influenced by the instruction step.
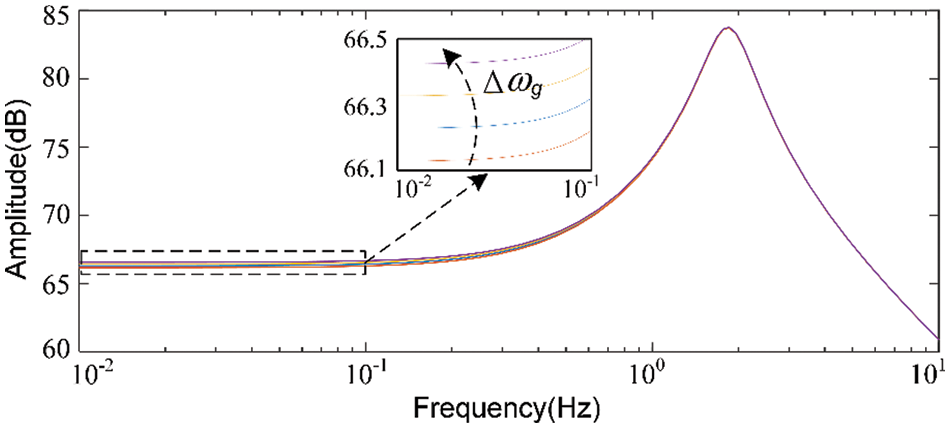
Figure 4: Effect of grid frequency deviation on VSG output power
According to Eq. (6), the output transfer function of the VSG under active instruction is obtained using Eq. (9).
By comparing Eqs. (10) and (11), the natural oscillation frequency ωn and damping ratio ζ of the grid-connected VSG can be obtained as in Eqs. (12) and (13). The natural oscillation frequency ωn and damping ratio ζ are two key parameters that describe the transient characteristics of second-order systems [25].
The essence of the system oscillation is the power-angle oscillation between the VSG and the power grid, as shown in Eq. (10), which further leads to oscillations in angular frequency, active power, and current. The oscillation frequency of the system is influenced by both J and X in Eq. (12). The larger J and X are, the lower the oscillation frequency is. Whether the oscillation of the system converges depends on the coefficient of the first-order term. If
3 Parameter Coupling of Grid-Connected VSG System
To verify the validity of the proposed model and the relevant conclusions, a simulation model was built as shown in Fig. 1. The coupling relationship between transmission reactance and damping coefficient, virtual inertia coefficient and active droop coefficient is analyzed, and the influence of parameter coupling on the stability of grid-connected VSG system is discussed. The simulation parameters are presented in Table 1.
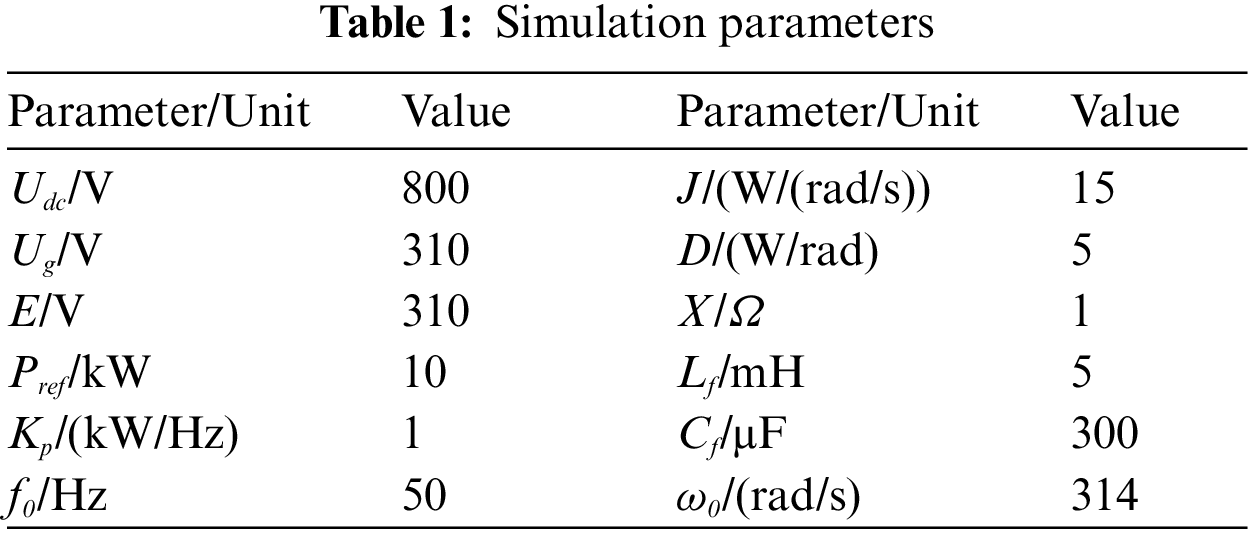
When these parameters change, the VSG generates an amplitude-frequency gain peak in the low-frequency region. The changes in the amplitude-frequency gain peak’s peak value corresponding to the oscillation frequency changes in the time-domain waveform. The changes in the amplitude-frequency response bandwidth and amplitude correspond to the changes in the oscillation dynamic response time and amplitude in the time-domain waveform.
Based on the parameters in Eqs. (9)–(13) and Table 1, two groups of coupling relationships were made for comparison. The first was to change the transmission reactance and damping coefficient. The second was to change the virtual inertia coefficient and active droop coefficient. The amplitude-frequency characteristic curves of the two groups of coefficients were drawn, revealing the influence of the grid-connected VSG system on the low-frequency oscillation characteristics, as shown in Figs. 5 and 6.
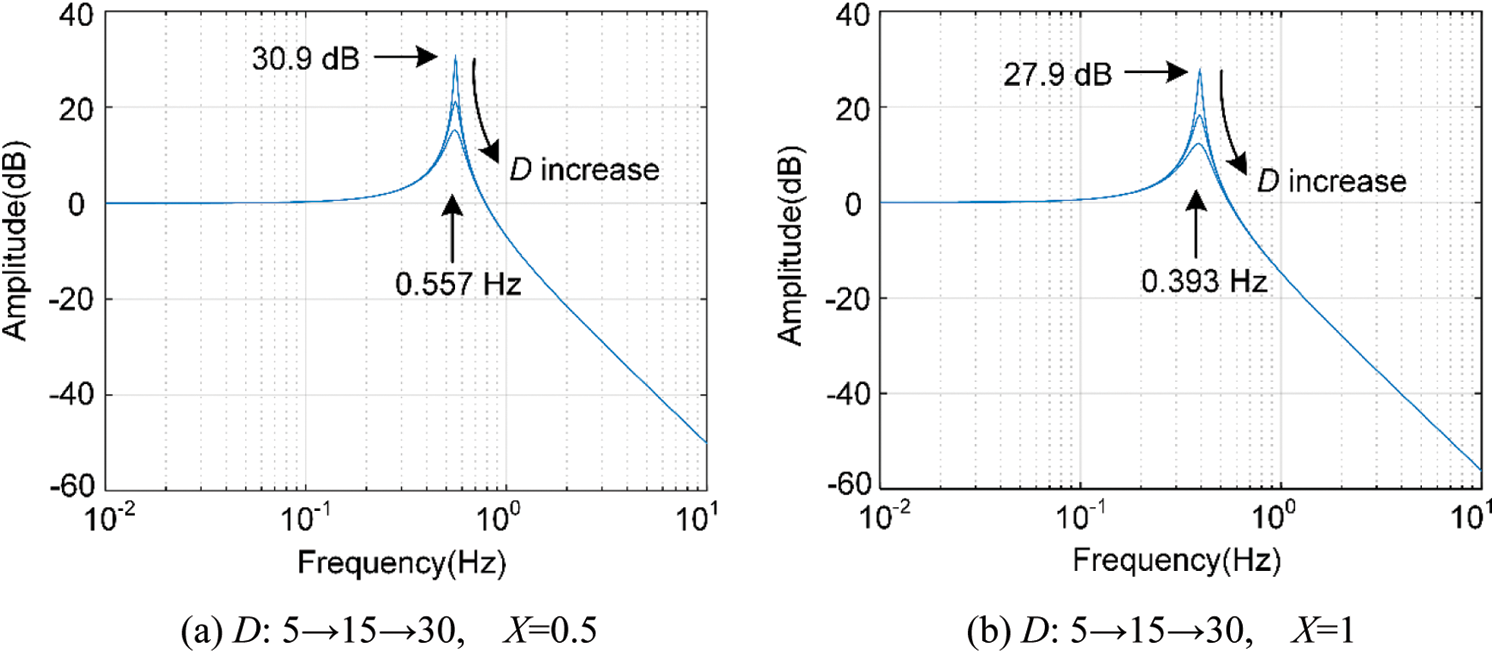
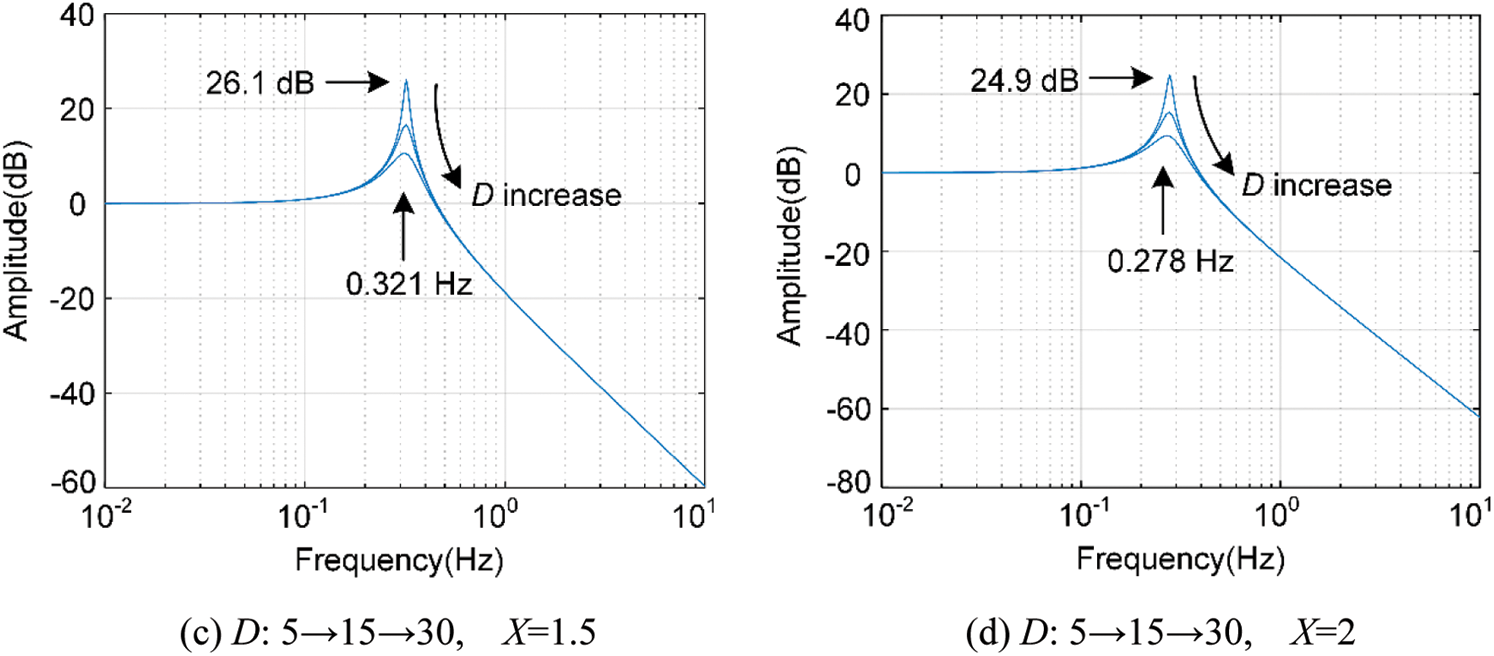
Figure 5: Amplitude-frequency characteristic analysis of X and D parameter coupling
Figure 6: Amplitude-frequency characteristic analysis of J and Kp parameter coupling
As shown in Fig. 5, if the damping is too small, the Bode diagram will have a large amplitude of the gain peak, indicating that there will be a more obvious oscillation at the peak frequency. By increasing the damping coefficient, the gain peak will be suppressed, thereby inhibiting the overshoot of the step response. As X increases, the peak value decreases, and the peak frequency decreases. When X = 0.5, the maximum peak value is 30.9 dB, and the peak angle is the smallest and the system stability is the worst.
As shown in Fig. 6, when J is 5, 15, 30 and 50, respectively, the peak value decreases with an increase of Kp, and the peak frequency remains unchanged. As J increases, the peak value increases and the peak frequency decreases. When J = 50, the maximum peak value is 23.6 dB, and the peak angle is the smallest and the system stability is the worst.
In the low-frequency oscillation simulation verification of the grid-connected virtual synchronous generator, the operating condition is a single VSG connected to an infinite grid with load, and the parameters of the system are shown in Table 1. Based on the system shown in Fig. 1, the system disturbance was simulated by applying a 10 kW active power instruction step, and the effects of four types of parameters were verified through time-domain simulation: the VSG transmission reactance X; the active droop coefficient Kp; the virtual inertia coefficient J; and the damping coefficient D.
Scenario 1: Only the transmission reactance is changed. The VSG’s active power and frequency responses with different transmission reactance values are shown in Figs. 7 and 8, respectively. As shown, when the system is running, the active power has a large overshoot of 28% at X = 1, and the overshoot decreases with an increase in X. However, with a gradual increase in X, the oscillation time increases. The oscillation frequency decreases and moves further to the low-frequency region, as shown in Fig. 7. Furthermore, the system frequency deviation decreases with an increase in X, as shown in Fig. 8. Therefore, the transmission reactance has a positive correlation with system performance. The impact on system stability decreases with an increase of X, so the oscillation frequency decreases and the system frequency deviation decreases, which is consistent with the theoretical analysis results.
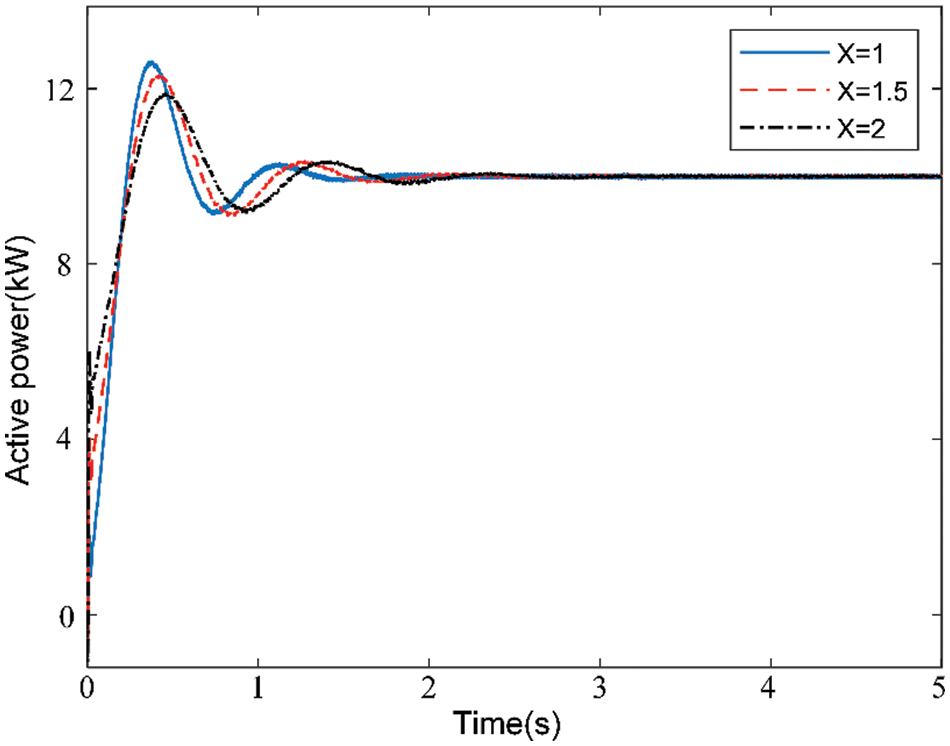
Figure 7: Influence of the transmission reactance on VSG active oscillation

Figure 8: Influence of the transmission reactance on system frequency
Scenario 2: Only the active droop coefficient is changed. The active power and frequency responses of the VSG with different active droop coefficients are shown in Figs. 9 and 10, respectively. As shown, when the system is running, a change in Kp will cause a change in the overshoot of the low-frequency oscillation, but will not cause a change in the oscillation frequency. When Kp increases gradually, the maximum overshoot decreases, and the oscillation time remains unchanged. When Kp = 1 and Kp = 5, there is still a certain overshoot. Until Kp = 10, the overshoot is basically controlled, the output active power converges, and the system dynamic performance is optimized, as shown in Fig. 9. In addition, the system frequency deviation decreases with an increase in Kp, but the sensitivity of reaction Kp is low and the change is not obvious, as shown in Fig. 10. Therefore, the stability of the system gradually improves with an increase in Kp; the oscillation frequency remains unchanged, while the oscillation amplitude decreases, the system frequency deviation decreases, and the adjustment also decreases. This is consistent with the theoretical analysis results.
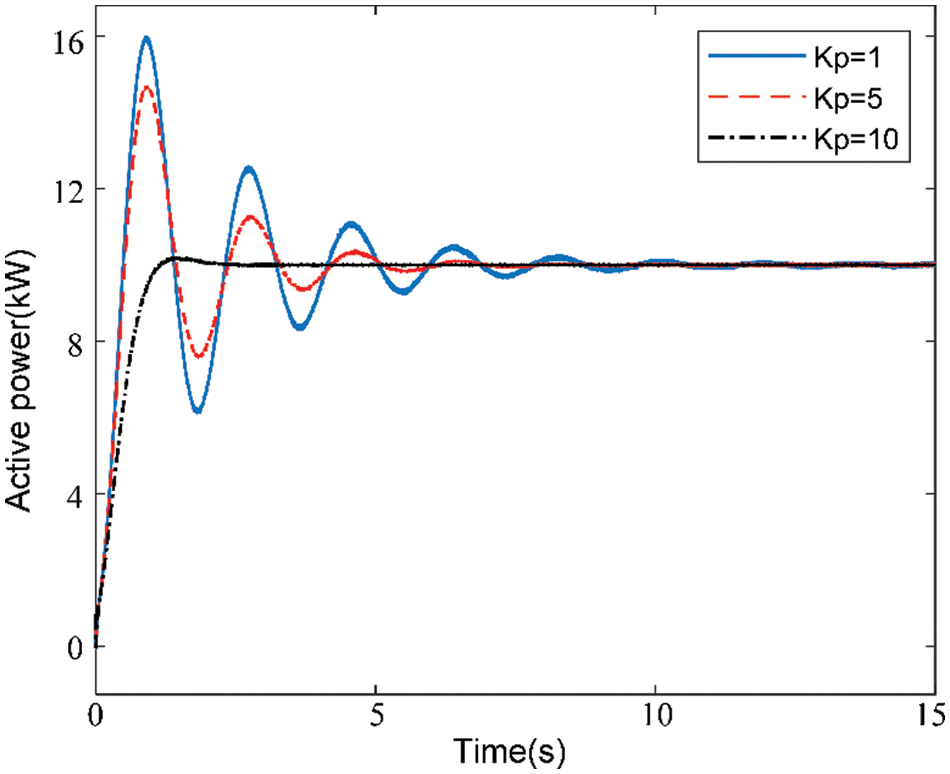
Figure 9: Influence of the active droop coefficient on VSG active oscillation
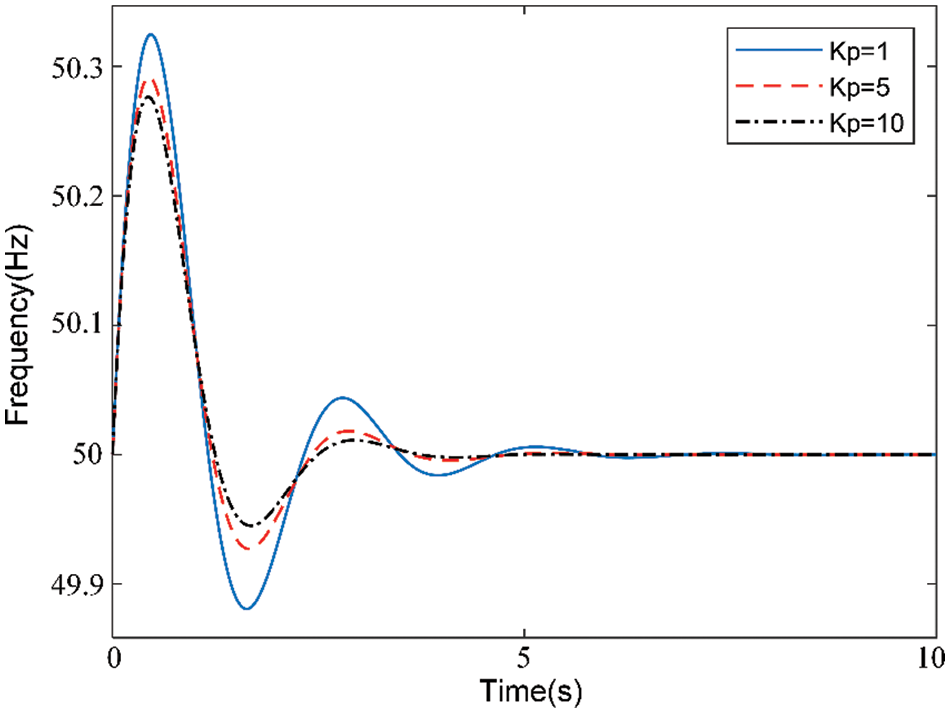
Figure 10: Influence of the active droop coefficient for on frequency
Scenario 3: Only the virtual inertia coefficient is changed. The active power and frequency responses of the VSG with different virtual inertia coefficients are shown in Figs. 11 and 12, respectively. The influence of J on the VSG output power is expressed in terms of the overshoot and frequency, as shown in Fig. 11. When J increases gradually, the maximum overshoot also increases, the oscillation time increases, and the oscillation frequency decreases. The frequency response of the system is shown in Fig. 12. When J increases, the deviation decreases, but the time required for frequency stabilization is prolonged. It can be observed that the virtual inertia coefficient J has a negative correlation with the performance of the system, and in both underdamped (0 < ζ < 1) modes, the increase in J has a greater impact on the system stability, which is consistent with the theoretical analysis results.
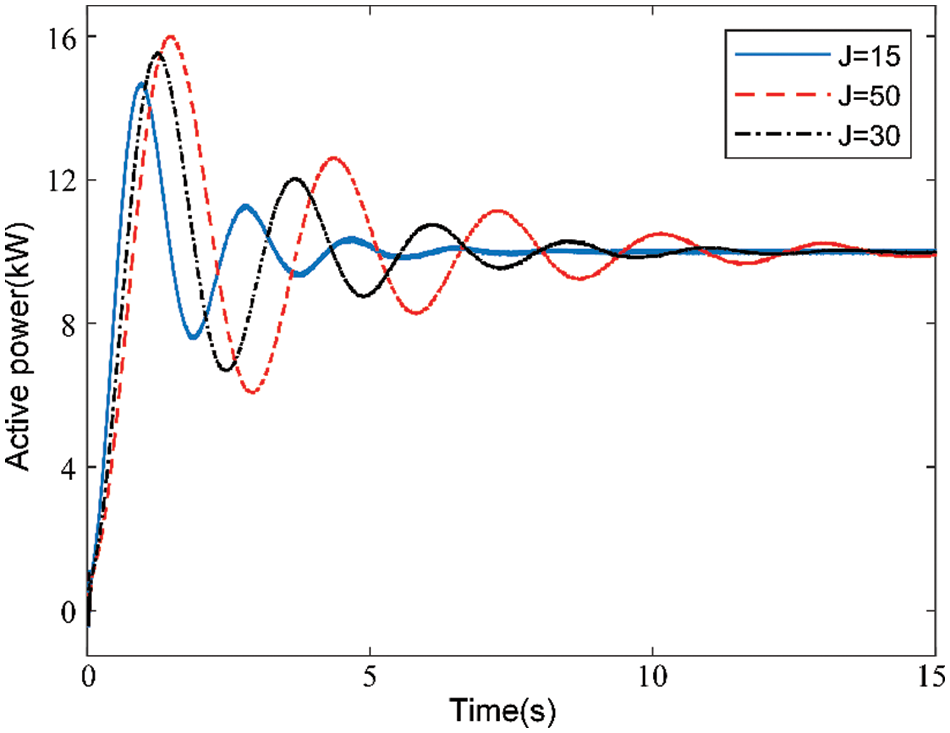
Figure 11: Influence of the virtual inertia coefficient on VSG active oscillation
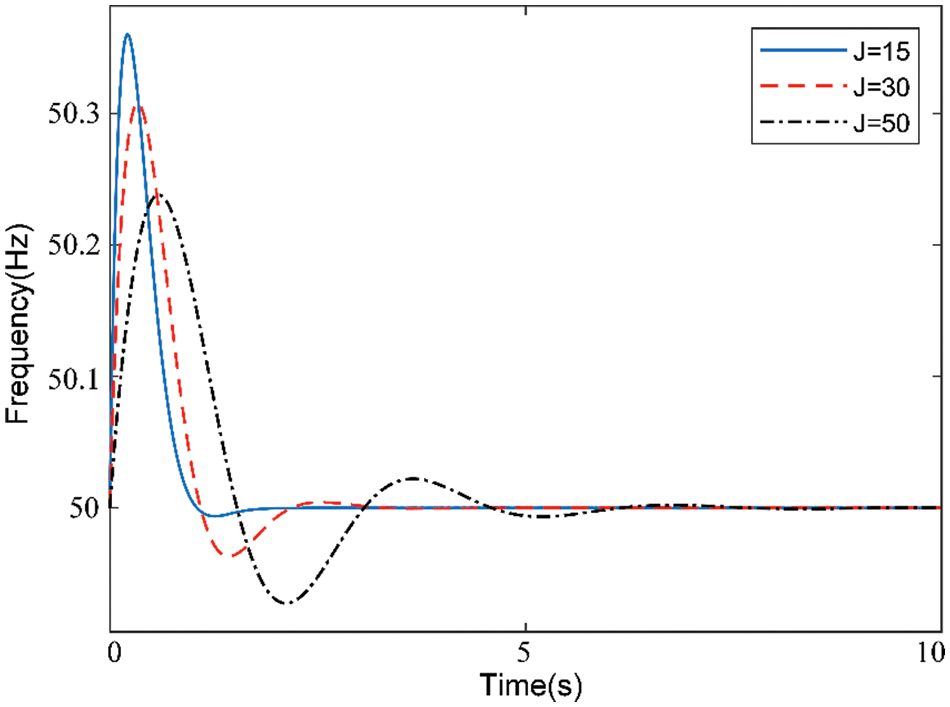
Figure 12: Influence of the virtual inertia coefficient on system frequency
Scenario 4: Only the damping coefficient is changed. The simulation results for the VSG output active power oscillation under different gains of D are shown in Fig. 13. The VSG active power instruction step was from 10 to 12 kW to respond to the grid disturbance at 3 s and different damping coefficients were set to observe the influence of D on the low-frequency oscillation of the VSG output power.
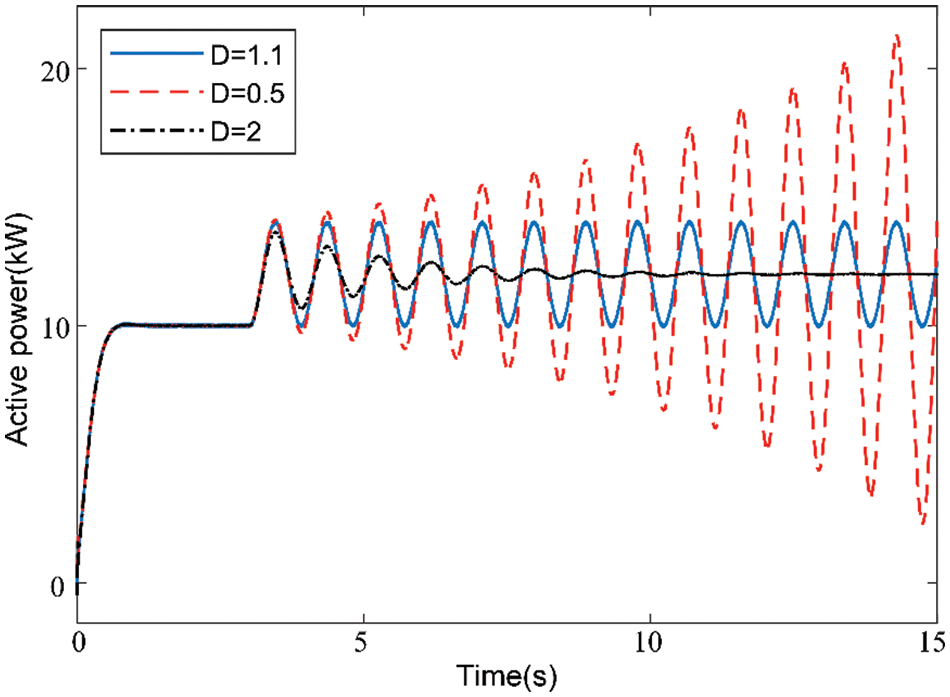
Figure 13: Influence of the damping coefficient on VSG active oscillation
The damping coefficient was set to 100 and the operation reached a stable state when t < 3 s. The active power step from 10 to 12 kW generates instruction disturbance when t = 3 s, and D is changed to a different value to verify the stability range of the system. According to frequency-domain analysis theory, the oscillation is divergent when ζ < 0 and converges to the steady-state region after some time when 0 < ζ < 1. The output active power of the VSG is divergent when D = 0.5, as shown in Fig. 13. The oscillation of the VSG output power has a constant amplitude when D = 1.1. The output power of the VSG converges when D = 2, but it takes a long time to reach the steady-state value. These simulation results are consistent with the theoretical analysis.
In this study, a small-signal model of a single VSG connected to an infinite power grid was established, and the mechanism of VSG participating in the low-frequency oscillation of the power grid was studied using the frequency-domain analysis method. In this way, the frequency-domain characteristics of the closed-loop transfer function of the VSG power-frequency small-signal were used to analyze the influence mechanism of the transmission reactance, active droop coefficient, virtual inertia coefficient, and damping coefficient on the frequency and amplitude of low-frequency oscillation. Furthermore, these results provide technical theoretical support for the application of VSG in energy grids.
Funding Statement: This work was supported by Science and Technology Project of State Grid Liaoning Electric Power Supply Co., Ltd. (2021YF-82).
Conflicts of Interest: The authors declare that they have no conflicts of interest to report regarding the present study.
References
1. Zhang, X., Zhong, Q. C. (2016). Improved adaptive-series-virtual-impedance control incorporating minimum ripple point tracking for load converters in DC systems. IEEE Transactions on Power Electronics, 31(12), 8088–8095. DOI 10.1109/TPEL.2016.2581766. [Google Scholar] [CrossRef]
2. Zarifakis, M., Coffey, W. T., Kalmykov, Y. P. (2019). Active damping of power oscillations following frequency changes in low inertia power systems. IEEE Transactions on Power Systems, 34(6), 4984–4992. DOI 10.1109/TPWRS.59. [Google Scholar] [CrossRef]
3. Yu, Y., Grijalva, S., Thomas, J. J. (2016). Oscillation energy analysis of inter-area low-frequency oscillations in power systems. IEEE Transactions on Power Systems, 31(2), 1195–1203. DOI 10.1109/TPWRS.2015.2414175. [Google Scholar] [CrossRef]
4. Zhang, G., Yang, J., Wang, H. (2020). Presynchronous grid-connection strategy of virtual synchronous generator based on virtual impedance. Mathematical Problems in Engineering, 2020, 3690564. DOI 10.1155/2020/3690564. [Google Scholar] [CrossRef]
5. Zhang, W., Cantarellas, A. M., Rocabert, J. (2016). Synchronous power controller with flexible droop characteristics for renewable power generation systems. IEEE Transactions on Sustainable Energy, 7(4), 1572–1582. DOI 10.1109/TSTE.2016.2565059. [Google Scholar] [CrossRef]
6. Saadatmand, M., Gharehpetian, G. B., Moghassemi, A. (2021). Damping of low-frequency oscillations in power systems by large-scale PV farms: A comprehensive review of control methods. IEEE Access, 9, 72183–72206. DOI 10.1109/ACCESS.2021.3078570. [Google Scholar] [CrossRef]
7. Huang, Y., Wang, D., Shang, L. (2017). Modeling and stability analysis of DC-link voltage control in multi-VSCs with integrated to weak grid. IEEE Transactions on Energy Conversion, 32(3), 1127–1138. DOI 10.1109/TEC.2017.2700949. [Google Scholar] [CrossRef]
8. Chen, M., Zhou, D., Blaabjerg, F. (2020). Modelling, implementation, and assessment of virtual synchronous generator in power systems. Journal of Modern Power Systems and Clean Energy, 8(3), 399–411. DOI 10.35833/MPCE.2019.000592. [Google Scholar] [CrossRef]
9. Xu, Y., Nian, H., Hu, B. (2021). Impedance modeling and stability analysis of VSG controlled type-IV wind turbine system. IEEE Transactions on Energy Conversion, 36(4), 3438–3448. DOI 10.1109/TEC.2021.3062232. [Google Scholar] [CrossRef]
10. Wang, H., Yang, J., Chen, Z. (2019). Analysis and suppression for frequency oscillation in a wind-diesel system. IEEE Access, 7, 22818–22828. DOI 10.1109/ACCESS.2019.2894011. [Google Scholar] [CrossRef]
11. Li, D., Li, S., Zhang, S. (2022). Aging state prediction for supercapacitors based on heuristic kalman filter optimization extreme learning machine. Energy, 250, 123773. DOI 10.1016/j.energy.2022.123773. [Google Scholar] [CrossRef]
12. Ruan, J., Shi, Z., Yu, M. (2021). Simplified damping analysis and suppression method for low-frequency oscillation introduced by virtual synchronous generator. Journal of Power Electronics, 21(10), 1600–1610. DOI 10.1007/s43236-021-00293-x. [Google Scholar] [CrossRef]
13. Choopani, M., Hosseinian, S. H., Vahidi, B. (2020). New transient stability and LVRT improvement of multi-VSG grids using the frequency of the center of inertia. IEEE Transactions on Power Systems, 35(1), 527–538. DOI 10.1109/TPWRS.2019.2928319. [Google Scholar] [CrossRef]
14. Ma, J., Qiu, Y., Li, Y. (2016). Research on the impact of DFIG virtual inertia control on power system small-signal stability considering the phase-locked loop. IEEE Transactions on Power Systems, 32(3), 2094–2105. DOI 10.1109/TPWRS.2016.2594781. [Google Scholar] [CrossRef]
15. Leitner, S., Yazdanian, M., Mehrizi-Sani, A. (2017). Small-signal stability analysis of an inverter-based microgrid with internal model-based controllers. IEEE Transactions on Smart Grid, 9(5), 5393–5402. DOI 10.1109/TSG.5165411. [Google Scholar] [CrossRef]
16. Karami, M., Seifi, H., Mohammadian, M. (2016). Seamless control scheme for distributed energy resources in microgrids. IET Generation, Transmission & Distribution, 10(11), 2756–2763. DOI 10.1049/iet-gtd.2015.1466. [Google Scholar] [CrossRef]
17. Liu, J., Miura, Y., Ise, T. (2015). Comparison of dynamic characteristics between virtual synchronous generator and droop control in inverter-based distributed generators. IEEE Transactions on Power Electronics, 31(5), 3600–3611. DOI 10.1109/TPEL.2015.2465852. [Google Scholar] [CrossRef]
18. Shi, K., Song, W., Ge, H. (2019). Transient analysis of microgrids with parallel synchronous generators and virtual synchronous generators. IEEE Transactions on Energy Conversion, 35(1), 95–105. DOI 10.1109/TEC.60. [Google Scholar] [CrossRef]
19. Wu, W., Chen, Y., Zhou, L. (2018). Sequence impedance modeling and stability comparative analysis of voltage-controlled VSGs and current-controlled VSGs. IEEE Transactions on Industrial Electronics, 66(8), 6460–6472. DOI 10.1109/TIE.41. [Google Scholar] [CrossRef]
20. Wang, H., Yang, J., Chen, Z. (2018). Model predictive control of PMSG-based wind turbines for frequency regulation in an isolated grid. IEEE Transactions on Industry Applications, 54(4), 3077–3089. DOI 10.1109/TIA.2018.2817619. [Google Scholar] [CrossRef]
21. Li, X., Chen, G. (2018). Improved adaptive inertia control of VSG for low frequency oscillation suppression. IEEE International Power Electronics and Application Conference and Exposition, pp. 1–5. Shenzhen, China. [Google Scholar]
22. Li, M., Shu, S., Wang, Y. (2022). Analysis and improvement of large-disturbance stability for grid-connected VSG based on output impedance optimization. IEEE Transactions on Power Electronics, 37(8), 9807–9826. DOI 10.1109/TPEL.2022.3153563. [Google Scholar] [CrossRef]
23. Wu, L., Wang, X., Hao, X. (2017). Tertiary control strategy for optimal voltage unbalance compensation in island microgrid. 2017 36th Chinese Control Conference (CCC), pp. 10761–10766. Dalian, China. [Google Scholar]
24. Xu, H., Yu, C., Liu, C. (2019). An improved virtual inertia algorithm of virtual synchronous generator. Journal of Modern Power Systems and Clean Energy, 8(2), 377–386. DOI 10.35833/MPCE.2018.000472. [Google Scholar] [CrossRef]
25. Qin, B., Xu, Y., Yuan, C., Jia, J. X. (2021). A unified method of frequency oscillation characteristic analysis for multi-VSG grid-connected system. IEEE Transactions on Power Delivery, 37(1), 279–289. [Google Scholar]
Cite This Article
 Copyright © 2023 The Author(s). Published by Tech Science Press.
This work is licensed under a Creative Commons Attribution 4.0 International License , which permits unrestricted use, distribution, and reproduction in any medium, provided the original work is properly cited.
 Downloads
 Citation Tools