
 Submit a Paper
 Propose a Special lssue
 Open Access
ARTICLE

Ergonomic Reliability Assessment of VDT System for Operation Design Based on Improved BPNN and HCR under Special Circumstances
1 Institute of Industrial Design, Guangzhou University, Guangzhou, 510006, China
2 School of Mechanical and Electrical Engineering, Guangzhou University, Guangzhou, 510006, China
* Corresponding Author: Zheng Liu. Email:
(This article belongs to the Special Issue: Computer-Aided Structural Integrity and Safety Assessment)
Computer Modeling in Engineering & Sciences 2023, 136(1), 685-707. https://doi.org/10.32604/cmes.2023.025058
Received 19 June 2022; Accepted 31 August 2022; Issue published 05 January 2023
 View Full Text
 Download PDF
Abstract
Ergonomic reliability plays a significant role in the safe operation of devices. With the spread of infectious diseases around the world, in work environments with high loads and high infection rates, medical staff work in a state of high self-protection. The use of visual display terminal (VDT) for medical equipment has undergone fundamental changes, and the traditional medical equipment human-machine interface design needs to be improved. After the completion of design and development, a VDT design enters the experimental testing stage, which has significant limitations for simulating the work of medical staff in the high-load and high-infection environments. The testing cost is high, and subjects face harsh conditions; thus, an ergonomic reliability model that can predict the use of VDT in such special high-infection and high-load circumstances must be established. An ergonomic reliability model based on an improved backpropagation neural network (BPNN) and human cognition reliability (HCR) is proposed for predicting and evaluating operation flows according to medical equipment VDTs. Firstly, a small data sample can be used to train BPNN to generate a network that can ensure suitable accuracy. To prevent the model from falling into local optimal solutions, the bat algorithm is introduced to improve the BPNN. Compared to a traditional BPNN, the superiority of the improved BPNN is clearly demonstrated. Secondly, the HCR method is used to analyze and highlight changes in the human factor reliability of VDTs for medical equipment in different time processes and operating processes according to BPNN prediction results, to provide a reference for selecting the optimal method. Finally, the validity and availability of the proposed method are verified through an eye tracker experiment and statistical analysis results.Keywords
The reliability of visual display terminals (VDTs), which are among the most important components of engineering systems, requires significant attention. VDT operation modes have gradually become an important form of labor in modern society. The human-computer interaction method of cognitive VDT operation has become increasingly common because operators must process large amounts of information. Therefore, the level of performance in man-machine operating systems has become an important factor related to system reliability, and improving human reliability can significantly improve the safety and implementation processes of various operating systems [1]. With the outbreak of the highly contagious coronavirus, fundamental changes have occurred in equipment operation, particularly for the work of the medical staff with strict self-protection requirements, but few studies have been performed on the ergonomic reliability; thus, there are more perspectives to explore. Under special circumstances, VDT operation of medical equipment is the most representative, with high complexity and relatively high reliability requirements in the special environment of high infection and large workloads. If the special requirements of high-load transmission are not considered, poor VDT design may lead to critical security issues, threatening social stability, life, and property. This research is based on a case study of a highly infectious and high-load working environment. The VDT operation of medical equipment is demanding and professional operators are required to ensure the high accuracy of analysis results. In the fight against the highly contagious virus, medical examiners are required to wear three layers of protective clothing. Additionally, they wear three pairs of medical gloves, which is inconvenient for movement. There are too many layers of gloves, and the gloves overlap with three layers of protective suits, significantly reducing the wrist joint flexibility and resulting in more failures and actions in the operation process, and low work efficiency. Therefore, it is important to consider the reliability, fatigue and uncertainty analysis of the operating VDT system via multidisciplinary design. The reliability of multidisciplinary design optimization and evaluation has come to the fore and has been applied in the field of complex engineering system design [2]. Multidisciplinary design with different intelligent algorithms are often used modern engineering, e.g., for fatigue analysis [3], and analysis of uncertain factors [4]. The design method of VDT systems involves many disciplines, and the operation flow design of VDT systems shares these characteristics.
The reliability of VDT human factors is important and is related to the physical and mental health of VDT operators. Viviani et al. [5] evaluated various aspects of the human factor engineering of touchscreen technology used in medical devices and demonstrated that human factor reliability analysis is crucial. Therefore, human reliability analysis should not be ignored in the process of VDT operation [6]. Fatigue reliability studies are important in traditional mechanical fields [7]; thus, the influence of human fatigue on reliability in the medical field also needs to be evaluated. Tomei et al. assessed the mental and physical health of VDT workers and found that the health of VDT workers is often neglected, particularly with regard to mental fatigue [8]. A survey conducted by Ye et al. [9] indicated that users suffered from eye strain, neck or upper limb pain, back pain and psychological distress as a result of VDT work. Nutnicha et al. [10] determined that humans increased their use of VDTs during COVID-19 lockdown periods. Kyung et al. studied the effects of the curvature radii of VDT displays and the sizes of display screens on visual search accuracy and speed in addition to visual weariness [11]. The VDT operation mode of medical equipment is important because it affects the quality and development of medical instrumentation particularly for VDTs in laboratories. When VDT operators attempt to multitask or perform many serial tasks, the cognitive cost of video display work is high, and the efficiency is reduced [12]. Sánchez-Brau et al. [13] hypothesized that VDT workers suffer from computer syndrome; thus, proper lighting and ergonomic posture should be considered in the use of VDTs, and human reliability factors should be considered in the design of VDTs. However, in an environment with highly infectious diseases, the status of VDTs operated by medical professionals requiring a high degree of self-protection changes fundamentally, and the relevant research must be expanded and deepened.
Uncertain factors affect reliability problems in actual engineering [14], and it is difficult to construct relationships between uncertain factors. Many different methods are applied for prediction in reliability analysis [15,16]. Neural networks are often used in VDT-related prediction and evaluation research [17,18]. Uncertainty quantification is required for reliability assessment [19,20], and the black-box structures of neural networks can accurately construct relationships between factors with uncertain characteristics. Predicting headaches for VDT workers has been achieved through hand-pose classification using a convolutional neural network. Neural networks have been used for analysis and evaluation for automatic three-dimensional facial-expression identification for VDT operators in human-computer interaction fields [21]. Artificial neural network techniques have been applied to VDT research to combine information from multiple eye measurements and produce reliable near-real-time workload metrics for innumerous visuospatial jobs [22]. Additionally, the application of neural networks to the prediction of body movements is being investigated. In addition to being successfully applied to face recognition, the backpropagation neural network (BPNN) model has been applied to hand gesture recognition during the operation of VDTs [23]. For example, Jian et al. studied gesture recognition in a mobile terminal using a BPNN [24]. Thus, it is reasonable and effective to apply BPNNs in behavior and gesture studies related to VDTs. Additionally, BPNNs are widely used in mechanical design and have been effectively used for reliability analysis [25]. For example, a BPNN was used in a reliability analysis framework for a computer-aided medical decision-making system [26]. Artificial neural networks are commonly used in ergonomic research. Anghel et al. developed an approach for redesigning ergonomic workstations using an artificial neural network together with rapid upper limb evaluation [27]. Fernandez et al. conducted accurate ergonomic risk assessment based on open-source neural networks to detect bones in workers [28]. BPNNs have also been applied to ergonomic research [29]. Taghavifar et al. [30] developed a multilayer feedforward neural network combined with the backpropagation mathematical method to predict the apparent mass of a seated body to perform layout optimization at divergent vibration excitation levels. Artificial neural networks also have good application prospects in the field of ergonomic reliability [31]. Different metaheuristic algorithms are often used to optimize neural networks. To avoid falling into local optima, the bat algorithm (BA) is adopted to reduce the error [32]. However, in many cases, the reliability analysis results change over time [33,34], and the ergonomic reliability also changes over time. If a BPNN is used to predict multiple unknown factors such as human failure probabilities, time, and human cognition simultaneously, the model will become complex, and its accuracy will decrease. To more accurately reflect the effects of time and human cognition on human factor reliability in special circumstances, the human cognition reliability (HCR) method has been introduced. The HCR method can be used to evaluate reliability by classifying and studying different cognitive behaviors with related parameters [35]. The traditional structural reliability method aims to establish a probabilistic model [36,37]; likewise, HCR can be used to determine the probability of human error to analyze ergonomic reliability. For example, Farcasiu et al. applied HCR as a type of probabilistic safety assessment technique to identify human factor engineering concepts in approaches related to performance shaping factors (PSFs) [38]. Hidetoshi et al. [39] used HCR to analyze drivers via simulator experiments. In an environment with high loads and high infection rates, HCR should be used to distinguish the behaviors of ergonomic reliability and reflect the role of time in ergonomic reliability.
In this research, an improved BPNN and HCR were integrated to assess the ergonomic reliability in the operation design of a VDT system. Because experiments are risky in highly infectious environments, it is important to make predictions based on data obtained in high-load simulation environments. This approach is also applicable to other high-risk environments. First, a BPNN was applied to fit the relationships between operator states and the related attributes of control keys, as well as the operation failure probabilities of operators. The introduction of intelligent algorithm makes the failure probability analysis more accurate [40]. To prevent the model from becoming trapped in local optimal solutions, the BA was used to improve the BPNN [41]. Second, according to the operation failure probabilities predicted by the BPNN, an operator action tree (OAT) was used to calculate the operation failure probabilities of top events under special circumstances, and the K3 values, which act as PSFs for HCR, were calculated. Third, the changes in the HCR based ergonomic reliability in different states were compared over time, and optimal schemes were identified. Finally, the ergonomic reliability of the proposed method was verified through eye movement tracking and statistical calculations.
2 Ergonomic Reliability Assessment for VDT Systems with Operation Design under Special Circumstances
2.1 Probability Prediction of Action Failure under Special Circumstances
In this study, the operation of VDTs with multiple layers of gloves in a highly infectious environment was considered as a special case. In different operating environments, operators have different degrees of protection. In infectious environments with different levels of severity, operators use the VDT while wearing gloves with different numbers of layers or thicknesses. To identify the relationship between the thickness of the gloves worn by operators and the action failure probability of operating different VDT designs, it is necessary to construct the human reliability relationship based on the contact area between the operator and VDT keys, size of the keys, and spacing between controls.
A BPNN can be used to predict action failure probabilities under special circumstances. Using BP, the weights of a network are adjusted and training is conducted for multiple iterations, to minimize the sum of squares of the network errors. Training is completed when the error threshold is greater than or equal to the sum of squared errors. In addition, the weights and deviations of the network are stored.
A BPNN with a three-layer network structure can approximate a rational function with arbitrary accuracy. A BPNN was constructed as shown in Fig. 1. The largest length of the contact surface between a gloved or bare hand and the VDT is the first input, the smallest width of a control key is the second input, and the shortest distance between control keys is the third input. The values of the neurons in the input layer are denoted as
The probability function relationship between the action failure probability and contact area between the operator and VDT interface can be obtained using the following Bayesian formula:
here,
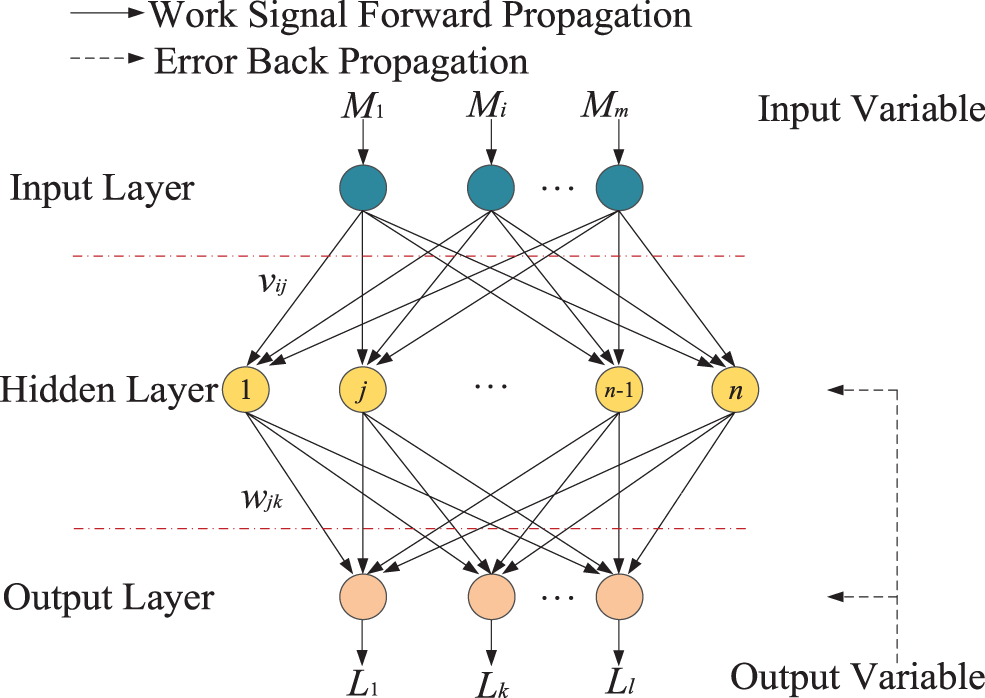
Figure 1: BPNN architecture
The Levenberg-Marquardt (L-M) algorithm can be used to increase the efficiency of the original BPNN significantly [42]. It is a fast mathematical technique based on the standard numerical optimization method. In addition, the gradient descent method employs the Gauss-Newton method. Therefore, this algorithm has not only the local convergence of the Gauss-Newton method but also the global characteristics of the gradient descent method.
The basic principles of the L-M algorithm are as follows [43]. Assuming that
In Eqs. (2) and (3),
According to the Gauss-Newton method,
here,
The BA was proposed by Xin-She Yang in 2010 as a novel bionic mathematical method. It simulates the behavior of bats in nature, which detect and capture prey using ultrasonic waves, to perform a random search for an optimal population. A population of bat individuals is mapped to the same number of feasible solutions in the problem space, and the search and optimization processes are applied to bats searching for prey and moving to new locations. A fitness function is used as the basis for judging the positions of bats. The survival of the fittest bats can be regarded as an iterative process of retaining feasible solutions and removing poor solutions. Compared with other metaheuristic algorithms inspired by nature, such as genetic algorithm (GA) and particle swarm optimization (PSO), the BA has fewer parameters that must be adjusted [32]. Additionally, it has a high convergence speed, search efficiency, prediction accuracy and certain stability [44]. Thus, the BA was used to optimize the weight and threshold of the BPNN.
The process of using the BA to improve the LM-BPNN is summarized below as shown in Fig. 2.
Step 1: The LM-BPNN is initialized. The relevant parameters are determined according to the inputs and the outputs of the entire network. These parameters include the number of nodes, weights and thresholds, and learning rates of the input, hidden and output layers.
Step 2: The weights and thresholds are optimized using the BA. In a D-dimensional search space, the bats locate and hunt prey as follows. First, the parameters of the bat population are initialized. D represents the population search dimension, and b represents the total number of bats. The pulse frequency is set within the range of
here, the pulse frequency of the ith bat in the process of hunting prey is set to
here, the pulse frequency of a bat at time
Step 3: The errors are calculated by the neural network.
Step 4: The weights and thresholds of this neural network are improved and the network is trained.
Step 5: If the termination conditions are met, the algorithm stops. If not, we return to Step 3, where the sigmoid function is used as the transfer function. The sigmoid function is a continuous and differentiable function. Finally, the prediction results are output.
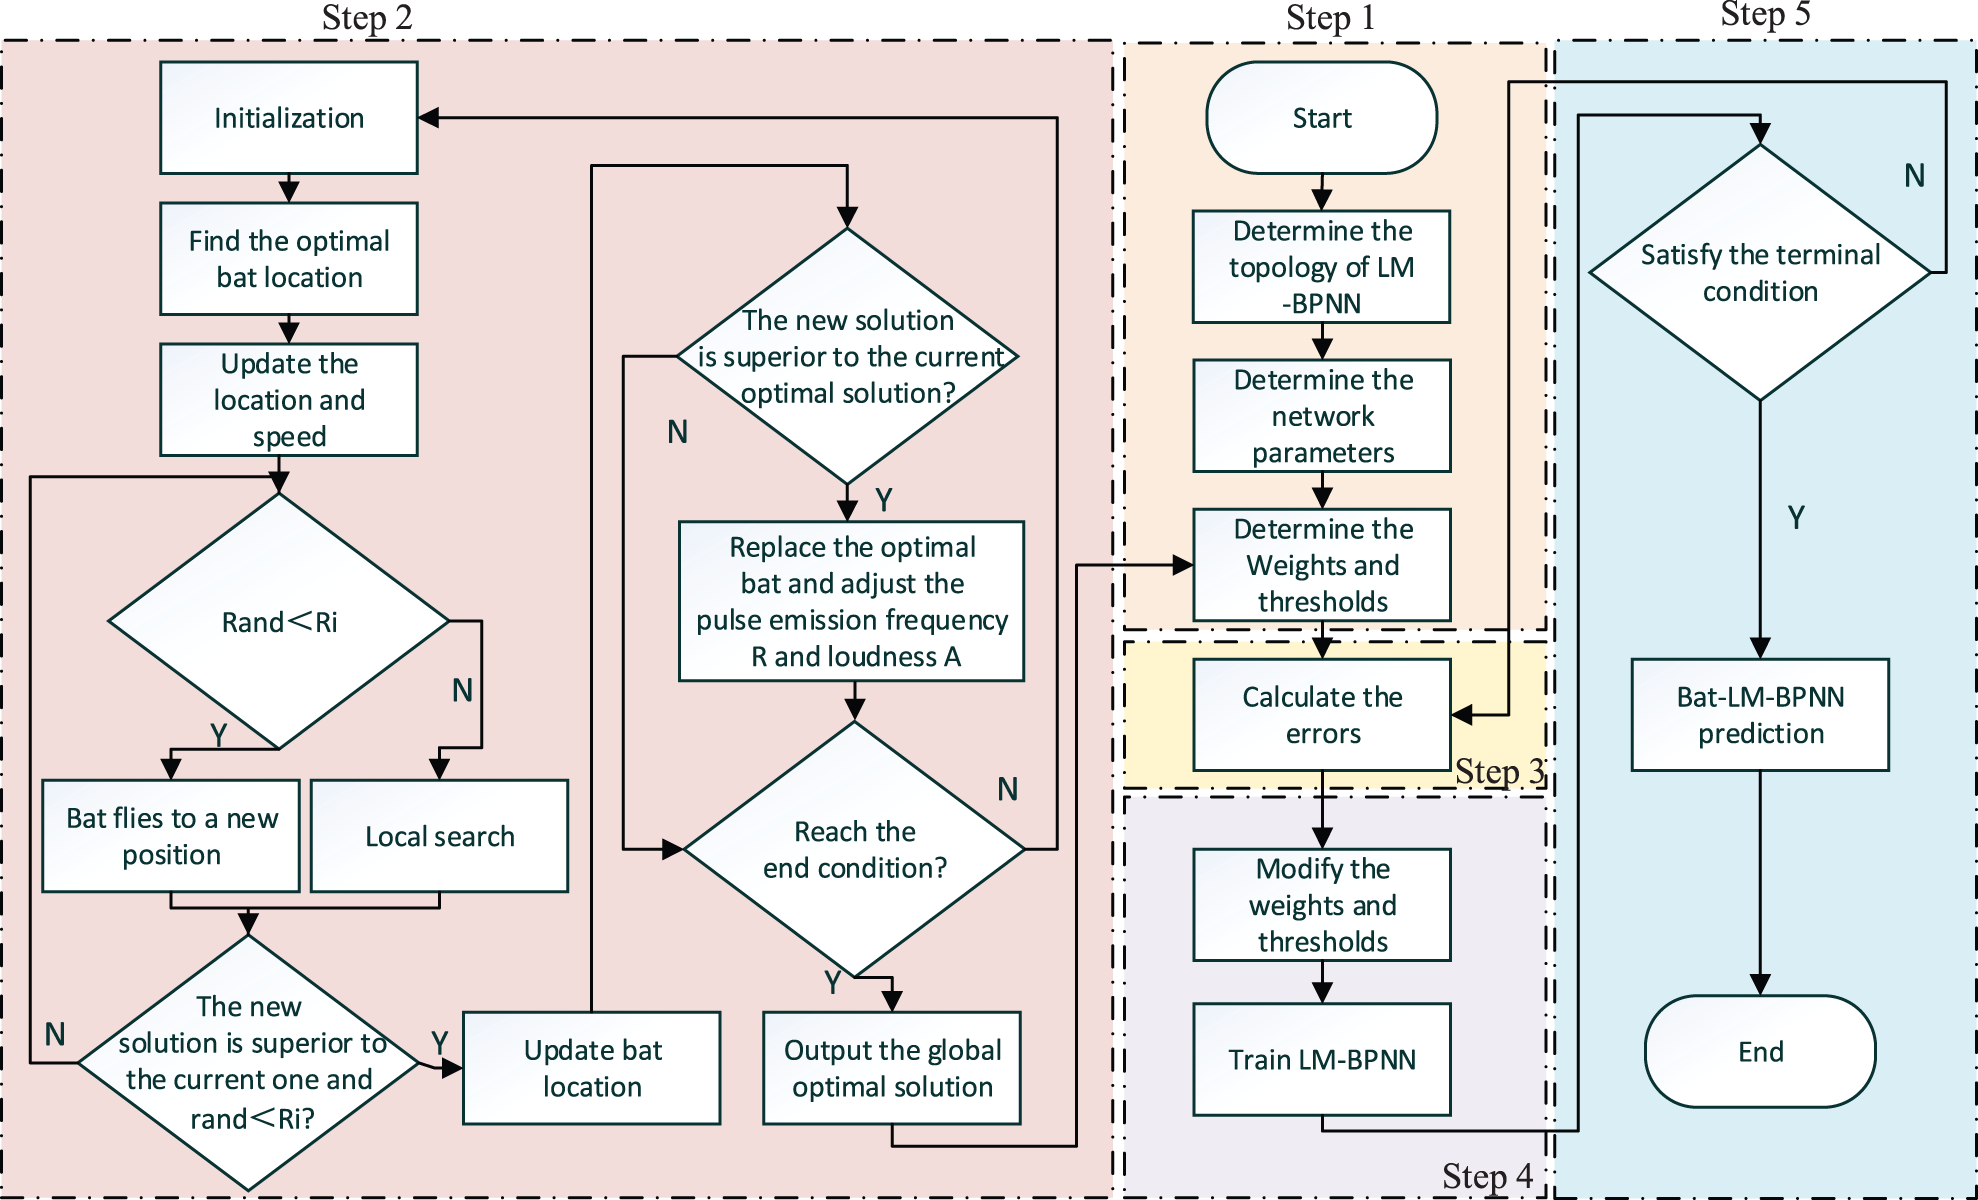
Figure 2: Flow of the BPNN improved by the BA
The HCR model was proposed by Hannaman et al. [46] and is mainly used for the quantitative evaluation of operator non-response probabilities under time-constrained emergency conditions. It takes into account the factors influencing behavior, and can adjust the failure probability according to the comprehensive quality of the operators, environmental pressure and human-machine interface (HCR). Additionally, it can present the changes in ergonomic reliability over time, which cannot be reflected by many traditional ergonomic reliability methods. In practice, in the special environment of high loads, the reliability changes significantly over time; thus, HCR is suitable for solving such problems. It adopts the following two basic assumptions [47]:
First, in the HCR model, there are three different types of behaviors, i.e., skill-based, rule-based, and knowledge-based, according to Rasmussen’s conception.
Skill-based behavior: This behavior refers to a closely coupled relationship between the input of information and the reaction of a human being, which does not completely depend on the sophistication of a given task and is mainly determined by the level of training and experience with completing related tasks. The important characteristic of this behavior is that it requires people not to interpret displayed information, but to react to information subconsciously.
Rule-based behavior: The type of behavior is controlled and governed by a series of rules or procedures. The main difference between this behavior and a skill-based behavior is the degree of knowledge or mastery of practice. If rules are not well tested in practice, individuals must verify every rule. In this case, incorrect reactions may be caused by insufficient time, delayed cognitive procedures, a weak understanding of rules, etc.
Knowledge-based behavior: This behavior occurs when the characteristics of the current situation are unclear. When the target state is contradictory or the new situation is completely unknown, operators must rely on their knowledge and experience to analyze, diagnose, and make decisions. Knowledge behaviors have a high probability of failure and play a crucial role in human failure research.
The HCR model has the following characteristics [38]:
(1) Modern ergonomic systems are often related to human cognitive judgment, and the HCR method is used to assess the probability that an operation team will fail to complete an action in a restricted timeframe.
(2) The establishment of the HCR model considers the coupling between personnel.
(3) The HCR model is suitable for the evaluation of diagnostic decision-making behaviors.
(4) Because HCR uses the experimental means of a simulator, it analyzes the internal mechanisms of human error objectively and in detail.
For the second assumption, the error probability of each conduct category is related to the ratio of allowable time (t) to actual time (
According to the aforementioned assumptions, considering the function of a three-parameter Weibull distribution, the probability model for the operator response error at time t is constructed as follows [48]:
where α represents the parameter of scale (characteristic response), β represents the parameter of shape, and γ represents the parameter of position (minimum response). Because the execution time of every group may depend on the situation, this formula should be adjusted before use. In the HCR model, the crucial factors affecting behavior must be considered including the factors of training K1, psychological pressure K2, and the HMI K3, which are expressed by the following equations:
here,
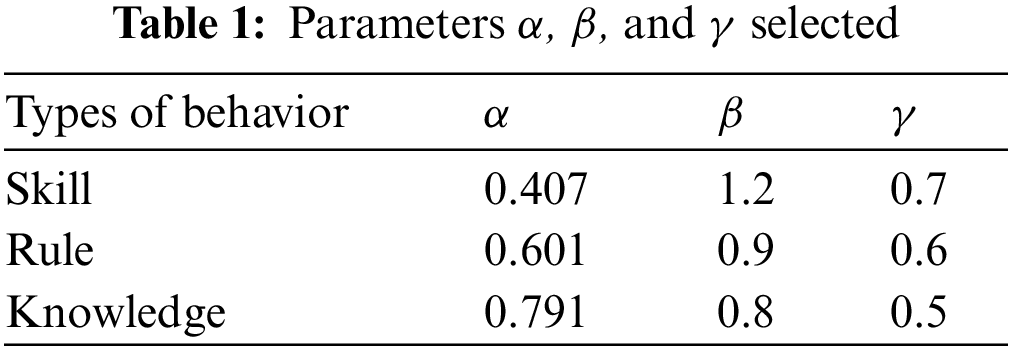
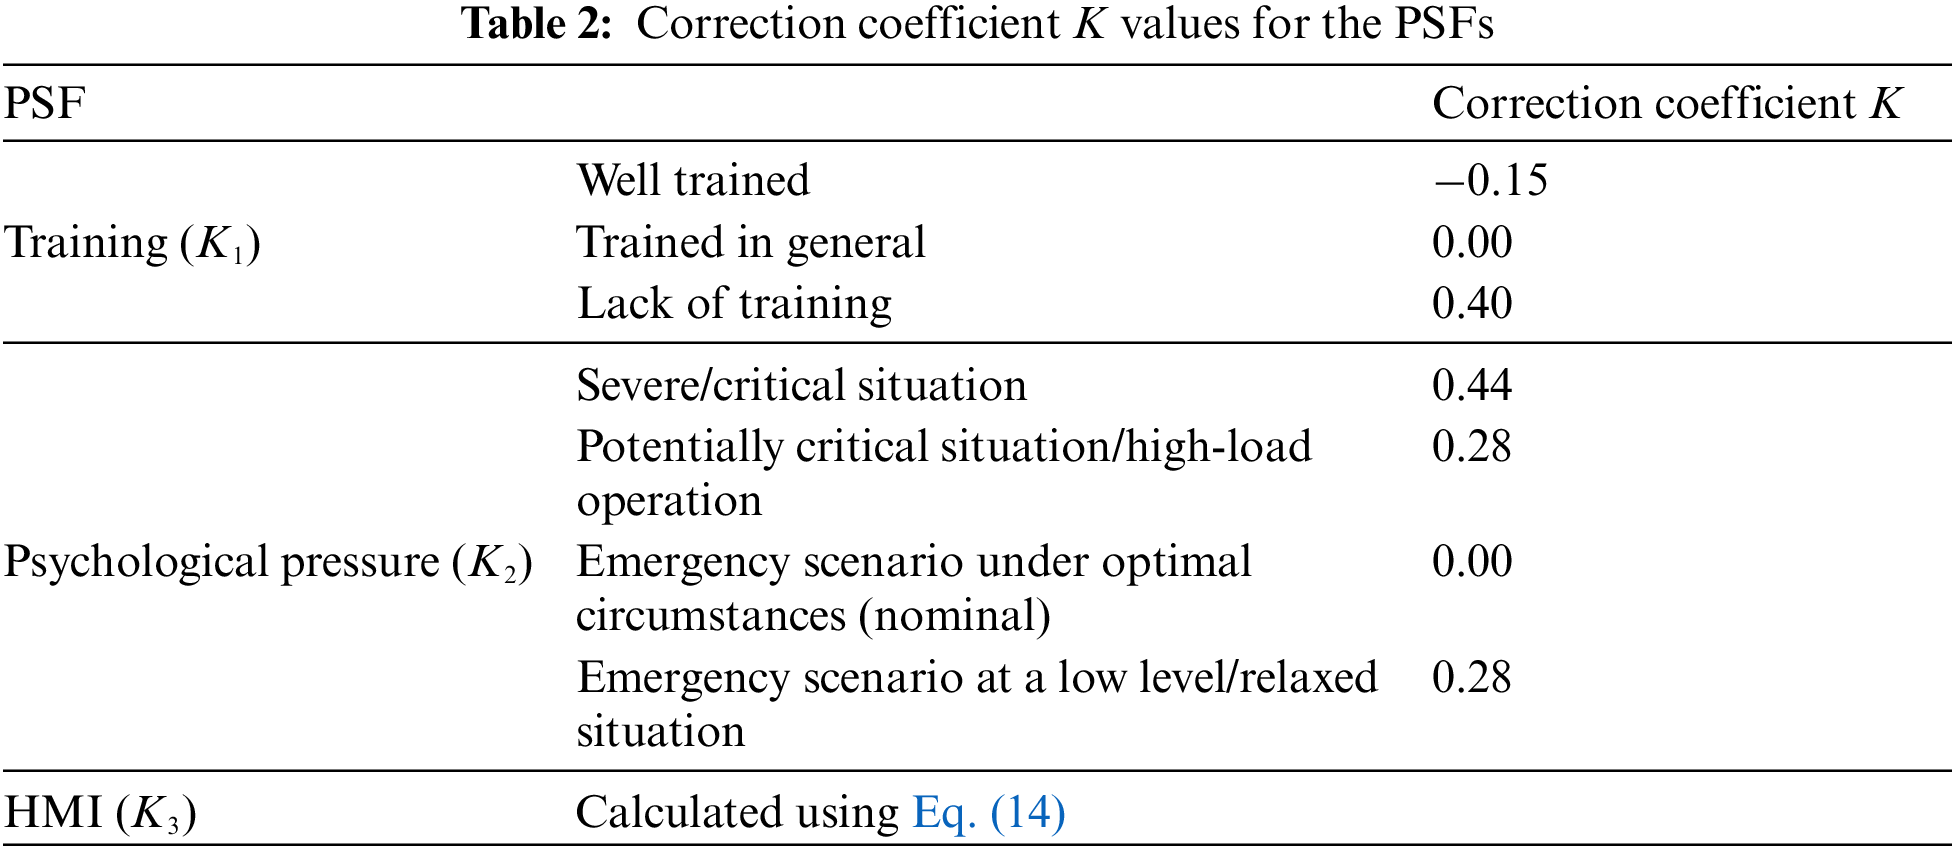
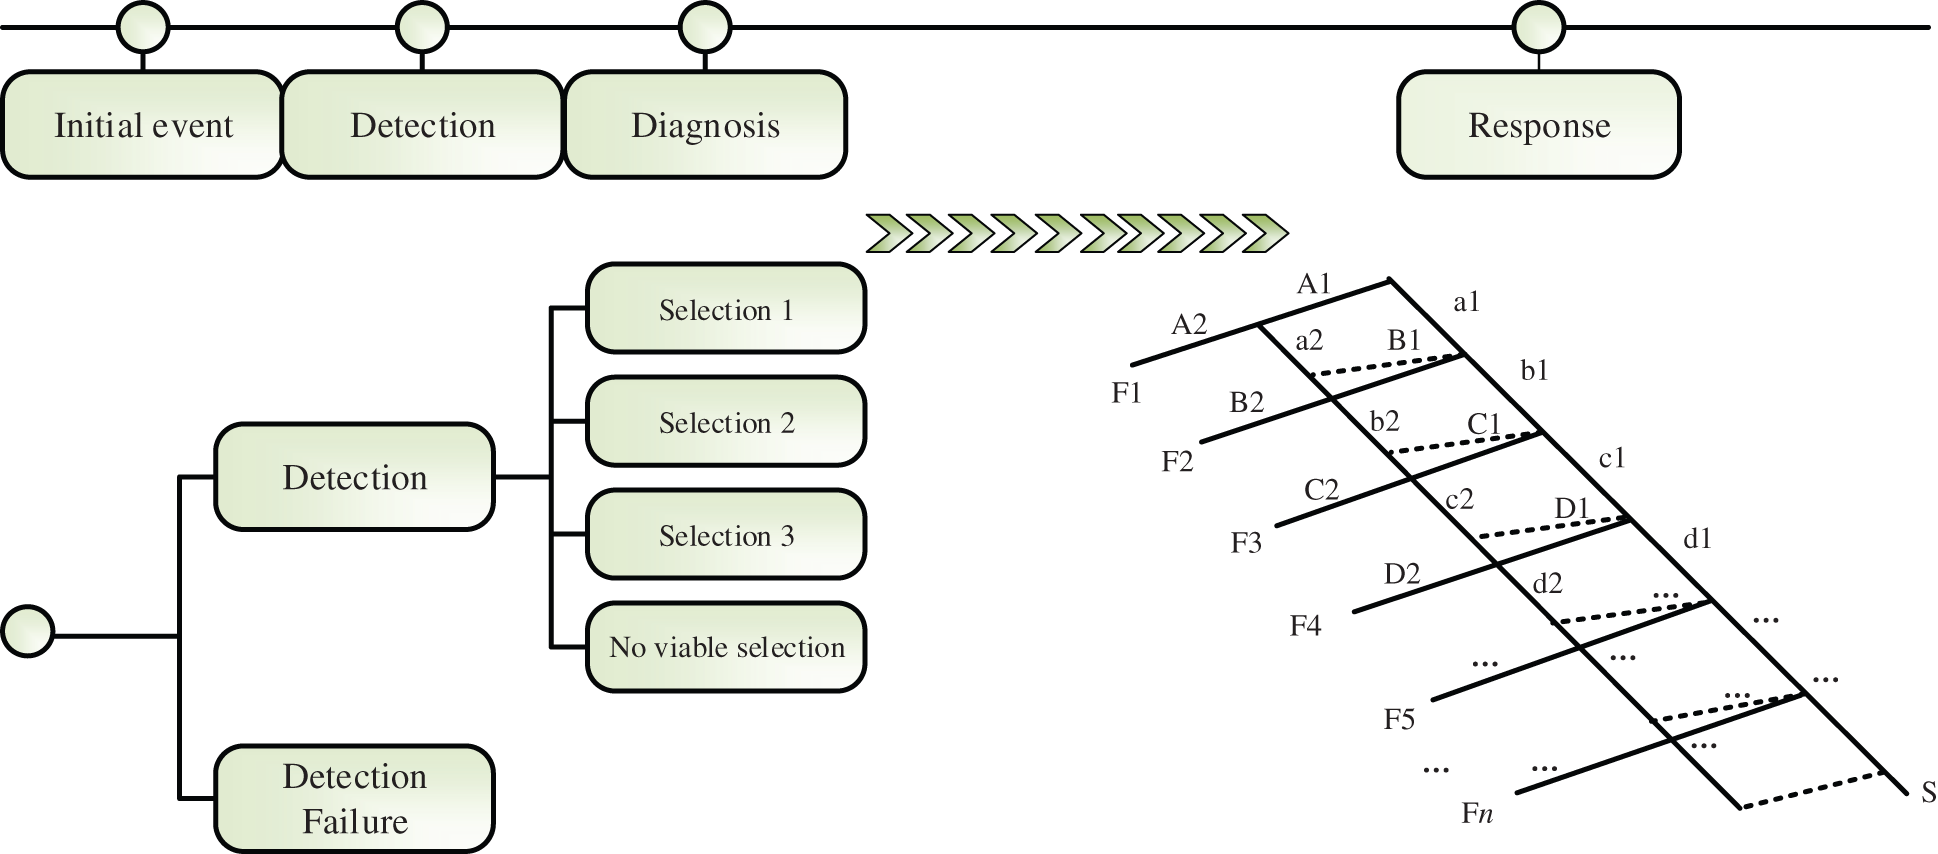
Figure 3: OAT
3 Ergonomic Reliability Assessment of VDT System for Medical Equipment Operation
To construct an accurate BPNN, a total of 27 groups of experiments were designed. These groups were randomly matched according to different combinations of keys of different sizes and different distances between keys. Twenty subjects were invited to perform the tests using their right hands while wearing gloves of different thicknesses. The diameters of the right index fingers of the participants wearing gloves were divided into five groups: 50–80 mm, and 90–12 mm, 13–16 mm, 17–20 mm, and 21–24 mm. The data for different keys and key gap collocation schemes were recorded, and a total of 540 groups of data were obtained (20 participants × 27 groups of experiments). Because the 27 groups of experiments were randomly matched, there may have been similar data between the testing and training data. To evaluate the advantages and disadvantages of three different operation schemes, 530 groups of data were used as training data, and 10 groups of data were used as testing data. In each of the three schemes, the number of operation steps was 65, and the shortest distance between keys for each operation interface was recorded; thus, the predicted data represented 195 steps.
The LM-BPNN optimized using the BA provided good performance as a predictive model. In the BA, the initial iteration number was set to 1, and the maximum iteration number was set to 2. The population size was set to 3. The minimum loudness was 0. The loudness control parameter was 0.95. The pulse emissivity control parameter was 0.5. The frequency range was 0–2. The BA ran for 40 generations, and reached an optimal solution at approximately the fifth generation. For the LM-BPNN, the maximum number of training iterations was 2000. The number of hidden layers was set to 37. The target error for training was 0.001. The learning rate was 0.1. With gloves, the width of the widest contact surface between the finger and VDT was 15 cm, according to the three VDT design schemes. The width of the widest contact surface between the finger and VDT, the sizes of the keys needed complete the target tasks and the distances between adjacent keys were considered as the inputs for prediction. The relationship between the width of the widest contact surface between the finger and VDT, and the sizes of the operation control keys was defined as output 1. The operation failure probability was defined as output 2. Thus, there were three inputs and two outputs in the LM-BPNN structure. The training results are presented in Fig. 4.
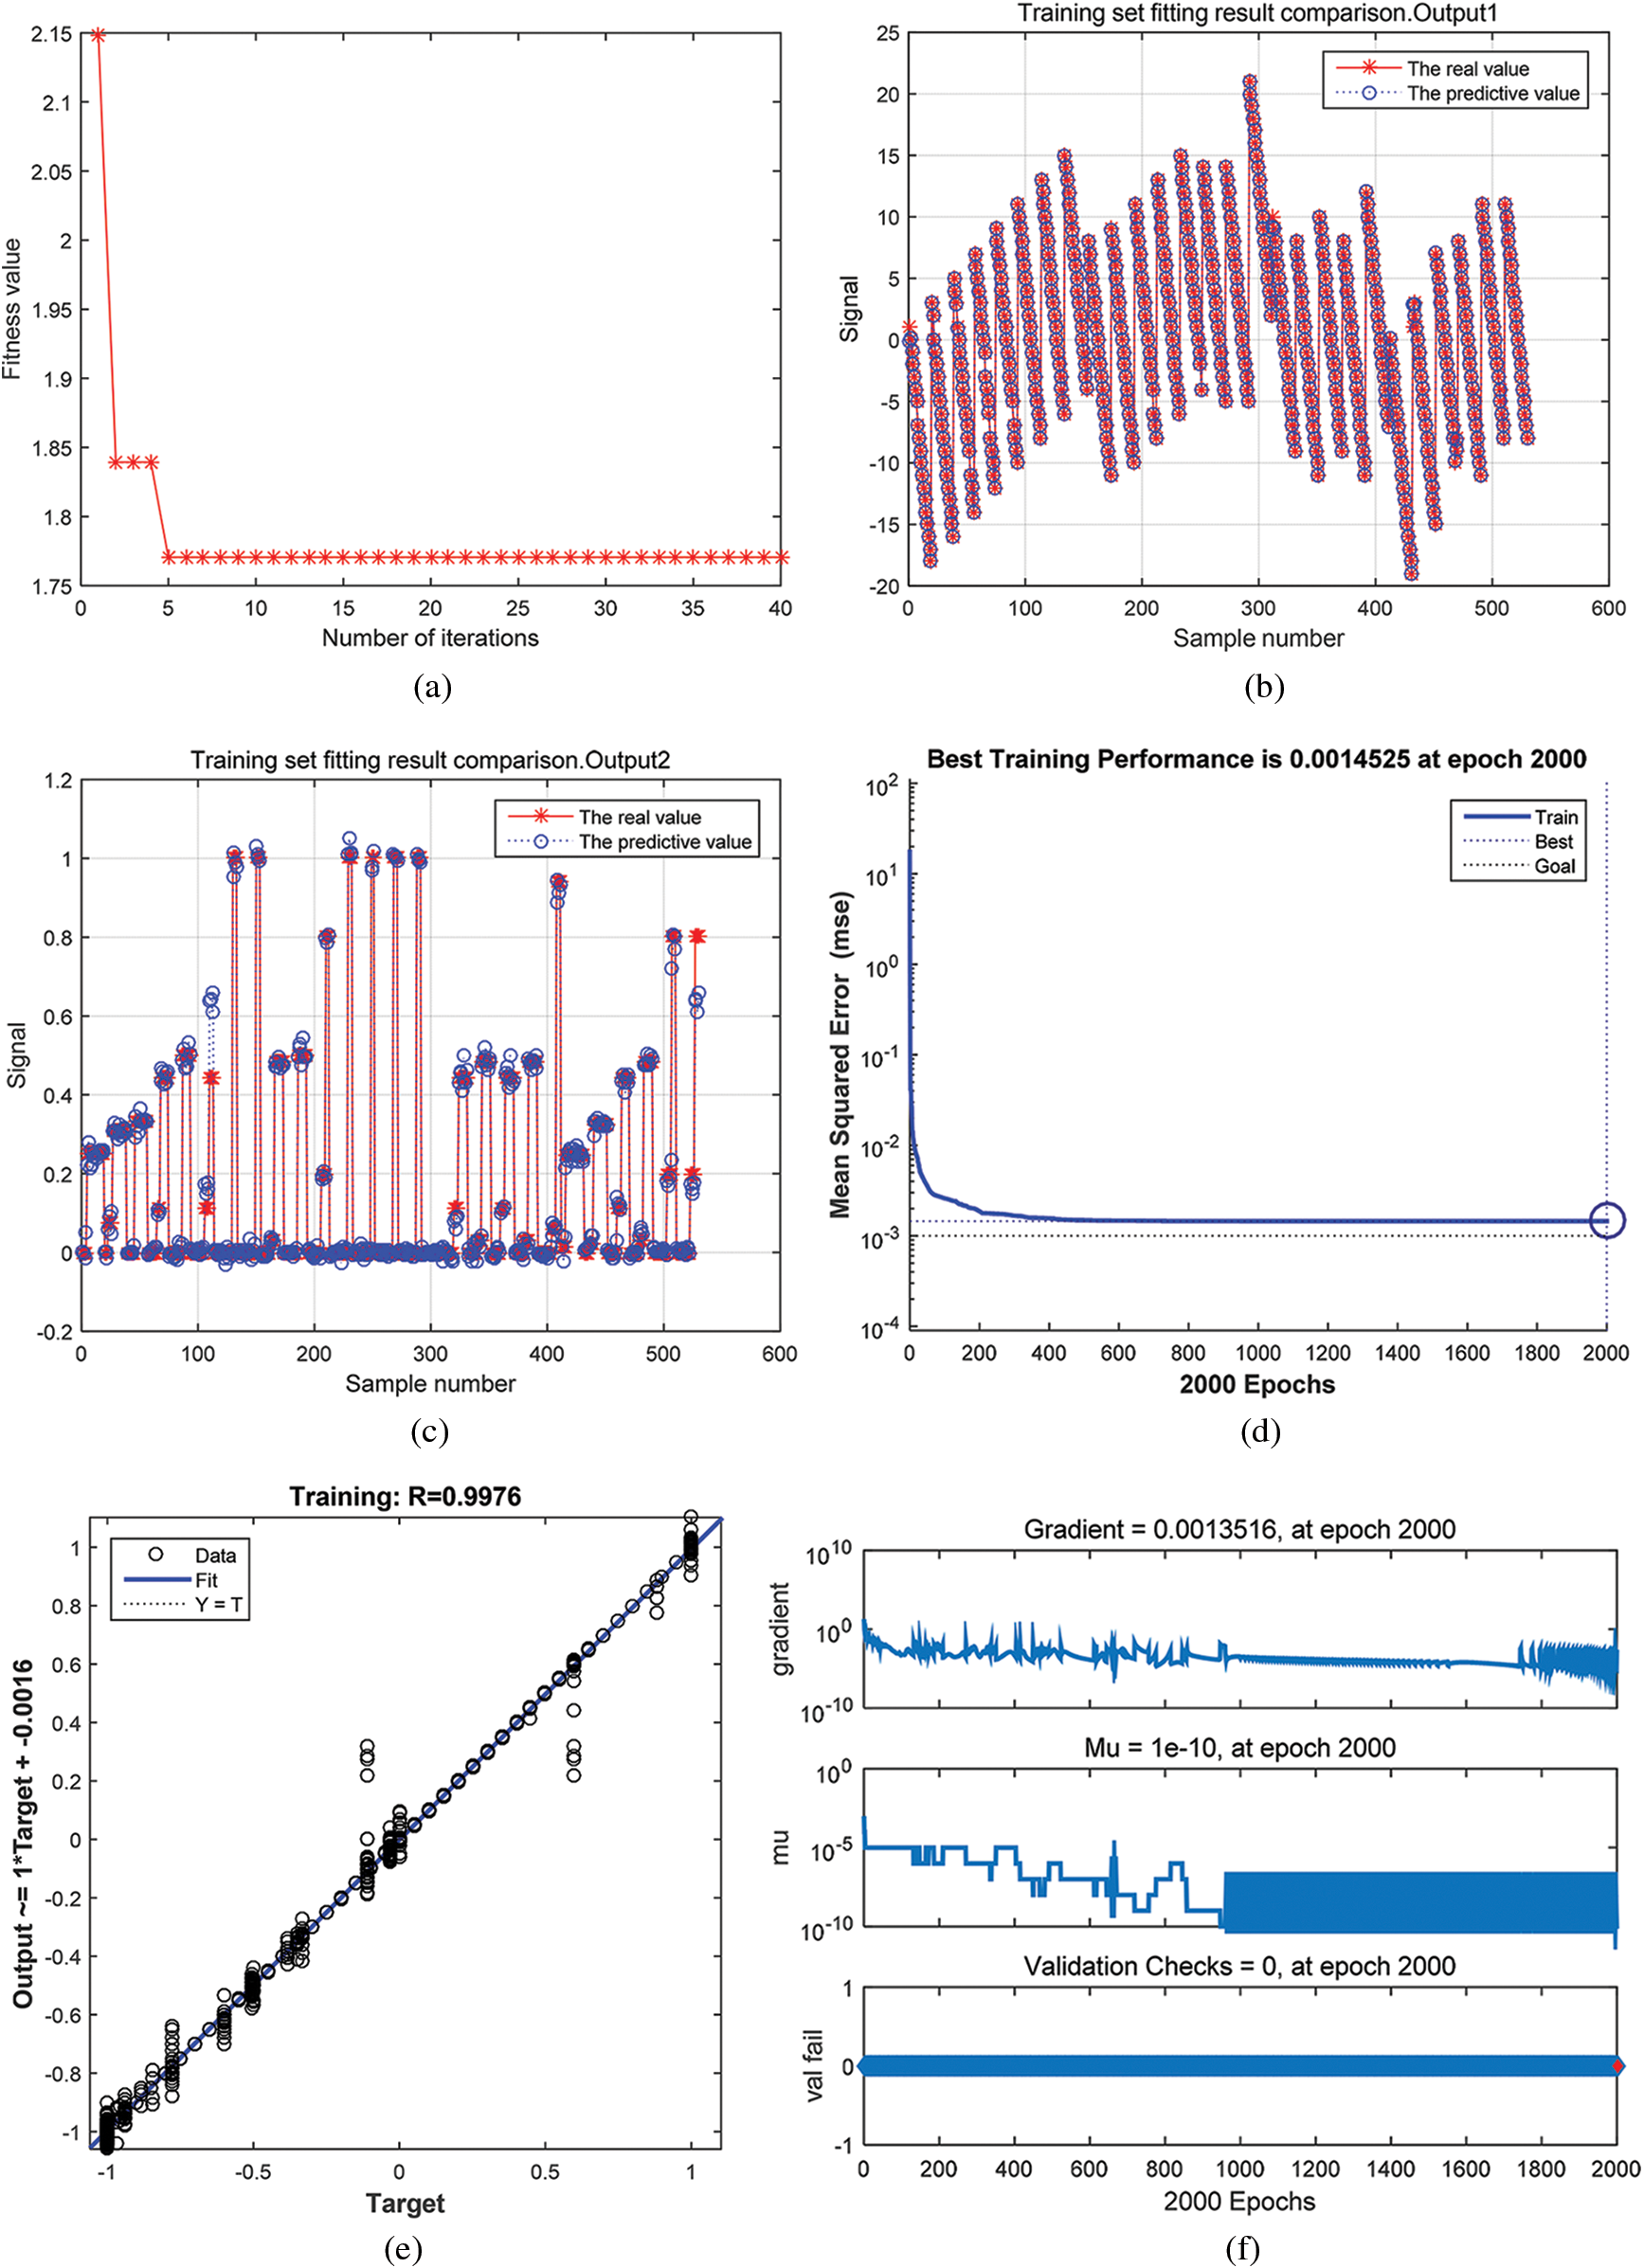
Figure 4: LM-BPNN improved by the BA for predicting failure probabilities
For the traditional BPNN, the maximum number of training iterations was 2000. The number hidden layers were set to 37. The target error for training was set to 0.001. The learning rate was 0.1. The inputs and outputs of the training and testing data were identical to those for the LM-BPNN optimized with the Bat. There were three inputs and two outputs in the BPNN structure. The results of operation failure probability prediction are presented in Fig. 5.
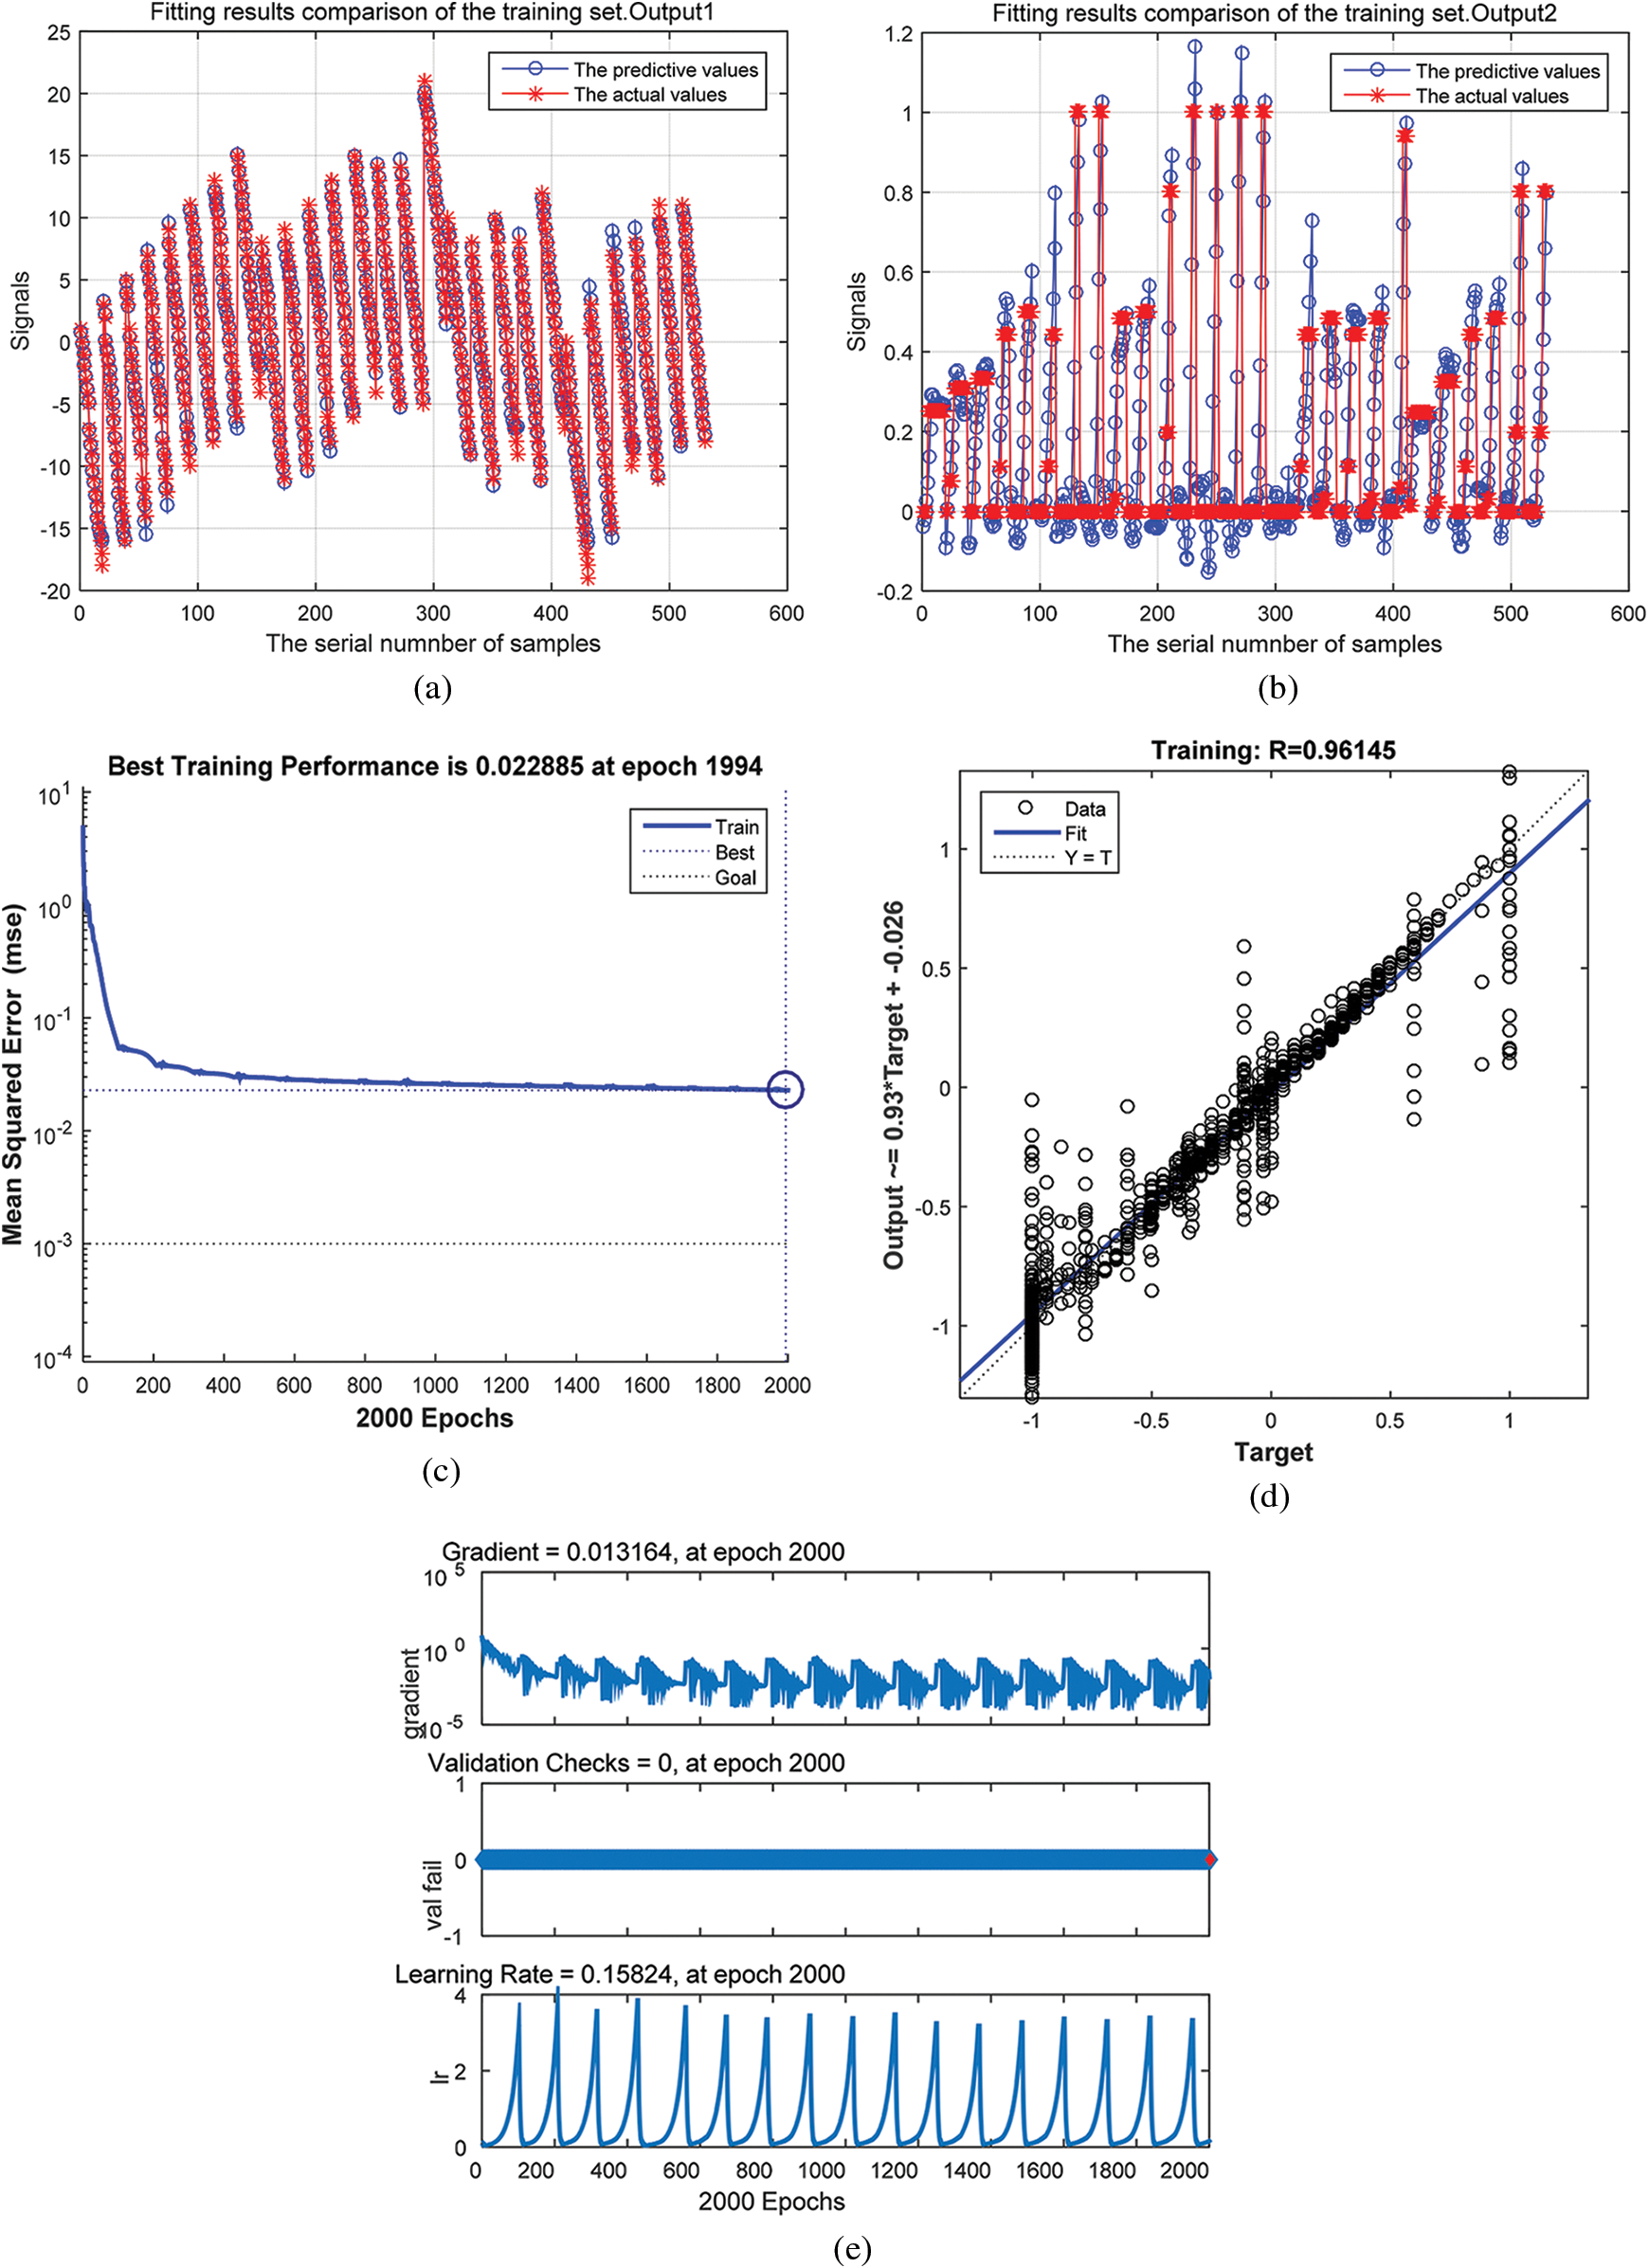
Figure 5: Traditional BPNN used to predict the operation failure probability
As shown in Fig. 6a, predicted outcomes based on the testing data were derived from the BA-LM-BPNN and traditional BPNN errors. For the BA-LM-BPNN, both output 1 of the testing data and output 2 of the testing data were better than those for the traditional BPNN. The errors calculated by the BA-LM-BPNN were <8%, and the fitting effect of output 1 was significantly better than that of output 2. For the BA-LM-BPNN, the error of output 2 based on the testing data was <5.5%, and that of output 2 was <7%. Under the same parameter settings for the traditional BPNN and BA-LM-BPNN, the error of the testing data was relatively large for the traditional BPNN prediction, but the most decomposition can be predicted correctly. The error of output 2 for the testing data based on the traditional BPNN was <40%, and most values were approximately 20%. Output 1 produced an ambiguous solution, but most of the error values were within 40%. Because of the many complex and fuzzy factors in human action errors, the prediction accuracy is limited, but with more data, prediction accuracy can increase and the prediction can receive a certain amount of guidance and reference. Under a given set of conditions, the optional options or schemes can be selected.
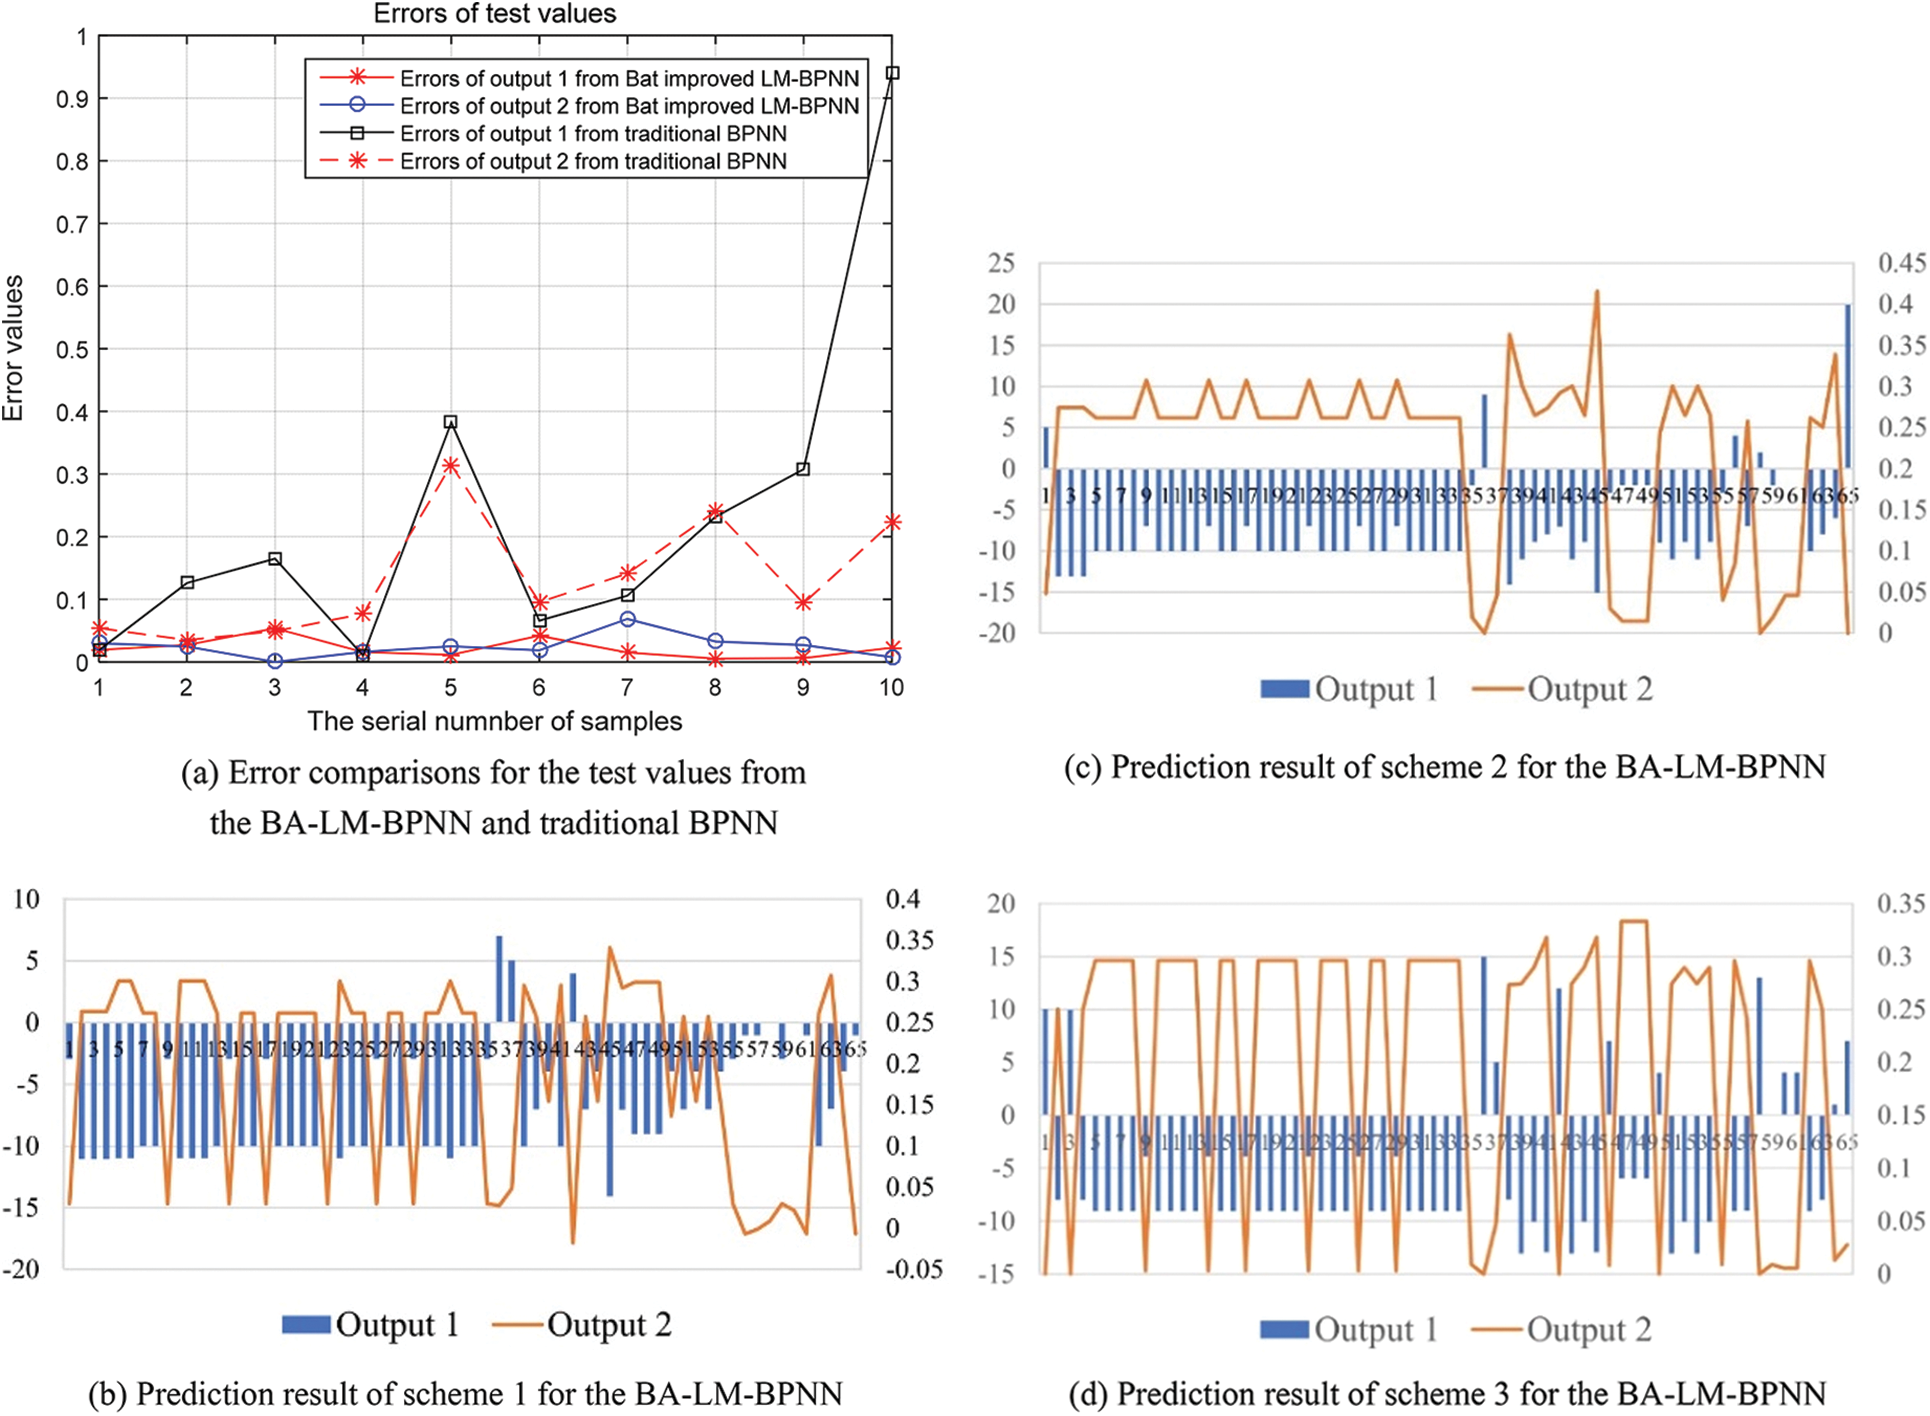
Figure 6: Error comparations between the BPNN and BA-LM-BPNN
As shown in Figs. 6b–6d, the failure probabilities of human error were predicted by the BA-LM-BPNN according to the medical equipment HMI designs of the three different schemes with similar task functionalities but different operation modes. In most cases, when the width of the widest contact surface between the fingers and VDT exceeded the shortest distance between control keys, the human failure probability increased. This indicates that if the shortest distance between control keys is sufficiently large, the failure probability of human operation can be reduced. However, if the distance between control keys is too large, the failure probability of human operation increases to a certain extent. This is because a long distance, results in inconvenient operation in most cases.
A VDT system for medical equipment operation such as polymerase chain reaction (PCR) testing utilizes rule-based behavior. The parameters of the rule-based behavior presented in Table 1 were adopted; thus,
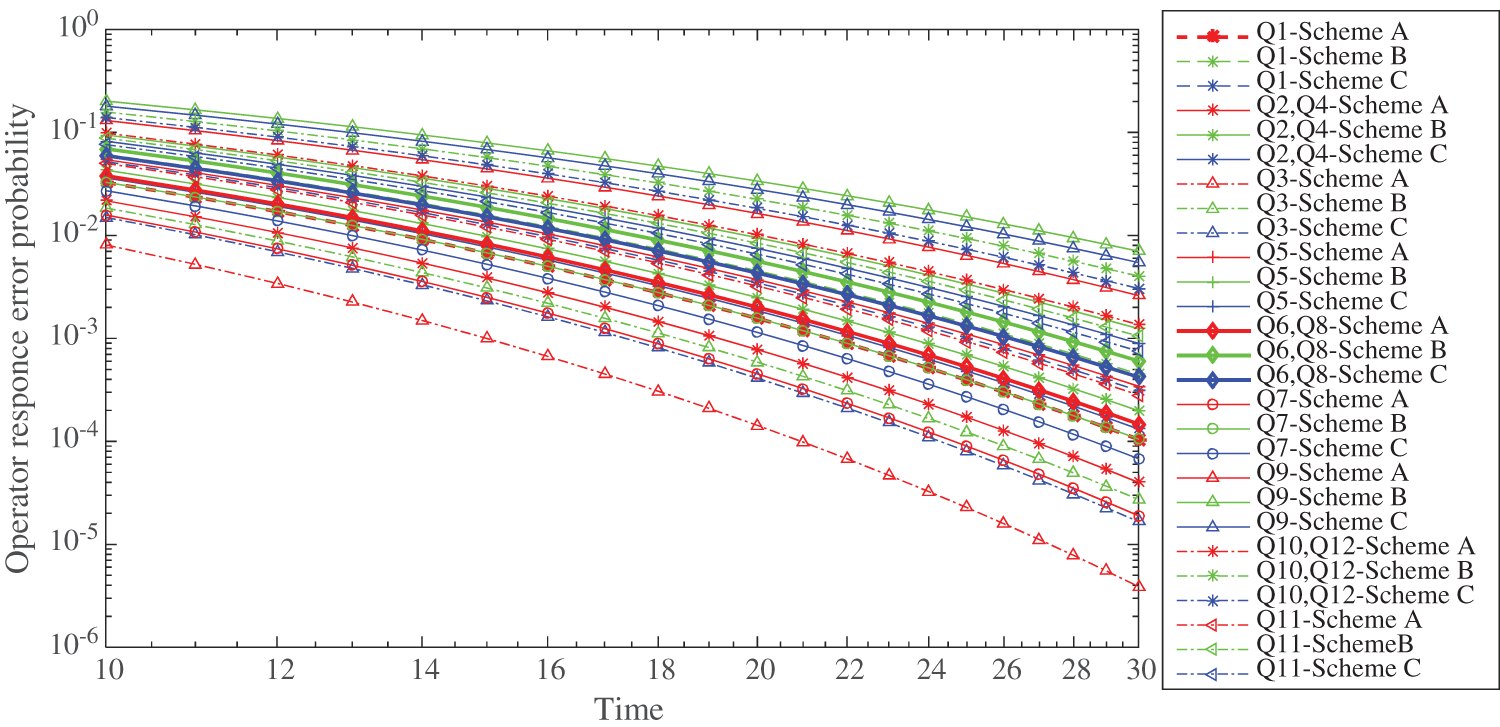
Figure 7: Error probabilities of operator responses from 10 to 30 min based on three schemes
Q1 Well trained-Severe emergency scenario;
Q2 Well trained-Potential emergency scenario/high load operation;
Q3 Well trained-Optimal emergency scenario (nominal);
Q4 Well trained-Low level emergency scenario/relaxed scenario;
Q5 Training in general-Severe emergency scenario;
Q6 Training in general-Potential emergency scenario/high load operation;
Q7 Training in general–The best emergency scenario (nominal);
Q8 Training in general Low level emergency situation/relaxed situation;
Q9 Lack of training-Severe emergency scenario;
Q10 Lack of training-Potential emergency scenario/high load operation;
Q11 Lack of training-The best emergency scenario (nominal);
Q12 Lack of training-Low level emergency situation/relaxed situation.
“Training in general” is selected as a PSF; thus, K1 = 0. Additionally, “potential emergency scenario/high load operation” is selected as a PSF; thus, K2 = 0.28, and Q6 is selected. As shown in Fig. 7, the error probability of an operator response based on Scheme A for Q3 with “well trained-Optimal emergency scenario (nominal)” has the lowest error probability compared with the others. That of Scheme B with “lack of training-severe emergency scenario” for Q9 has the highest error probability compared with the others. With an increase in the operation time, the error probability decreases, but the error probability increases under a low-relaxation state.
4 Verification for Ergonomic Reliability Assessment
To verify the effectiveness of the proposed the assessment model using an improved BPNN and HCR, three designs are proposed with identical the software functions, but differences in the interface design and information architecture. Cognitive experiments based on the layout design of the information architecture were performed. An eye movement tracking experiment was conducted to verify the reliability of the evaluation model developed in this study. Eye movement tests are expensive but objective. For the index finger of the right hand, the width of the widest contact surface between the finger and VDT was controlled to be approximately 15 cm; thus, some subjects wore multiple layers of hand protection, e.g., a pair of gloves. The heat maps of the three initial schemes for the simulation model in the case of eye movement tracking are presented in Fig. 8, and the main pages with similar functionality of the three different schemes for different operations are shown.
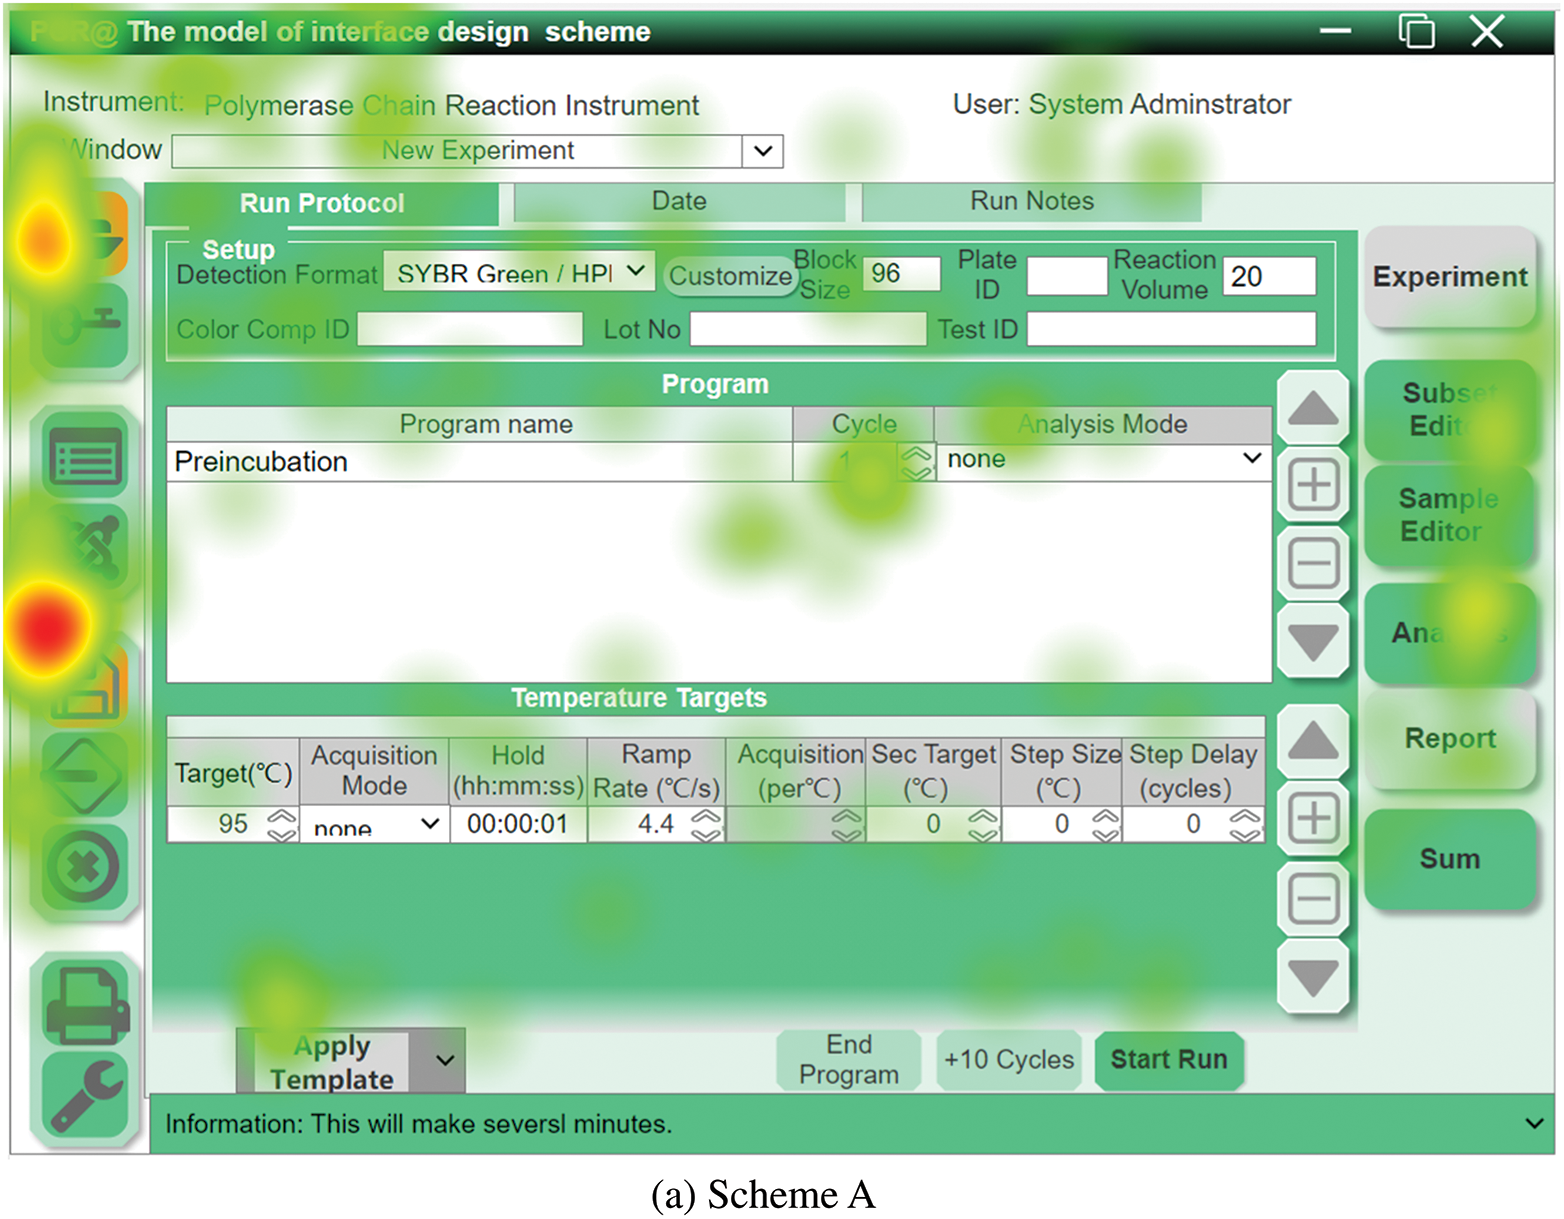
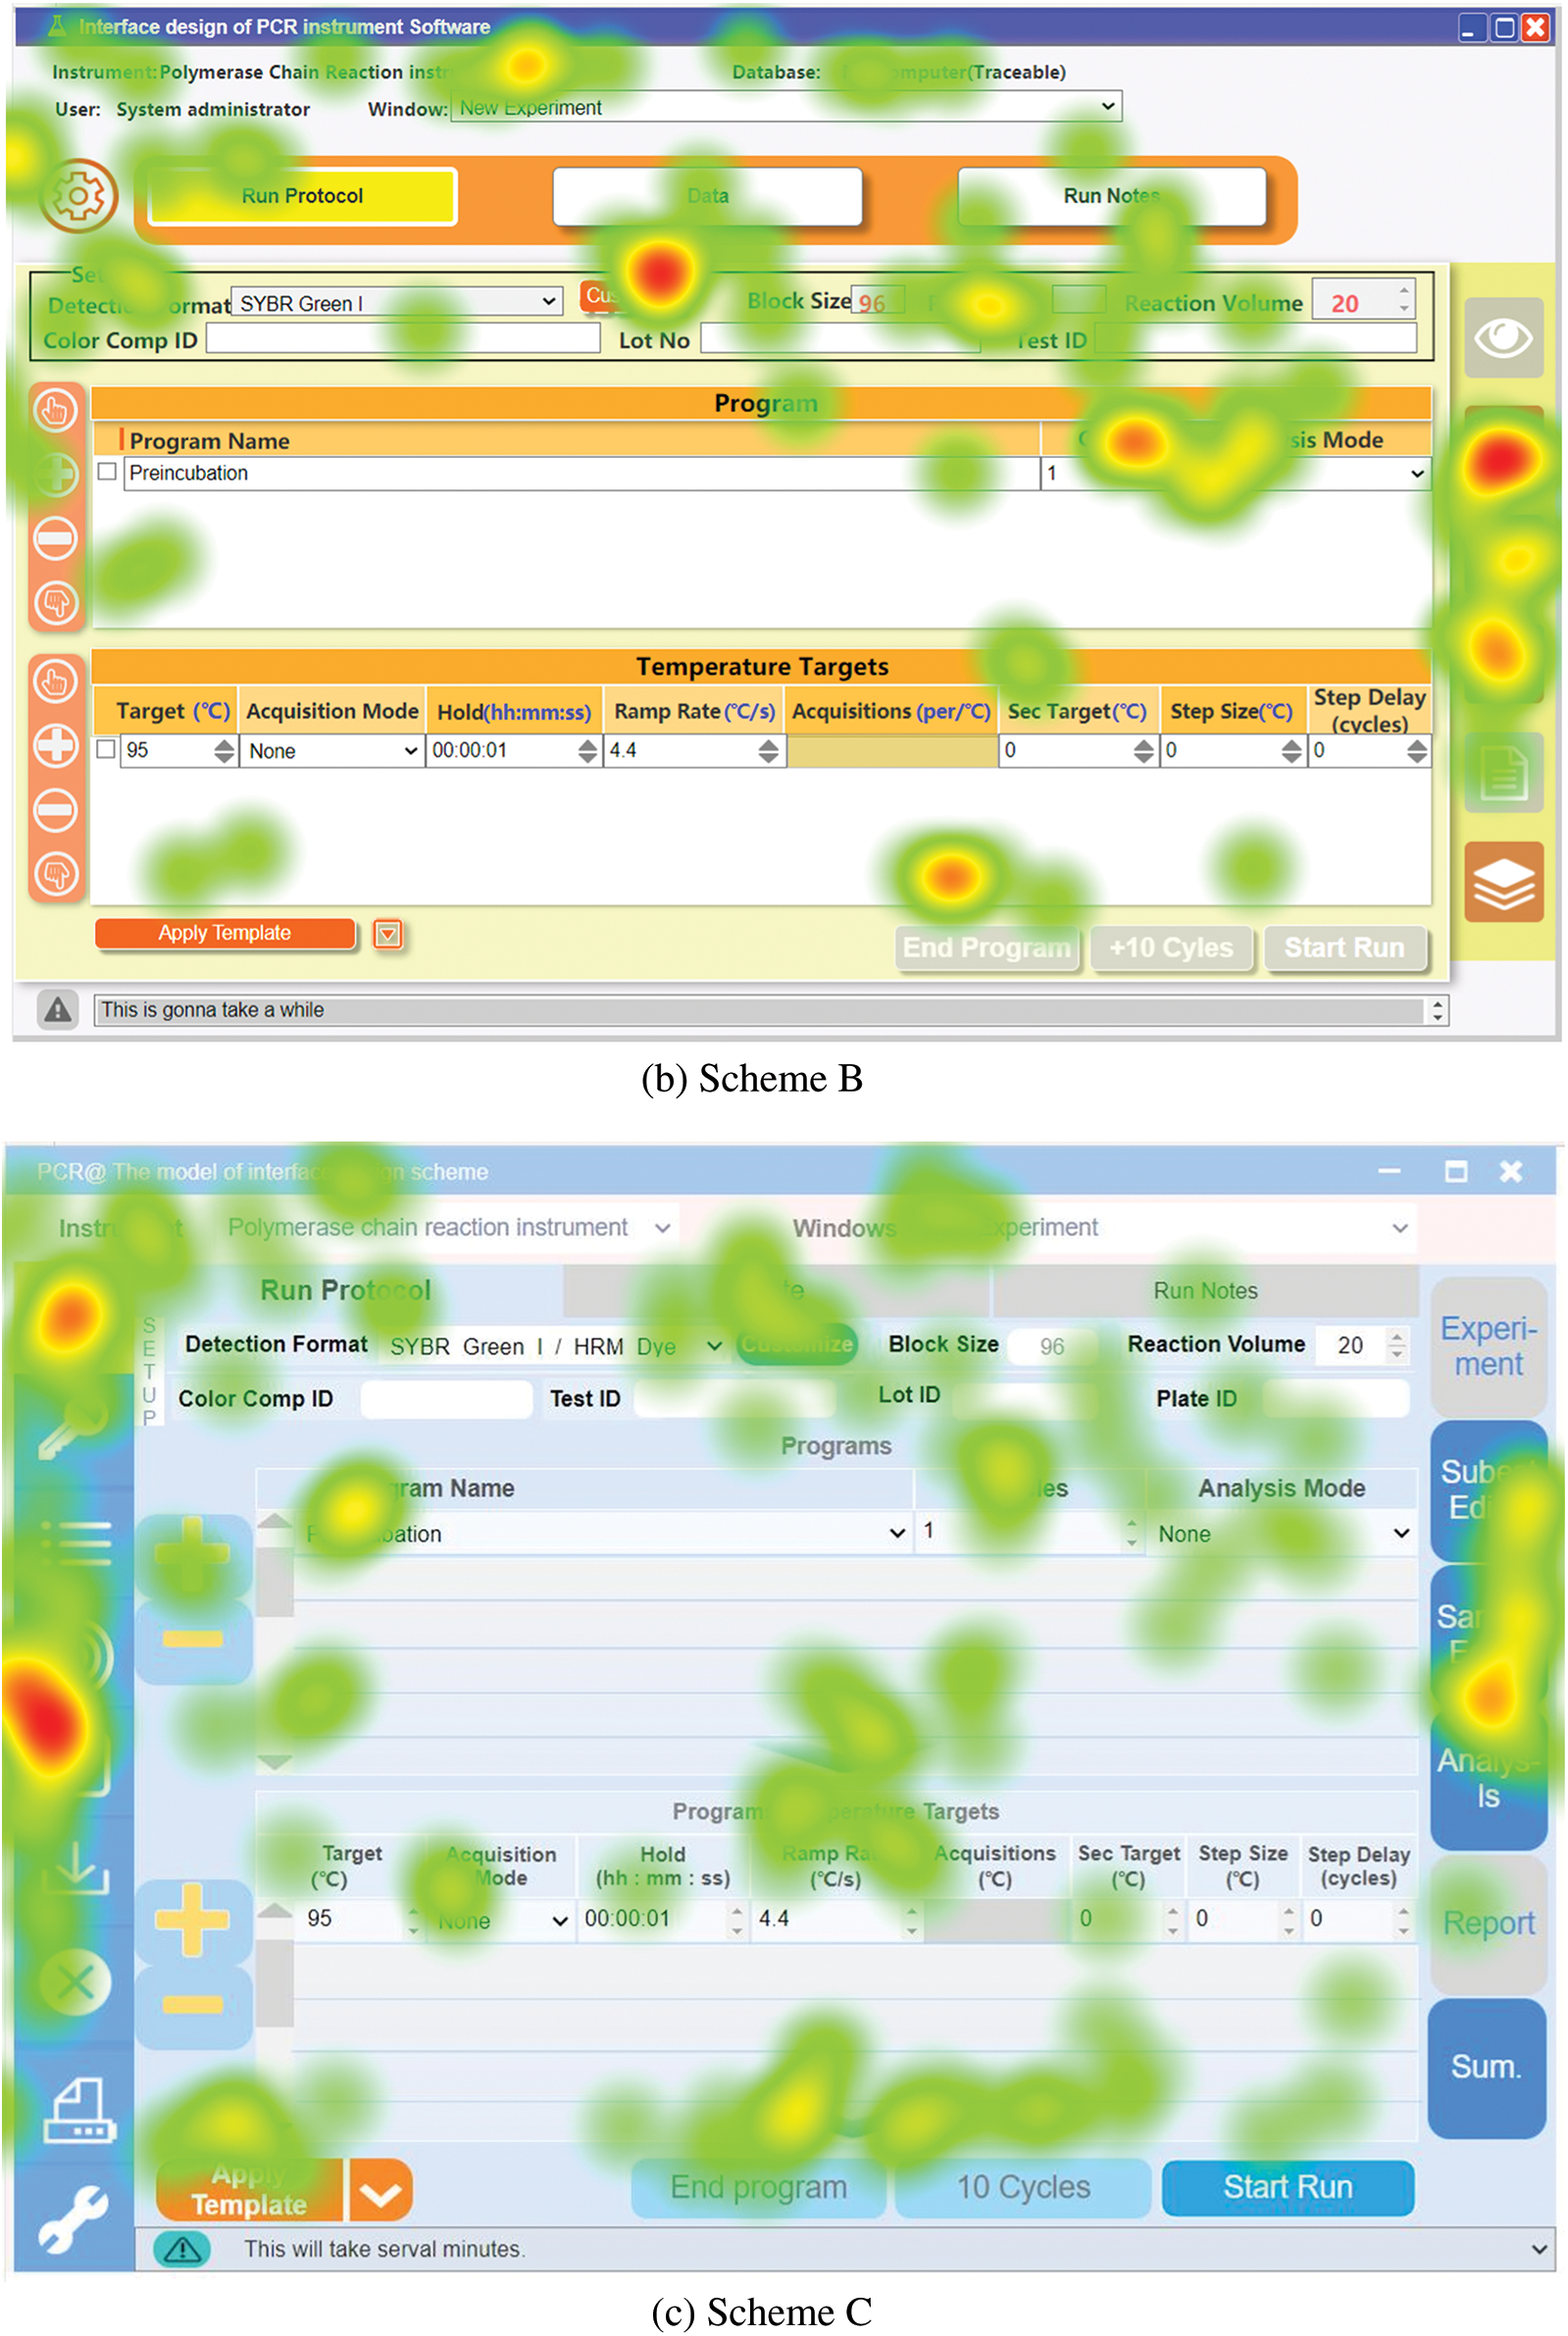
Figure 8: Heat maps for eye tracking
Because medical equipment operation design is affected more significantly by the layout than by the color design; thus, to reduce the influence of color on the schemes, the color schemes of Designs B and C were changed to match those of Design A. Thus, Designs B and C used the same color scheme as Design A. Twenty-one people who had been trained in the operation of PCR equipment were included in each group to operate the three different design schemes. The time required to operate the PCR equipment was recorded. The effects of the different information architectures, on the operation process were mainly analyzed. For this, a one-way analysis of variance was adopted. However, variance analysis requires independent random samples, that follow a normal distribution. Additionally, the total variances of samples must be equal (i.e., homogeneity of variance).
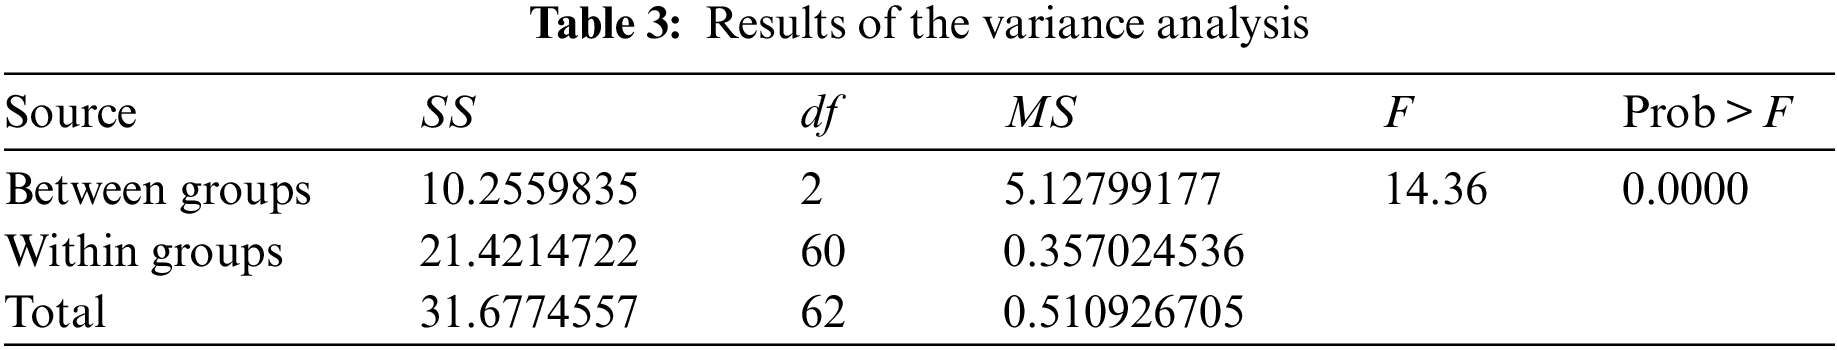
If the spots in the Quantile-Quantile (Q-Q) plot used to show whether the data come from a normal population are close to the red straight lines in Fig. 9, this indicates that the dataset is normally distributed. In Fig. 9, most of the scattered points are close to the straight lines. Because of the small sample size, the Kolmogorov-Smirnova test was applied. For all three schemes, sig. = 0.2 > 0.05. This indicates that the three groups of data selected according to different design schemes were normally distributed. Additionally, equal variances were identified using Bartlett’s test. According to the raw data, chi2(2) = 6.3908 and Prob > chi2 = 0.041. Therefore, a square-root transformation of the original data was required. Following the square-root transformation, Bartlett’s test was performed again with results of chi2(2) = 3.9391 and Prob > chi2 = 0.140. Therefore, the conditions for variance analysis were satisfied. The results of the variance analysis are presented in Table 3. As can be seen from Table 3, the average square roots of the time data required to operate the PCR equipment based on the three different scheme respectively are not all equal. For further pairwise comparative analysis, Bonferroni method was used for further analysis.
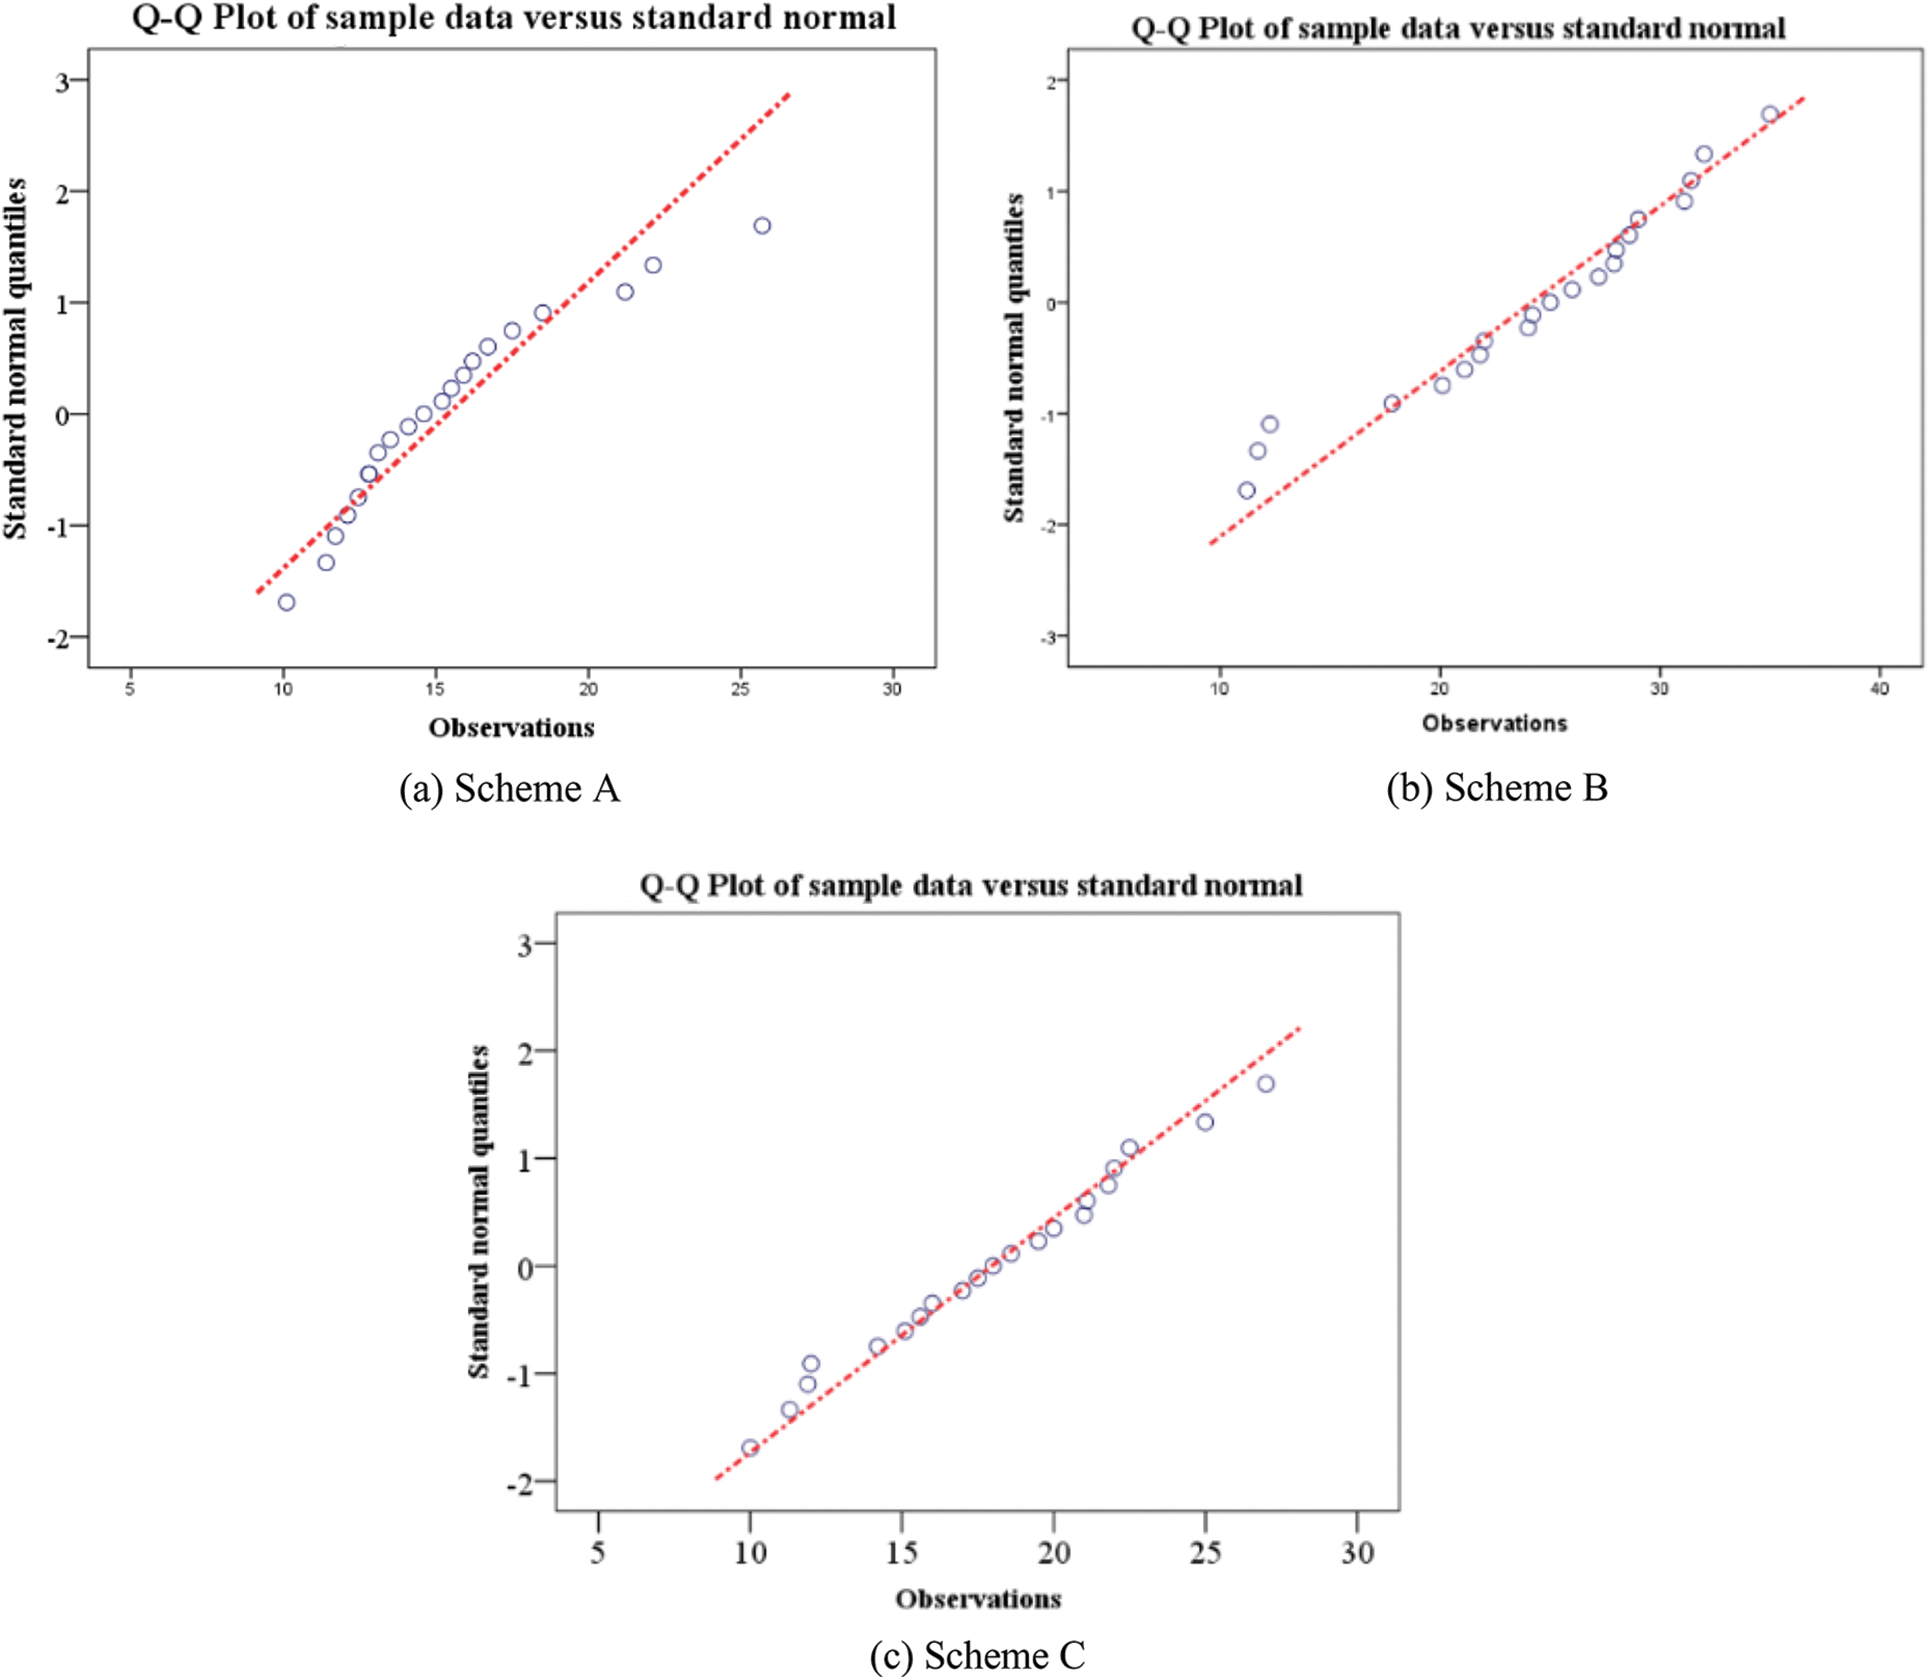
Figure 9: Normal Q-Q plots
According to the results of the Bonferroni method, the average square root of the time data based on Scheme A was smaller than that for Scheme B 0.967229 (p = 0.000) and that for Scheme C (p = 0.301), indicating that Scheme A was significantly superior to Scheme B, but not to Scheme C. The average square root of the time data based on Scheme C was smaller than that for Scheme B 0.659459 (p = 0.002); thus, Scheme C was clearly superior to Scheme B. Under similar operating environments and identical conditions, Scheme B was the worst, and Schemes A and C were superior. Thus, the rationality of the proposed method was verified from the side.
In an environment with a high load and high infection rate, medical equipment operators must wear multiple layers of protective clothing and gloves for protection. The results reduce the flexibility for interface operation using VDTs and have negative effects on personnel; thus, the cost of collecting the experimental data according to a conceptualized design scheme is high. However, during the early stages of design, the selection of an optimal scheme is important. Thus, constructing a forecasting model according to obtained data is necessary. In this study, we developed and analyzed an operation failure prediction model for ergonomic reliability under special conditions based on an LM-BPNN improved by the BA. This model allows us to solve problems in special circumstances that are difficult to simulate. If only the LM-BPNN is used, the proposed method does not consider the fact that human reliability changes over time, and it cannot consider the cognitive factors of operators. Thus, the most important innovation of this research was the combination of the BPNN as an artificial intelligence algorithm with HCR, i.e., the traditional human reliability method. The black-box structure of the BPNN is suitable for fitting the relationships among the uncertain factors in a special environment, the characteristics of VDT design and behavioral cognitive failure. HCR considers not only operator action but also ambient pressure, and indicates the dynamics of reliability over time, making it ideal for VDT operational studies in special environments. Thus, an improved human reliability method based on traditional HCR was combined with LM-BPNN. The two techniques play complementary roles.
First, relevant data were collected for the size of the contact area between different fingers and the VDT interface, sizes of the control keys, the distance between the control keys, and the operation error rate. The BA was used to improve a BPNN to define the relationships among operator-related states, control key attributes, and operation error rate data for predicting the operation error rates in different special states. This provided a basis for some special cases in which high-cost testing is typically needed to reach a conclusion. Second, to increase the accuracy of traditional HCR, the output of the developed analysis model was combined with a third PSF called the HMI factor to increase the accuracy of the evaluation results. Because the basic data provided by HCR are mainly derived from relevant studies of nuclear power plants, it is necessary to adjust the relevant data in combination with the actual situation and specific environment. More reliable and effective results can be achieved via HCR based on the data fitted and predicted by the BA improved LM-BPNN under the special environment of medical device operation. Third, the rationality and effectiveness of the proposed model of ergonomic reliability were verified using eye tracker experiments as a type of unbiased research. For the three VDT interface design models proposed in this research, the time required to complete PCR equipment operation was recorded, and the results were statistically consistent with the analysis results of the proposed method.
Funding Statement: The paper was partially supported by National Natural Science Foundation of China (No. 51905116). Basic and Applied Basic Research Foundation of Guangdong Province (Item No. 2020A1515111141). The 13th Five-Year Plan Youth Project of Philosophy and Social Science of Guangdong Province (GD20YYS03). Science and Technology Program of Guangzhou (No. 201904010463). Youth Innovative Talent Projects from Ordinary University of Guangdong Province (2019WQNCX099). Innovation Training Program for College Students in Guangdong Province (S202111078058).
Conflicts of Interest: The authors declare that they have no conflicts of interest to report regarding the present study.
References
1. Weglian, J., Riley, J., Presley, M. (2020). Contribution of risk from human failures in PRA models. 2020 Annual Reliability and Maintainability Symposium (RAMS), pp. 1–4. IEEE. DOI 10.1109/RAMS48030.2020.9153712.2. [Google Scholar] [CrossRef]
2. Meng, D., Yang, S., Lin, T., Wang, J., Yang, H. et al. (2022). RBMDO using Gaussian mixture model-based second-order mean-value saddlepoint approximation. Computer Modeling in Engineering & Sciences, 132(2), 553–568. DOI 10.32604/cmes.2022.020756. [Google Scholar] [CrossRef]
3. Shittu, A., Mehmanparast, A., Shafiee, M., Kolios, A., Hart, P. et al. (2020). Structural reliability assessment of offshore wind turbine support structures subjected to pitting corrosion-fatigue: A damage tolerance modelling approach. Wind Energy, 23(11), 2004–2026. DOI 10.1002/we.2542. [Google Scholar] [CrossRef]
4. Meng, D., Xie, T., Wu, P., He, C., Hu, Z. et al. (2021). An uncertainty-based design optimization strategy with random and interval variables for multidisciplinary engineering systems. Structures, 32, 997–1004. DOI 10.1016/j.istruc.2021.03.020. [Google Scholar] [CrossRef]
5. Viviani, C. A. B., Calil, S. J. (2015). Recommendation in the use of touchscreen technology in medical devices. Cham: Springer International Publishing. DOI 10.1007/978-3-319-13117-7_192. [Google Scholar] [CrossRef]
6. Luo, J., Liao, B., Yue, K., Teng, H. (2017). The human reliability research of VDT operation based on task characteristics and operator familiarity. Proceedings of the 7th International Conference on Manufacturing Science and Engineering (ICMSE 2017), pp. 2017160–2017164. Zhuhai, China. DOI 10.2991/icmse-17.2017.30. [Google Scholar] [CrossRef]
7. Li, X., Song, L., Bai, G. (2022). Recent advances in reliability analysis of aeroengine rotor system: A review. International Journal of Structural Integrity, 13(1), 1–29. DOI 10.1108/IJSI-10-2021-0111. [Google Scholar] [CrossRef]
8. Tomei, G., Cinti, M. E., Dipierro, M., Fioravanti, M. (2006). Scientific evidence in occupational medicine: Meta-analysis of the data regarding the effects of working with video terminals on the psycho-physical well-being. Giornale Italiano di Medicina del Lavoro ed Ergonomia, 28(2), 151–157. [Google Scholar]
9. Ye, Z., Abe, Y., Kusano, Y., Takamura, Y., Eida, K. et al. (2007). The influence of visual display terminal use on the physical and mental conditions of administrative staff in Japan. Journal of Physiological Anthropology, 26(2), 69–73. DOI 10.2114/jpa2.26.69. [Google Scholar] [CrossRef]
10. Nutnicha, N., Pinnita, P., Chareenun, C., Panotsom, N. (2021). Provocation of dry eye disease symptoms during COVID-19 lockdown. Scientific Reports, 11(1), 24434. DOI 10.1038/s41598-021-03887-4. [Google Scholar] [CrossRef]
11. Kyung, G., Park, S. (2021). Curved versus flat monitors: Interactive effects of display curvature radius and display size on visual search performance and visual fatigue. Human Factors, 63(7), 1182–1195. DOI 10.1177/0018720820922717. [Google Scholar] [CrossRef]
12. Charpe, N., Gupta, S. (2018). Occupational stress inventory (OSI) for ergonomic evaluation of work stress among VDT operators. Cham: Springer International Publishing. DOI 10.1007/978-3-319-94589-7_34. [Google Scholar] [CrossRef]
13. Sánchez-Brau, M., Domenech-Amigot, B., Brocal-Fernández, F., Quesada-Rico, J., Seguí-Crespo, M. (2020). Prevalence of computer vision syndrome and its relationship with ergonomic and individual factors in presbyopic VDT workers using progressive addition lenses. International Journal of Environmental Research and Public Health, 17(3), 1003. DOI 10.3390/ijerph17031003. [Google Scholar] [CrossRef]
14. Meng, D., Yang, S., He, C., Wang, H., Lv, Z. et al. (2021). Multidisciplinary design optimization of engineering systems under uncertainty: A review. International Journal of Structural Integrity, 13(4), 565–593. DOI 10.1108/IJSI-05-2022-007615. [Google Scholar] [CrossRef]
15. Luo, C., Keshtegar, B., Zhu, S., Taylan, O., Niu, X. (2022). Hybrid enhanced monte carlo simulation coupled with advanced machine learning approach for accurate and efficient structural reliability analysis. Computer Methods in Applied Mechanics and Engineering, 388, 114218. DOI 10.1016/j.cma.2021.114218. [Google Scholar] [CrossRef]
16. Li, S., Liu, X., Wang, X., Wang, Y. (2020). Fatigue life prediction for automobile stabilizer bar. International Journal of Structural Integrity, 11(2), 303–323. DOI 10.1108/IJSI-07-2019-006317. [Google Scholar] [CrossRef]
17. Sharara, E. A., Tsuji, A., Karungaru, S., Terada, K. (2020). Prediction of the VDT worker’s headache using convolutional neural network with class activation mapping. IEEJ Transactions on Electrical and Electronic Engineering, 15(11), 1690–1697. DOI 10.1002/tee.23239. [Google Scholar] [CrossRef]
18. Fujimaki, G., Mitsuya, R. (2002). Study of the seated posture for VDT work. Displays, 23(1), 17–24. DOI 10.1016/S0141-9382(02)00005-7. [Google Scholar] [CrossRef]
19. Zhu, S., Keshtegar, B., Bagheri, M., Hao, P., Trung, N. (2020). Novel hybrid robust method for uncertain reliability analysis using finite conjugate map. Computer Methods in Applied Mechanics and Engineering, 371, 113309. DOI 10.1016/j.cma.2020.113309. [Google Scholar] [CrossRef]
20. Meng, D., Yang, S., Zhang, Y., Zhu, S. (2019). Structural reliability analysis and uncertainties-based collaborative design and optimization of turbine blades using surrogate model. Fatigue & Fracture of Engineering Materials & Structures, 42(6), 1219–1227. DOI 10.1111/ffe.12906. [Google Scholar] [CrossRef]
21. Azazi, A., Lutfi, S., Venkat, I. (2014). Analysis and evaluation of SURF descriptors for automatic 3D facial expression recognition using different classifiers. 2014 4th World Congress on Information and Communication Technologies (WICT 2014), Melaka, Malaysia: IEEE. DOI 10.1109/WICT.2014.7077296. [Google Scholar] [CrossRef]
22. Van Orden, K. F., Limbert, W., Makeig, S., Jung, T., Diego, S., et al. (2001). Eye activity correlates of workload during a visuospatial memory task. Human Factors, 43(1), 111–121. DOI 10.1518/001872001775992570. [Google Scholar] [CrossRef]
23. Oyedotun, O., Khashman, A. (2018). Prototype-incorporated emotional neural network. IEEE Transactions on Neural Networks and Learning Systems, 29(8), 3560–3572. DOI 10.1109/TNNLS.2017.2730179. [Google Scholar] [CrossRef]
24. Jian, C., Xiang, X., Zhang, M. (2019). Mobile terminal gesture recognition based on improved FAST corner detection. IET Image Processing, 13(6), 991–997. DOI 10.1049/iet-ipr.2018.5959. [Google Scholar] [CrossRef]
25. Liu, Z., Liu, X., Wang, K., Liang, Z., Correia, J. et al. (2019). GA-BP neural network-based strain prediction in full-scale static testing of wind turbine blades. Energies, 12(6), 1026. DOI 10.3390/en12061026. [Google Scholar] [CrossRef]
26. Habas, P., Zurada, J., Elmaghraby, A., Tourassi, G. (2007). Reliability analysis framework for computer-assisted medical decision systems. Medical Physics, 34(2), 763–772. DOI 10.1118/1.2432409. [Google Scholar] [CrossRef]
27. Anghel, D., Niţu, E., Rizea, A., Gavriluţă, A., Gavriluţă, A. et al. (2019). Ergonomics study on an assembly line used in the automotive industry. MATEC Web of Conferences, 290, 12001. DOI 10.1051/matecconf/201929012001. [Google Scholar] [CrossRef]
28. Fernández, M., Fernández, J., Bajo, J., Delrieux, C. (2020). Ergonomic risk assessment based on computer vision and machine learning. Computers & Industrial Engineering, 149, 106816. DOI 10.1016/j.cie.2020.106816. [Google Scholar] [CrossRef]
29. Wu, C., Yan, Y., Cao, Q., Fei, F., Yang, D. et al. (2018). A low cost surface EMG sensor network for hand motion recognition. 2018 IEEE 1st International Conference on Micro/Nano Sensors for AI, Healthcare, and Robotics (NSENS), Shenzhen, China: IEEE. DOI 10.1109/NSENS.2018.8713640. [Google Scholar] [CrossRef]
30. Taghavifar, D., Rakheja, S. (2018). Supervised ANN-assisted modeling of seated body apparent mass under vertical whole body vibration. Measurement: Journal of the International Measurement Confederation, 127, 78–88. DOI 10.1016/j.measurement.2018.05.092. [Google Scholar] [CrossRef]
31. Vescan, A., Şerban, C., Budur, A. (2021). Towards a reliability prediction model based on internal structure and post-release defects using neural networks. EASE 2021: Evaluation and Assessment in Software Engineering, pp. 379–386. Trondheim, Norway. DOI 10.1145/3463274.3463363. [Google Scholar] [CrossRef]
32. Dai, D., Luo, Y. (2021). Wireless network traffic prediction based on bat algorithm optimized back propagation neural network model. Journal of Computer Applications, 41(S1), 185–188. DOI 10.11772/j.issn.1001-9081.2020101679.33. [Google Scholar] [CrossRef]
33. Zhi, P., Xu, Y., Chen, B. (2020). Time-dependent reliability analysis of the motor hanger for EMU based on stochastic process. International Journal of Structural, 11(3), 453–469. DOI 10.1108/IJSI-07-2019-0075. [Google Scholar] [CrossRef]
34. Nahal, M., Khelif, R. (2020). A finite element model for estimating time-dependent reliability of a corroded pipeline elbow. International Journal of Structural Integrity, 2(12), 306–321. DOI 10.1108/IJSI-02-2020-0021. [Google Scholar] [CrossRef]
35. Ramezani, A., Nazari, T., Rabiee, A., Hadad, K., Faridafshin, M. (2020). Human error probability quantification for NPP post-accident analysis using cognitive-based THERP method. Progress in Nuclear Energy (New Series), 123, 103281. DOI 10.1016/j.pnucene.2020.103281. [Google Scholar] [CrossRef]
36. Meng, D., Wang, H., Yang, S., Lv, Z., Hu, Z. et al. (2021). Fault analysis of wind power rolling bearing based on EMD feature extraction. Computer Modeling in Engineering & Sciences, 130(1), 543–558. DOI 10.32604/cmes.2022.018123. [Google Scholar] [CrossRef]
37. Zhu, S., Keshtegar, B., Chakraborty, S., Trung, N. (2020). Novel probabilistic model for searching most probable point in structural reliability analysis. Computer Methods in Applied Mechanics and Engineering, 366, 113027. DOI 10.1016/j.cma.2020.113027. [Google Scholar] [CrossRef]
38. Farcasiu, M., Constantinescu, C. (2021). Evaluation of human factor engineering influence in nuclear safety using probabilistic safety assessment techniques. Kerntechnik, 6(86), 470–477. DOI 10.1515/kern-2020-0062. [Google Scholar] [CrossRef]
39. Hidetoshi, N., Masao, N., Tetsuya, M., Hirokazu, A. (2010). Human factor on driver and human cognitive reliability by driving simulator. The 40th International Conference on Computers & Indutrial Engineering, Awaji, Japan. [Google Scholar]
40. Zhu, S., Keshtegar, B., Seghier, M., Zio, E., Taylan, O. (2022). Hybrid and enhanced PSO: Novel first order reliability method-based hybrid intelligent approaches. Computer Methods in Applied Mechanics and Engineering, 393, 114730. DOI 10.1016/j.cma.2022.114730. [Google Scholar] [CrossRef]
41. Nawi, N., Rehman, M., Khan, A. (2014). The effect of bat population in Bat-BP algorithm. Singapore: Springer. DOI 10.1007/978-981-4585-42-2_34. [Google Scholar] [CrossRef]
42. Tsai, M., Li, C. (2010). Prediction of laser cutting qualities for QFN strips by using levenberg-marquardt-based neural network. Journal of the Chinese Society of Mechanical Engineers, 31(4), 273–280. [Google Scholar]
43. Xiao, L., Chen, X., Zhang, X. (2014). A joint optimization of momentum item and levenberg-marquardt algorithm to level up the BPNN’s generalization ability. Mathematical Problems in Engineering, 2014, 653072. DOI 10.1155/2014/653072. [Google Scholar] [CrossRef]
44. Sadeghi, H., Ajoudanian, S. (2022). Optimized feature selection in software product lines using discrete bat algorithm. International Journal of Computational Intelligence and Applications, 1(21). DOI 10.1142/S1469026822500031. [Google Scholar] [CrossRef]
45. Umar, S., Rashid, T. (2021). Critical analysis: Bat algorithm-based investigation and application on several domains. World Journal of Engineering, 18(4), 606–620. DOI 10.1108/WJE-10-2020-0495. [Google Scholar] [CrossRef]
46. Hannaman, G. W., Spurgin, A. J., Lukic, Y. D. (1984). Human cognitive reliability model for PRA analysis. In: NUS draft report 4531 on EPRI project RP2170-3, pp. 125–130. California, USA. [Google Scholar]
47. Petkov, G., Petkov, S. (2000). Second regeneration of HCR correlation. In: PSAM 5 probabilistic safety assessment and management. Osaka, Japan: Universal Academy Press, INC. [Google Scholar]
48. Yang, D., Liu, H. (2017). Application of THERP HCR model for valve overhaul in nuclear power plant. AIP Conference Proceedings, 1839(1). DOI 10.1063/1.4982410. [Google Scholar] [CrossRef]
49. Su, Y., Gao, X., Qian, H., Su, X. (2022). Handling uncertainty in human cognitive reliability method for safety assessment based on DSET. Computer Modeling in Engineering & Sciences, 132(1), 201–214. DOI 10.32604/cmes.2022.020541. [Google Scholar] [CrossRef]
50. Hall, R. E., Fragola, J., Wreathall, J. (1982). Post-event human decision errors: Operator action tree/time reliability correlation. USA: NUS Corporation. DOI 10.2172/6460666. [Google Scholar] [CrossRef]
51. Pyy, P. (2000). Human reliability analysis methods for probabilistic safety assessment. Finland: Valtion Teknillinen Tutkimuskeskus Publications. DOI 10.1016/0029-5493(89)90268-9. [Google Scholar] [CrossRef]
Cite This Article
 Copyright © 2023 The Author(s). Published by Tech Science Press.
This work is licensed under a Creative Commons Attribution 4.0 International License , which permits unrestricted use, distribution, and reproduction in any medium, provided the original work is properly cited.
 Downloads
 Citation Tools