
 Submit a Paper
 Propose a Special lssue
 Open Access
ARTICLE

Distributionally Robust Newsvendor Model for Fresh Products under Cap-and-Offset Regulation
1 College of Business, Yantai Nanshan University, Yantai, 265713, China
2 School of Management, Qufu Normal University, Rizhao, 276826, China
* Corresponding Author: Jianteng Xu. Email:
(This article belongs to the Special Issue: Data-Driven Robust Group Decision-Making Optimization and Application)
Computer Modeling in Engineering & Sciences 2023, 136(2), 1813-1833. https://doi.org/10.32604/cmes.2023.025828
Received 01 August 2022; Accepted 22 September 2022; Issue published 06 February 2023
 View Full Text
 Download PDF
Abstract
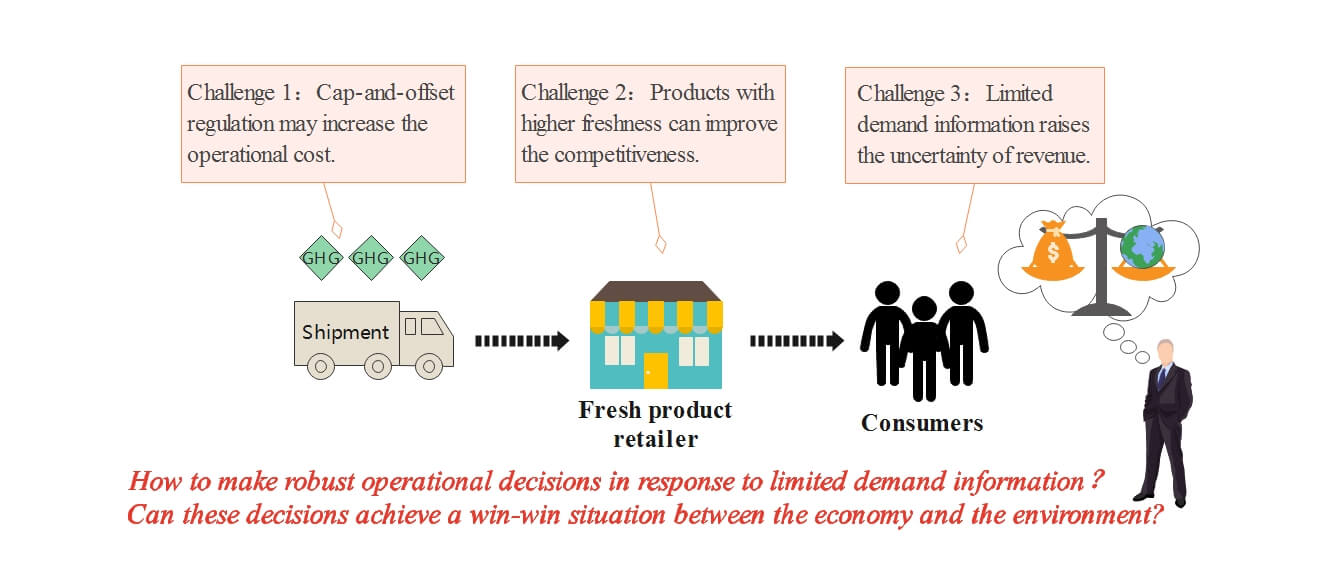
The cap-and-offset regulation is a practical scheme to lessen carbon emissions. The retailer selling fresh products can adopt sustainable technologies to lessen greenhouse gas emissions. We aim to analyze the optimal joint strategies on order quantity and sustainable technology investment when the retailer faces stochastic market demand and can only acquire the mean and variance of distribution information. We construct a distributionally robust optimization model and use the Karush-Kuhn-Tucker (KKT) conditions to solve the analytic formula of optimal solutions. By comparing the models with and without investing in sustainable technologies, we examine the effect of sustainable technologies on the operational management decisions of the retailer. Finally, some computational examples are applied to analyze the impact of critical factors on operational strategies, and some managerial insights are given based on the analysis results.Graphic Abstract
Keywords
With the intensification of climate warming and enhancement of sustainable awareness, carbon emissions reduction has become one of the critical issues in the world. Carbon dioxide is a major contributor to global warming. Many countries and regions have set short-term and long-term targets to lessen emissions. In September 2020, the Chinese government promised to lower carbon emissions, and successively released a series of supporting measures to achieve carbon peaking and carbon neutrality goals. Great efforts, such as implementing carbon regulations, have been made to achieve the goal of sustainable development [1,2]. The carbon tax, carbon trading and cap-and-offset regulations are most frequently adopted and researched [3–5]. In this paper, we assume that a fresh product retailer operates under the cap-and-offset regulation. Under cap-and-offset regulation, a certain threshold on carbon emissions is allocated to the retailer. The retailer can emit more than the threshold but will be penalized for the emissions exceeding the threshold.
In this context, the operational objective of the retailer has been changed to pursue economic benefits and protect environment simultaneously. Many enterprises take active measures to protect the environment. For example, WalMart, the largest department store in the United States, actively adopted new technologies to save energy and has built a low-carbon distribution center and a low-carbon supermarket. The development of cold chain market urges retailers to concentrate on the operational management of fresh products. The fresh products have perishable physical properties and are preserved in special temperature-controlled equipment that generates higher carbon emissions. Lekkerland, a famous retailer in Germany, implemented a “multi-temperature logistics” distribution strategy to sell perishable products. However, using such special multi-temperature equipment leads Lekkerland to produce much greenhouse gases compared with standard warehousing and logistics systems [6]. In this scenario, new challenges have been brought and raised our research interest in studying the influences of cap-and-offset regulation on retailer management strategies.
Affected by market fluctuations and uncertainties, it is more difficult for fresh product retailers to forecast the full distribution information of demand [7–9]. Partial distribution information of the demand is easier to specified accurately. In this scenario, when carbon emission reduction is considered in the operational management of fresh product retailers, the following issues arise. (i) How do fresh product retailers make robust strategies to pursue maximum economic benefits under cap-and-offset policy? (ii) How does the implementation of cap-and-offset affect the economic benefits and environmental performance of fresh product retailers? (iii) With incomplete distribution information of consumer demand, how can retailers achieve a win-win situation between the economy and the environment?
To address the major issues mentioned above, we consider the operational strategy of a fresh product retailer under cap-and-offset regulation. The retailer has to decide whether to invest in sustainable technology to lessen greenhouse gas emissions and find the optimal order quantity only according to the mean and variance of the stochastic demand. In order to give valuable suggestions to the retailer, we construct a distributionally robust optimization model and work out the analytic formula of joint order quantity and low-carbon technology investment. We further explore the situation without technology investment and compare two distributionally robust optimization models. Finally, some computational studies are conducted to validate the impact of principal factors on the robustness of operational decisions.
Our work has the following research contributions. First, we consider limited distribution information of stochastic demand and low-carbon technology investment in operational decisions of the fresh product retailer. We use a distributionally robust newsvendor method to work out the analytic formula of joint order quantity and sustainable technology investment. Second, we theoretically and numerically provide some conditions where investing in sustainable technology leads the fresh product retailer to gain higher expected profit and emit lower greenhouse gases under cap-and-offset regulation. Finally, we numerically investigate how carbon parameters affect the robustness of the optimal joint strategies on order quantity and sustainable technology investment.
The reminders of this paper are arranged as follows. Section 2 reviews the relevant literature and shows the research gap. Section 3 interprets the considered problem and relevant notations, and constructs two distributionally robust models. Section 4 contains some numerical studies to illustrate and complement the theoretical outcomes. Conclusions and implications are revealed in the last section.
Two research branches are connected with the considered topic. Operational decisions of the fresh product retailer and robust decisions of the retailer under carbon regulations.
The first branch of research concentrates on operational decisions of the fresh product retailer. This topic has received extensive attentions. In this context, Cai et al. [10] characterized a continuous variable to affect the fresh quality and survival quantity of fresh products. The fresh quality impacts the price-dependent stochastic demand with a complete probability distribution function. This system is coordinated with price discount scheme and compensation scheme. On this foundation, Cai et al. [11] developed the impact of transportation time on the perishability of quantity and quality of fresh products by simplifying the influence of random factors. In addition, a new mechanism is proposed to promote the cooperation between producer and distributor. Wu et al. [12] investigated how the channel power structure affects the decision-making behavior of managers in the game. The authors deem that logistics service level and pricing standard affect the sales demand of fresh products. Ma et al. [13] argued that asymmetric demand messages can cause the loss of profit in decentralized system. Combined with the particularity of agricultural products, the authors propose a new mechanism to promote cooperation and make up for system losses. Wu et al. [14] explored the impact of adopting blockchain technology on optimal strategies for e-sales of fresh products. The authors design an incentive mechanism to realize the overall optimization of the supply chain. Other literature on fresh products includes Chen et al. [15], Xu et al. [16], Duan et al. [17].
The articles mentioned above do not consider the impact of carbon emission reduction on developing models for different types of supply chains with fresh products. However, how to lessen carbon emissions has become a major issue in optimizing the fresh product supply chain. It is due to the fact that employing special packaging, cryogenic devices and other equipment may release more greenhouse gases. Bai et al. [18] integrated emission trading policy in a manufacturer-retailer supply chain for perishable items. The authors construct some optimization system models and coordinated mechanisms. Wang et al. [19] put forward pricing strategies of fresh foods and proclaim the relationship between carbon trading and cold logistics services. Wang et al. [20] proposed three replenishment scenarios to solve the optimal scheme between a supplier and several retailers under cap-and-trade policy. Ma et al. [21] considered the impact of freshness-keeping efforts on a three-tier cold chain under cap-and-trade policy. The authors propose a coordinated scheme to improve the profit of the whole system. Although these scholars introduce cap-and-trade regulation into the fresh product system, they assume that market demand is deterministic or stochastic with full distribution information. Many scholars assume that full information of the demand distribution is known and use a newsvendor mechanism to work out the optimal tactics under different types of carbon regulations [22–25]. Unlike them, in this paper, we integrate cap-and-offset regulation and limited distribution information of the demand into the decision-making background of a fresh product retailer. We utilize a distributionally robust optimization mechanism to work out the optimal joint strategies on the order quantity and sustainable technology investment.
The second branch of research concentrates on frims’ robust decisions under carbon regulations. This topic is popular in the operational management field. Due to the difficulties of acquiring full information of demand distribution, distributionally robust optimization approach is proposed to work out the optimal tactics with limited distribution information [26–29]. Recently, Liu et al. [30] extend the newsvendor problem to an independent remanufacturing structure under three different kinds of carbon regulations. The authors assume that only the mean and variance of stochastic demand are specified. And they work out the optimal robust remanufacturing quantity. Bai et al. [31] exploited a distributionally robust newsvendor model to work out the optimal order tactic on dual sources when the firm is regulated by carbon tax and carbon trading schemes. Xu et al. [32] studied and compare the impacts of carbon cap and carbon trading schemes on the firms’ robust order tactics with limited distribution information of the demand. Bai et al. [33] considered a remanufacturing structure under carbon trading scheme and develop a distributionally robust newsvendor model to find out the optimal decisions on collection and production quantities. Bai et al. [34] combined robust optimization method and Hurwicz-decision theory to solve the optimal decision of the sustainable manufacturer. The authors comparatively analyze the impact of carbon tax and mandatory carbon quota on decision-making. Although these scholars relax the information of demand distribution, they do not take the carbon policies into account in the operational decisions for fresh products. However, in this paper, we exploit a distributionally robust optimization model under cap-and-offset regulation for the fresh product retailer. We emphasize the impacts of both cap-and-offset regulation and limited distribution information on the optimal joint order quantity and low-carbon technology investment.
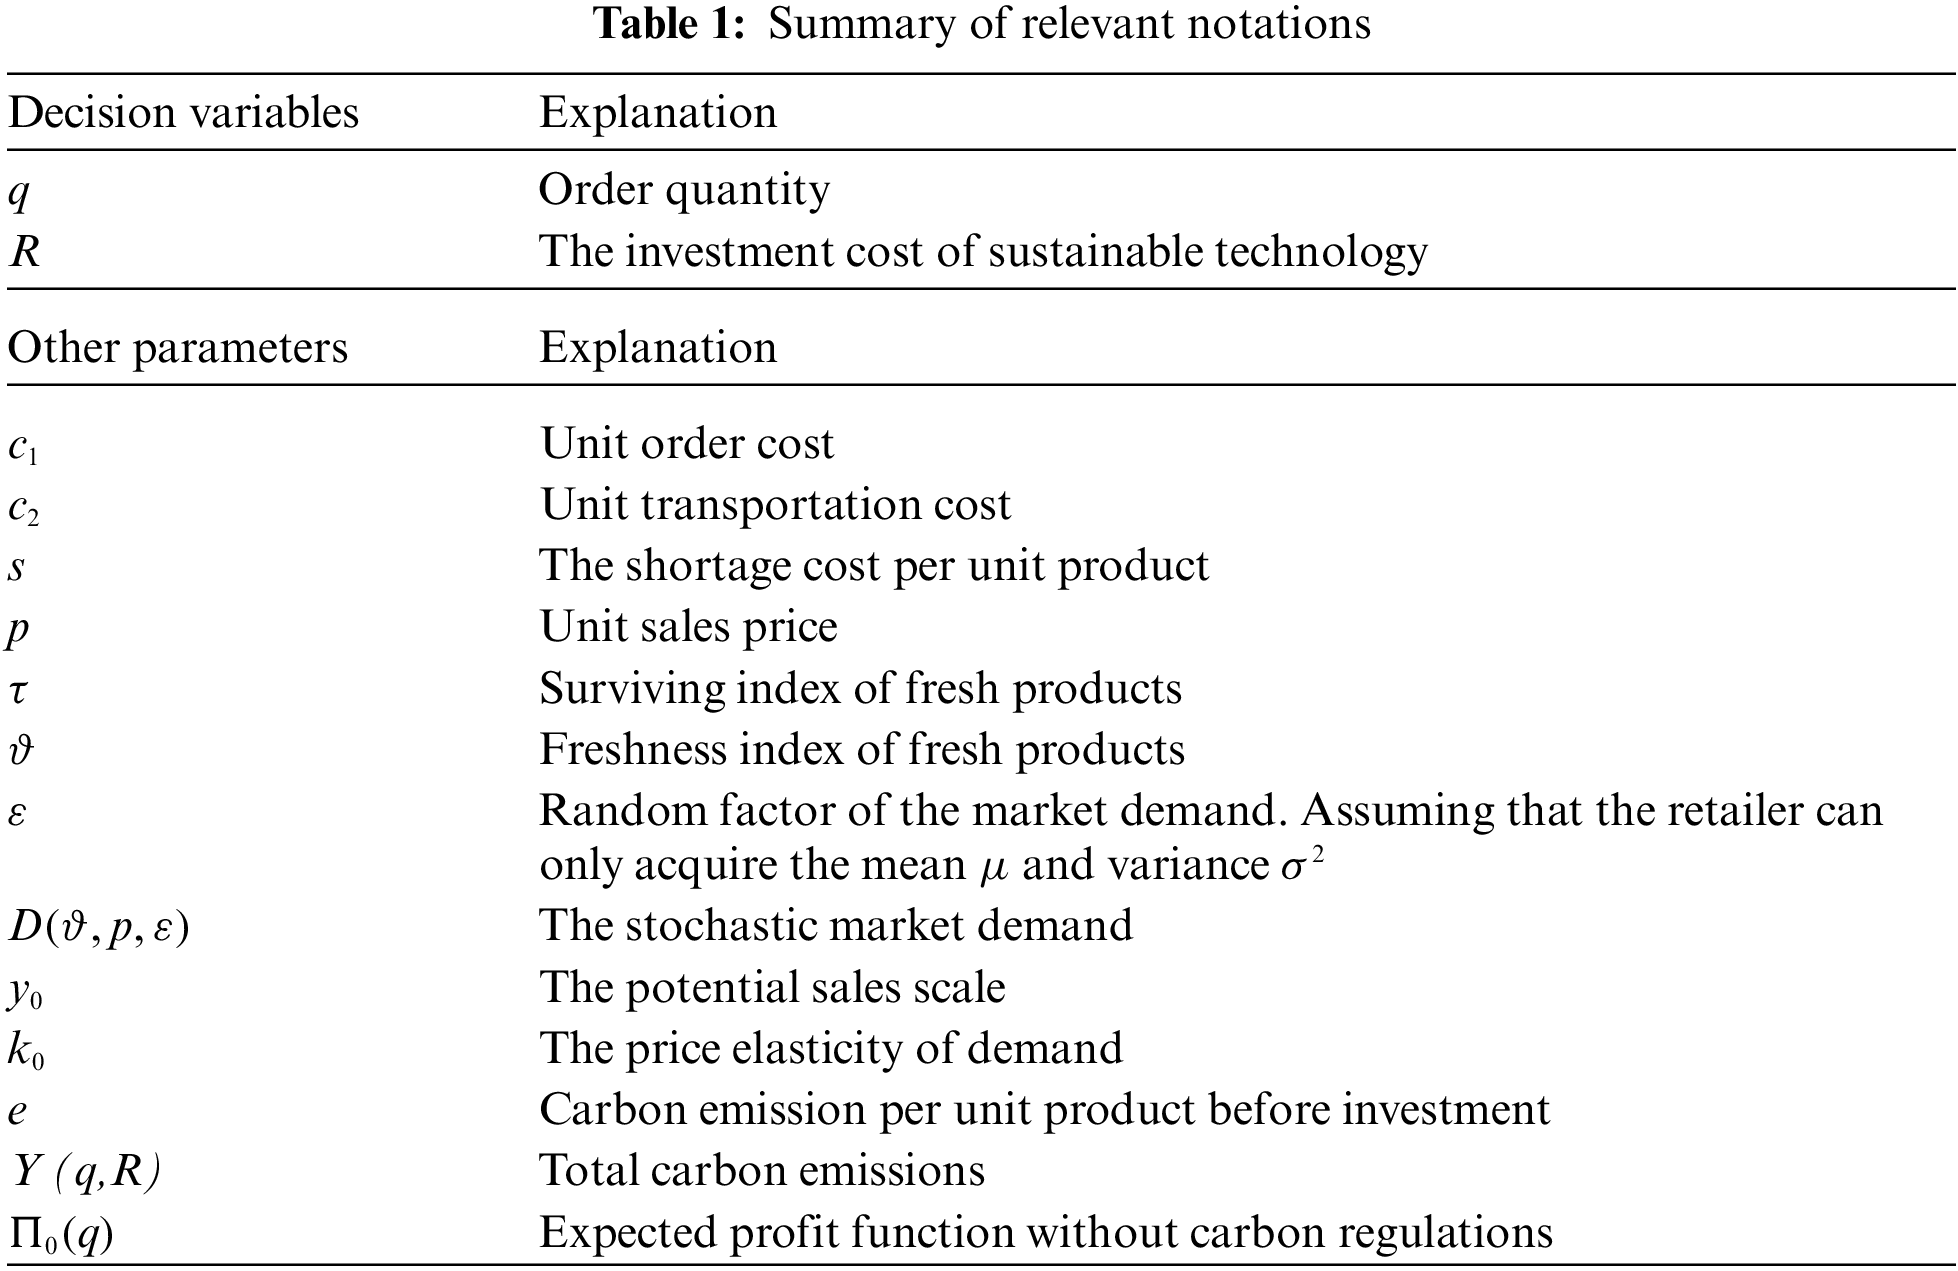
3.1 Problem Description and Hypothesis
The retailer purchases q units of a kind of fresh products at a unit order cost
In Eq. (1),
If actual demand D during selling period does not exceed
In Eq. (2), the first item indicates expected income, the second item indicates the order and transportation cost, and the third item indicates the expected shortage cost.
The transportation is the main link to emit greenhouse gases. The retailer can reduce carbon emissions by investing in sustainable technologies, equipments or machineries. The marginal reduction amount of carbon emissions deceases as the increment of the investment cost that identifies with the principle of “Increasing Marginal Cost” in economics. Referring to Huang et al. [35] and Toptal et al. [36], if the retailer invests in technologies, then the carbon emissions can be cut down by amount of
Considering the fact that the carbon emissions cannot be completely lessened to 0 even if investing in sustainable technologies, we assume that carbon emissions satisfies
3.2 Robust Optimization Strategies under Cap-and-Offset Policy
This subsection utilizes the distributionally robust optimization approach to analyze the optimal joint strategies on order quantity and sustainable technology investment. The fresh product retailer faces the fact that the probability distribution of demand is difficult to acquire and operation management is constrained by cap-and-offset regulation.
Referring to Chen et al. [5], under the cap-and-offset regulation, the government allocates the fixed number of carbon emission permits to the retailer, that is denoted by carbon cap K. When the total carbon emissions Y (q,R) exceed the carbon cap, the retailer needs to pay
Based on historical data information, the retailer can only acquire the mean
Here,
We solve the distributionally robust optimization models
Referring to Gallego et al. [27], the following lemma is given to show the relevant properties of the distribution function of stochastic demand.
Lemma 3.1. If the distribution function G belongs to set
And there exists a distribution function
For the convenience of solving the model, set
To ensure the feasibility of the solution, we assume that
Using Eqs. (6), (10)–(12), the following theorem can be obtained by solving the model
Theorem 3.1. For model
where
and
Please refer to Appendix A for the specific certification process. It can be seen that the optimal solution depends on the parameters of cap-and-offset regulation. Particularly, when
From the proof of Theorem 3.1, we can also draw the following corollary that reflects the conditions of investment and relation between the total carbon emissions and carbon cap for model
Corollary 3.1. For the model
(i) When
(ii) When
(iii) When
Next, we solve the distributionally robust optimization model
Defined
Using Eqs. (8), (12), (14) and (15), we can draw the following theorem by solving model
Theorem 3.2. For model
Otherwise, there does not exist optimal solutions.
Above theorem indicates that when carbon emissions are restricted by carbon cap, the optimal joint strategy is easier to determine than in the case where carbon emissions exceed carbon cap. Additionally, the selection of optimal solution only depends on carbon cap K. However, in Theorem 3.1, the selection of optimal solution depends on both carbon cap K and carbon tax
According to Theorem 3.2, we can also draw the following corollary that reflects the conditions of investment and relation between the total carbon emissions and carbon cap for model
Corollary 3.2. For model
(i) When
(ii) When
Combining with Theorem 3.1 and Theorem 3.2, we can get Theorem 3.3.
Theorem 3.3. For model
Theorem 3.3 shows that the fresh product retailer can make the distributionally robust optimal decisions to maximize expected profit function when the random demand information is limited to know.
This subsection constructs another distributionally robust optimization model, denoted as
Similar to model
Without investing in sustainable technology,
Theorem 3.4. When the fresh product retailer does not invest in sustainable technology, the following conclusions hold.
(i) For Model
(ii) For Model
(iii) For Model
Theorem 3.4 solves the analytic formula for the optimal solution of
According to Theorem 3.3 and Theorem 3.4, we can obtain the following theorem.
Theorem 3.5. Comparing with
(i)
(ii) If
If
If
Theorem 3.5 compares the expected profits and carbon emissions between models
In this subsection, the computational examples are reported. We explore the impact of some critical parameters, such as carbon cap K, unit carbon tax
Based on the above situation, we solved the expected profits and carbon emissions of the retailer with only acquiring the mean and variance of stochastic demand. The calculation results are shown in Table 2.
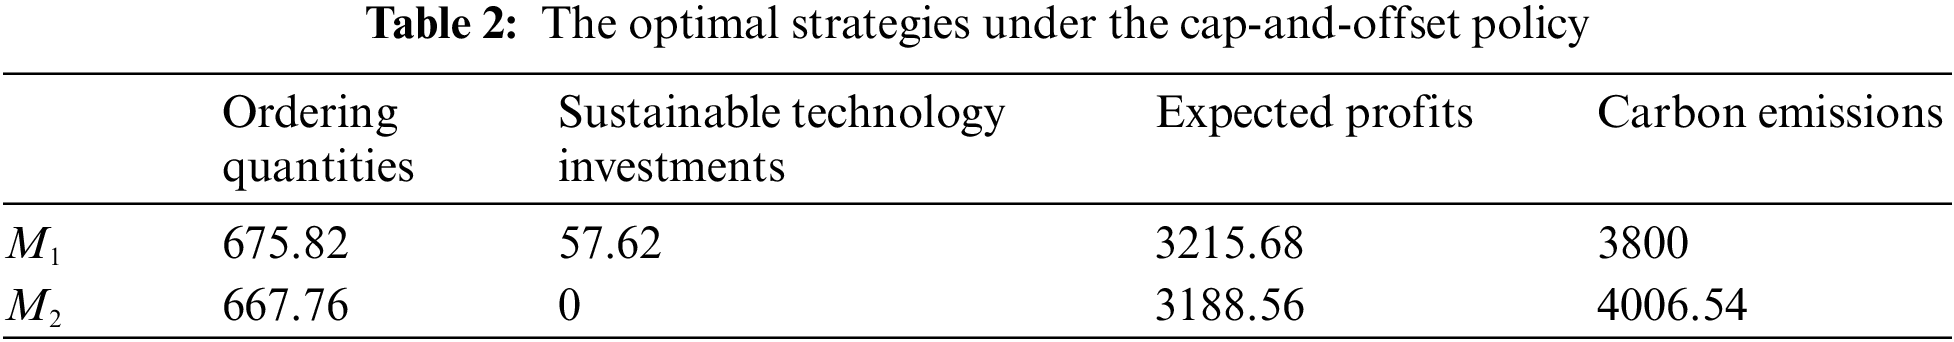
From Table 2, the following observations can be made.
From the aspect of emissions, if the retailer decides to invest in sustainable technology under cap-and-offset regulation with limited distribution information, the optimal sustainable technology investments are 57.62, and the carbon emissions are 3800, which are equivalent to the carbon cap stipulated by authorities. When the retailer does not invest in sustainable technology, the carbon emissions are 4006.54 that exceed the carbon cap. It shows that investing in sustainable technologies can effectively lessen releasing greenhouse gases.
Moreover, the expected profits in the case of investing in sustainable technology increase by 0.8% and the carbon emissions decrease by 8.2% compared with the case of no investment. It demonstrates that under the cap-and-offset regulation, investing in sustainable technology is more conducive for the retailer to achieving higher expected profits and lower carbon emissions.
We further analyze the sensitivity effects of carbon cap K and carbon tax

Figure 1: The impact of K on the retailer’s operational decisions

Figure 2: The impact of
Fig. 1 depicts the impact of carbon cap K on the retailer’s optimal strategies and operational effectiveness. It can be seen that, with the increase of K, the change trend of optimal order quantity and carbon emissions will firstly remain unchanged, then increase, and finally remain unchanged; the change trend of sustainable technology investments will firstly remain unchanged, then decrease, and finally remain unchanged; the change trend of expected profits will firstly increase and then remain unchanged. The change trend of the corresponding indicators in the cases of with and without investing in sustainable technology is similar. Moreover, when
Fig. 2 depicts the impact of carbon tax
According to the above discussion, the increase of carbon cap could encourage retailer to order and increase operating profit. But the increase of carbon tax could restrict the retailer to ordering less products and lessen operating profit. Under the cap-and-offset regulation, the optimal order quantity and expected profits after investment are always no less than that without investment. As well as the carbon emissions are always no more than that without investment. This suggests that the cap-and-offset regulation can effectively promote the retailer to invest in sustainable technology. It is beneficial for the retailer to achieve the target of higher expected profits and lower carbon emissions.
Next, we analyze the impact of surviving index


Figure 3: The impact of


Figure 4: The impact of
Fig. 3 depicts the impact of surviving index
Fig. 4 depicts the impact of freshness index
In addition, we can also find that no matter how the survival and freshness of products affect business operations, investing in sustainable technologies is more profitable and emits fewer emissions than that without investment under the cap-and-offset policy.
With the enhancement of environmental awareness, the sustainable management concept brings new opportunities and challenges to the operation of fresh product retailers. Based on this background, we combine cap-and-offset regulation to research the optimal decisions of the fresh product retailer. Firstly, we construct distributionally robust newsvendor models where the information of stochastic factors in the market demand is limited to the mean and variance. We propose the analytic formula of joint decisions on order quantity and low-carbon technology investment by KKT conditions. A further comparison between the problems with investment and without investment is revealed. Finally, numerical studies are carried out to verify the impact of the critical carbon factors on the robustness of operational tactics. The results show that the cap-and-offset regulation can effectively encourage the retailer to invest in sustainable technologies and lead to higher expected profits and lower carbon emissions. This is consistent with the retailer’s long-term goals and is conducive to achieving sustainable development. This paper mainly studies the optimal strategies from the angle of a single fresh product retailer. Further research can be conducted from the angle of the whole supply chain with fresh products in the future.
Funding Statement: This study is financially supported by the National Natural Science Foundation of China (Grant No. 71702087), the Youth Innovation Science and Technology Support Program of Shandong Province Higher Education (Grant No. 2021RW024), and the Special Funds for Taishan Scholars, Shandong (Grant No. tsqn202103063).
Conflicts of Interest: The authors declare that they have no conflicts of interest to report regarding the present study.
References
1. Sheng, D., Li, Z. C., Fu, X. W., Gillen, D. (2017). Modeling the effects of unilateral and uniform emission regulations under shipping company and port competition. Transportation Research Part E: Logistics and Transportation Review, 101, 99–114. DOI 10.1016/j.tre.2017.03.004. [Google Scholar] [CrossRef]
2. Sheng, D., Meng, Q., Li, Z. C. (2019). Optimal vessel speed and fleet size for industrial shipping services under the emission control area regulation. Transportation Research Part C: Emerging Technologies, 105, 37–53. DOI 10.1016/j.trc.2019.05.038. [Google Scholar] [CrossRef]
3. Konstantaras, I., Skouri, K., Benkherouf, L. (2021). Optimizing inventory decisions for a closed-loop supply chain model under a carbon tax regulatory mechanism. International Journal of Production Economics, 239, 108185. DOI 10.1016/j.ijpe.2021.108185. [Google Scholar] [CrossRef]
4. Linghu, D., Wu, X., Lai, K. H., Ye, F., Kumar, A. et al. (2022). Implementation strategy and emission reduction effectiveness of carbon cap-and-trade in heterogeneous enterprises. International Journal of Production Economics, 248, 108501. DOI 10.1016/j.ijpe.2022.108501. [Google Scholar] [CrossRef]
5. Chen, X., Benjaafar, S., Elomri, A. (2013). The carbon-constrained EOQ. Operations Research Letters, 41(2), 172–179. DOI 10.1016/j.orl.2012.12.003. [Google Scholar] [CrossRef]
6. Bai, Q. G., Gong, Y. Y., Jin, M. Z., Xu, X. H. (2019). Effects of carbon emission reduction on supply chain coordination with vendor-managed deteriorating product inventory. International Journal of Production Economics, 208, 83–99. DOI 10.1016/j.ijpe.2018.11.008. [Google Scholar] [CrossRef]
7. Qu, S., Meng, D., Dai, Y. (2017). Distributionally robust games with an application to supply chain. Journal of Intelligent & Fuzzy Systems, 33(5), 2749–2762. DOI 10.3233/JIFS-169324. [Google Scholar] [CrossRef]
8. Qu, S., Han, Y., Wu, Z., Raza, H. (2021). Consensus modeling with asymmetric cost based on data-driven robust optimization. Group Decision and Negotiation, 33, 1395–1432. DOI 10.1007/s10726-020-09707-w. [Google Scholar] [CrossRef]
9. Ji, Y., Jin, X., Xu, Z., Qu, S. (2021). A mixed 0–1 programming approach for multiple attribute strategic weight manipulation based on uncertainty theory. Journal of Intelligent & Fuzzy Systems, 41(6), 6739–6754. DOI 10.3233/JIFS-210650. [Google Scholar] [CrossRef]
10. Cai, X., Chen, J., Xiao, Y., Xu, X. (2010). Optimization and coordination of fresh product supply chains with freshness-keeping effort. Production and Operation Management, 19(3), 261–278. DOI 10.1111/j.1937-5956.2009.01096.x. [Google Scholar] [CrossRef]
11. Cai, X., Chen, J., Xiao, Y., Xu, X. (2013). Fresh-product supply chain management with logistics outsourcing. Omega, 41(4), 752–765. DOI 10.1016/j.omega.2012.09.004. [Google Scholar] [CrossRef]
12. Wu, Q., Mu, Y., Feng, Y. (2015). Coordinating contracts for fresh product outsourcing logistics channels with power structures. International Journal of Production Economics, 160, 94–105. DOI 10.1016/j.ijpe.2014.10.007. [Google Scholar] [CrossRef]
13. Ma, X. L., Wang, S. Y., Islam, S. M. N., Liu, X. B. (2019). Coordinating a three-echelon fresh agricultural products supply chain considering freshness-keeping effort with asymmetric information. Applied Mathematical Modelling, 67, 337–356. DOI 10.1016/j.apm.2018.10.028. [Google Scholar] [CrossRef]
14. Wu, X. Y., Fan, Z. P., Cao, B. B. (2021). An analysis of strategies for adopting blockchain technology in the fresh product supply chain. International Journal of Production Research. DOI 10.1080/00207543.2021.1894497. [Google Scholar] [CrossRef]
15. Chen, J., Tian, Z. W., Hang, W. (2020). Optimal ordering and pricing policies in managing perishable products with quality deterioration. International Journal of Production Research, 59(15), 4472–4494. DOI 10.1080/00207543.2020.1766715. [Google Scholar] [CrossRef]
16. Xu, C., Fan, T. J., Zheng, Q., Song, Y. (2020). Contract selection for fresh produce suppliers cooperating with a platform under a markdown-pricing policy. International Journal of Production Research. DOI 10.1080/00207543.2021.1987548. [Google Scholar] [CrossRef]
17. Duan, Y. R., Liu, J. J. (2019). Optimal dynamic pricing for perishable foods with quality and quantity deteriorating simultaneously under reference price effects. International Journal of Systems Science: Operations & Logistics, 6(4), 346–355. [Google Scholar]
18. Bai, Q. G., Chen, M. Y., Xu, L. (2017). Revenue and promotional cost-sharing contract versus two-part tariff contract in coordinating sustainable supply chain systems with deteriorating items. International Journal of Production Economics, 187, 85–101. DOI 10.1016/j.ijpe.2017.02.012. [Google Scholar] [CrossRef]
19. Wang, M., Zhao, L. D., Herty, M. (2018). Modelling carbon trading and refrigerated logistics services within a fresh food supply chain under carbon cap-and-trade regulation. International Journal of Production Research, 56(12), 4207–4225. DOI 10.1080/00207543.2018.1430904. [Google Scholar] [CrossRef]
20. Wang, M., Zhao, L. D., Herty, M. (2019). Joint replenishment and carbon trading in fresh food supply chains. European Journal of Operational Research, 277(2), 561–573. DOI 10.1016/j.ejor.2019.03.004. [Google Scholar] [CrossRef]
21. Ma, X. L., Wang, J., Bai, Q. G., Wang, S. Y. (2020). Optimization of a three-echelon cold chain considering freshness-keeping efforts under cap-and-trade regulation in Industry 4.0. International Journal of Production Economics, 220, 107457. DOI 10.1016/j.ijpe.2019.07.030. [Google Scholar] [CrossRef]
22. Chen, X., Wang, X. J. (2016). Effects of carbon emission reduction policies on transportation mode selections with stochastic demand. Transportation Research Part E: Logistics and Transportation Review, 90, 196–205. DOI 10.1016/j.tre.2015.11.008. [Google Scholar] [CrossRef]
23. Qu, S., Zhou, Y., Zhang, Y., Wahab, M. I. M., Zhang, G. et al. (2019). Optimal strategy for a green supply chain considering shipping policy and default risk. Computers & Industrial Engineering, 131, 172–186. DOI 10.1016/j.cie.2019.03.042. [Google Scholar] [CrossRef]
24. Qu, S., Jiang, G., Ji, Y., Zhang, G., Mohamed, N. (2021). Newsvendor’s optimal decisions under stochastic demand and cap-and-trade regulation. Environment, Development and Sustainability, 23, 17764–17787. DOI 10.1007/s10668-021-01411-2. [Google Scholar] [CrossRef]
25. Qi, Q., Zhang, R. Q., Bai, Q. G. (2021). Joint decisions on emission reduction and order quantity by a risk-averse firm under cap-and-trade regulation. Computers & Industrial Engineering, 162, 107783. DOI 10.1016/j.cie.2021.107783. [Google Scholar] [CrossRef]
26. Scarf, H. E. (1958). A min-max solution of an inventory problem. In: Arrow, K. J., Karlin, S., Scarf, H. E. (eds.Studies in the mathematical theory of inventory and production, pp. 201–209. California, USA: Stanford University Press. [Google Scholar]
27. Gallego, G., Moon, I. (1993). The distribution free newsboy problem: Review and extensions. Journal of the Operational Research Society, 44(8), 825–834. DOI 10.1057/jors.1993.141. [Google Scholar] [CrossRef]
28. Han, Q., Du, D., Zuluaga, L. F. (2014). A risk and ambiguity-averse extension of the max-min newsvendor order formula. Operations Research, 62(3), 535–542. DOI 10.1287/opre.2014.1262. [Google Scholar] [CrossRef]
29. Zhang, H. J., Ji, Y., Qu, S. J., Li, H. H., Huang, R. P. (2022). The robust minimum cost consensus model with risk aversion. Information Sciences, 587, 283–299. DOI 10.1016/j.ins.2021.12.023. [Google Scholar] [CrossRef]
30. Liu, B., Holmbom, M., Segerstedt, A., Chen, W. (2015). Effects of carbon emission regulations on remanufacturing decisions with limited information of demand distribution. International Journal of Production Research, 53(2), 532–548. DOI 10.1080/00207543.2014.957875. [Google Scholar] [CrossRef]
31. Bai, Q. G., Chen, M. Y. (2016). The distributionally robust newsvendor problem with dual sourcing under carbon tax and cap-and-trade regulations. Computers & Industrial Engineering, 98, 260–274. DOI 10.1016/j.cie.2016.05.042. [Google Scholar] [CrossRef]
32. Xu, J. T., Bai, Q. G., Xu, L., Hu, T. T. (2018). Effects of emission reduction and partial demand information on operational decisions of a newsvendor problem. Journal of Cleaner Production, 188, 825–839. DOI 10.1016/j.jclepro.2018.04.027. [Google Scholar] [CrossRef]
33. Bai, Q. G., Xu, J. T., Zhang, Y. (2022). The distributionally robust optimization model for a remanufacturing system under cap-and-trade policy: A newsvendor approach. Annals of Operations Research, 309, 731–760. DOI 10.1007/s10479-020-03642-4. [Google Scholar] [CrossRef]
34. Bai, Q. G., Xu, J. T., Gong, Y. M., Chauhan, S. S. (2022). Robust decisions for regulated sustainable manufacturing with partial demand information: Mandatory emission capacity versus emission tax. European Journal of Operational Research, 298(3), 874–893. DOI 10.1016/j.ejor.2021.06.011. [Google Scholar] [CrossRef]
35. Huang, M. H., Rust, R. T. (2011). Sustainability and consumption. Journal of the Academy of Marketing Science, 39(1), 40–54. DOI 10.1007/s11747-010-0193-6. [Google Scholar] [CrossRef]
36. Toptal, A., Özlü, H., Knour, D. (2014). Joint decisions on inventory replenishment and emission reduction investment under different emission regulations. International Journal of Production Research, 52(1), 243–269. DOI 10.1080/00207543.2013.836615. [Google Scholar] [CrossRef]
37. Petruzzi, N. C., Dada, M. (1999). Pricing and the newsvendor problem: A review with extensions. Operations Research, 47(2), 183–194. DOI 10.1287/opre.47.2.183. [Google Scholar] [CrossRef]
Appendix A.
Proof of Theorem 3.1.
Let
Using Eqs. (3), (6) and (10), the Lagrange function of the model
KKT conditions are as follows:
In actual operation, the retailer pursues profit maximization, and the stock factor satisfies the condition
Case 1.
Case 2.
Since
If
Case 3.
Substituting Eqs. (28) into (20), the optimal stock factor of model
Case 4.
Case 5. Combining with Case 3 and Case 4 in the overlapping interval
Proof of Theorem 3.2.
Let
Using Eqs. (3), (8) and (14), the Lagrange function of the model
KKT conditions are as follows:
Similar to the proof of Theorem 3.1, we assume the stock factor satisfies
Case 1.
Case 2.
Taking the first derivative on
Case 3.
From Eq. (32), we can deduce
Case 4.
Proof of Theorem 3.5.
(i) Using Eqs. (5) and (18), we have
According to the aforementioned proof, we know that if
(ii) According to Theorem 3.1 and Theorem 3.4, it is easy to verify the conclusion by taking
Cite This Article
 Copyright © 2023 The Author(s). Published by Tech Science Press.
This work is licensed under a Creative Commons Attribution 4.0 International License , which permits unrestricted use, distribution, and reproduction in any medium, provided the original work is properly cited.
 Downloads
 Citation Tools