
 Submit a Paper
 Propose a Special lssue
 Open Access
ARTICLE

Reliability-Based Topology Optimization of Fail-Safe Structures Using Moving Morphable Bars
1 School of Mechanical Engineering, Tianjin University, Tianjin, 300072, China
2 Department of Engineering Mechanics, Hefei University of Technology, Hefei, 230009, China
3 Mechanical Engineering Institute, Vietnam Maritime University, Hai Phong City, 180000, Vietnam
4 State Key Laboratory for Alternate Electrical Power System with Renewable Energy Sources, North China Electric Power University, Beijing, 102206, China
* Corresponding Authors: Zeng Meng. Email: ; Kai Long. Email:
Computer Modeling in Engineering & Sciences 2023, 136(3), 3173-3195. https://doi.org/10.32604/cmes.2023.025501
Received 17 July 2022; Accepted 03 November 2022; Issue published 09 March 2023
 View Full Text
 Download PDF
Abstract
This paper proposes an effective reliability design optimization method for fail-safe topology optimization (FSTO) considering uncertainty based on the moving morphable bars method to establish the ideal balance between cost and robustness, reliability and structural safety. To this end, a performance measure approach (PMA)-based double-loop optimization algorithm is developed to minimize the relative volume percentage while achieving the reliability criterion. To ensure the compliance value of the worst failure case can better approximate the quantified design requirement, a p-norm constraint approach with correction parameter is introduced. Finally, the significance of accounting for uncertainty in the fail-safe design is illustrated by contrasting the findings of the proposed reliability-based topology optimization (RBTO) method with those of the deterministic design method in three typical examples. Monte Carlo simulation shows that the relative error of the reliability index of the optimized structure does not exceed 3%.Graphic Abstract
Keywords
Topology optimization (TO) can generate innovative designs without any assumptions about structural connectivity, which makes it a potent and helpful drive for reducing structural weight while satisfying specific performance requirements. Nowadays, TO has been successfully implemented in numerous fields and the available reviews on the most recent developments can be found in literature reviews [1,2] and references therein.
Due to the absence of structural redundancy and disregard for the influence of uncertain parameters, the resulting resembled statically determinate structures obtained by conventional TO are susceptible to local stiffness loss. FSTO aims to design structures that can operate in a damaged state. Fail-safe structures can overcome the disadvantage that traditional structures are easily affected by local stiffness loss due to the absence of structural redundancy. Jansen et al. [3] introduced the fail-safe idea into TO for the first time. They demonstrated the influence of local failure on the typical design problem of cantilever beam and compliant mechanism, which may lead to the complete loss of displacement inversion capability of compliant mechanism. Therefore they suggested a streamlined model of local damage and a robust worst-case approach for designing fail-safe structures, in which the complex process of damage is approximated by removing material stiffness in fixed square patches with a prescribed size. In addition, they presented other ways to reduce the computational time of the proposed approach, such as sequential formulation, perturbation techniques, reanalysis techniques, and active set strategies. Zhou et al. [4] generalized the work of FSTO to establish a rigorous mathematical design framework and computationally feasible solution for 3D structures. Stolpe [5] extended truss TO to accommodate fail-safe requirements, where the damage scenarios are modelled by removing a set of bars’ material stiffness or by degrading the member regions. Lüdeker et al. [6] presented a stress-constrained formulation for fail-safe optimization using beam elements with varying thicknesses, where the damage scenario is modelled by removing one beam element at a time. Wang et al. [7] incorporated the von Mises stress into FSTO, where damage situations are simulated by removing the material stiffness of certain patches whose von Mises stress exceeded the permissible value. Du et al. [8] integrated fail-safe requirements into the field of frequency TO via the independent continuous mapping (ICM) method, which prevents the fundamental frequency of optimized fail-safe structures from being vulnerable to local failure. Du et al. [9] presented FSTO model for minimizing the weight of continuum structures with stress and displacement constraints based on the ICM method and the dual sequence quadratic programming (DSQP) algorithm. Kranz et al. [10] developed a volume-restricted stress-based FSTO formulation for minimizing the worst-case von Mises stress. Peng et al. [11] developed a volume-minimization fail-safe optimization formulation with displacement restrictions by adopting the reciprocal type variables. To circumvent the finite element (FE) mesh dependency in existing methods for FSTO, Hederberg et al. [12] employed so-called moving morphable components (MMCs) [13,14] to simulate damage while using the variable density method to implement TO. Smith et al. [15] employed a geometry projection method for FSTO, in which local failure is mimicked by removing each geometric component. Dou et al. [16] presented some notable findings of extending stress-constrained truss optimization to accommodate fail-safe requirements through a three-bar example. Then they incorporated two additional failure modes of thickness degradation and local damage into the FSTO of 2D frame structures subject to stress and eigenfrequency criteria [17]. As an alternative to defining a damage formulation for boosting the redundancy and damage tolerance, Wu et al. [18] and Dou [19] integrated fail-safe criterion into TO by applying local volume constraints.
It is observed that the aforementioned research on FSTO is conducted under deterministic conditions, i.e., deterministic topology optimization (DTO), which means it ignores the effect of inherent uncertainty factors, such as material parameters, on the design optimization of fail-safe structures. However, uncertainties of material properties and load are essential and critical features in FSTO structures, particularly in large structures and lifeline engineering structures. In addition, as highlighted in [4,6,20,21], fundamental engineering structures have high requirements for robustness, FSTO reliability, and structural safety. The underlying concepts behind FSTO and reliability-based or robust TO are very different and should not be confused, even though these approaches may provide comparable results. In FSTO, the location of failure cases or degradation was known red, and the corresponding areas were removed entirely. Robust and reliability-based TO are two strategies for coping with unknown parameters involved in structural optimization. Robust TO aims to enhance the capacity of structures to withstand changes in uncertain parameters [22,23]. RBTO entails reliability analysis and ensures the fulfillment of the design conditions with the intended target reliability level when some parameters involved in structural responses are of random nature [24,25]. Reliability design has been extended to many fields of topology optimization, including geometrically nonlinear [26,27], dynamic [28,29], stress-constrained [30], thermal-mechanical coupling [31], composite structures [32], etc. The approximate reliability methods based on Taylor series expansion, including the first-and second-order reliability methods (FORM and SORM), have proved to be accurate methods for estimating the failure probability in RBTO [33–35]. It seems reasonable to integrate these concepts to mitigate potential performance degradation during service and provide more robust and reliable fail-safe designs. Currently, some researchers have made some efforts in this regard. Long et al. [36] introduced a resilient TO formulation for continuum structures considering both the unpredictability of the damage site and the uncertainty of loading direction and amplitude. A technique of a robust TO of fail-safe systems that considers the occurrence and size of failure as sources of uncertainty has been proposed by Martínez-Frutos et al. [37]. In contrast to using a worst-case approach, Martínez-Frutos et al. [20] also proposed a risk-averse level-set method for TO of fail-safe structures, in which the probability of a failure scenario occurring is coupled with the formulation using a probabilistic framework. Cid et al. [38] introduced a novel probability-damage technique based on available information regarding the chance associated with individual partial collapses.
It can be seen that most of the existing literature on fail-safe design is conducted based on the implicit density method and level-set method. The implicit geometric/topological representation is not compatible with modern computer-aided design (CAD) modelling systems. In this paper, we propose an explicit reliability-based TO methodology for handling the design problem of fail-safe structures under uncertainty using explicit moving morphable bars (MMB), aiming to achieve an optimal balance between cost, robustness, reliability, and structural safety. This explicit method supports explicit geometric information due to the use of geometric parameters as design variables. With the help of this geometric information, we can easily reconstruct the optimized structure in a CAD system and then generate file formats that can be read by CNC (computer numerical control) machining or additive manufacturing, such as STL files. Another notable benefit of using MMB method is that it can facilitate the implementation of minimum constraint control and improve the manufacturability of optimized structures. Besides, using the MMB method to implement topology optimization involves relatively fewer design variables, which can improve the calculation efficiency of optimization iteration. The rest of this paper is organized as follows. Section 2 details the deterministic FSTO based on moving morphable bars. Section 3 formulates RBTO of fail-safe structures considering uncertainty, followed by the design sensitivity analysis in Section 4. The suggested RBTO method for fail-safe structures is demonstrated in Section 5 through a series of numerical tests. Section 6 comes to a conclusion.
2 DTO of Fail-Safe Structures Based on Moving Morphable Bars
2.1 Density Distribution in Moving Morphable Bars
As opposed to the traditional pixel or node point-based implicit TO approach, Here we use the MMB method [39–41] to conduct TO due to its convenience in implementing minimum size control. The MMB method uses a set of discrete geometric bars as the fundamental building blocks. The geometrical parameters describing the position and size of these MMBs are taken as the design variables. As shown in Fig. 1, each discrete bar is determined by 5 parameters: coordinates of the centers k1, k2 of the two semicircles at the ends of the bar
where

Figure 1: Geometry of a moving bar
In Eq. (2),
Note that
For clarity, in Fig. 2, the figure on the left shows the pattern of “I

Figure 2: The pattern of “I
2.2 DTO of Fail-Safe Structures
Here we adopted the simplified local damage model reported in [3] to implement FSTO. An adequate set of m patch removal scenarios are used to depict local failure. As illustrated in Fig. 3 for a quadrate failure zone containing a patch of elements
where
where

Figure 3: Removal of a quadrate patch of material
As with the pioneering works integrating local failure into continuum TO [3,4], we use compliance as the performance measure of fail-safe structures involving failure scenarios. However, unlike performing the volume-constrained compliance minimization in [3,4], we treat the compliance corresponding to the worst failure case as the design constraint while minimizing the volume fraction of the structure. This means that we can achieve the purpose of weight reduction while meeting the quantified design requirements. Consequently, the DTO model for fail-safe structures is formulated as
where
Since the maximum function in the constraint function of Eq. (7) is not differentiable, to make sure the design variables are updated by using a gradient-based algorithm, the non-differentiable max-operator
where
where the correction parameter cp of the nth iteration is calculated by
where
3 RBTO of Fail-Safe Structures Considering Uncertainty
3.1 RBTO Model for Fail-Safe Structures Considering Uncertainty
All the related works on the fail-safe design of continua are undertaken under deterministic settings, disregarding the impact of uncertain factors on optimal design. However, uncertainties in structural parameters such as material property are inherent and the scatter from their nominal ideal values is unavoidable in the vast majority of engineering applications. A design derived through a deterministic optimization process cannot guarantee the fulfilment of the constraints if some degree of uncertainty appears later in the problem. Consequently, these uncertainties should be accounted for during the structural design phase to reduce the risk of performance degradation. For the first time, we integrate reliability analysis considering uncertainty into FSTO. The RBTO model is formulated as
The main difference between RBTO of fail-safe structures in Eq. (11) and the classical DTO in Eq. (7) lies in the introduction of random parameter
3.2 PMA-Based Reliability Analysis
Currently, numerous effective numerical reliability methods have been developed to approximate the reliability involved in reliability constraint, such as sampling-based methods utilizing Monte Carlo simulation and approximate reliability methods based on Taylor series expansion, etc. The reliability index approach (RIA) [44] and performance measure approach (PMA) [45,46] are two most commonly used first-order reliability method. Without loss of generality, here we use PMA to incorporate probability constraint in reliability analysis due to its stability and efficiency. Therefore, the PMA-based RBTO formulation is expressed mathematically as follows:
where
where
In the PMA approach, a point satisfies this metric
where
4.1 Sensitivity of Performance Function w.r.t. Random Variables
Firstly, we focus on the sensitivity of the
In Eq. (15) the derivative term
The adjoint variable method is used to calculate the derivative of the compliance
where
Then the
To eliminate
The derivative of performance function w.r.t. the random load can be derived similarly, and the details are omitted here.
4.2 Sensitivity of Performance Function w.r.t. Design Variables
Now, we focus on the sensitivity of
where the derivative term
Similar to the calculation process of
In Eq. (21),
In Eq. (21),
The proposed method for RBTO of fail-safe design under uncertainty is demonstrated in three numerical examples in this section. Unless otherwise stated,
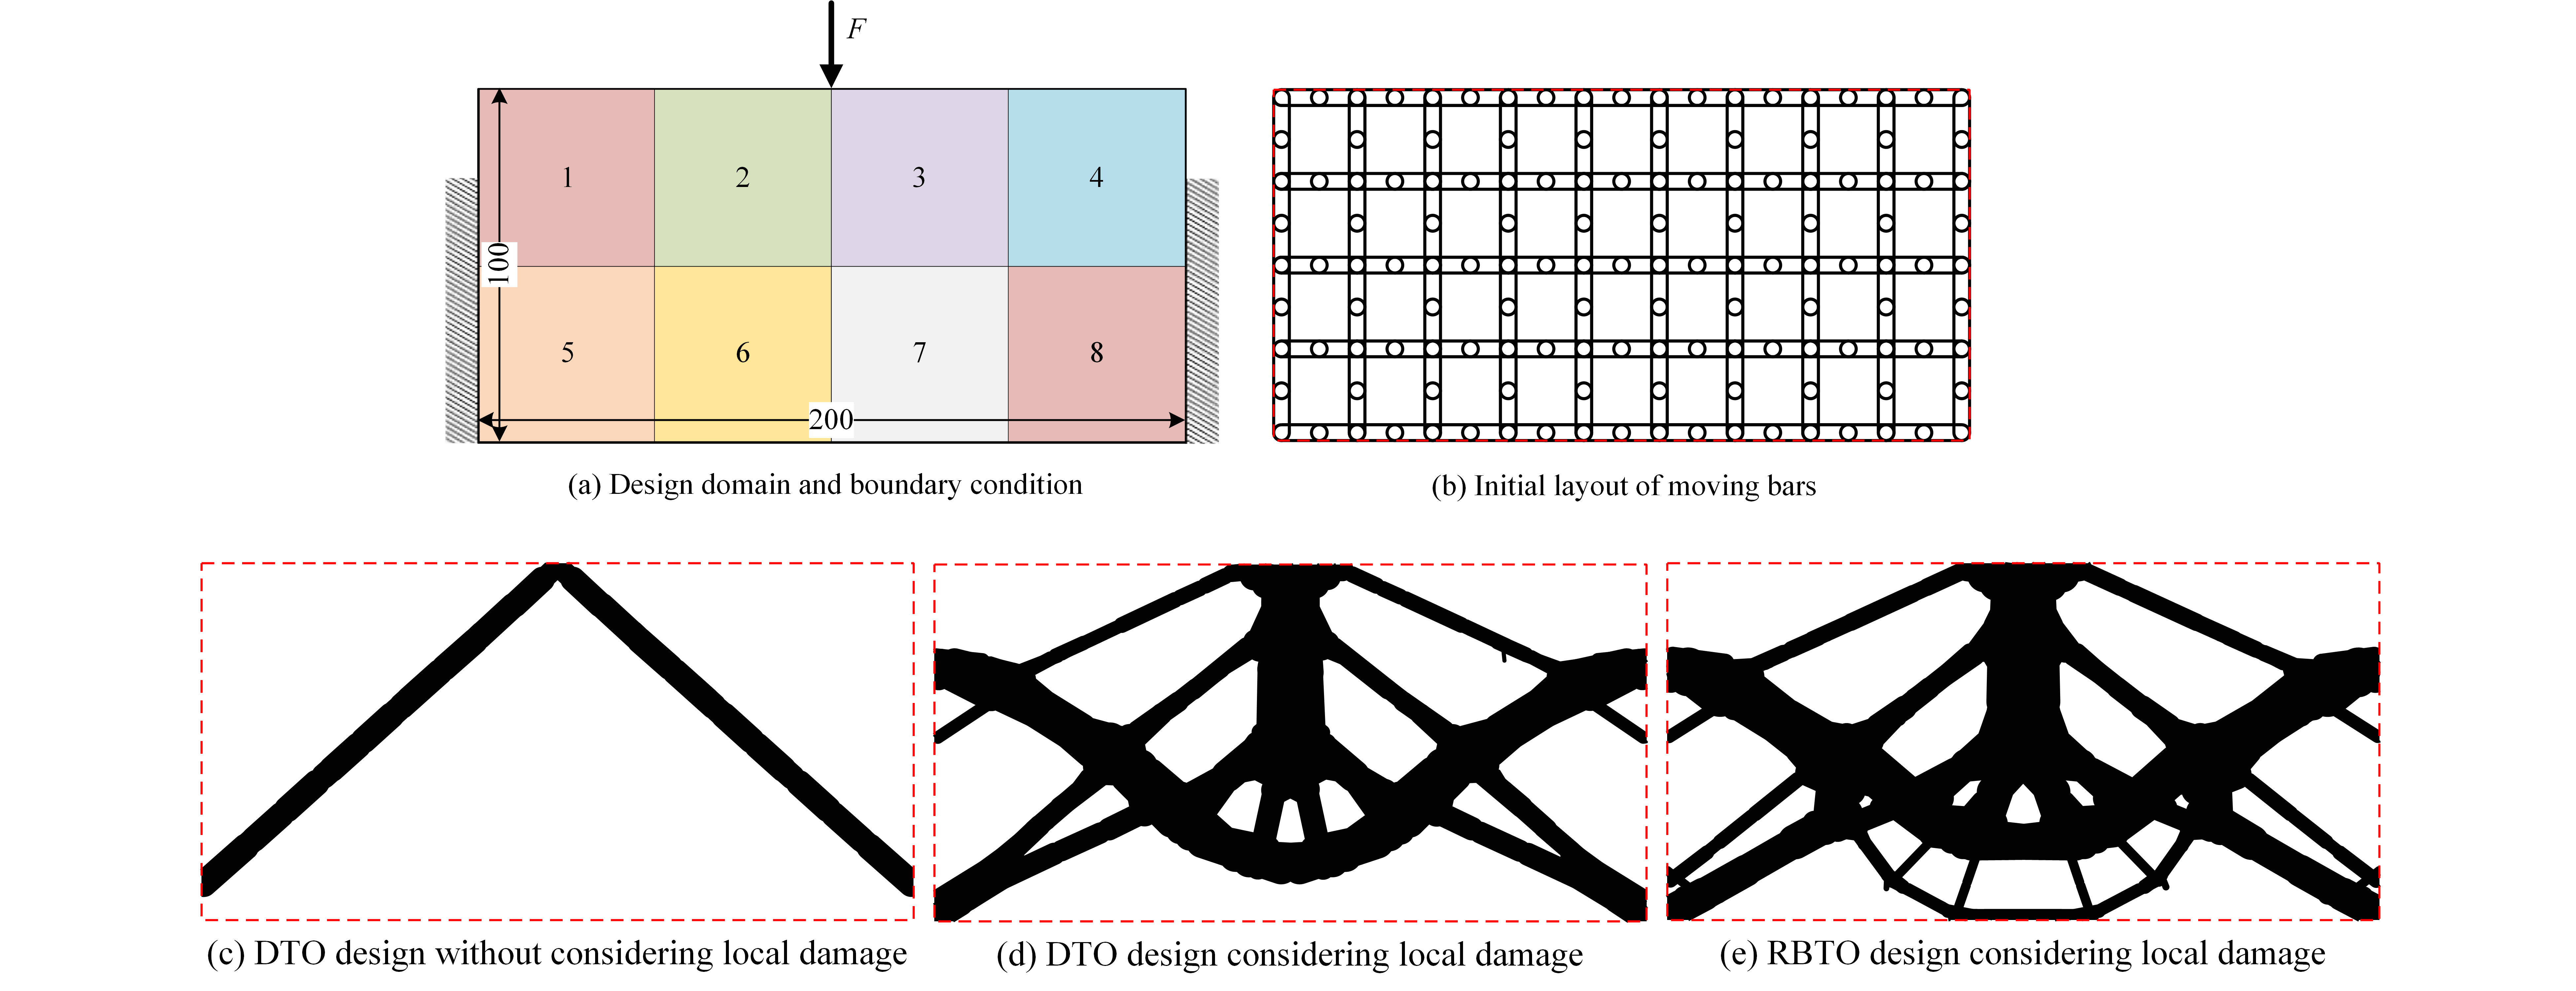
First, a design problem of clamped beam is tested. Fig. 4a depicts the design domain with dimensions of

Figure 4: Clamped beam problem: (a) design domain and boundary condition, (b) initial layout of 208 bars with thickness of
This problem is first designed for standard deterministic design without considering local damage, marked as Case 1. The final topology aims at minimizing the structure’s volume fraction with compliance constraint, as shown in Fig. 5a, where Young’s modulus is set as

Figure 5: Final topology results of clamped beam: (a) DTO design without considering local damage, (b) DTO design considering local damage, (c) RBTO design considering local damage

Figure 6: Damaged models with final fail-safe topology for DTO design

Figure 7: Damaged models with final fail-safe topology for RBTO design
When comparing Fig. 5a with Figs. 5b and 5c, a significant topological difference can be observed between the standard design (Fig. 5a) and fail-safe designs (Figs. 5b and 5c). Compared with standard design, more load path redundancy occurs in fail-safe designs. Similarly, more redundancy joints and smaller features can be observed in RBTO design considering local damage compared to DTO design considering local damage. The topological differences between these three cases emphasize the necessity and importance of integrating fail-safe concept and reliability analysis under material uncertainty into TO.
In Table 1 the volume fractions of the DTO designs and RBTO design for clamped beam are listed, as well as the compliances for all eight damage instances. The values of compliance in three different cases are calculated based on the final topology shown in Fig. 5. For example, the eight compliance values of Case 1 are for the DTO design (in Fig. 5a) under eight damage states. The difference between Case 3a and Case 3b is that the compliance values for Case 3a are calculated based on the most probable failure point of the random variable (namely, the value of Young’s modulus included in the calculation in this case is
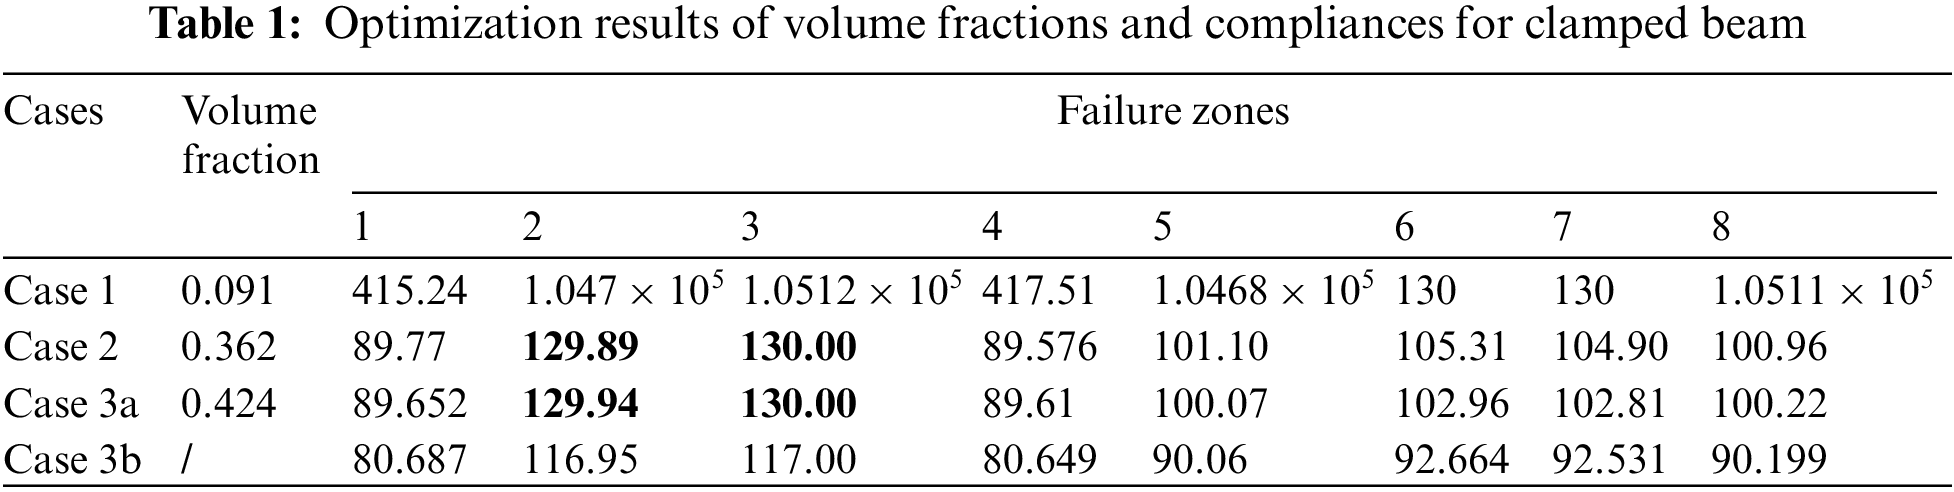
Table 1 shows that the relative volume fractions are 0.091 for Case 1, 0.362 for Case 2, and 0.424 for Case 3, respectively. The final compliance values (or compliance of the worst failure cases) satisfy the constraint threshold of 130 well for three different cases. For DTO design without considering fail-safe requirement in Case 1 (Fig. 5a), once the materials in failure zones of the final design are removed, the corresponding compliance values far exceed the constraint threshold of 130, except for the 6th and 7th failure zones. There is no doubt that this DTO design will be extremely sensitive to local failure of material in the 1st–5th and 8th failure zones due to its lack of redundancy. At this point, the structure may fail when the material in these zones is removed resulting from a partial collapse. For fail-safe designs in Case 2 (Fig. 5b) and Case 3a (Fig. 5c), the compliances for all eight failure modes are all less than or equal to the constraint threshold of 130. This can be easily understood as we constrain the compliance value of the worst failure cases. From another point of view, it is proved that increasing structure redundancy is conducive to improving the resistance of the structure to local failure. Fail-safe designs can maintain certain service performance even if the local material is removed or the local stiffness is lost, which can be clearly seen from Figs. 6 and 7. Besides, we can find that the 2nd and 3rd failure zones are the core areas of fail-safe designs in Figs. 5b and 5c, which can be seen as the worst failure cases in this example. Because the compliance values (the numbers in bold type in Table 1) corresponding to the 2nd and 3rd patch removal scenarios directly approximate the constraint threshold of 130. In Case 3b the compliance values for RBTO design considering local damage are less than that of DTO design for all eight failure modes. We can conclude that integrating reliability criterion into fail-safe design further increases the robustness of the designs towards local failure.
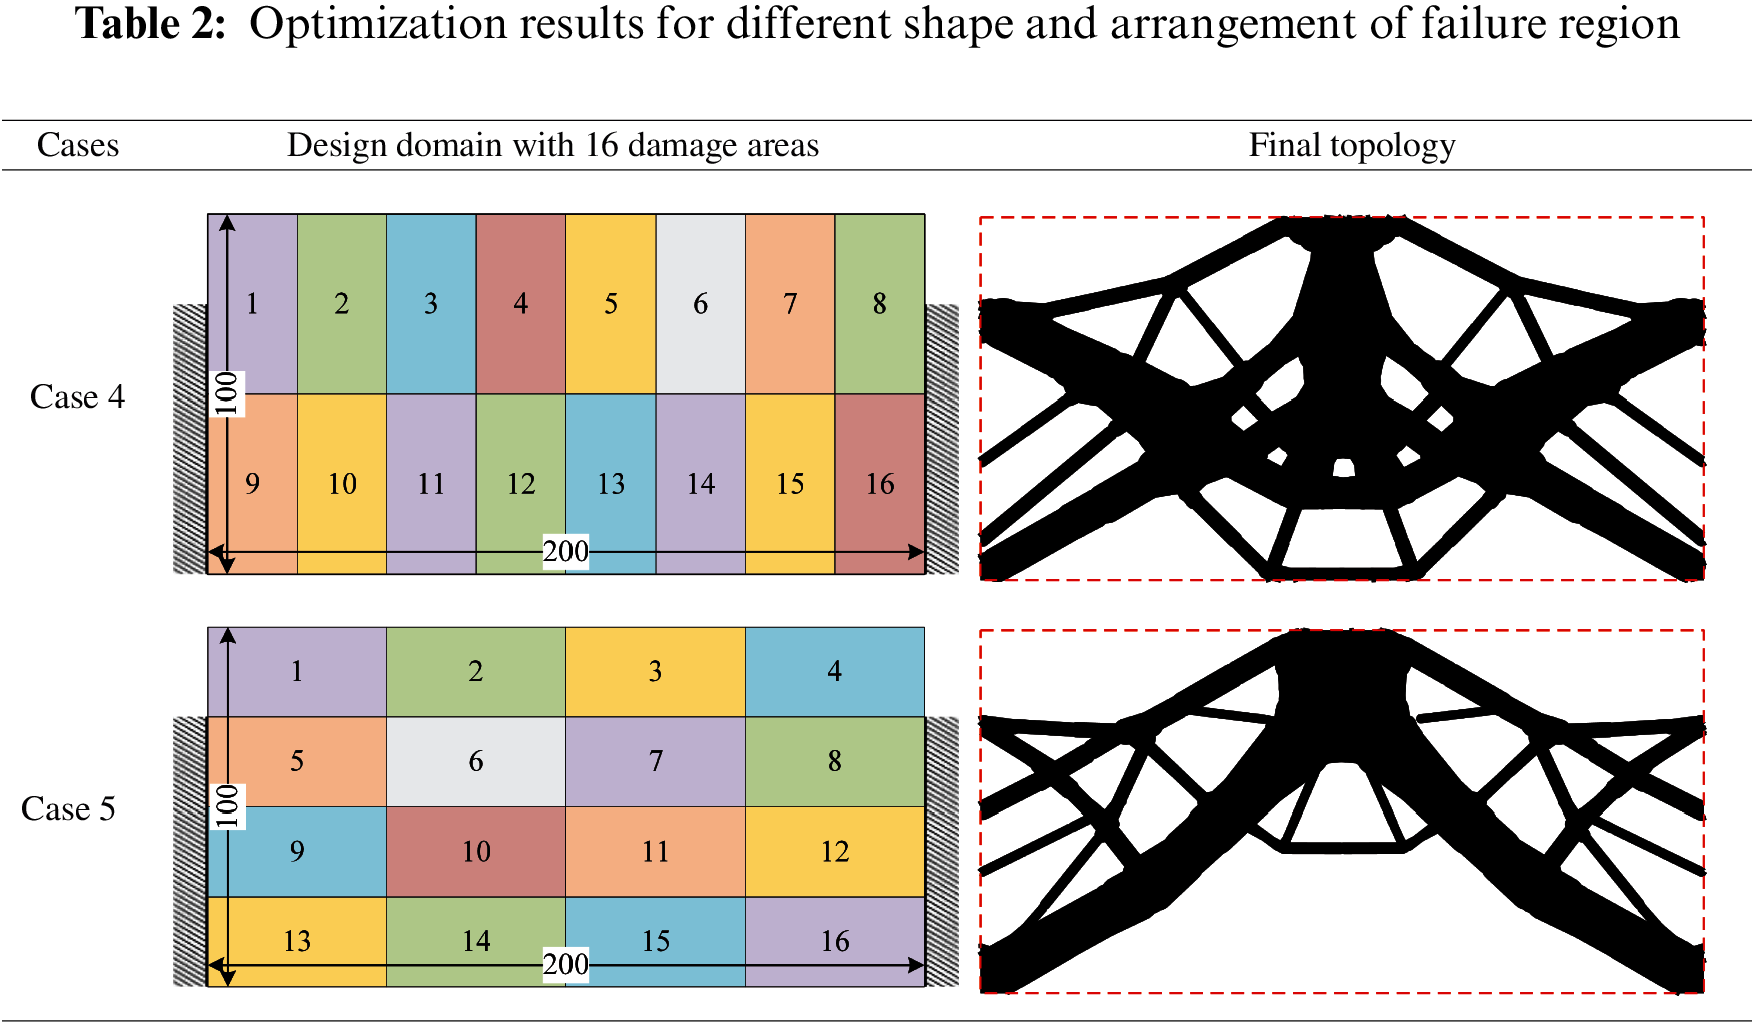
To show the influence of different shapes and arrangements of failure regions on the optimization results, we solve the above clamped beam example with 16 damage areas. The final topologies of RBTO designs considering local damage are depicted in Table 2. Significant topological differences can be observed for optimized structures with shapes and arrangements of failure regions, compared to the final topology in Fig. 5c. Therefore, we need to establish a relatively appropriate failure block model according to the possible failure area for practical problems.
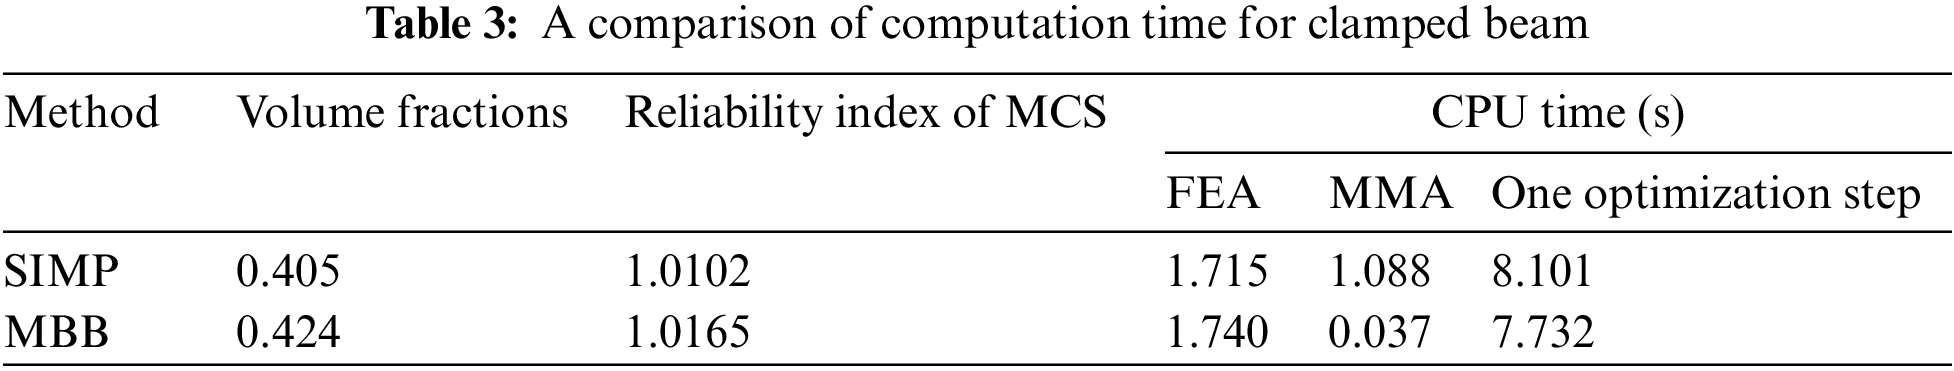
To show the superiority and computational effectiveness of the proposed method, we revisit the above clamped beam example considering
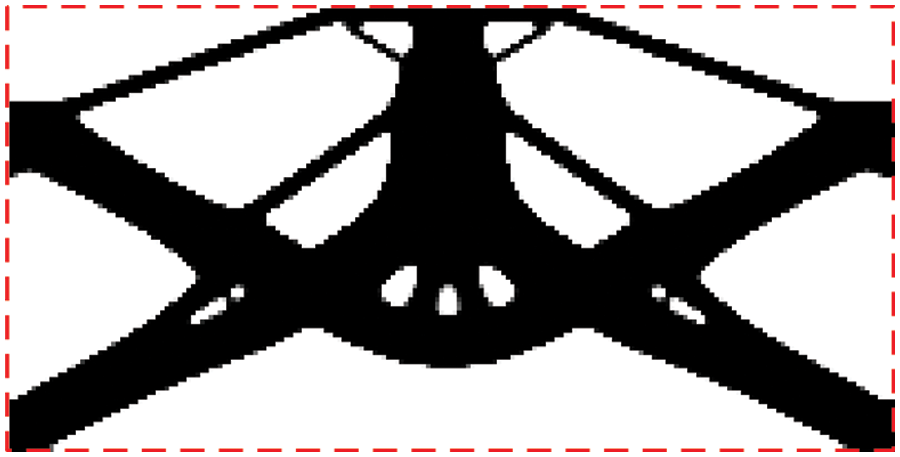
Figure 8: RBTO design considering local damage using the SIMP method
Second, the classical design problem of cantilever beam subjected to the bending force used in [3,4] is considered. Fig. 9 shows the design domain with dimensions of
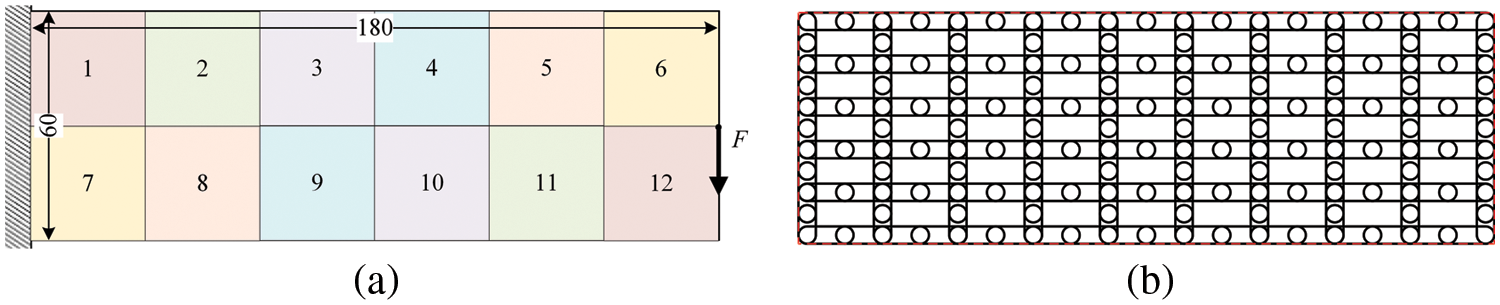
Figure 9: Cantilever beam problem: (a) design domain and boundary condition, (b) initial layout of 208 bars with thickness of
Fig. 10 investigates the effect of reliability indexes on the FSTO by setting

Figure 10: Optimization results of cantilever beam without minimum size control: RBTO designs in (a–c) and DTO design in (d)
In Table 4 the volume fraction and minimum size of the deterministic fail-safe design and reliability-based fail-safe designs for the cantilever beam are listed, as well as the compliances for the selected six failure modes. Due to the symmetry of the structure, only the 1th–6th failure modes are selected here. From Table 4, we can see that the volume fraction is 0.388 for deterministic fail-safe design in Fig. 10d, and 0.487, 0.554, 0.671 for reliability-based fail-safe designs with

Next, we revisit the fail-safe design problem of cantilever beam with a minimum length scale to demonstrate the advantages of using the MMB method for fail-safe designs. It should be stressed that imposing a minimum size control is easy to achieve by simply assigning a lower bound
Fig. 11 shows the resulting topologies for deterministic and reliability-based fail-safe designs with an imposing minimum length scale
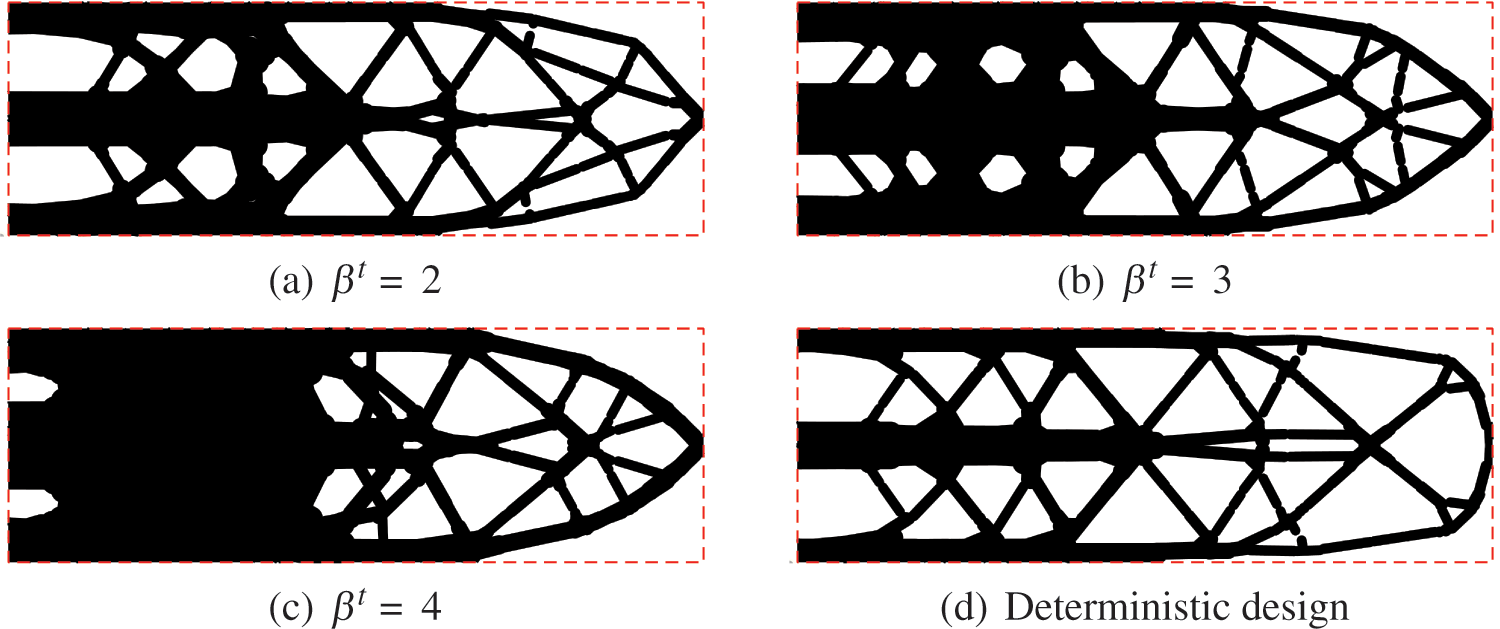
Figure 11: Optimization results of cantilever beam with minimum size control: RBTO designs in (a–c) and DTO design in (d)

Finally, an L-shaped beam problem sketched in Fig. 12a is tested. The initial layout of 232 MMBs of thickness

Figure 12: L-shaped beam problem: (a) design domain and boundary condition, (b) initial layout of 232 bars with thickness of
The results of the fail-safe design for RBTO with various reliability indexes and DTO are compared. A minimum size control is imposed by assigning a lower bound


Figure 13: RBTO designs for different target reliability indexes (a–c), and deterministic design (d)

Fig. 14 shows the iterative histories of volume fractions of the L-shaped beam. As anticipated, the convergence of volume fraction stability demonstrates the proposed method operated very well in RBTO of fail-safe structures under material uncertainty.
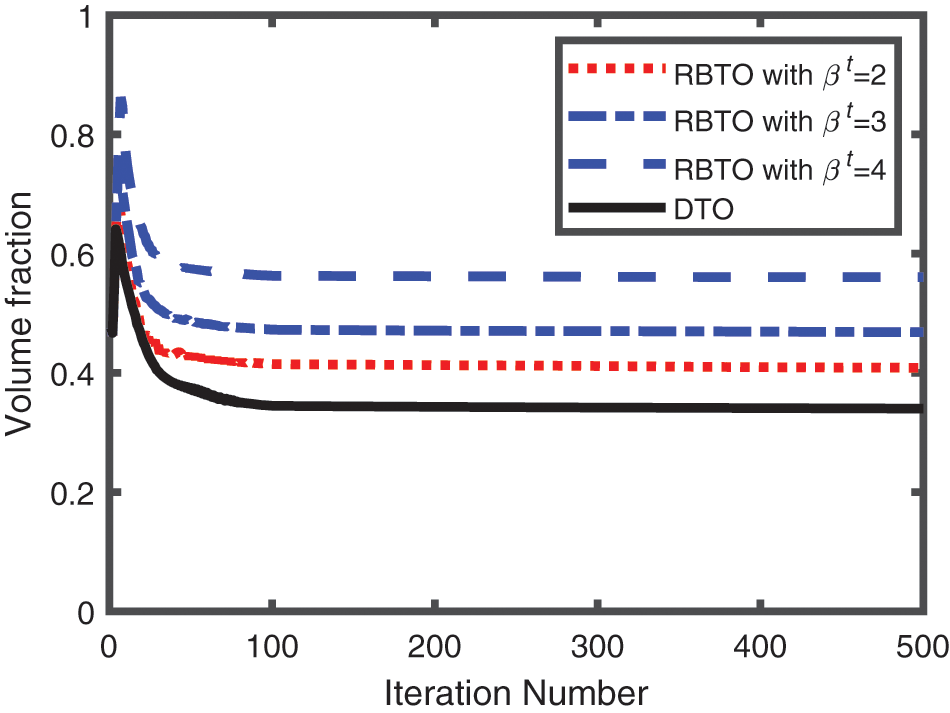
Figure 14: Iterative histories of volume fractions of L-shaped beam
The present method can also be extended to solve the optimization problem considering load uncertainty. We revisit the above L-shaped beam example considering the uncertainty of load magnitude, where the load is assumed as a normally distributed random variable with a mean of 1000 and a standard deviation of 50. The RBTO results for


Figure 15: RBTO designs for different target reliability indexes (a–c), and deterministic design (d)

This paper developed a reliable RBTO methodology for solving the design problem of fail-safe structures considering uncertainty based on the explicit moving morphable bars method, which integrates the PMA-based reliability analysis into the free-form design of fail-safe structures. A differentiable p-norm performance function with a correction parameter is introduced to ensure the compliance value of the worst failure case accurately meets the design requirement. Numerical examples emphasize the necessity and significance of incorporating reliability analysis under uncertainty into fail-safe systems and demonstrate that the reliability-based fail-safe designs are safer than the deterministic fail-safe design, and the incorporation of reliability criteria into the fail-safe design can further improve the designs’ resistance to local failure. In addition, the notable advantage of computational efficiency and realizing minimum constraint control using the MMB method to implement topology optimization is also well-reflected.
Acknowledgement: The authors are grateful to Prof. Krister Svanberg for providing the procedure of MMA algorithm.
Funding Statement: This work is supported by the National Natural Science Foundation of China (Grant No. 12172114), Natural Science Foundation of Anhui Province (Grant No. 2008085QA21), Fundamental Research Funds for the Central Universities (Grant No. JZ2022HGTB0291) and China Postdoctoral Science Foundation (Grant No. 2022M712358).
Conflicts of Interest: The authors declare that they have no conflicts of interest to report regarding the present study.
References
1. Sigmund, O., Maute, K. (2013). Topology optimization approaches. Structural and Multidisciplinary Optimization, 48(6), 1031–1055. https://doi.org/10.1007/s00158-013-0978-6 [Google Scholar] [CrossRef]
2. Xia, L., Xia, Q., Huang, X., Xie, Y. M. (2018). Bi-directional evolutionary structural optimization on advanced structures and materials: A comprehensive review. Archives of Computational Methods in Engineering, 25(2), 437–478. https://doi.org/10.1007/s11831-016-9203-2 [Google Scholar] [CrossRef]
3. Jansen, M., Lombaert, G., Schevenels, M., Sigmund, O. (2014). Topology optimization of fail-safe structures using a simplified local damage model. Structural and Multidisciplinary Optimization, 49(4), 657–666. https://doi.org/10.1007/s00158-013-1001-y [Google Scholar] [CrossRef]
4. Zhou, M., Fleury, R. (2016). Fail-safe topology optimization. Structural and Multidisciplinary Optimization, 54(5), 1225–1243. https://doi.org/10.1007/s00158-016-1507-1 [Google Scholar] [CrossRef]
5. Stolpe, M. (2019). Fail-safe truss topology optimization. Structural and Multidisciplinary Optimization, 60(4), 1605–1618. https://doi.org/10.1007/s00158-019-02295-7 [Google Scholar] [CrossRef]
6. Lüdeker, J. K., Kriegesmann, B. (2019). Fail-safe optimization of beam structures. Journal of Computational Design and Engineering, 6(3), 260–268. https://doi.org/10.1016/j.jcde.2019.01.004 [Google Scholar] [CrossRef]
7. Wang, H., Liu, J., Wen, G., Xie, Y. M. (2020). The robust fail-safe topological designs based on the von mises stress. Finite Elements in Analysis and Design, 171, 103376. https://doi.org/10.1016/j.finel.2019.103376 [Google Scholar] [CrossRef]
8. Du, J. Z., Meng, F. W., Guo, Y. H., Sui, Y. K. (2020). Fail-safe topology optimization of continuum structures with fundamental frequency constraints based on the ICM method. Acta Mechanica Sinica, 36(5), 1065–1077. https://doi.org/10.1007/s10409-020-00988-7 [Google Scholar] [CrossRef]
9. Du, J., Zhang, Y., Meng, F. (2021). Fail-safe topology optimization of continuum structures with multiple constraints based on icm method. Computer Modeling in Engineering & Sciences, 129(2), 661–687. https://doi.org/10.32604/cmes.2021.017580 [Google Scholar] [CrossRef]
10. Kranz, M., Lüdeker, J. K., Kriegesmann, B. (2021). An empirical study on stress-based fail-safe topology optimization and multiple load path design. Structural and Multidisciplinary Optimization, 64(4), 2113–2134. https://doi.org/10.1007/s00158-021-02969-1 [Google Scholar] [CrossRef]
11. Peng, X., Sui, Y. (2021). Lightweight topology optimization with consideration of the fail-safe design principle for continuum structures. Engineering Optimization, 53(1), 32–48. https://doi.org/10.1080/0305215X.2019.1697247 [Google Scholar] [CrossRef]
12. Hederberg, H., Thore, C. J. (2021). Topology optimization for fail-safe designs using moving morphable components as a representation of damage. Structural and Multidisciplinary Optimization, 64(4), 2307–2321. https://doi.org/10.1007/s00158-021-02984-2 [Google Scholar] [CrossRef]
13. Guo, X., Zhang, W. S., Zhong, W. L. (2014). Doing topology optimization explicitly and geometrically–A new moving morphable components based framework. Journal of Applied Mechanics, 81(8), 081009. https://doi.org/10.1115/1.4027609 [Google Scholar] [CrossRef]
14. Li, L., Liu, C., Zhang, W., Du, Z., Guo, X. (2021). Combined model-based topology optimization of stiffened plate structures via mmc approach. International Journal of Mechanical Sciences, 208, 106682. https://doi.org/10.1016/j.ijmecsci.2021.106682 [Google Scholar] [CrossRef]
15. Smith, H. A., Norato, J. A. (2021). Topology optimization of fail-safe structures via geometry projection. AIAA Scitech 2021 Forum. https://doi.org/10.2514/6.2021-2026 [Google Scholar] [CrossRef]
16. Dou, S., Stolpe, M. (2021). On stress-constrained fail-safe structural optimization considering partial damage. Structural and Multidisciplinary Optimization, 63(2), 929–933. https://doi.org/10.1007/s00158-020-02782-2 [Google Scholar] [CrossRef]
17. Dou, S., Stolpe, M. (2022). Fail-safe optimization of tubular frame structures under stress and eigenfrequency requirements. Computers & Structures, 258, 106684. https://doi.org/10.1016/j.compstruc.2021.106684 [Google Scholar] [CrossRef]
18. Wu, J., Aage, N., Westermann, R., Sigmund, O. (2017). Infill optimization for additive manufacturing-approaching bone-like porous structures. IEEE Transactions on Visualization and Computer Graphics, 24(2), 1127–1140. https://doi.org/10.1109/TVCG.2945 [Google Scholar] [CrossRef]
19. Dou, S. (2020). A projection approach for topology optimization of porous structures through implicit local volume control. Structural and Multidisciplinary Optimization, 62(2), 835–850. https://doi.org/10.1007/s00158-020-02539-x [Google Scholar] [CrossRef]
20. Martínez-Frutos, J., Ortigosa, R. (2021). Risk-averse approach for topology optimization of fail-safe structures using the level-set method. Computational Mechanics, 68(5), 1039–1061. https://doi.org/10.1007/s00466-021-02058-6 [Google Scholar] [CrossRef]
21. Li, X., Zhao, Q., Zhang, H., Zhang, T., Chen, J. (2021). Robust topology optimization of periodic multi-material functionally graded structures under loading uncertainties. Computer Modeling in Engineering & Sciences, 127(2), 683–704. https://doi.org/10.32604/cmes.2021.015685 [Google Scholar] [CrossRef]
22. Zhang, X., Takezawa, A., Kang, Z. (2019). Robust topology optimization of vibrating structures considering random diffuse regions via a phase-field method. Computer Methods in Applied Mechanics and Engineering, 344, 766–797. https://doi.org/10.1016/j.cma.2018.09.022 [Google Scholar] [CrossRef]
23. Meng, Z., Wu, Y., Wang, X., Ren, S., Yu, B. (2021). Robust topology optimization methodology for continuum structures under probabilistic and fuzzy uncertainties. International Journal for Numerical Methods in Engineering, 122(8), 2095–2111. https://doi.org/10.1002/nme.6616 [Google Scholar] [CrossRef]
24. Kharmanda, G., Olhoff, N., Mohamed, A., Lemaire, M. (2004). Reliability-based topology optimization. Structural & Multidisciplinary Optimization, 26(5), 295–307. https://doi.org/10.1007/s00158-003-0322-7 [Google Scholar] [CrossRef]
25. Luo, Y., Li, A., Kang, Z. (2011). Reliability-based design optimization of adhesive bonded steel–concrete composite beams with probabilistic and non-probabilistic uncertainties. Engineering Structures, 33(7), 2110–2119. https://doi.org/10.1016/j.engstruct.2011.02.040 [Google Scholar] [CrossRef]
26. Jung, H. S., Cho, S. (2005). Reliability-based topology optimization of geometrically nonlinear structures with loading and material uncertainties. Finite Elements in Analysis & Design, 41(3), 311–331. https://doi.org/10.1016/j.finel.2004.06.002 [Google Scholar] [CrossRef]
27. Habashneh, M., Rad, M. M. (2022). Reliability based geometrically nonlinear bi-directional evolutionary structural optimization of elasto-plastic material. Scientific Reports, 12(5989), 311–331. https://doi.org/10.1038/s41598-022-09612-z [Google Scholar] [PubMed] [CrossRef]
28. Wang, L., Liu, Y., Li, M. (2022). Time-dependent reliability-based optimization for structural-topological configuration design under convex-bounded uncertain modeling. Reliability Engineering & System Safety, 221, 108361. https://doi.org/10.1016/j.ress.2022.108361 [Google Scholar] [CrossRef]
29. Wang, L., Liu, Y., Wang, X., Qiu, Z. (2022). Convexity-oriented reliability-based topology optimization (CRBTO) in the time domain using the equivalent static loads method. Aerospace Science and Technology, 123, 107490. https://doi.org/10.1016/j.ast.2022.107490 [Google Scholar] [CrossRef]
30. da Silva, G. A., Beck, A. T. (2018). Reliability-based topology optimization of continuum structures subject to local stress constraints. Structural and Multidisciplinary Optimization, 57, 2339–2355. https://doi.org/10.1007/s00158-017-1865-3 [Google Scholar] [CrossRef]
31. Meng, Z., Guo, L., Yldz, A. R., Wang, X. (2022). Mixed reliability-oriented topology optimization for thermo-mechanical structures with multi-source uncertainties. Engineering with Computers. https://doi.org/10.1007/s00366-022-01662-1 [Google Scholar] [CrossRef]
32. Wang, L., Ni, B., Wang, X., Li, Z. (2021). Reliability-based topology optimization for heterogeneous composite structures under interval and convex mixed uncertainties. Applied Mathematical Modelling, 99, 628–652. https://doi.org/10.1016/j.apm.2021.06.014 [Google Scholar] [CrossRef]
33. Tu, J., Choi, K. K., Park, Y. H. (1999). A new study on reliability-based design optimization. Journal of Mechanical Design, 121(4), 557–564. https://doi.org/10.1115/1.2829499 [Google Scholar] [CrossRef]
34. Youn, B. D., Choi, K. K., Liu, D. (2005). Enriched performance measure approach for reliability-based design optimization. AIAA Journal, 43(4). https://doi.org/10.2514/1.6648 [Google Scholar] [CrossRef]
35. Meng, Z., Pang, Y., Pu, Y., Wang, X. (2020). New hybrid reliability-based topology optimization method combining fuzzy and probabilistic models for handling epistemic and aleatory uncertainties. Computer Methods in Applied Mechanics and Engineering, 363, 112886. https://doi.org/10.1016/j.cma.2020.112886 [Google Scholar] [CrossRef]
36. Long, K., Wang, X., Du, Y. (2019). Robust topology optimization formulation including local failure and load uncertainty using sequential quadratic programming. International Journal of Mechanics and Materials in Design, 15(2), 317–332. https://doi.org/10.1007/s10999-018-9411-z [Google Scholar] [CrossRef]
37. Martínez-Frutos, J., Ortigosa, R. (2021). Robust topology optimization of continuum structures under uncertain partial collapses. Computers & Structures, 257, 106677. https://doi.org/10.1016/j.compstruc.2021.106677 [Google Scholar] [CrossRef]
38. Cid, C., Baldomir, A., Hernández, S. (2020). Probability-damage approach for fail-safe design optimization (PDFSO). Structural and Multidisciplinary Optimization, 62(6), 3149–3163. https://doi.org/10.1016/10.1007/s00158-020-02660-x [Google Scholar] [CrossRef]
39. Hoang, V. N., Jang, G. W. (2017). Topology optimization using moving morphable bars for versatile thickness control. Computer Methods in Applied Mechanics and Engineering, 317, 153–173. https://doi.org/10.1016/j.cma.2016.12.004 [Google Scholar] [CrossRef]
40. Wang, X., Long, K., Hoang, V. N., Hu, P. (2018). An explicit optimization model for integrated layout design of planar multi-component systems using moving morphable bars. Computer Methods in Applied Mechanics and Engineering, 342, 46–70. https://doi.org/10.1016/j.cma.2018.07.032 [Google Scholar] [CrossRef]
41. Hoang, V. N., Nguyen, N. L., Nguyen-Xuan, H. (2020). Topology optimization of coated structure using moving morphable sandwich bars. Structural and Multidisciplinary Optimization, 61(2), 491–506. https://doi.org/10.1007/s00158-019-02370-z [Google Scholar] [CrossRef]
42. Saxena, A. (2011). Topology design with negative masks using gradient search. Structural and Multidisciplinary Optimization, 44(5), 629–649. https://doi.org/10.1007/s00158-011-0649-4 [Google Scholar] [CrossRef]
43. Wang, F., Jensen, J. S., Sigmund, O. (2012). High-performance slow light photonic crystal waveguides with topology optimized or circular-hole based material layouts. Photonics and Nanostructures-Fundamentals and Applications, 10(4), 378–388. https://doi.org/10.1016/j.photonics.2012.04.004 [Google Scholar] [CrossRef]
44. Wang, X., Meng, Z., Yang, B., Cheng, C., Long, K. et al. (2022). Reliability-based design optimization of material orientation and structural topology of fiber-reinforced composite structures under load uncertainty. Composite Structures, 291, 115537. https://doi.org/10.1016/j.compstruct.2022.115537 [Google Scholar] [CrossRef]
45. Luo, Y., Zhou, M., Wang, M. Y., Deng, Z. (2014). Reliability based topology optimization for continuum structures with local failure constraints. Computers & Structures, 143, 73–84. https://doi.org/10.1016/j.compstruc.2014.07.009 [Google Scholar] [CrossRef]
46. Maute, K., Frangopol, D. M. (2003). Reliability-based design of mems mechanisms by topology optimization. Computers & Structures, 81(8–11), 813–824. https://doi.org/10.1016/S0045-7949(03)00008-7 [Google Scholar] [CrossRef]
47. Meng, Z., Guo, L., Wang, X. (2022). A general fidelity transformation framework for reliability-based design optimization with arbitrary precision. Structural and Multidisciplinary Optimization, 65(1), 1–16. https://doi.org/10.1007/s00158-021-03091-y [Google Scholar] [CrossRef]
48. Jung, Y., Cho, H., Lee, I. (2020). Intelligent initial point selection for mpp search in reliability-based design optimization. Structural and Multidisciplinary Optimization, 62(4), 1809–1820. https://doi.org/10.1007/s00158-020-02577-5 [Google Scholar] [CrossRef]
49. Svanberg, K. (1987). The method of moving asymptotes-a new method for structural optimization. International Journal for Numerical Methods in Engineering, 24(2), 359–373. https://doi.org/10.1002/(ISSN)1097-0207 [Google Scholar] [CrossRef]
50. Sigmund, O. (2001). A 99 line topology optimization code written in matlab. Structural and Multidisciplinary Optimization, 21(2), 120–127. https://doi.org/10.1007/s001580050176 [Google Scholar] [CrossRef]
Cite This Article
 Copyright © 2023 The Author(s). Published by Tech Science Press.
This work is licensed under a Creative Commons Attribution 4.0 International License , which permits unrestricted use, distribution, and reproduction in any medium, provided the original work is properly cited.
 Downloads
 Citation Tools