
 Submit a Paper
 Propose a Special lssue
 Open Access
ARTICLE

Cross-Domain TSK Fuzzy System Based on Semi-Supervised Learning for Epilepsy Classification
1
School of Internet of Things, Wuxi Institute of Technology, Wuxi, 214121, China
2
School of Artificial Intelligence and Computer Science, Jiangnan University, Wuxi, 214122, China
3
School of Computer Science and Artificial Intelligence, Changzhou University, Changzhou, 213164, China
* Corresponding Author: Pengjiang Qian. Email:
Computer Modeling in Engineering & Sciences 2023, 137(2), 1613-1633. https://doi.org/10.32604/cmes.2023.027708
Received 10 November 2022; Accepted 07 March 2023; Issue published 26 June 2023
 View Full Text
 Download PDF
Abstract
Through semi-supervised learning and knowledge inheritance, a novel Takagi-Sugeno-Kang (TSK) fuzzy system framework is proposed for epilepsy data classification in this study. The new method is based on the maximum mean discrepancy (MMD) method and TSK fuzzy system, as a basic model for the classification of epilepsy data. First, for medical data, the interpretability of TSK fuzzy systems can ensure that the prediction results are traceable and safe. Second, in view of the deviation in the data distribution between the real source domain and the target domain, MMD is used to measure the distance between dierent data distributions. The objective function is constructed according to the MMD distance, and the distribution distance of dierent datasets is minimized to find the similar characteristics of dierent datasets. We introduce semi-supervised learning to further explore the relationship between data. Based on the MMD method, a semi-supervised learning (SSL)-MMD method is constructed by using pseudo-tags to realize the data distribution alignment of the same category. In addition, the idea of knowledge dissemination is used to learn pseudo-tags as additional data features. Finally, for epilepsy classification, the cross-domain TSK fuzzy system uses the cross-entropy function as the objective function and adopts the back-propagation strategy to optimize the parameters. The experimental results show that the new method can process complex epilepsy data and identify whether patients have epilepsy.Keywords
Epilepsy is a disease caused by the abnormal discharge of neurons and can cause brain dysfunction. Electroencephalogram (EEG) detection is an effective way to identify epilepsy. At present, traditional EEG signal analysis is mostly completed by human experts according to their experience and is evaluated by means of the amplitude, frequency, and transient distribution of EEG. With the development of machine learning and the introduction of time-domain and frequency-domain analysis into EEG signal processing methods, machines have gradually become smart tools that can assist doctors in diagnosing epilepsy [1,2].
For original EEG signals, due to a large amount of data and the changeable characteristics, it is unrealistic to directly use machine learning methods to identify them. Therefore, it is necessary to use feature extraction methods to extract effective features for machine learning. In this regard, short-time Fourier transform (STFT), wavelet packet decomposition (WPD), and kernel principal component analysis (KPCA) are commonly used. Fuzzy systems refer to a category of inference models that use fuzzy rules and offer interpretability. The membership function of fuzzy systems can match linguistic variables, and each process of data transmission in these models can be depicted by artificially designated linguistic variables. Such a white box model meets the interpretability requirement in the field of medicine well. Consequently, we use the Takagi-Sugeno-Kang (TSK) fuzzy system as a basis to design our model in this study [3,4]. TSK fuzzy systems usually optimize parameters via three pathways: 1) by the genetic algorithm, 2) by the least square method, and 3) by back propagation (BP)-based gradient descent. However, these methods have respective limitations. Genetic algorithms evaluate numerous candidate solutions for identifying the optimal solutions, which leads to high computing and memory costs [5]. The basic idea of the least squares method is to minimize the sum of squares between measured data and estimated data. However, when facing the classification problem, the label value is used as the estimation data, which cannot reflect its actual physical significance [6]. The back-propagation method can use cross-entropy and the Softmax function to reflect the probability that the data belong to a certain class, but the time complexity is high when dealing with large amounts of data; moreover, gradient disappearance may occur, which easily leads to inaccurate modelling results [7].
As deep learning has developed, its high-precision recognition rate makes deep learning attractive for epilepsy EEG detection, but because the process of deep learning is unexplainable, we proposed a back-propagation TSK fuzzy system. The backpropagation method can make a TSK fuzzy system more flexible because deep learning applies iterative training, so it provides the possibility of combining excellent deep learning algorithms with machine learning [8,9]. In addition, backpropagation can use cross-entropy, which is more suitable for classification tasks, as the loss function. This is the natural advantage of gradient descent TSK fuzzy systems compared with the first two solutions.
Two assumptions are made in traditional classification learning: 1) The learned training sample and the new test sample must satisfy independent and identical distributions. 2) There must be enough available training samples to learn a good classification model [10]. However, in practical applications, we find that these two conditions are often not met. In this study, we use a parameter-free method, called maximum mean discrepancy (MMD), to initially make the training data have the same distribution as the future testing data [11]. Then, the model learns and obtains the predicted value as a pseudolabel. The label information is used to further adjust the distribution. Thus, the model can meet the conditions of assumption 1. On this basis, we use pseudolabels as extended features to increase the data characterization information. To make the model satisfy the conditions of assumption 2, the dataset information is increased horizontally, the model learns effective features, and the model fully learns potential knowledge.
Our main contributions are as follows:
1) To reflect the probability distribution of the epilepsy EEG scenario, we firstly use the cross-entropy function as the loss function of the TSK fuzzy system to achieve parameter optimization.
2) A flexible back-propagation TSK fuzzy system is proposed to handle complex EEG data. The backpropagation method will make the TSK fuzzy system more flexible, because deep learning is also iterative training, so it provides the possibility of combining excellent algorithms in deep learning in future work.
3) Combining the concept of semi-supervised learning, a cross-domain TSK fuzzy system is proposed, and the ability of the TSK fuzzy system is optimized from the perspective of data characteristics and data distribution. It makes the proposed TSK model become a data-driven learning model.
The detailed chapters are arranged as follows: Section 2 introduces epilepsy signal data, the feature extraction method, the machine learning methods, and the back-propagation TSK fuzzy system. Section 3 explores the proposed SSL-BP-TSK fuzzy system. Section 4 presents the experiments on real-world epilepsy EEG signals. Section 6 is the conclusion.
EEG records electrical signals from the cerebral cortex by measuring the electrical activity of a group of neurons. Because the patterns of EEG signals are often superimposed by the electrical signals from various parts of the brain in the direction of the electrode connections, different from ECG waveforms, it is very difficult for EEG waveforms to distinguish PQRST waves directly in the time domain and locate the specific excited region. Therefore, the analysis of brain waves in the frequency domain is slightly more important. The basic structural features of the alpha, beta, theta, and delta waves, which are roughly divided according to their frequency, can be summarized as follows: alpha (8–13 Hz), beta (18–30 Hz), theta (4–7 Hz), and delta (1–3.5 Hz). These bands are closely related to human behaviour, please see Table 1.

Based on the structural features of the four waveforms in the table, we can quickly conclude that by using other feature extraction methods, such as the Fourier transform, we can derive the intensity of the EEG signal at different frequency components, and the existence of these waveforms and their intensity information are obtained.
A real-world epilepsy EEG signal [2] is shown in Fig. 1. Group A and Group B are the EEG signals of people without epilepsy with their eyes opened and closed, respectively. Group C and Group D are the EEG signals of patients with epilepsy (without seizures) when their eyes are opened and closed, respectively. Group E is the brain electrical signal of patients during epileptic seizures. From Fig. 1, it can be seen that the signals of Groups A and B are stable and dense, and the signals of Groups C, D and E have large amplitudes, and the intensity fluctuates from high to low, indicating that the neuron discharge is abnormal.
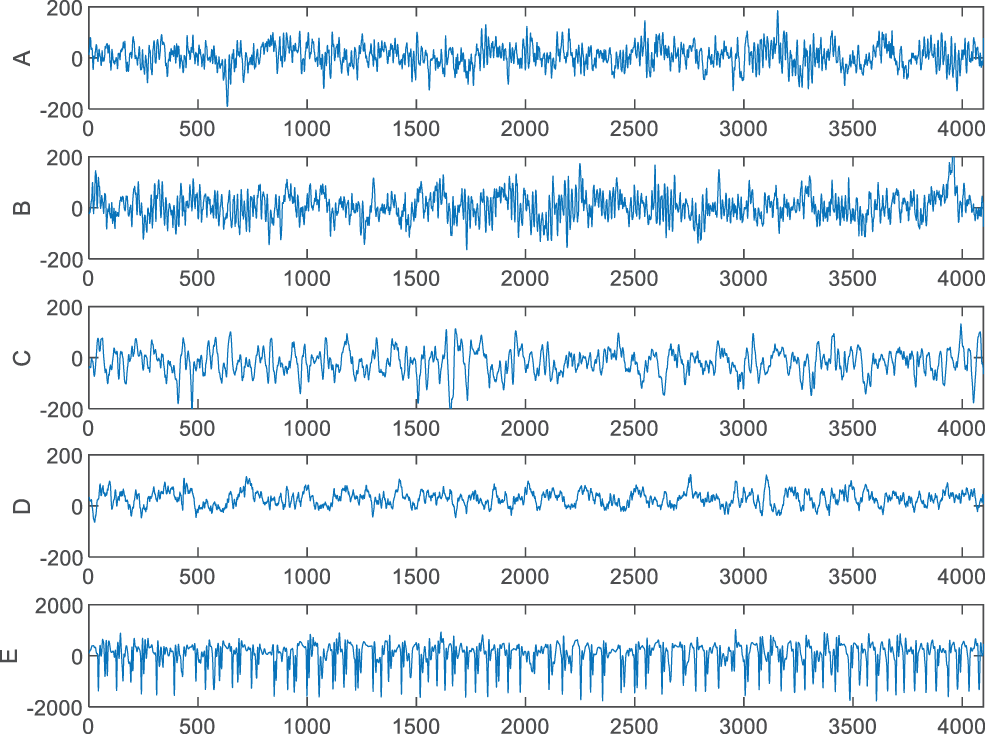
Figure 1: Raw epilepsy electroencephalogram
In addition to the differences in EEG signal waveforms of different subjects in different states, the EEG signals of subjects in a group are also different at different times. Therefore, we use the feature extraction method to extract artificial features of the signal to reduce the amount of data and noise data and facilitate model learning.
2.2 Extraction and Machine Learning Methods
As previously mentioned, on the original EEG signal, due to the large amount of data and changeable characteristics, effective feature extraction methods are needed to extract informative features for machine learning to reduce the computing cost. To this end, the traditional STFT, WPD and KPCA methods are enlisted in our study. Numerous traditional algorithms have been used for medical data analysis [12]. Nevertheless, one limitation of many well-established algorithms is that they can work well only when the data distributions of the training and testing data are the same or overall similar. Otherwise, they are commonly inefficient and even invalid. We briefly introduce three time-frequency methods commonly used in signal analysis [13]. 1) Wavelet packet decomposition (WPD). WPD is suitable for the analysis of nonstationary signals. It can be adapted according to the characteristics of the signal. The wavelet basis function can analyse signals well. 2) Short-time Fourier transform (STFT). Taking the STFT feature extraction method as an example, Fig. 2 shows an epilepsy EEG signal after the feature extraction method. The signal of each group is reduced from 1000 dimensions to 6 dimensions, which not only reduces the number of features but also makes the amplitude of the waveform more stable. Compared with Fig. 1, the amplitude decreases from −200∼200 to 0∼40. This greatly reduces the calculation cost. The reserved 6-dimensional features (especially the 6th dimension) have a unique signal structure, which is also conducive to machine learning. 3) Kernel principal component analysis (KPCA). This method introduces the concept of a kernel function into PCA.
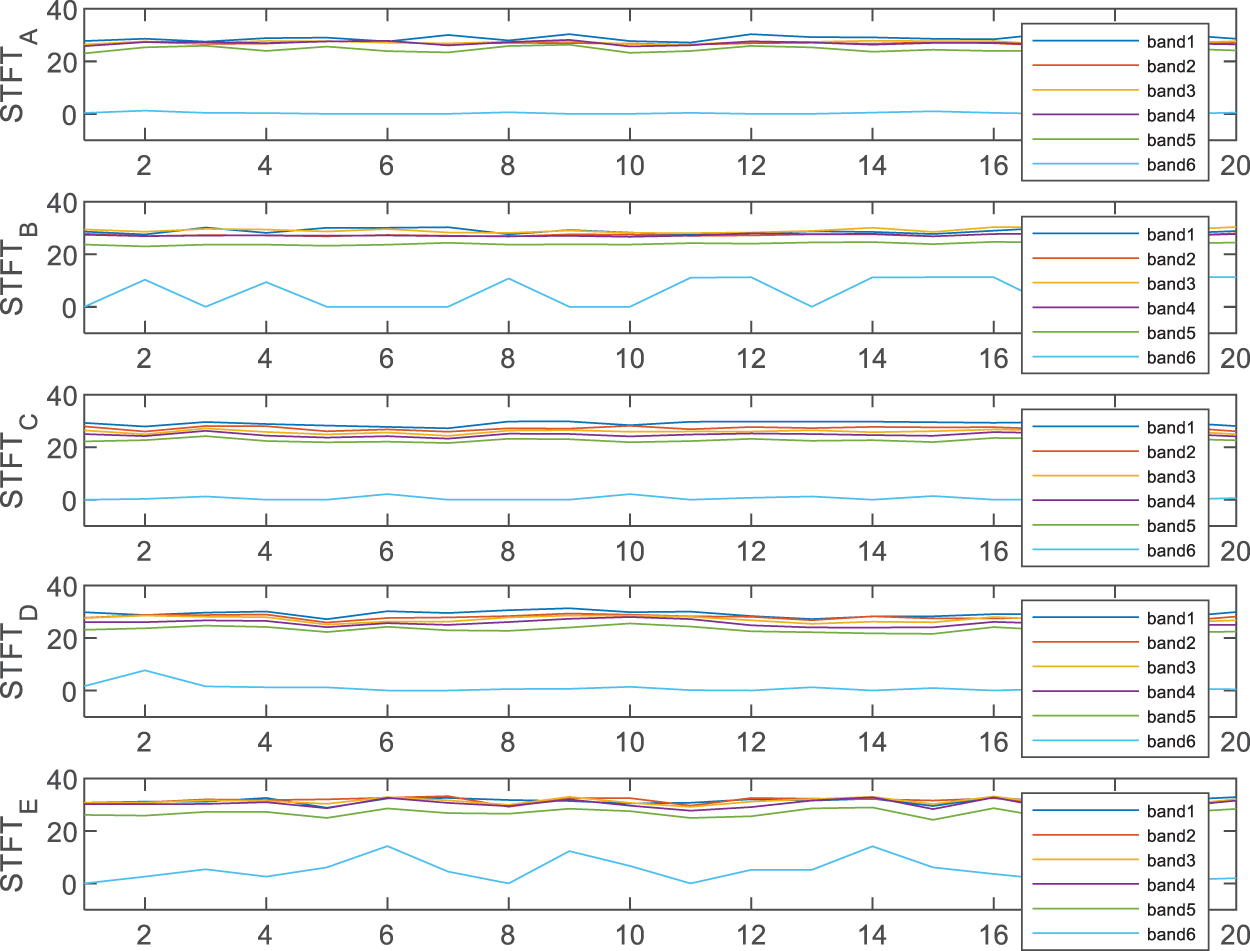
Figure 2: EEG data after STFT feature transformation
In the field of medicine, the interpretability of the employed machine learning models is indispensable. Doctors will not believe in the prediction results of machines unless they can well understand the inference mechanisms of machines. Compared with SVM, KNN, and NB, TSK fuzzy systems have the desired trait of good interpretability.
2.3 Maximum Mean Discrepancy Strategy
The maximum mean discrepancy (MMD) is a nonparametric method used to measure the distance between two distributions [14]. Here, we use MMD to measure the distribution difference between the training data (the source domain) and testing data (the target domain). Minimizing the MMD distance facilitates the two distributions being closer, so that the knowledge learned by the model is compatible with both the training and testing data [14].
Given source domain data
where
2.4 Back-Propagation TSK Fuzzy System
The rules in a back propagation TSK (BP-TSK) fuzzy system are equivalent to the neurons in neural networks. The network structure of the BP-TSK fuzzy system is also similar to that of a neural network, as shown in Fig. 3.
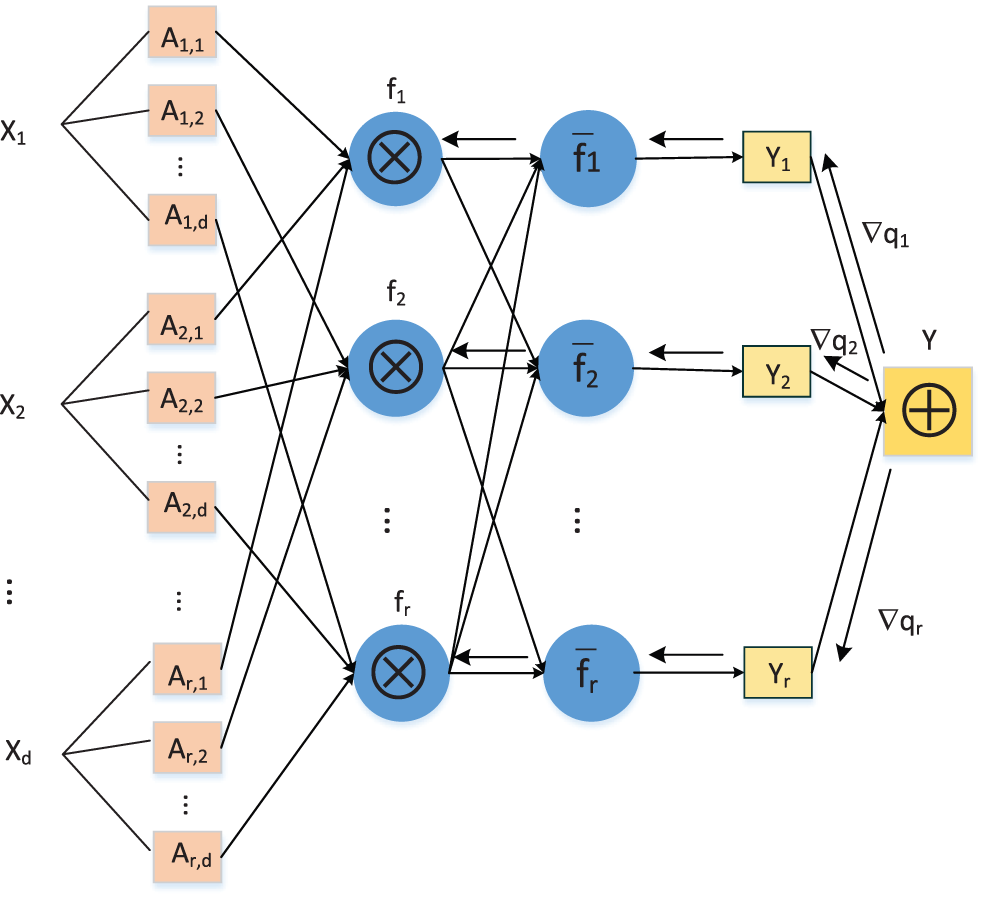
Figure 3: Structure of the BP-TSK fuzzy system.
Given training dataset
where
The output of the BP-TSK fuzzy system is the weighted results of each rule:
The membership degree of d-dimensional features in rule r is:
where
Trigger value of rule r:
where
The following formula is constructed according to [12]:
Then, (3.1) can be expressed as [15]:
For classification tasks, cross-entropy can be used to constitute the loss function of the BP-TSK fuzzy system through the Softmax function:
The objective function of the BP-TSK fuzzy system can be formulated for all attributes
where the former item is an empirical risk item and the latter is a structural risk item.
Minimizing the objective function L requires obtaining the partial derivative of
We can use the AdaBelief optimizer [15] or other optimization methods [16] to update the parameters and obtain the optimal parameters
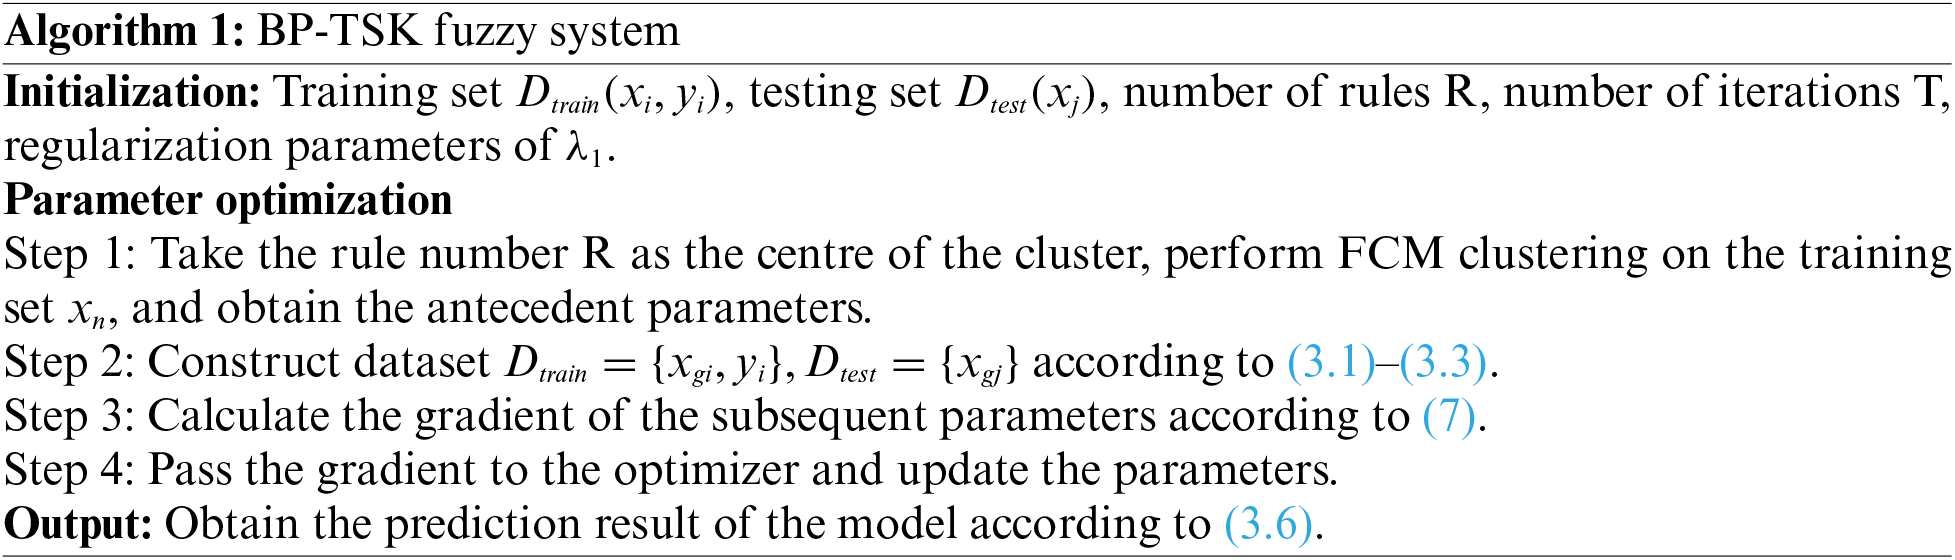
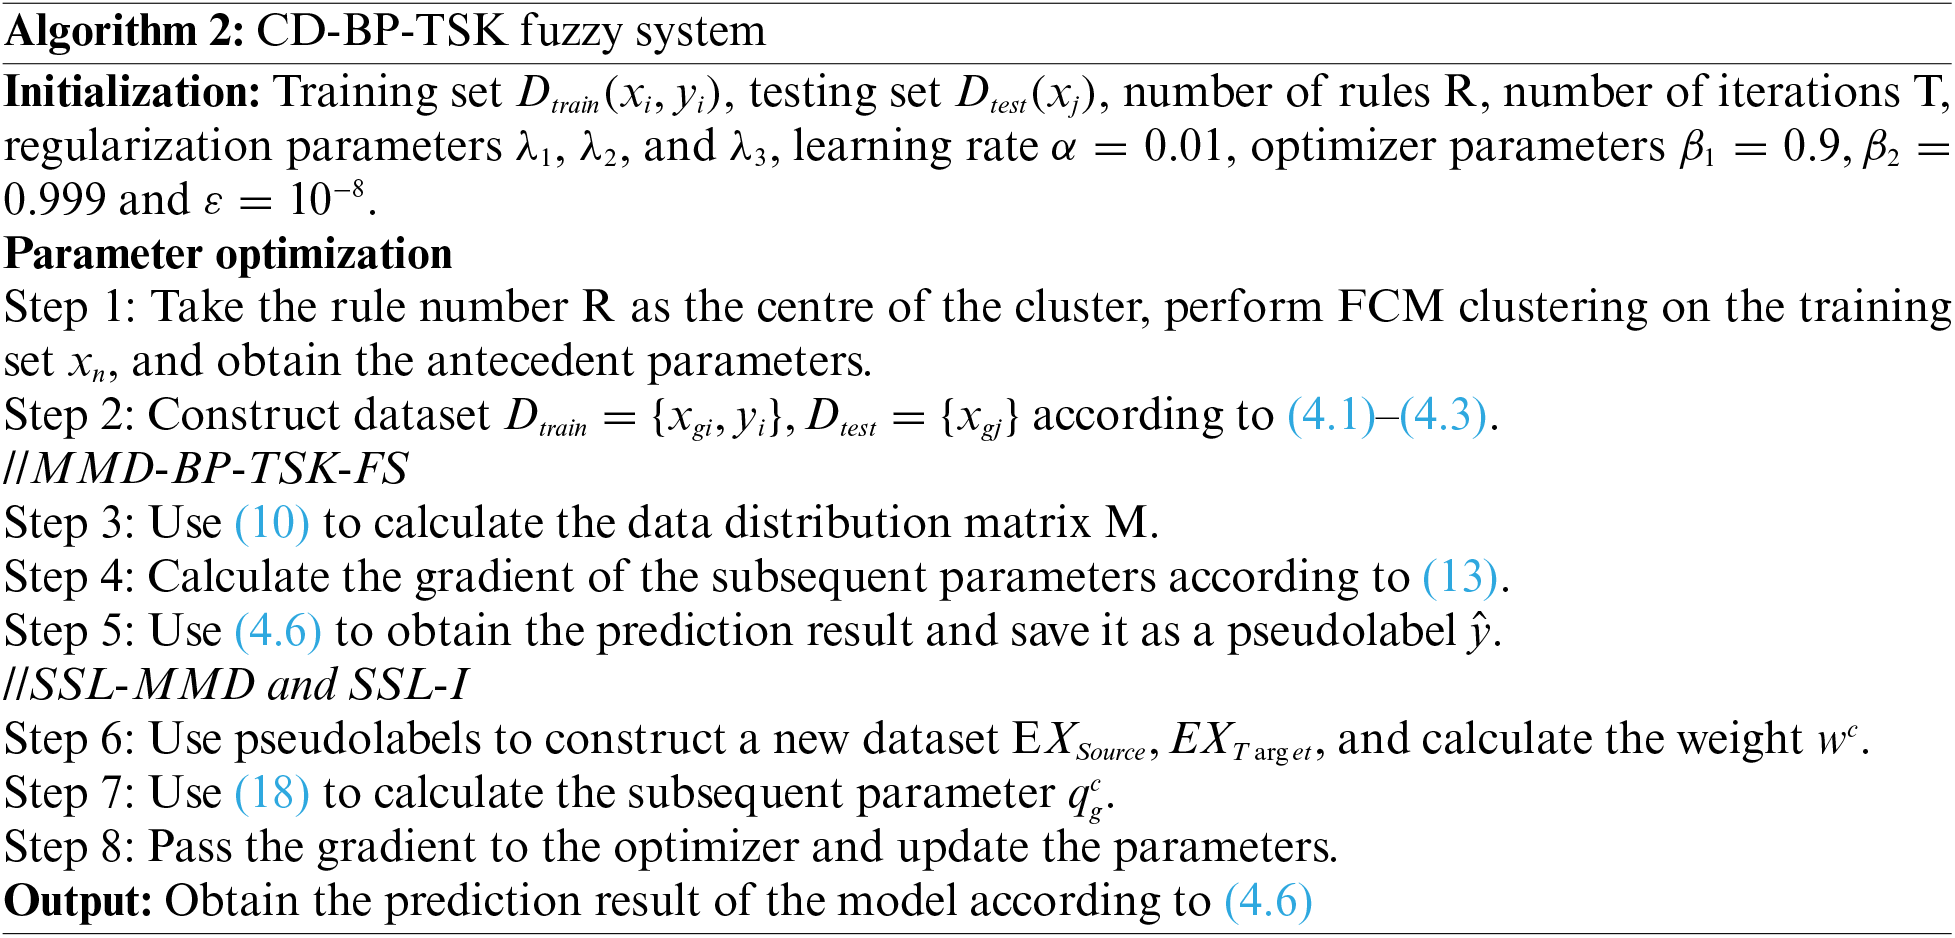
The algorithm of the BP-TSK fuzzy system is as follows:
This chapter introduces the MMD transfer learning items in the BP-TSK fuzzy system and adds two semi-supervised learning items on this basis. One is used to adjust the data distribution, and the other is used to expand the data characteristics.
3.1 MMD for the BP-TSK Fuzzy System
By introducing MMD into the TSK system, the distribution distance can be further defined as:
Let
Then, (9) can be rewritten as:
The objective function of TSK after adding the MMD item is:
The derivative corresponding to
3.2 SSL-MMD for BP-TSK Fuzzy Systems
The label information of the source domain and the target domain can provide more data distribution information, so many experts have begun to study domain adaptation.
After the BP-TSK fuzzy system is added to the MMD item, it can learn the similar characteristics of two-domain data, so the prediction result has a certain degree of reliability. Based on the MMD-BP-TSK fuzzy system, we save the prediction results as pseudolabels. Then, we use pseudolabels to make the data distributions of the two domains more similar according to categories so that the model can learn more refined knowledge features.
Fig. 4 shows the three steps of data distribution processing: a) the unprocessed initial data distribution, b) the data distribution after processing by the MMD method, and c) the data distribution after processing by the SSL-MMD method.

Figure 4: (a): Because the data distributions of the source and target domains are fairly different, the classifier trained in the source domain cannot predict the target domain data well. (b): MMD method narrows the overall gap between two data distributions. (c): SSL-MMD method uses label information to narrow the distribution of the same type of data
In Fig. 4a, when the model has learned the data with labels, it is difficult for the model to adjust its decision boundary when the distribution is different from the previous data distribution, that is, when there is a chaotic data distribution.
In Fig. 4b, we can see that the chaotic data distribution has been improved, and the model can find the appropriate decision boundary between the two domains.
In Fig. 4c, a pseudotag is added on the basis of Fig. 4b to guide the model to determine a more appropriate decision boundary.
The objective function of SSL-MMD is:
where
Let
Similarly, (14) can be rewritten as:
The objective function of SSL-MMD-BP-TSK is:
The derivative corresponding to
3.3 Semi-Supervised Inherited Learning
We use the idea of deep learning to try to transfer the knowledge learned in the previous round to the next round. Therefore, the concept of a semi-supervised inheritance (SSL-I) mechanism is introduced to increase the information interaction between different domains. Therefore, we proposed a TSK fuzzy system for cross-domain learning, which includes SSL-MMD and SSL-I mechanisms.
Unlike the SSL-MMD method, which reduces the difference in data distributions, the SSL-I method makes full use of pseudolabels to allow the model to learn additional feature representations. The SSL-I method merges the existing tags and pseudo tags with the source domain data and target domain data, respectively, to construct a new dataset.
Experiments show that pseudolabels can be used for effective feature representation, allowing the model to learn deeper knowledge.
Suppose a given dataset is
where
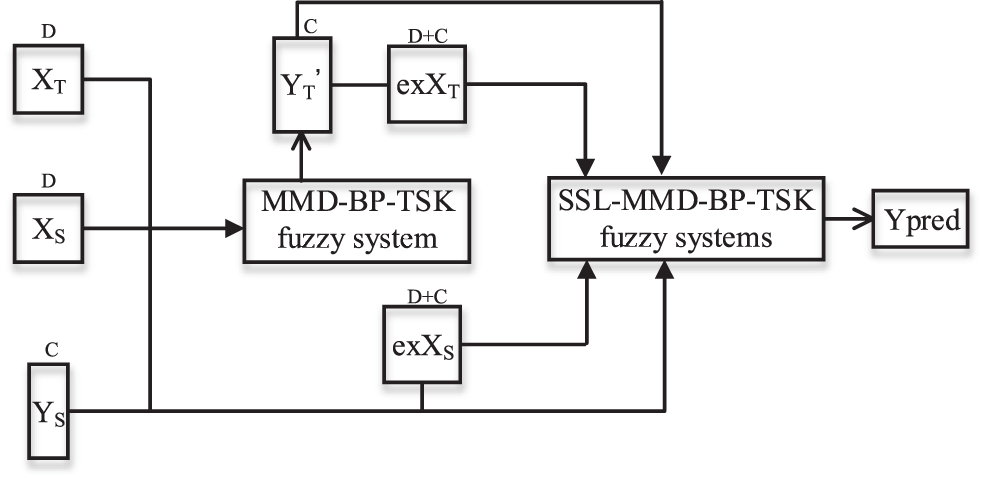
Figure 5: Structure of the CD-BP-TSK fuzzy system
The proposed new classification algorithm is summarized as follows:
In this section, we introduce the EEG datasets and perform performance tests. We compare the new method with other machine learning methods and observe whether the experimental results are significantly improved. Finally, the interpretability of the new model is discussed.
In this section, we build datasets in different scenarios to comprehensively test our methods. The experiment was completed in the following working environment: Processor: Intel(R) Core(TM) i5-8500 CPU@3.00 GHz; Memory: 12.0 GB; Software: MATLABR2021A.
1) Build the datasets
The datasets are divided into two categories. As shown in Table 2, one is a dataset with a similar data distribution, and the other is a dataset with a chaotic data distribution.

2) Performance index
In classification problems, accuracy is used to judge whether a model’s performance is excellent.
1) Comparison algorithm
We compared 6 traditional machine learning algorithms and 3 semi-supervised learning algorithms, as shown in Table 3.

Among the compared methods, traditional methods, such as SVM, NB, KNN, and LDA, are set according to [17,18], and the semi-supervised method, S4VM, is set according to [19]. The rule number R in the TSK fuzzy system is selected from {5, 6, 7, 8, 9, 10}, and the regularization parameter
2) Experimental results
The accuracies of each algorithm on the dataset after the three feature extraction methods are shown in Tables 4–6. Obviously, all methods can achieve good accuracy for datasets with similar distributions. However, the accuracies of the three semi-supervised learning methods are much higher than those of the other algorithms. Although all data in the dataset are taken from the same defined group, there is still a deviation in the data distribution.
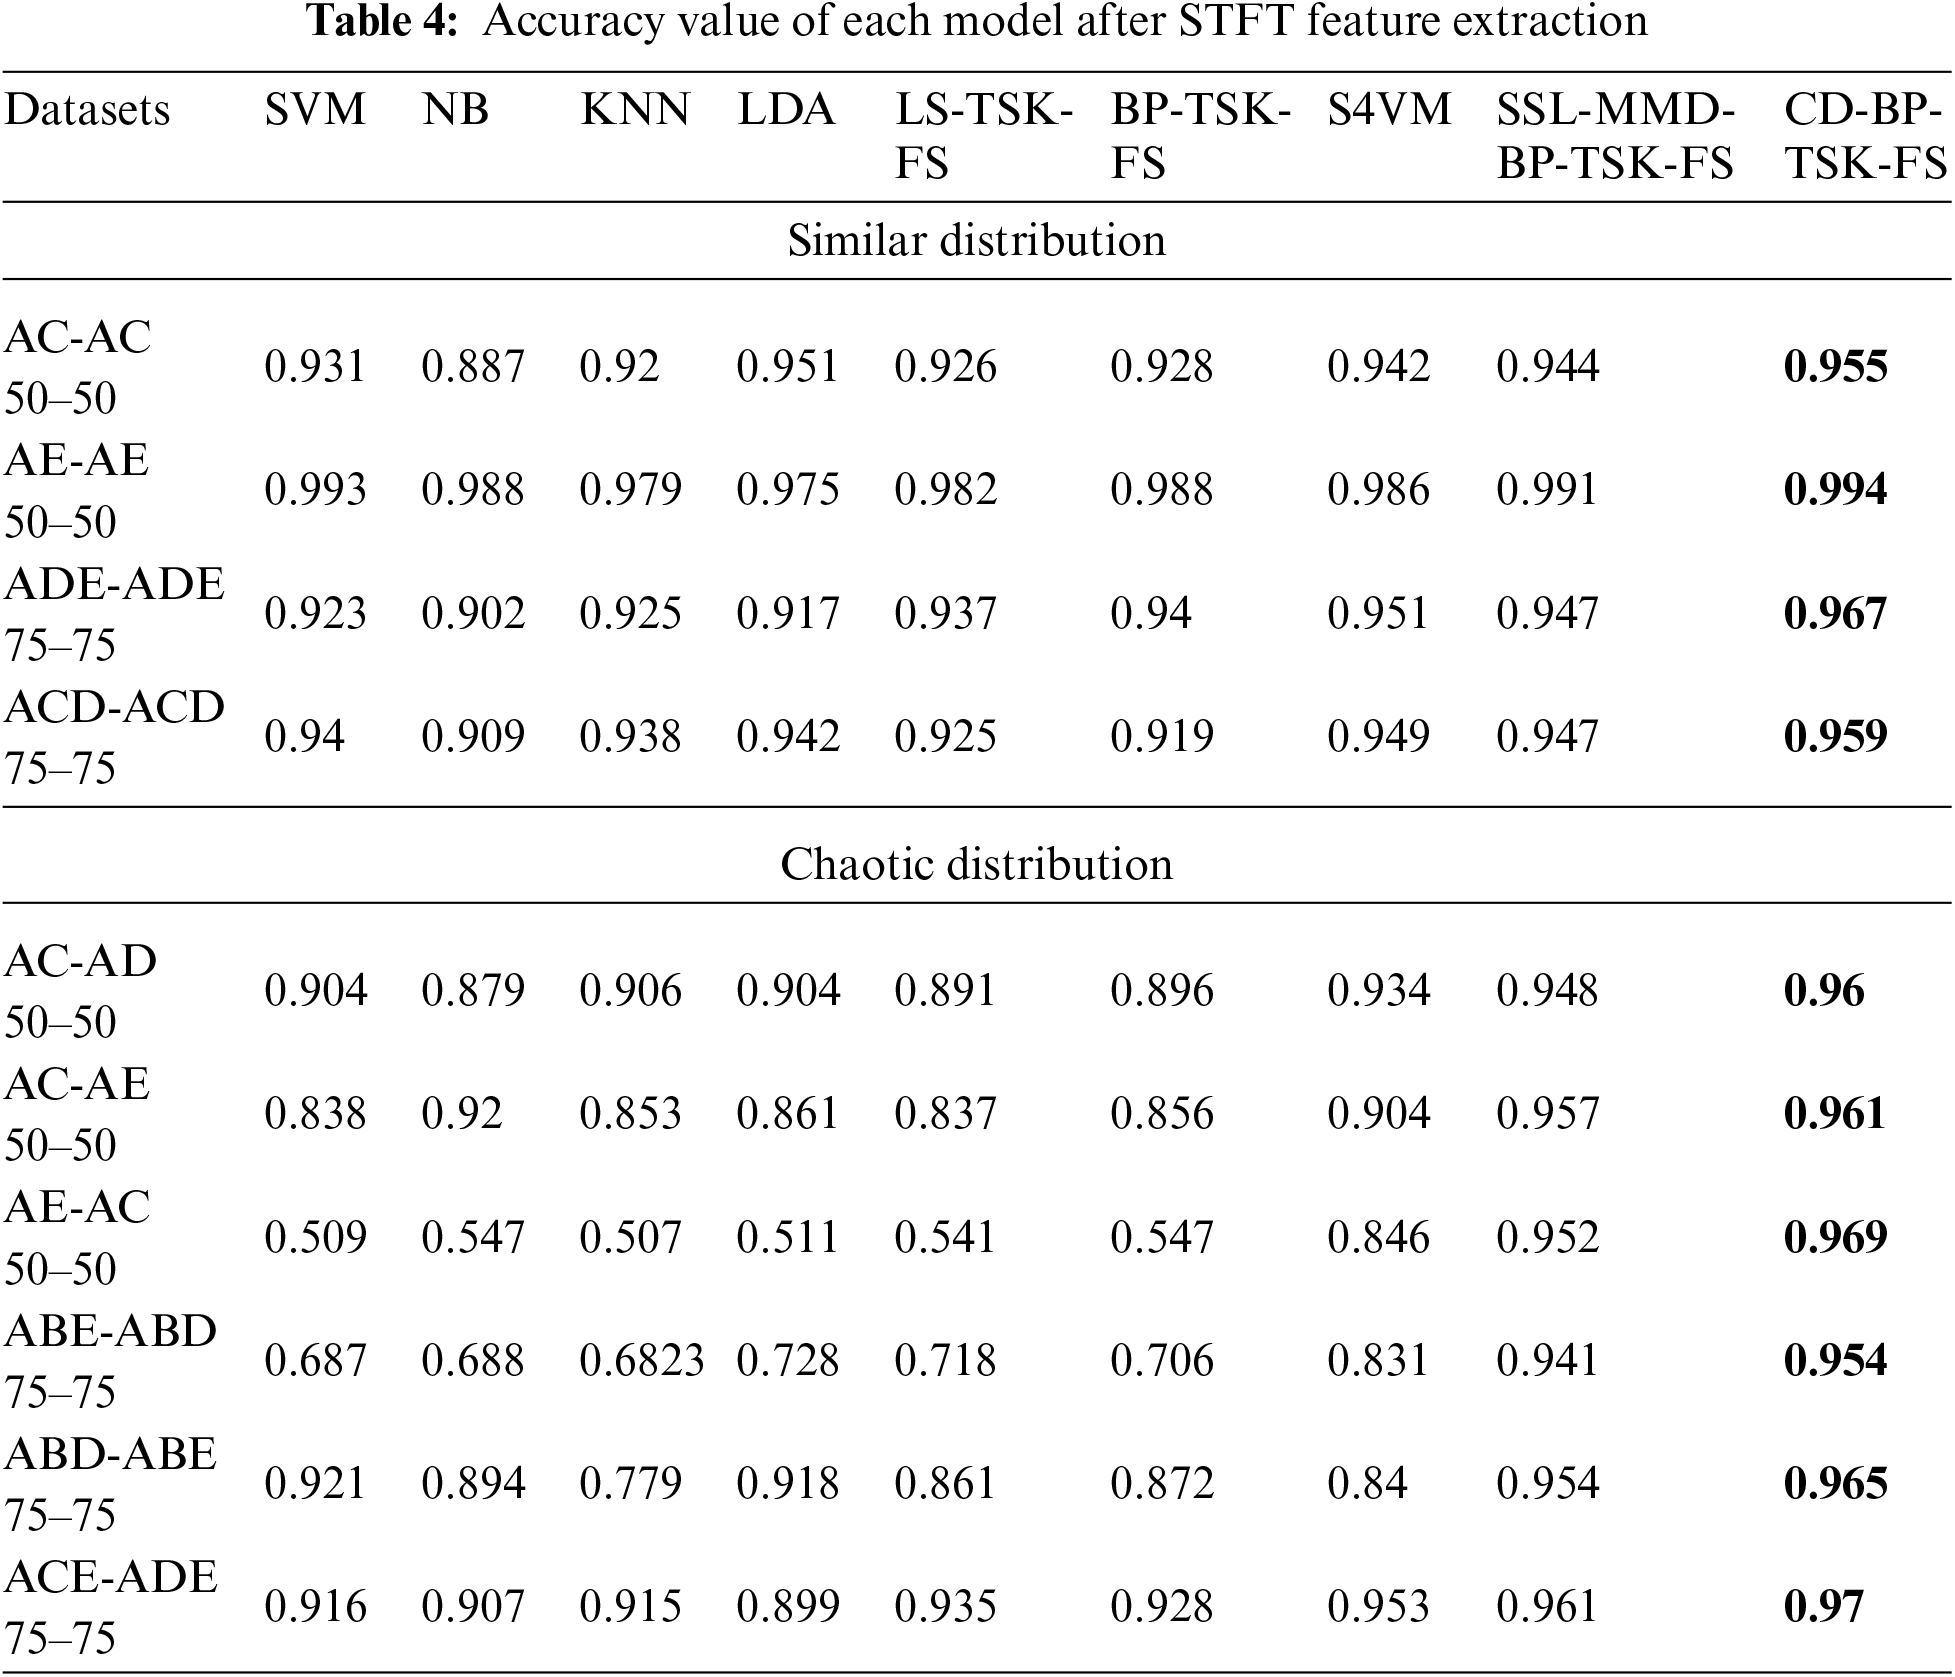
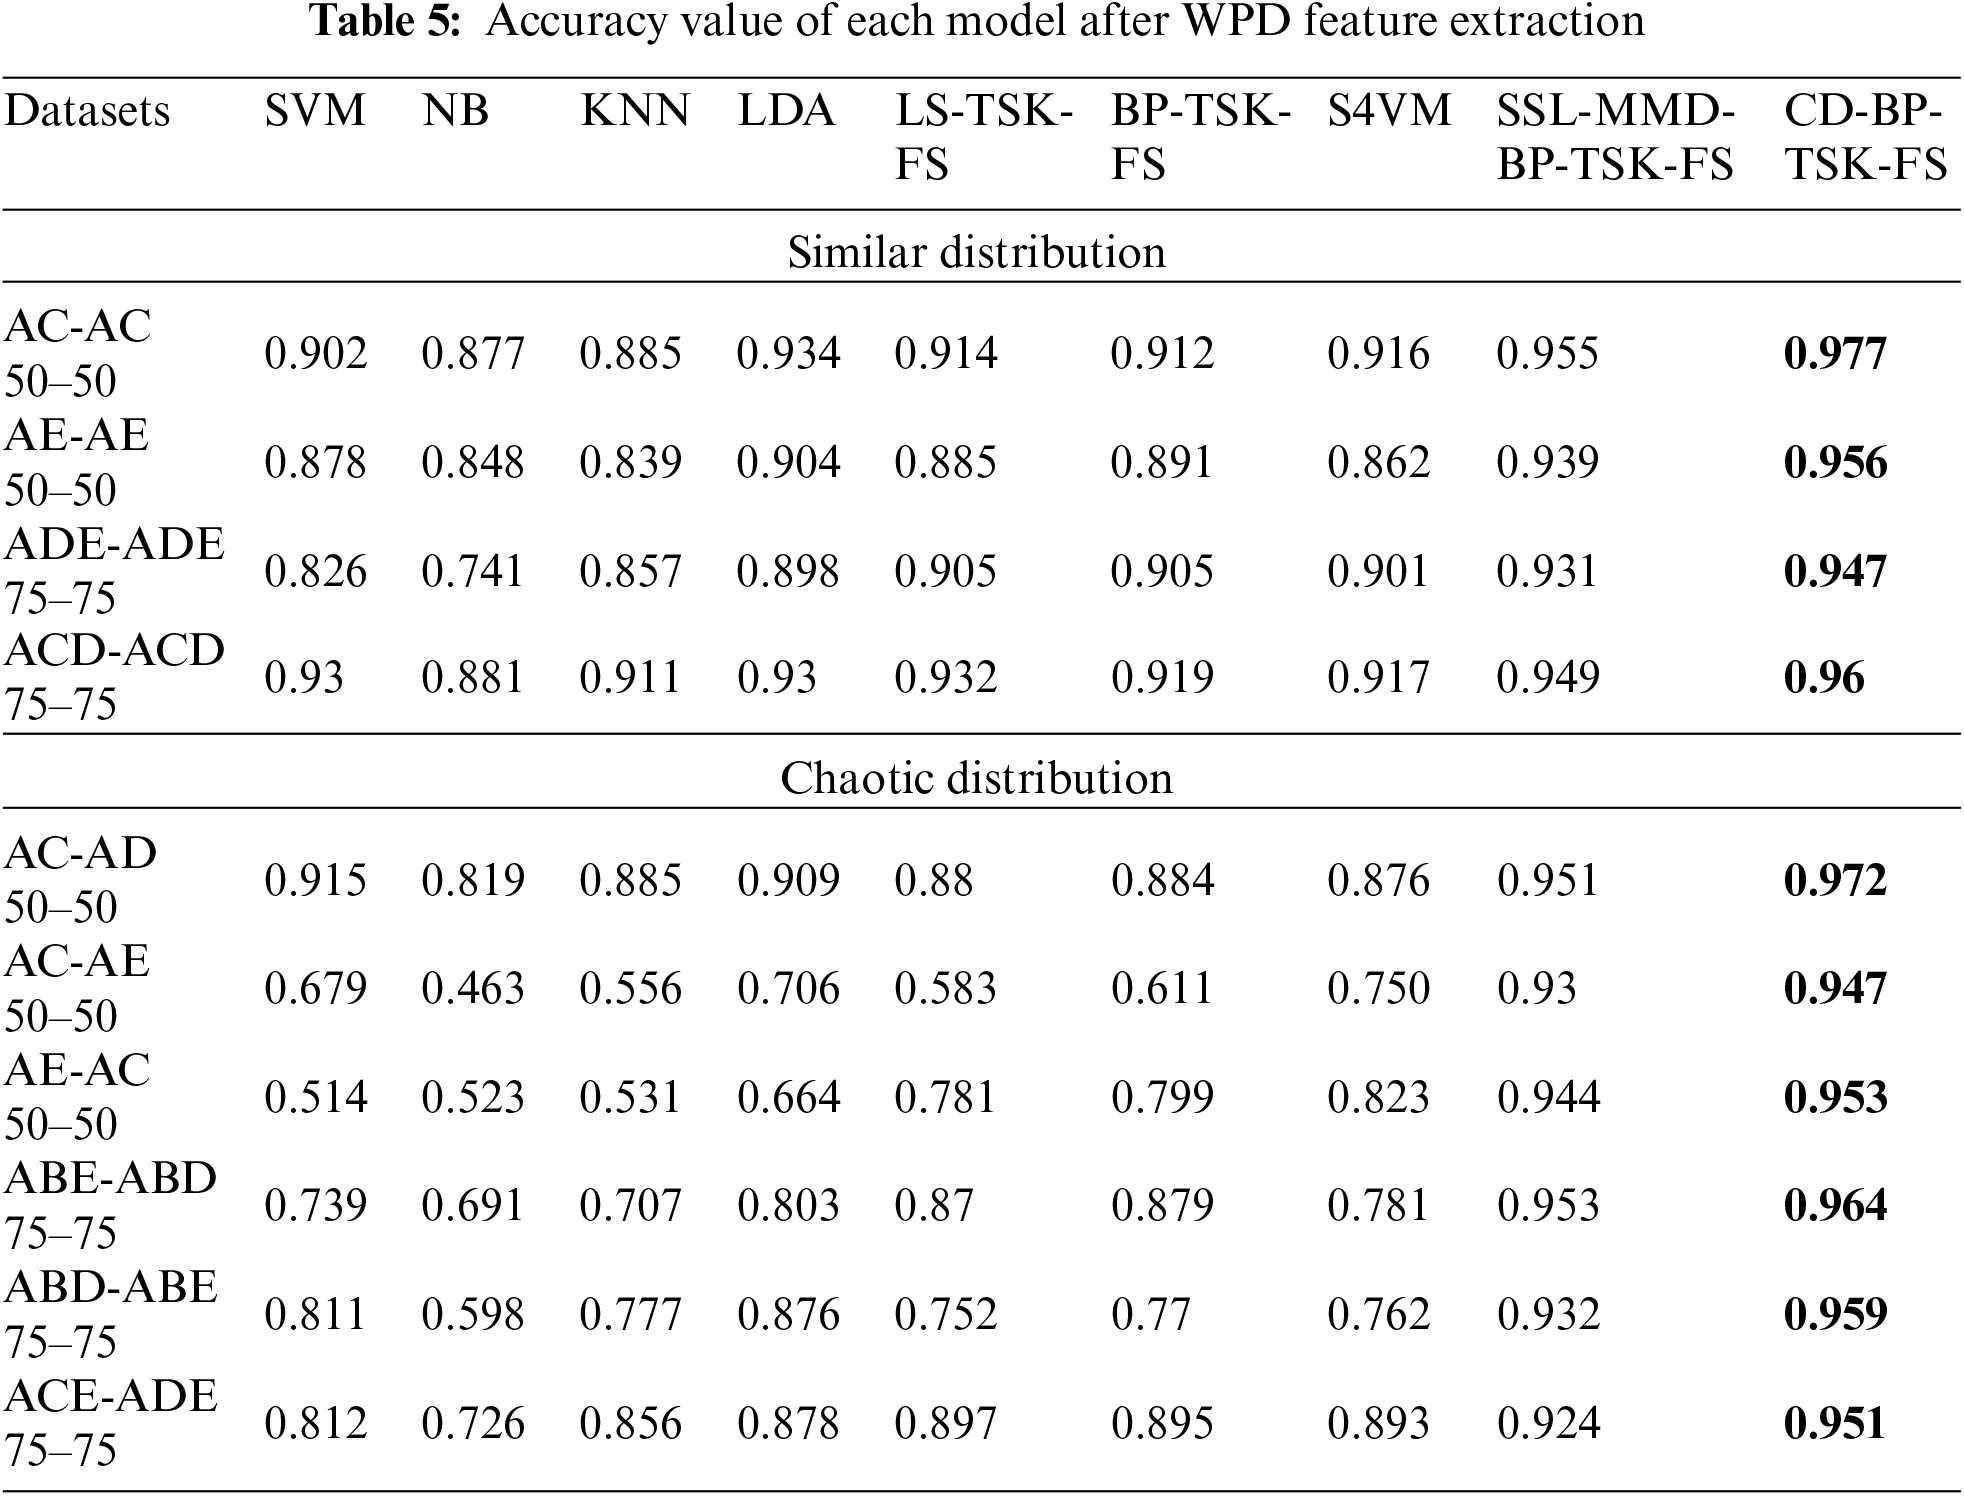

Second, for datasets with chaotic data distributions, the performance of traditional methods decreases significantly, and the minimum accuracy is only 51.4%, which is because they cannot be classified correctly. There is also a case in which the traditional algorithm is effective for datasets with chaotic data distributions, which reflects that although scenes with chaotic data distributions are constructed according to different defined groups, the results are not scientific.
In conclusion, it is a very common situation that there are differences in data distributions. Although datasets are similar in different domains, there may still be differences in the data distribution. Furthermore, in datasets with chaotic data distributions, there may still be small differences in the data distribution.
It can be seen from Tables 4–6 that the average accuracy of the proposed CD-BP-TSK-FS method reaches more than 95%, and the highest accuracy is 99.9% among the three feature extraction methods. This proves that the new method can solve the problem of performance degradation caused by different data distributions.
3) Statistical significance analysis
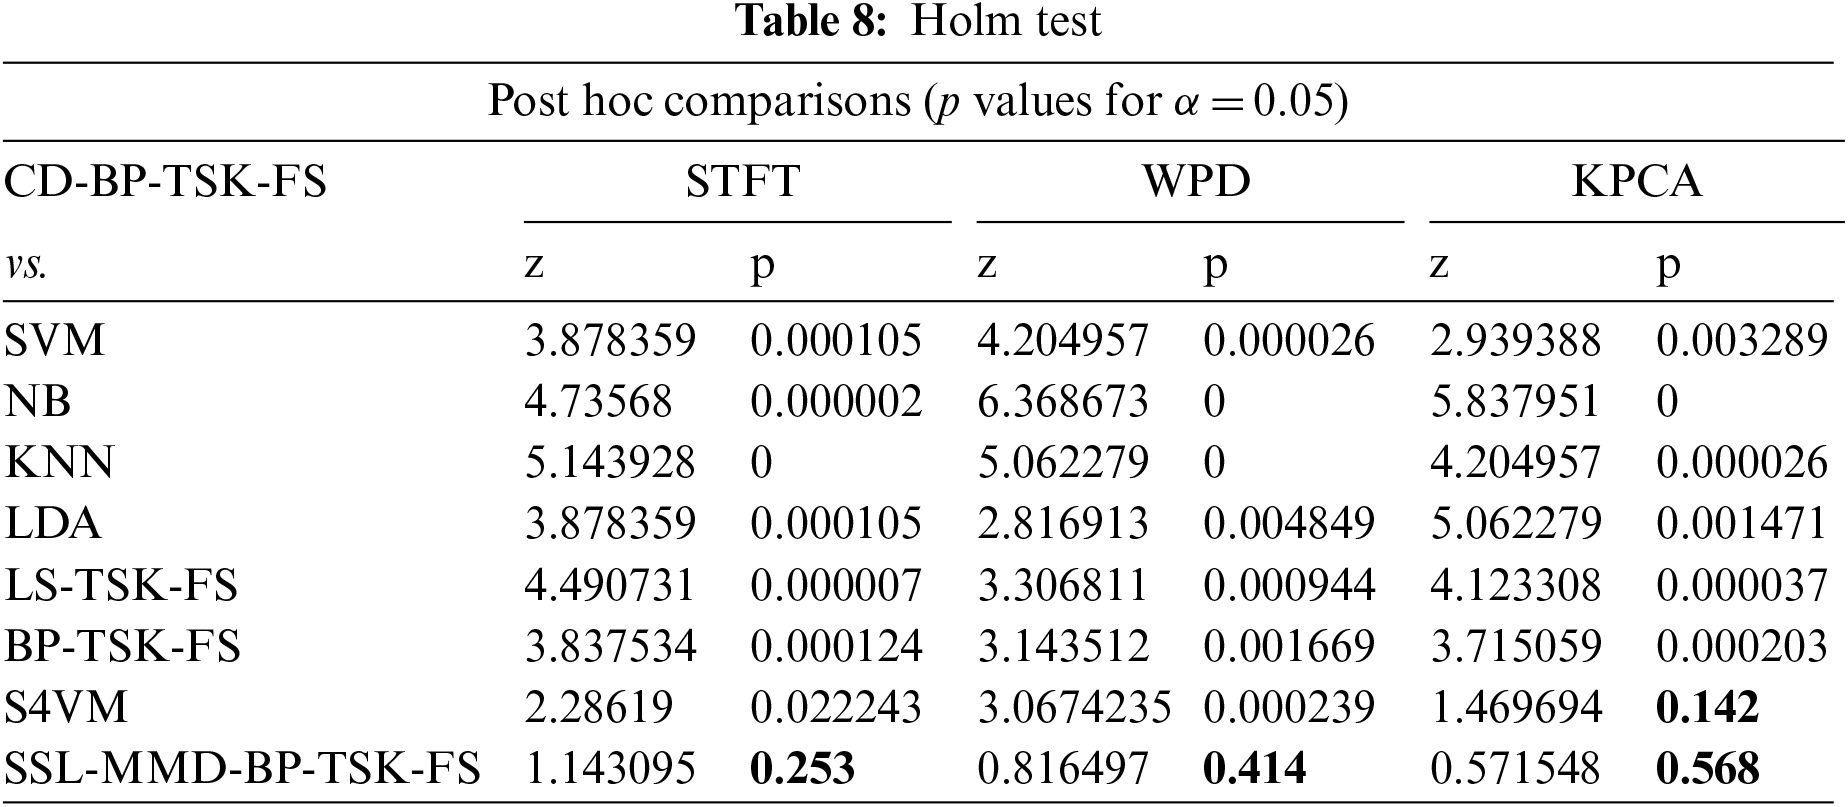
We use the newly proposed method and other methods to perform Friedman [20,21] and Holm tests [22,23] to observe whether there are statistically significant differences. The results are shown in Tables 7 and 8. CD-BP-TSK-FS ranks first in the Friedman test. For the Holm test, p < 0.05 represents a significant difference between our method and other methods. The experimental results show that, in addition to the comparison with the S4VM method under the KPCA characteristics, CD-BP-TSK-FS has statistically significant differences. Although there is no significant difference in performance with S4VM, our method is based on a fuzzy system, and its own explanatory nature can compensate for this shortcoming.
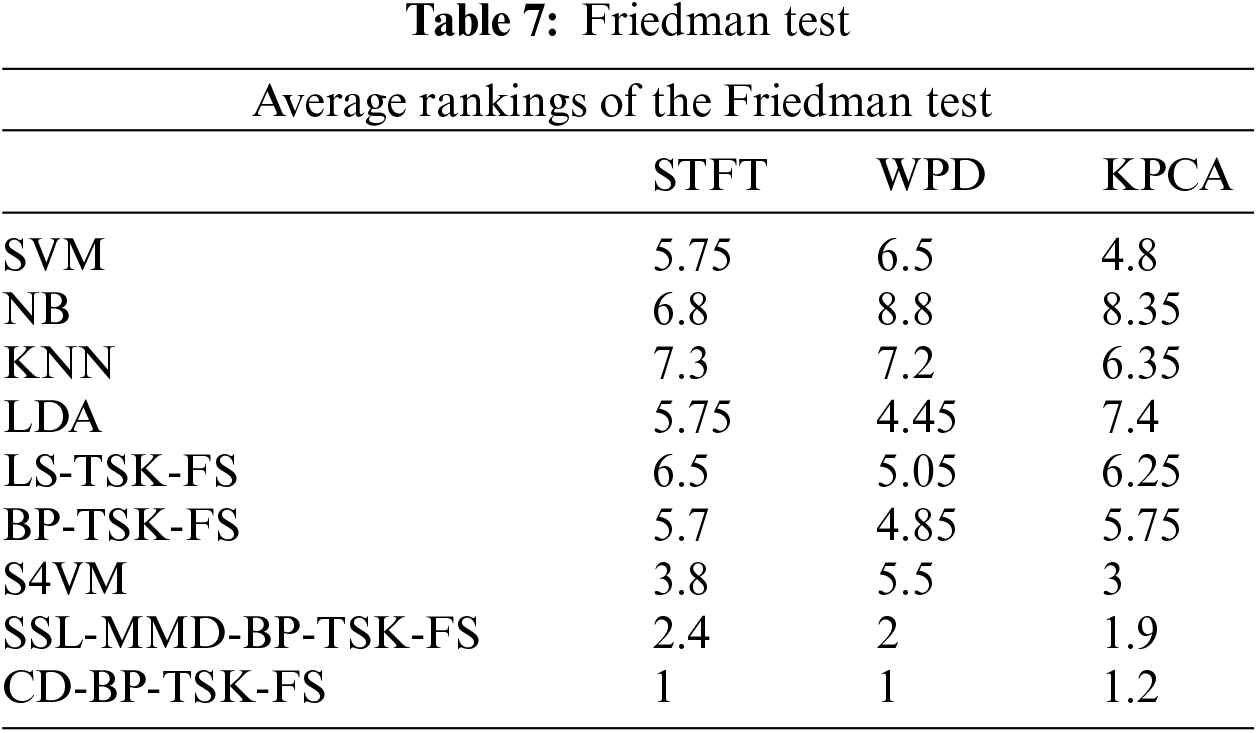
Fuzzy rules can explain the execution process within the entire model through rules [24,25]. However, if the number of rules is too large, we need to define many semantics to describe the rules. This will reduce the interpretation ability of the fuzzy system. Although our method is based on backpropagation, it does not require a large number of rules to be superimposed, and only 5–10 rules are needed to obtain good accuracy. Therefore, our method can completely replace rules with semantics to achieve interpretable functions.
The AE-AE dataset under STFT feature extraction is used to illustrate the execution process of the fuzzy system. The antecedent and subsequent parameters are shown in Table 9.

First, we use “High, Low, Middle, Middle High (MH), and Middle Low (ML)” to describe the strength of each feature element. Then, we use these strength terms in the IF-part to describe the strength of each feature element and use the corresponding linear expression in the Then-part to obtain the value. Finally, the final decision value of the model can be obtained. The decision-making process of the five rules is as follows:
1st rule:
IF: d1, d2, d3, d4, d5, and d6 are High,
THEN:
2nd rule:
IF: d1, d2, d3, d4, d5, and d6 are Low,
THEN:
3rd rule:
IF: d1, d2, d3, d4, d5, and d6 are MH,
THEN:
4th rule:
IF: d1, d2, d3, d4, d5, and d6 are ML,
THEN:
5th rule:
IF: d1, d2, d3, d4, d5, and d6 are Middle,
THEN:
For ease of understanding, Fig. 6 shows the decision flow diagram of the model, where ‘⊕’ represents the value of the cumulative rules and ‘Max’ represents the principle of “winner takes all”.
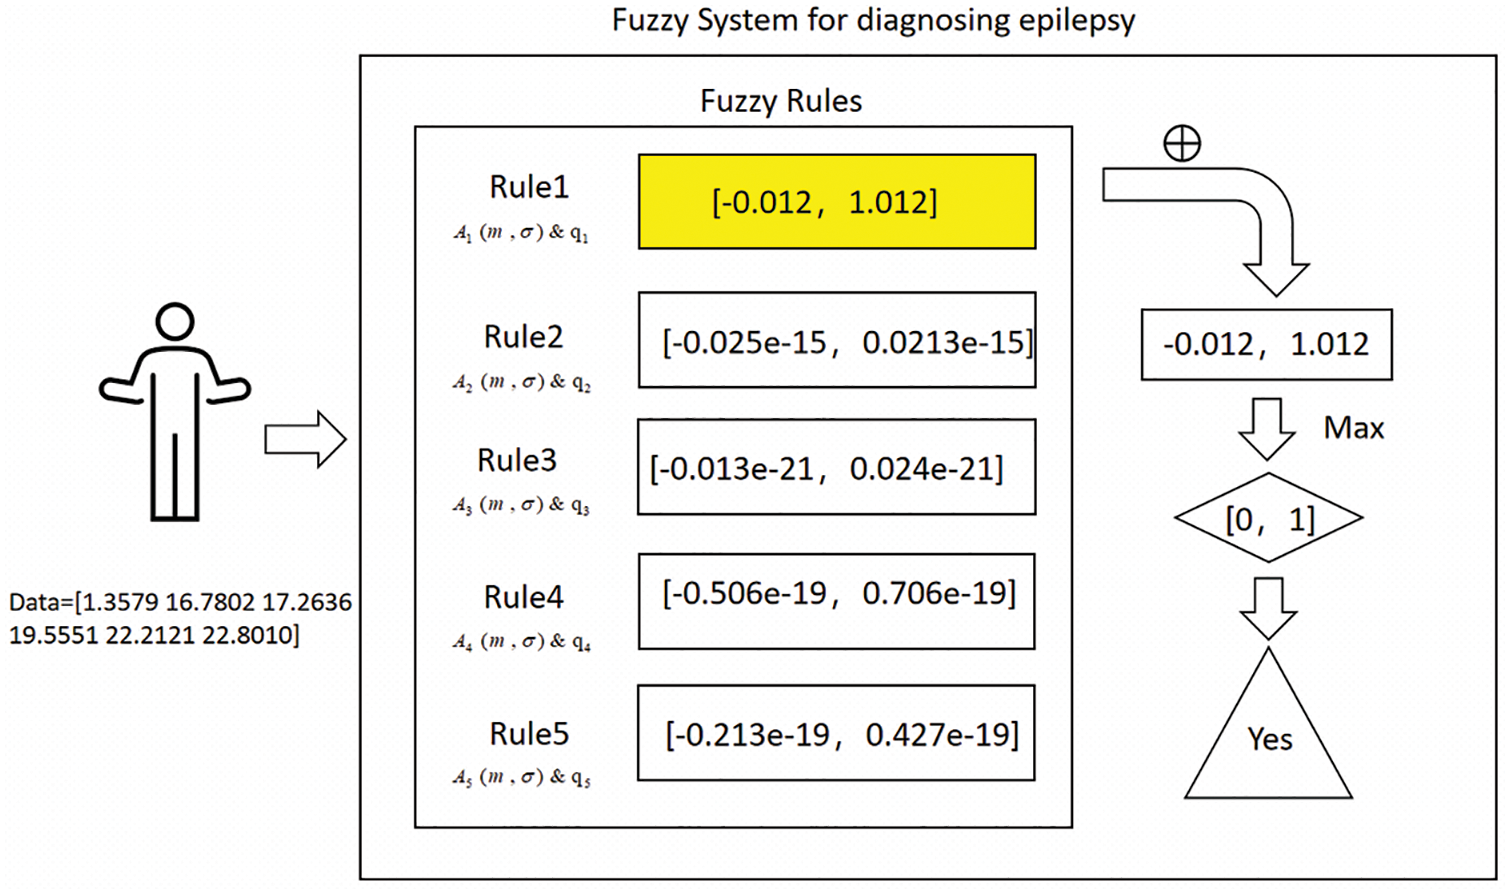
Figure 6: Decision flow diagram of the model
Taking the AC-AC dataset with STFT characteristics as an example, we show the time consumption of different optimization methods in the TSK fuzzy system. The results are shown in Table 10. In the experiment, the number of rules is set to 5, and the number of iterations in the BP solution method is set to 1000. The least-squares method is the fastest to optimize, while the back-propagation method requires more time. However, for medical data identification, it is acceptable that a more accurate diagnosis requires more time.
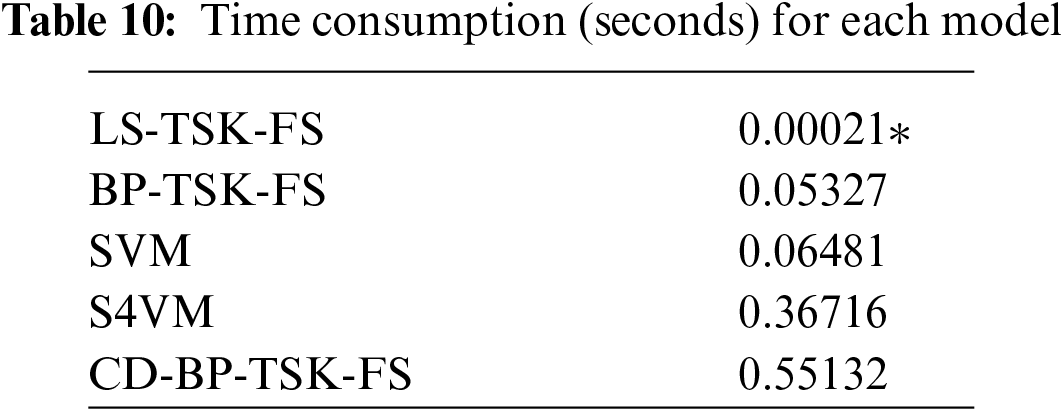
Since the CD-BP-TSK-FS model is an optimization method using gradient descent to obtain the optimal parameters after processing, more time is required for the parameter optimization process. Furthermore, the comparison method uses the least square method, and they can obtain the analytic solution directly, which makes them faster.
In terms of time consumption, compared with the other methods mentioned above, our method is indeed at a disadvantage, but this is also an unavoidable problem of the backpropagation optimization method. We will carry out future work to address this problem and to find a new optimization method to reduce the optimization time and improve the efficiency of the model.
The purpose of this paper is to develop an interpretable model for epileptic EEG signal recognition. This model is based on the TSK-fuzzy system, combines the ideas of transfer learning and semi-supervised learning, makes full use of false labels to enhance data features, and adjusts the data distribution to better mine hidden information in data. To achieve this goal, we proposed CD-TSK fuzzy systems. Experimental tests show that the new method can accurately predict epilepsy data in different scenarios with only a small number of samples. Our future work will concentrate on reducing computing costs and applying the model in related areas, such as brain-computer interfaces.
Funding Statement: This work is supported by the Fifth Key Project of Jiangsu Vocational Education Teaching Reform Research under Grant ZZZ13, and in part by the Science and Technology Project of Changzhou City under Grant CE20215032.
Conflicts of Interest: The authors declare that they have no conflicts of interest to report regarding the present study.
References
1. Gu, X., Zhang, C., Ni, T. (2020). A hierarchical discriminative sparse representation classifier for EEG signal detection. IEEE/ACM Transactions on Computational Biology and Bioinformatics, 18(5), 1679–1687. https://doi.org/10.1109/TCBB.2020.3006699 [Google Scholar] [PubMed] [CrossRef]
2. Jiang, Y., Deng, Z., Chung, F. L., Wang, G., Qian, P. et al. (2016). Recognition of epileptic EEG signals using a novel multiview TSK fuzzy system. IEEE Transactions on Fuzzy Systems, 25(1), 3–20. https://doi.org/10.1109/TFUZZ.2016.2637405 [Google Scholar] [CrossRef]
3. Jiang, Y., Xue, J., Wang, R., Xia, K., Gu, X. et al. (2019). Seizure recognition using a novel multitask radial basis function neural network. Journal of Medical Imaging and Health Informatics, 9(9), 1865–1870. https://doi.org/10.1166/jmihi.2019.2807 [Google Scholar] [CrossRef]
4. Gu, X., Shen, Z., Qu, J., Ni, T. (2022). Cross-domain EEG signal classification via geometric preserving transfer discriminative dictionary learning. Multimedia Tools and Applications, 81, 41733–41750. https://doi.org/10.1007/s11042-021-11244-w [Google Scholar] [CrossRef]
5. Yu, G. R., Huang, L. W. (2019). Control of robotic Arm based on TSK fuzzy model and hierarchical genetic algorithms. 2019 IEEE International Conference on Systems, Man and Cybernetics (SMC), pp. 1425–1430. Bari. [Google Scholar]
6. de los Angeles Hernandez, M., Melin, P., Méndez, G. M., Castillo, O., López-Juarez, I. (2015). A hybrid learning method composed by the orthogonal least-squares and the back-propagation learning algorithms for interval A2-c1 type-1 non-singleton type-2 TSK fuzzy logic systems. Soft Computing, 19(3), 661–678. https://doi.org/10.1007/s00500-014-1287-8 [Google Scholar] [CrossRef]
7. Wu, D., Yuan, Y., Huang, J., Tan, Y. (2019). Optimize TSK fuzzy systems for regression problems: Minibatch gradient descent with regularization, DropRule, and AdaBound (MBGD-RDA). IEEE Transactions on Fuzzy Systems, 28(5), 1003–1015. https://doi.org/10.1109/TFUZZ.2019.2958559 [Google Scholar] [CrossRef]
8. Tao, Y., Jiang, Y., Dong, X., Zhou, L., Ding, Y. et al. (2022). Domain adaptive extreme learning machine for epileptic EEG classification. Journal of Intelligent & Fuzzy Systems, 43(3), 3983–3992. https://doi.org/10.3233/JIFS-212068 [Google Scholar] [CrossRef]
9. Shi, Z., Wu, D., Guo, C., Zhao, C., Cui, Y. et al. (2021). FCM-RDpA: TSK fuzzy regression model construction using fuzzy C-means clustering, regularization, droprule, and powerball adabelief. Information Sciences, 574, 490–504. https://doi.org/10.1016/j.ins.2021.05.084 [Google Scholar] [CrossRef]
10. Lin, W. W., Mak, M. W., Chien, J. T. (2018). Multisource i-vectors domain adaptation using maximum mean discrepancy based autoencoders. IEEE/ACM Transactions on Audio, Speech, and Language Processing, 26(12), 2412–2422. https://doi.org/10.1109/TASLP.6570655 [Google Scholar] [CrossRef]
11. Ren, W., Zhou, S., Yang, Z., Shi, Q., Sun, X. et al. (2021). Metric information matrix for maximum mean discrepancy for domain adaptation. IEEE Access, 9, 148017–148023. https://doi.org/10.1109/ACCESS.2021.3123281 [Google Scholar] [CrossRef]
12. Sharmila, A., Geethanjali, P. J. I. A. (2016). DWT based detection of epileptic seizure from EEG signals using naive Bayes and k-NN classifiers. IEEE Access, 4, 7716–7727. https://doi.org/10.1109/ACCESS.2016.2585661 [Google Scholar] [CrossRef]
13. Ni, T., Gu, X., Zhang, C. (2020). An intelligence EEG signal recognition method via noise insensitive TSK fuzzy system based on interclass competitive learning. Frontiers in Neuroscience, 14, 837. https://doi.org/10.3389/fnins.2020.00837 [Google Scholar] [PubMed] [CrossRef]
14. Jiang, Y., Gu, X., Ji, D., Qian, P., Xue, J. et al. (2020). Smart diagnosis: A multiple-source transfer TSK fuzzy system for EEG seizure identification. ACM Transactions on Multimedia Computing, Communications, and Applications, 16(2s), 1–21. https://doi.org/10.1145/3340240 [Google Scholar] [CrossRef]
15. Zhuang, J., Tang, T., Ding, Y., Tatikonda, S. C., Dvornek, N. et al. (2020). Adabelief optimizer: Adapting stepsizes by the belief in observed gradients. Advances in Neural Information Processing Systems, 33, 18795–18806. [Google Scholar]
16. Ali, M. N. Y., Sarowar, M. G., Rahman, M. L., Chaki, J., Dey, N. et al. (2019). Adam deep learning with SOM for human sentiment classification. International Journal of Ambient Computing and Intelligence, 10(3), 92–116. https://doi.org/10.4018/IJACI [Google Scholar] [CrossRef]
17. Guerrero, M. C., Parada, J. S., Espitia, H. E. (2021). EEG signal analysis using classification techniques: Logistic regression, artificial neural networks, support vector machines, and convolutional neural networks. Heliyon, 2021, e07258. https://doi.org/10.1016/j.heliyon.2021.e07258 [Google Scholar] [PubMed] [CrossRef]
18. Li, Y. F., Zhou, Z. H. (2014). Towards making unlabeled data never hurt. IEEE Transactions on Pattern Analysis and Machine Intelligence, 37(1), 175–188. [Google Scholar]
19. Ding, S., Zhu, Z., Zhang, X. (2017). An overview on semi-supervised support vector machine. Neural Computing and Applications, 28(5), 969–978. https://doi.org/10.1007/s00521-015-2113-7 [Google Scholar] [CrossRef]
20. Demšar, J. (2006). Statistical comparisons of classifiers over multiple data sets. The Journal of Machine Learning Research, 7, 1–30. [Google Scholar]
21. Jiang, Y., Wu, D., Deng, Z., Qian, P., Wang, J. et al. (2017). Seizure classification from EEG signals using transfer learning, semi-supervised learning and TSK fuzzy system. IEEE Transactions on Neural Systems and Rehabilitation Engineering, 25(12), 2270–2284. https://doi.org/10.1109/TNSRE.7333 [Google Scholar] [CrossRef]
22. Abe, F. (2022). Probability, P values, and statistical significance: Instructions for use by surgeons. British Journal of Surgery, 12, znac440. https://doi.org/10.1093/bjs/znac440 [Google Scholar] [PubMed] [CrossRef]
23. Tao, Y., Jiang, Y., Xia, K., Xue, J., Zhou, L. et al. (2021). Classification of EEG signals in epilepsy using a novel integrated TSK fuzzy system. Journal of Intelligent & Fuzzy Systems, 40(3), 4851–4866. https://doi.org/10.3233/JIFS-201673 [Google Scholar] [CrossRef]
24. Gu, X., Zhang, C., Ni, T. (2019). Feature selection and rule generation integrated learning for takagi-sugeno-kang fuzzy system and its application in medical data classification. IEEE Access, 7, 169029–169037. https://doi.org/10.1109/Access.6287639 [Google Scholar] [CrossRef]
25. Gu, X., Chung, F. L., Wang, S. (2017). Bayesian takagi–Sugeno–Kang fuzzy classifier. IEEE Transactions on Fuzzy Systems, 25(6), 1655–1671. https://doi.org/10.1109/TFUZZ.2016.2617377 [Google Scholar] [CrossRef]
Cite This Article
 Copyright © 2023 The Author(s). Published by Tech Science Press.
This work is licensed under a Creative Commons Attribution 4.0 International License , which permits unrestricted use, distribution, and reproduction in any medium, provided the original work is properly cited.
 Downloads
 Citation Tools