
 Submit a Paper
 Propose a Special lssue
 Open Access
ARTICLE

Novel Early-Warning Model for Customer Churn of Credit Card Based on GSAIBAS-CatBoost
School of Science, Wuhan University of Technology, Wuhan, 430070, China
* Corresponding Authors: Congjun Rao. Email: ; Fuyan Hu. Email:
(This article belongs to the Special Issue: Data-Driven Robust Group Decision-Making Optimization and Application)
Computer Modeling in Engineering & Sciences 2023, 137(3), 2715-2742. https://doi.org/10.32604/cmes.2023.029023
Received 25 January 2023; Accepted 16 March 2023; Issue published 03 August 2023
 View Full Text
 Download PDF
Abstract
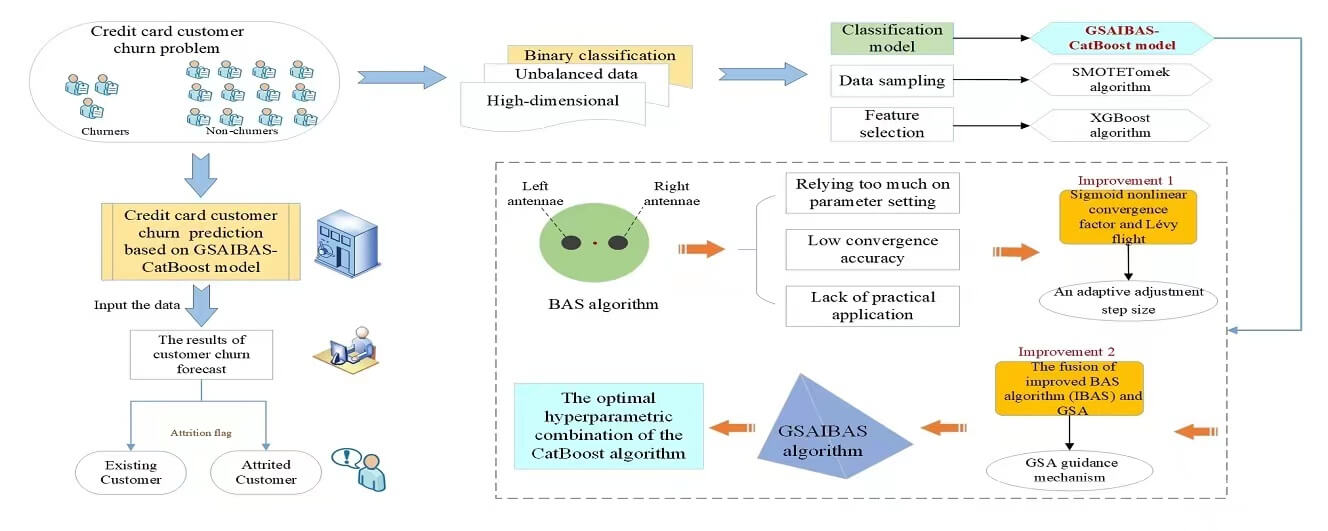
As the banking industry gradually steps into the digital era of Bank 4.0, business competition is becoming increasingly fierce, and banks are also facing the problem of massive customer churn. To better maintain their customer resources, it is crucial for banks to accurately predict customers with a tendency to churn. Aiming at the typical binary classification problem like customer churn, this paper establishes an early-warning model for credit card customer churn. That is a dual search algorithm named GSAIBAS by incorporating Golden Sine Algorithm (GSA) and an Improved Beetle Antennae Search (IBAS) is proposed to optimize the parameters of the CatBoost algorithm, which forms the GSAIBAS-CatBoost model. Especially, considering that the BAS algorithm has simple parameters and is easy to fall into local optimum, the Sigmoid nonlinear convergence factor and the lane ight equation are introduced to adjust the fixed step size of beetle. Then this improved BAS algorithm with variable step size is fused with the GSA to form a GSAIBAS algorithm which can achieve dual optimization. Moreover, an empirical analysis is made according to the data set of credit card customers from Analyttica ocial platform. The empirical results show that the values of Area Under Curve (AUC) and recall of the proposed model in this paper reach 96.15% and 95.56%, respectively, which are significantly better than the other 9 common machine learning models. Compared with several existing optimization algorithms, GSAIBAS algorithm has higher precision in the parameter optimization for CatBoost. Combined with two other customer churn data sets on Kaggle data platform, it is further verified that the model proposed in this paper is also valid and feasible.Graphic Abstract
Keywords
Customer churn has become a critical issue today, especially in the highly competitive banking industry. With the proposal of the concept of AiFinance and the advent of Bank 4.0 era, new business models of the traditional banking industry have been opened up. However, new technologies such as artificial intelligence, Internet of Things and blockchain not only provide more possibilities for the future development of banks, but also have a huge impact on the main business module of banks (credit card). With the rise of electronic payment, the significant increase in the number of credit cards issued by major banks and the excessive homogenization of products and services, the credit card market is becoming increasingly saturated, the number of “dormant cards” is gradually increasing and the problem of customer churn is becoming more and more prominent. The high churn rate means that more and more customers no longer want to buy products and services from businesses. However, according to the survey data, every 5% reduction in customer churn rate is expected to bring 30%–85% profit growth for banks. Moreover, it is six times more expensive for a bank to develop a new customer than to retain an old one, while an old customer may bring 16 times more profits to the bank than a new one [1–3]. As a result, more and more banking workers focus on the customer retention. Under this background, how to establish a credible customer churn prediction model based on huge historical data, so as to accurately predict and match the old customer groups with churn tendency early and carry out timely retention measures, has become an urgent problem to be solved.
In recent years, many scholars have established early warning models for customer churn from the perspective of machine learning methodology, including single classification models such as decision tree, logistic regression, support vector machine and artificial neural network, and ensemble learning classification models such as random forest, XGBoost and CatBoost. Moreover, it has been confirmed that the integrated classification model has better prediction performance than the single classification models. Therefore, this paper will establish a hybrid prediction model of credit card customer churn based on CatBoost ensemble learning algorithm which has attracted much attention in recent years. CatBoost, as an open-source machine learning library proposed by the Russian search giant Yandex in 2017, can rival any advanced machine learning algorithm in classification problems [4–6]. It not only has a unique way of processing the categorical characteristics, but also reduces the chance of overfitting, making the model more universal. However, one of the greatest challenges in any machine learning algorithm is the optimization and adjustments of the parameters for a specific practical problem [7]. CatBoost also suffers from the problems of weak interpretability of some of its own hyperparameters and improper selection which can easily affect the prediction accuracy. But the selection of parameters based on subjective judgment and traditional optimization methods (such as grid search) not only requires a huge workload, but also has poor convergence so as to achieve global optimization [8,9].
Currently, swarm intelligence optimization algorithms based on population iteration have been widely used in many aspects due to its faster solution rate. Therefore, many scholars have combined machine learning algorithm with various swarm intelligence optimization algorithms by using latter to optimize the parameters of the former, so as to improve the performance and efficiency of machine learning algorithms. For example, Cui [10] used genetic algorithm (GA) and grid search method to optimize the parameters of CatBoost respectively, and the F1 score and AUC value of the GA-CatBoost model were proved to be higher than the grid search by test set samples. Lu [11] used the gray wolf optimization (GWO) algorithm to optimize the main parameters of CatBoost algorithm. The experiment proved that the classification accuracy of the GWO-CatBoost model was significantly higher than other models. However, the selection of its own parameters in the classical GA will also seriously affect the accuracy of optimization [12] and the original GWO algorithm has slow convergence speed and accuracy [13,14]. So, it may not be possible to effectively elevate the prediction accuracy by using the original swarm intelligence algorithm directly. To avoid various possible defects that may exist in the parameter optimization of the original algorithms, the enhanced BAS algorithm is specifically utilized for solving this task. This paper proposes a new swarm intelligence optimization algorithm named GSAIBAS by incorporating an Improved Beetle Antennae Search (IBAS) and Golden Sine Algorithm (GSA) to optimize the parameters of the CatBoost algorithm.
The major contributions of the paper are as follows:
(1) This paper proposes a new hybrid prediction model (i.e., GSAIBAS-CatBoost) based on machine learning and metaheuristic algorithm for predict customer churn of credit card. The main idea of the model is to elevate the prediction accuracy of CatBoost classification algorithm by using a dual search algorithm (i.e., GSAIBAS) that integrates the improved BAS and GSA to optimize the hyperparameters of the integrated learning algorithm, CatBoost.
(2) The original BAS algorithm is improved, and a double search optimization algorithm, GSAIBAS, which integrates improved BAS and GSA, is proposed. In this algorithm, in order to overcome the problems of intense sensitivity to parameter settings, slow convergence speed and low solution accuracy, the fixed step search is changed to the variable step search by combining the Sigmoid function and Lévy flight mutation mechanism. Then, the GSA is used to guide the improved BAS algorithm to conduct a secondary search for the optimal position searched by the former, so as to make up for the decline of population diversity of the GSA and easy to fall into local optimal in the late iterations, which can realize dual search optimization and increase the global search diversity of the algorithm.
(3) In terms of the methods of evaluating the models, since most methods only pay attention to the classification accuracy of prediction, they do not consider the importance of identifying churn customers, that is, the Recall is ignored [15]. Although these models have high precision, most potential customers are not identified. In response to this problem, this paper focuses on the use of two evaluation indicators, Recall and AUC value. The higher the Recall, the more effectively the model can identify potential churn customers reducing the misclassification of key targets. Through the comparative analysis, the GSAIBAS-CatBoost model presented in this paper is superior to other similar models.
The rest of the paper is arranged as follows. Section 2 provides a summary of the research related to customer churn. Section 3 introduces the modeling process of the early-warning model for customer churn of credit card based on GSAIBAS-CatBoost. Section 4 makes an empirical analysis. Section 5 compares the GSAIBAS-CatBoost model with several commonly used classification early-warning models, and the performance of GSAIBAS algorithm is evaluated and verified by using the other customer churn data sets, which further proves the effectiveness of the GSAIBAS-CatBoost model. Section 6 is a summary.
In previous studies, customer churn was mainly developed from two different perspectives: customer relationship management and churn prediction. On the one hand, researchers focused on analyzing customer churn based on customer relationship management (CRM) theory, exploring the reasons for low customer loyalty and the important factors that affect customer’s loyalty, such as customer satisfaction, customer trust and customer value [16,17]. For example, Lin et al. [18] found that the combination of a rough set approach and a flow network graph was an effective tool to support CRM decision-making, which could represent the importance of different variables for customer churn and provide decision-makers with abundant information. Wang et al. [19] proposed an architecture of blockchain cloud manufacturing system that objectively transformed customer satisfaction requirements from text analysis to service quality, eliminating the third-party trust problem. Xu [20] used the text-mining approach to explore the determinants of customers’ satisfaction for restaurants through their online review-writing and scores in the on-demand service platforms. Liang et al. [21] combined the content analysis method, improved analytic hierarchy with fuzzy comprehensive evaluation to establish an O2O takeaway customer satisfaction evaluation system based on online reviews of restaurants and studied how to retain customers by mining customer satisfaction information. Han et al. [22] established five decision models including current value, historic value, prediction of long-term value, credit and loyalty by proposing a novel customer segmentation method based on customer lifecycle and applied the evaluation system to telecom operators in a province of China. Li et al. [23] proposed a customer segmentation method (IKM-ALPSO) based on improved K-means algorithm and the adaptive particle swarm optimization (PSO) algorithm. The ALPSO algorithm was used to optimize the initial cluster centers of K-means algorithm and it was proved that this model was superior to the existing models. In order to solve the difficulty that clustering algorithm cannot accurately divide customer real demand (CRD), Sun et al. [24] proposed a clustering method for customer segmentation which was named Gaussian peak Heuristic Clustering method (GPHC). Firstly, the entropy evaluation method and standard Gaussian distribution were used to filter and model interval CRD. Then they used the niche genetic algorithm and hierarchical clustering algorithm to identify hidden preference patterns of customers. Finally, according to the customer preference model, the clustering results were obtained by K-means algorithm.
On the other hand, researchers concentrated on the customer churn behavior to establish customer churn prediction models. In recent years, data mining techniques and machine learning algorithms have become quite popular. Classic machine learning algorithms, such as decision tree, support vector machine, logistic regression, random forest, have also achieved considerable prediction effects in the field of customer churn [25–28]. For example, Nie et al. [29] used logistic regression and decision tree to establish the credit card customer churn prediction models, respectively. The test results showed that the performance of logistic regression was better than that of decision tree. However, decision tree often has problems in dealing with the linear relationship between variables, and logistic regression also has difficulties in measuring the interaction between variables. In view of the above shortcomings, Caigny et al. [30] established a new hybrid algorithm: the logit leaf model (LLM). The first stage used decision rules to identify customer groups. The second stage created a model for each leaf of the tree. Experimental results showed that the LLM score was significantly better than logistic regression and decision tree. de Bock et al. [31] proposed two rotation-based ensemble classification models to predict whether a customer is churn or not. They found that rotation forest outperformed RotBoost in terms of AUC and top-decile lift, while RotBoost demonstrated higher accuracy. Vo et al. [32] constructed a multi-stacking ensemble customer churn prediction model by combining several machine learning methods with unstructured information from customer call logs, and segmented customers according to the results. Stripling et al. [33] proposed a profit maximization classification method (ProfLogit) for customer churn prediction which directly incorporated the profit problem into the model construction, and used GA to maximize the expected maximum profit measure of customer churn (EMPC) in training in order to meet the business needs of profit maximization. Pustokhina et al. [34] designed a dynamic customer churn prediction strategy by using text analysis with metaheuristic optimization algorithm (CCPBI-TAMO), and used sunflower optimization algorithm (SFO) to adjust the hyperparameters in the LSTM-SAE model. From the above literatures, we find that the performance of interpretable classification algorithms and hybrid prediction methods are better than that of the single classification algorithms in the field of customer churn.
Based on machine learning and metaheuristic algorithm, this paper designs and proposes a new hybrid early warning model (GSAIBAS-CatBoost). The core idea of the GSAIBAS algorithm is to improve the original Beetle Antennae Search (BAS) algorithm. As a new type of single intelligent optimization algorithm, BAS algorithm has low complexity and can achieve efficient optimization without knowing gradient information [35,36]. Many scholars combined it with parameter optimization of machine learning algorithm. For instance, Sun et al. [37] used BAS algorithm to optimize the hyperparameters of SVM, and the established SVM-BAS model could predict young’s modulus of coal concrete effectively. Wu et al. [38] used BAS algorithm to optimize the weights between the hidden layer and the output layer of the new neural network classifier (NNC), which improved the computation speed and prediction accuracy. However, BAS algorithm relies heavily on the parameter settings during optimization, and the convergence and solution accuracy of the algorithm are closely related to the parameters used [39,40]. Therefore, Qian et al. [41] proposed an improved BAS algorithm (MHBAS) with adaptive adjustment step size by integrating the preliminary optimization and mutation-crossover mechanisms of multi-objective differential evolution (MDE) algorithm. Then, they combined the back propagation (BP) prediction model and MHBAS algorithm to solve the complex multi-objective optimal active power dispatch problem encountered in the power system. Based on the current COVID-19 epidemic outbreak, Zivkovic et al. [42] proposed a hybrid prediction method based on machine learning, adaptive neural-fuzzy inference system and improved BAS algorithm. The Cauchy mutation operator was added to BAS algorithm to improve its exploration ability in the early stage. Then the parameters of the adaptive neural-fuzzy system were determined by the enhanced BAS algorithm to improve the overall performance of the prediction model. In order to solve the optimization problem in prediction strategy, an improved BAS algorithm was proposed by using the optimal value of historical antenna [43]. The convergence of the improved BAS algorithm is analyzed theoretically, and the global optimization ability of the algorithm was verified by several benchmark tests. Some other scholars combined BAS algorithm with other swarm intelligence algorithms proposing algorithms such as BGWO [44], BASFPA [45] and BAS-GSA [46]. Although many scholars have improved the BAS algorithm in many ways, most of the studies only tested it with some CEC benchmark functions and did not really apply it to practical applications. There is still much room for the improvement of the BAS algorithm as well as application research [47]. In this paper, the proposed GSAIBAS algorithm is used to optimize the hyperparameters of CatBoost algorithm, and it is applied to the field of customer churn prediction. An early-warning model for customer churn of credit card based on GSAIBAS-CatBoost is established, which is helpful to grasp the law of customer churn and provide useful information for decision makers.
In this section, we propose a new early-warning model for customer churn of credit card, i.e., GSAIBAS-CatBoost. In view of the advantages of CatBoost algorithm that can automatically process categorical characteristics and efficiently model, this paper takes it as the main classification model for predicting the customer churn of credit card. Moreover, a new swarm intelligent optimization algorithm named GSAIBAS is proposed to improve the accuracy and stability of the CatBoost algorithm by optimizing its important hyperparameters. Firstly, the Sigmoid function and Lévy flight mechanism are incorporated into the step size calculation of the beetle, and the fixed step size search is changed to the variable step size search. Then, the improved BAS algorithm is fused with the GSA to achieve dual search optimization. Furthermore, the idea of tabu search is introduced, and the greedy strategy is used to judge the optimal situation of the two positions, which improves the diversity of global search of the algorithm. Finally, a dual search optimization algorithm, i.e., GSAIBAS is proposed to establish an early-warning model for customer churn of credit card based on GSAIBAS-CatBoost, which is applied to predict whether the credit card customers are churn.
CatBoost is composed of Categorical and Boosting, and belongs to a new type of machine learning algorithm of gradient boosting decision tree (GBDT) class [48]. Compared with the earlier GBDT algorithms, CatBoost performs better in terms of speed and accuracy, especially when dealing with large amounts of data and high-dimensional classification features. It can reduce the occurrence of overfitting and improve the accuracy and generalization ability of the algorithm by efficiently processing the nominal attributes, gradient deviation and prediction deviation [49].
Given an observation data set
In Eq. (1), if
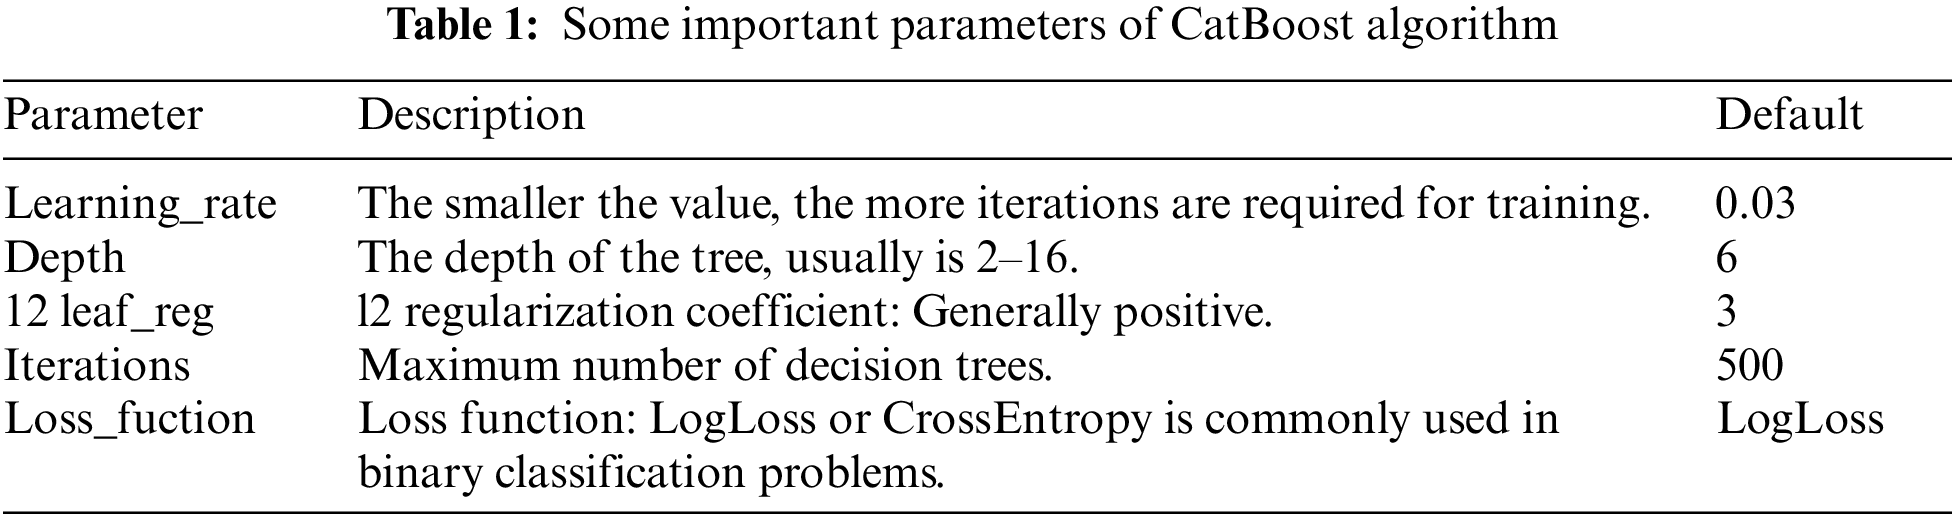
However, the premise of CatBoost algorithm’s high recognition accuracy is to select the globally optimal parameters combination [53], while the CatBoost algorithm has many parameters, and each of which has a different effect (see Table 1). In response to the above problem, this paper proposes a dual optimization algorithm, i.e., GSAIBAS to optimize the selection of its parameters (see the specific steps in Section 3.2).
Beetle Antennae Search (BAS) algorithm is an efficient intelligent optimization algorithm proposed in 2017 [54]. Different from other bionic algorithms, BAS is a single search algorithm. It is inspired by the foraging behavior of the beetles. Each beetle has two long antennae, which contain a number of odor-receiving cells that can detect the odor of food as well as the sex pheromone of its mate. According to the difference in the concentration of odors perceived by the two antennae, the beetle randomly advances towards the side with the stronger concentration, and eventually finds the location of food through iterations. However, when the iteration reaches a certain number of times, the sharp decrease of the step length will lead to the moving components of the beetles in all directions to be too small, making it difficult to jump out of the local optimum [55,56]. The simplified search principle of BAS is shown in Fig. 1.

Figure 1: The simplified principle of BAS
In the BAS algorithm, the position of food is mapped to the optimal solution of the problem, and the odor concentration of food is mapped to the fitness function value. There are only two core steps:
Step 1. Search phase: The position of beetle and the orientation of antennae are randomly generated and normalized.
where
Step 2. Update phase: Update the position of the beetle and the distance between the two antennae.
where
3.2.2 The Improvement Strategy of BAS Algorithm
(1) Improvement 1: Step size adjustment based on Sigmoid nonlinear convergence factor and Lévy flight mutation mechanism
Because the original BAS algorithm is sensitive to the setting of parameters and its positioning accuracy is low, the results will fall into local optimum due to prematurity in the operation of multi-dimensional functions, and then the optimal solution cannot be found [57]. To address these problems, this paper firstly adjusted the fixed step size in the BAS algorithm to an adaptive adjustment step size based on Sigmoid function and Lévy flight mutation mechanism with the number of iterations, showing a nonlinear law.
1) Sigmoid function
The Sigmoid function is an S-type function common in biology that can map a real number to between 0 and 1. As the actual search process of the beetle is an extremely complex nonlinear process, the Sigmoid function is used as a nonlinear convergence factor in this paper. In the early stage, the individual degree of freedom of the population can be kept large and the global optimization ability can be enhanced. In the later stage, the individual degree of freedom decreases rapidly and the local optimization ability is strengthened. Therefore, the Sigmoid nonlinear convergence factor is used to change the fixed step size of the beetles, which can better balance the global search and the local search. The sigmoid function is shown in Eq. (7).
where

Figure 2: Trend of the convergence factor
2) Lévy flight
Lévy flight is a random flight strategy, which belongs to the non-Gaussian Markov process. Its core lies in the alternation of short-distance wandering and long-distance jumping [58]. At the beginning of iteration, long-distance flight is beneficial to break through the local optimum and perform a large-scale search. Later in the iteration, short-distance flight can facilitate gathering in a small search area. Many studies show that there are many creatures in nature, such as bees, fruit flies and other insects, whose behavior conforms to the characteristics of Lévy flight. Moreover, Lévy distribution is symmetrical, and both positive and negative numbers can be generated. Therefore, in this paper, Lévy flight is used to generate direction and step size, and the specific formula is shown in Eq. (9).
where
where
where
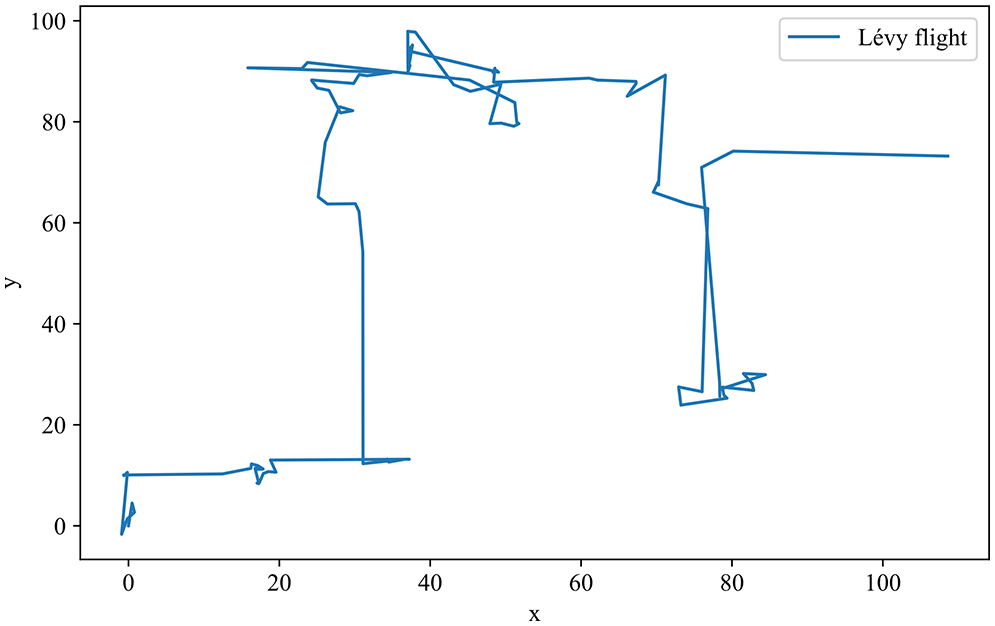
Figure 3: Simulation of Lévy flight trajectory
Therefore, this paper replaces the fixed step size in the original BAS algorithm with the Sigmoid nonlinear convergence factor
(2) Improvement 2: A dual search mechanism based on the fusion of improved BAS algorithm and GSA
This paper integrates the improved BAS algorithm with the golden sine algorithm (GSA) by using the former to conduct a second search near the optimal solution found by the latter. Through the GSA guidance mechanism, the population range is divided and the search room is reduced by the golden ratio, so that the beetles can quickly approach the best search area. This combination not only increases the richness of BAS, but also enhances the search ability and efficiency of the GSA, leading the algorithm to jump out of local optimum. GSA is a new metaheuristic algorithm proposed by Tanyildizi et al. in 2017 [60]. According to the relationship between the sine function and the unit circle, this algorithm traverses every point on the unit circle along the same search route on the sine function. At the same time, the golden ratio is introduced in the position update to narrow the range of the solution and improve the search speed of the algorithm. The core step of the algorithm is the position update: Firstly, the positions of
where
In this paper, the initial values of
Then, on the basis of calculating fitness, the idea of tabu search is introduced, and the search value is judged according to the greedy strategy (see Eq. (17)). Compare the fitness values of the original GSA and the second search position of the improved BAS algorithm. If the performance of the second search position is better, replace the original position. Otherwise, do not replace, so as to obtain the final optimal position, which effectively improves the accuracy of the search.
where
3.2.3 Implementation Steps of the GSAIBAS Algorithm
Step 1. Initialize the algorithm parameters, including the number of iterations MaxIter, the search dimension dim, and population size pop.
Step 2. Randomly initialize the population according to the setting ranges of the parameters, calculate individual fitness function values, and find the global optimal solution.
Step 3. Update the individual positions and the corresponding fitness values by Eq. (14) to obtain the optimal individual.
Step 4. Calculate the step length of the beetles according to Eq. (12), perform a second search and update the optimal individual position obtained in Step 3 through Eq. (13), and calculate the fitness value.
Step 5. Compare the fitness function values of the left and right antenna according to Eq. (16), get the position after the second update and judge whether the position exceeds the parameter range set in Step 2, if so, output the optimal solution that did not exceed the boundary last time, otherwise, continue down.
Step 6. Use the greedy strategy to judge the final optimal individual position by Eq. (17). If it is better after the second search, the current individual will be replaced, otherwise, not be replaced.
Step 7. Determine whether the maximum number of iterations of the GSAIBAS algorithm is reached, and if it is reached, output the optimal individual position and optimal fitness value; otherwise, go to Step 3 and continue.
3.3 Early-Warning Model Based on GSAIBAS-CatBoost
This paper uses the GSAIBAS algorithm proposed in Section 3.2 to obtain the best parameter combination of CatBoost, and then establishes a credit card customer churn warning model based on GSAIBAS-CatBoost. First of all, among some important parameters of the CatBoost algorithm in Table 1, three most critical parameters are selected for optimization: learning_rate, depth and l2_leaf_reg. Theoretically, the gradient enhancement function can be strengthened, and the prediction ability can be significantly improved. Then, the pre-processed training data set is input to model the credit card customer churn, and the obtained model is tested by the test data set. Since in the classification models, ROC curve and AUC value are often used as indicators of how well a model fits. Especially in the scenario of where the number of positive and negative samples is unbalanced, the AUC value can be used to comprehensively measure the pros and cons of the classifiers. Therefore, we choose AUC value as the fitness function in the GSAIBAS algorithm.
The implementation steps of the GSAIBAS-CatBoost model are as follows:
Step 1. Data preprocessing: Input the acquired credit card customer churn data set, and perform data cleaning, including operations such as deleting redundant features, processing missing values and variable encoding.
Step 2. Feature selection: Use XGBoost algorithm to filter features.
Step 3. Data set segmentation: The processed sample data set is divided into training data set and test data set according to the ratio of 7:3.
Step 4. Imbalance processing: Use the SMOTETomek algorithm to balance the data distribution on the training data set, and input the balanced training samples into the CatBoost model.
Step 5. Initialization the parameters: GSAIBAS: pop, MaxIter, dim; CatBoost: learning_rate, depth, l2_leaf_reg.
Step 6. Optimal selection: Optimal combination of the three parameters of CatBoost is selected according to Steps 2–6 of the GSAIBAS algorithm in Section 3.2.3.
Step 7. Determine the termination condition: Determine whether the maximum number of iterations of the GSAIBAS algorithm is reached, and if it is, output the optimal solution of learning_rate, depth, l2_leaf_reg and the corresponding optimal AUC value; if not, continue to iterate.
Step 8. Model testing: The optimal solution and the test data set obtained at the end of iteration are input into the CatBoost model, and the prediction results of customer churn are output.
The specific flowchart of GSAIBAS-CatBoost model is shown in Fig. 4.

Figure 4: The implementation flowchart of GSAIBAS-CatBoost model
In this paper, based on data mining methods, the data set of credit card customer obtained from the Analyttica official platform (https://leaps.analyttica.com/) is selected for empirical analysis. In order to make the source data set better suitable for machine learning classification models, the data is preprocessed firstly, including removing redundant features, processing missing values and variable coding. Secondly, correlation analysis is performed to initially explore the correlation between customer features, and the XGBoost algorithm is used to calculate variable importance scores of variables for feature selection. Then the SMOTETomek algorithm is used to balance the data so that the distribution between churn and non-churn customers is balanced. Finally, the processed training data set is input to construct an early-warning model via GSAIBAS-CatBoost for customer churn.
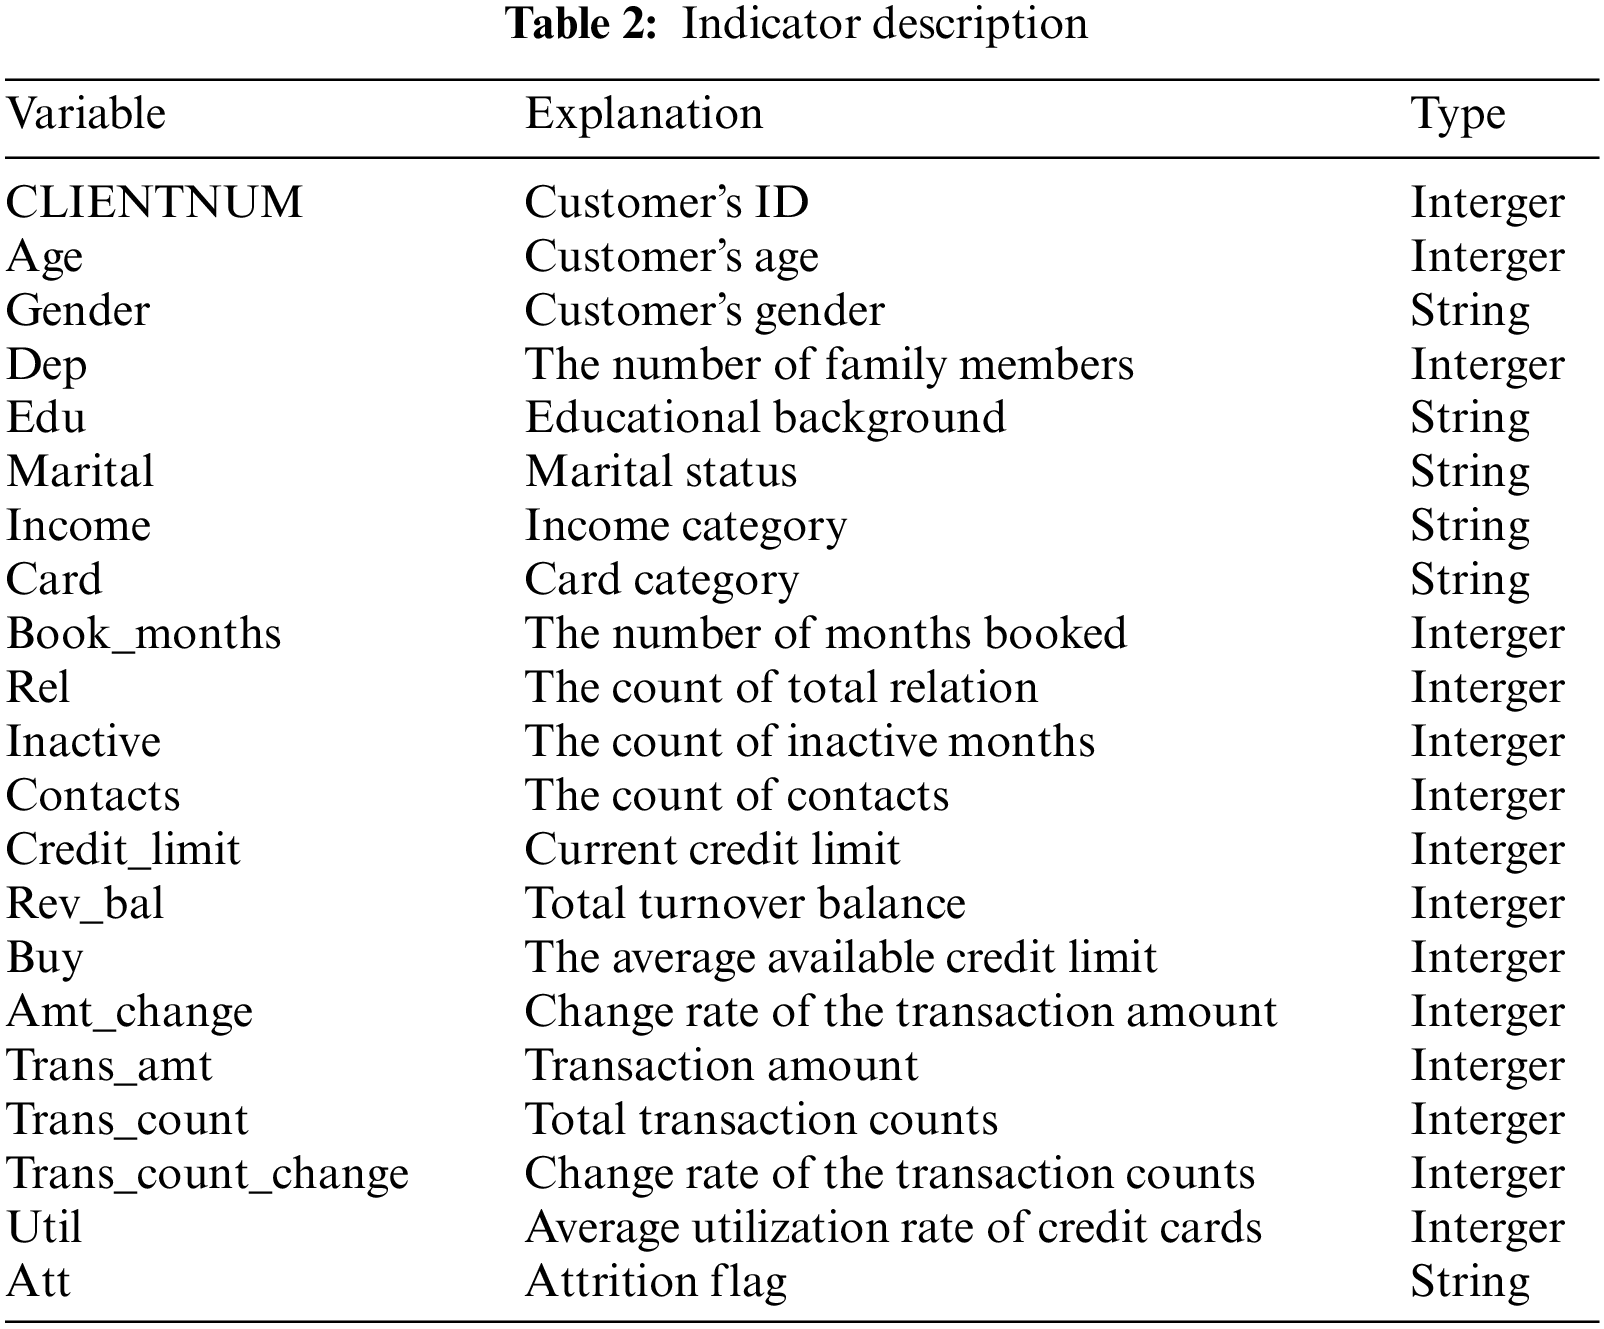
The data set used in this paper is the historical consumption records of credit card users of a foreign bank during the two years from 2015 to 2017, with a total of 10,127 pieces of data and 21 variables, including the demographic information, accounting information and behavioral information of users. Among them, 1,627 pieces of data are churn credit card customer and 8,500 pieces of data are existed credit card customer. Except the target variable, there are 20 features in the whole data set excluding the target variable “att” including 9 categorical characteristics (gender, dep, edu, marital, income, card, book_months, inactive and contacts). The specific index description is shown in Table 2.
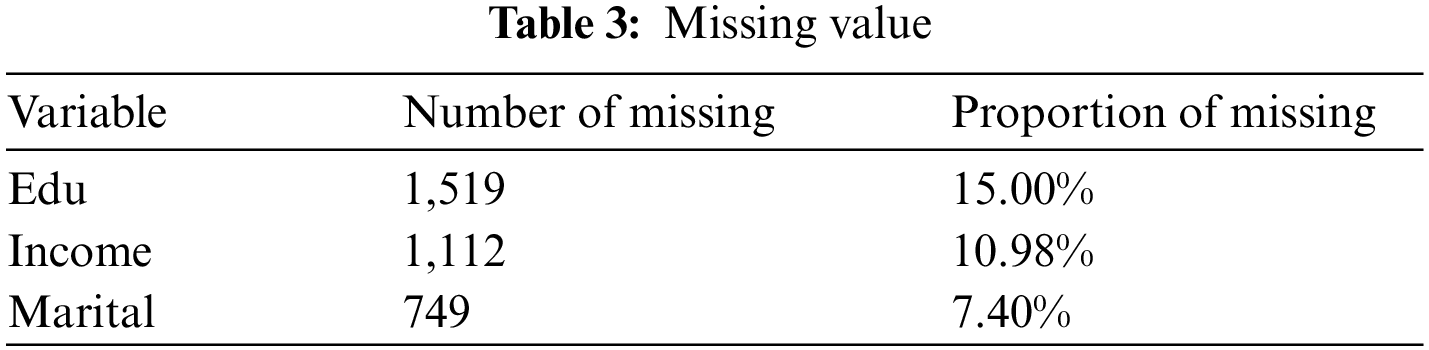
In this paper, the pre-processing of data mainly includes the operations of removing redundant features, missing value processing and variable coding. Since the feature “CLIENTNUM” only distinguishes different customers and has no correlation with other features, it is deleted. Through data screening, it is found that there are missing values in this data set. The statistical results of features with missing values are shown in Table 3. And these three features are retained because the percentage of missing values is not large. However, there are significant differences among different customers in education level, income type and marital status, and conventional methods such as mean and mode filling are not applicable for processing. Therefore, we adopt the random forest regression algorithm [62,63] to fill in the missing data to improve the accuracy of missing value filling. In view of the fact that the language variables cannot be quantitatively analyzed in the data analysis process, linguistic variables such as customer gender, marital status and education background that in the data set are coded.
For the gender, the number 0 represents male and 1 represents female. For the marital status, the number 1 represents single, 2 represents married, and 3 represents divorced. The three sequential variables of education level, income type and credit card type are coded in ascending order. Since this paper focuses on the churn customers, attrition is regarded as a positive class (label = 1).
For the above 20 pre-selected indicator variables that affect credit card customer churn, it is necessary to further determine which indicators have a greater impact on customer churn to help decision makers make better judgments. Since multicollinearity may exist among variables, if all independent variables are used in the modeling of linear regression or logistic regression, the model coefficients will not accurately express the effects of the independent variables on the dependent variable. Therefore, the variables with strong correlation should be identified and removed. Since the Pearson correlation coefficient can describe the close relationship between two fixed distance variables, it is used in this paper to analyze the correlation between features (see Fig. 5 for the Pearson correlation coefficient matrix). We know that correlation coefficient between 0.7 and 1.0 indicates a particularly strong feature correlation and between 0.7 and 0.8 is strong. As can be seen from Fig. 5, the Pearson correlation coefficient between the buy and credit_limit is 1; the correlation coefficient between the two characteristic variables of Trans_amt and Trans_count in the past 12 months is 0.81; there is also a relatively high correlation between Book_months and age, with a Pearson correlation coefficient of 0.79; there is also a strong negative correlation between income and gender. Through analysis, we found that there are two derived features: rev_bal = credit_limit − buy, util = rev_bal/credit_limit.

Figure 5: Pearson correlation coefficient heat diagram
In order to further detect the importance of features for the construction of classification model, XGBoost algorithm [64,65] in Sklearn module is used to calculate the frequency of use of feature variables (see Fig. 6 for variable scores). This method can reduce feature dimension and improve training efficiency without losing training accuracy. The higher the frequency of using feature variables, the more important the feature variables are to classification prediction. Therefore, according to Fig. 6, we can see Trans_amt and Amt_change have a significant impact on credit card customer churn prediction, while the demographic information of users, such as gender, marital status and income type have a small impact. Combined with the above analysis, we choose to delete the variable buy, util, Trans_count, Book_months, and, card and gender that rank lower. Therefore, a total of 6 variables are removed through feature selection. In other words, there are 13 features retained for subsequent model establishment finally.

Figure 6: Feature importance score
The imbalance ratio of churn customers to non-churn customers in the source data set of this paper is as high as 1:5. If we directly use the imbalanced data set for training, even though the overall accuracy of the model is high, the minority samples are easy to learn incompletely, resulting in low classification accuracy of minority samples, and the loss caused by misjudgment of minority samples is far more serious than that caused by majority samples, so we should balance the data set. Firstly, the data set is divided into training set and test set according to the ratio of 7:3. In the training set, there are 1,131 churners and 5,957 non-churners. Then we use SMOTETomek comprehensive sampling method [65], which combines with the advantages of SMOTE and Tomek Links algorithm, to oversample the churn customers. After sampling, both majority class and minority class samples have 5,775 items, and the ratio changes to 1:1. The data distribution before and after sampling is shown in Fig. 7. The SMOTETomek algorithm overcomes the shortage that the number of churners is far less than that of non-churners.

Figure 7: Comparison before and after SMOTETomek sampling
4.5 Evaluation Index of Model Performance
In the classification task with imbalanced data, the classification accuracy as a model performance metric will lead to a low recognition rate for fewer classes of samples, which cannot reflect the performance of the classifier well. Therefore, in order to better measure the effect of the model under unbalanced data sets, this paper uses various evaluation indexes, such as confusion matrix, Precision, Recall, F1 score and area under ROC curve (AUC). In addition, considering the importance of identifying churn customers and comprehensively measuring the prediction accuracy of classifier, we will pay more attention to the recall and AUC value of model prediction.
4.5.1 Confusion Matrix and Related Indexes
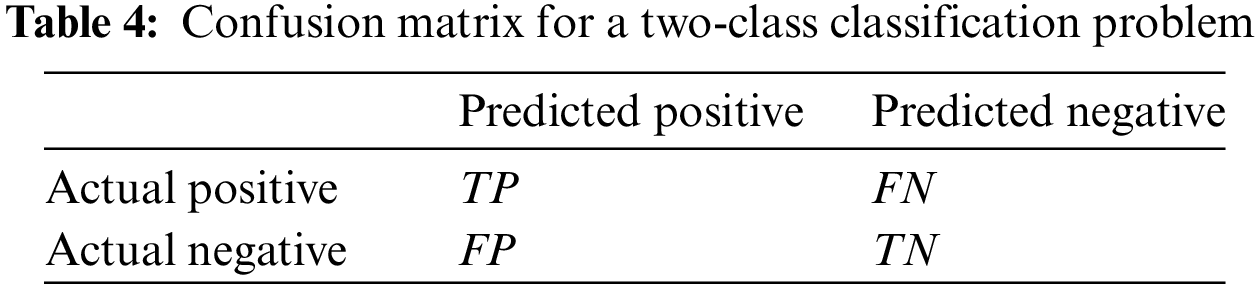
Confusion Matrix is often used as an evaluation index for prediction model accuracy [66,67]. The confusion matrix of the binary classification results is shown in Table 4, where TP (True Positive) represents the number of real churn customers in the data set and the model classification result is also churn; FN (False Negative) represents the number of real churn customers in the data set but the model classification result is non-churn; TN (True Negative) represents the number of real non-churn customers in the data set and the model classification result is also non-churn; FP (False Positive) represents the number of real non-churn customers in the data set but the model classification result is churn.
(1) Accuracy
Accuracy represents the ratio of the number of correctly predicted samples in the data set (including both churners and non-churners) to the total number of samples, and the calculation Equation is shown in Eq. (18).
(2) Recall
Recall refers to the percentage of churn customers that are correctly identified. A classifier with a high recall will focus on as many churn customers as possible to avoid misclassifying churn customers as non-churn customers.
(3) Precision
Precision is the ratio of the number of correctly classified churn customers to the number of all customers predicted to be churn. A classifier with a high precision will avoid misclassifying non-churn customers as churn customers.
(4) F1 score
F1 score is a comprehensive measure commonly used as an evaluation model with the following Eq. (21).
The receiver operating characteristic curve is referred to as ROC curve, which measures the model performance by plotting the probability distribution of TPR and FPR [64,68]. Among then, the vertical axis TPR represents the proportion of all churn customers correctly judged as churn: TPR = TP/(TP + FN); and the horizontal axis FPR represents the percentage of all non-churn customer samples incorrectly judged as churn: FPR = FP/(FP + TN). When the model predicts better, the ROC curve initially climbs faster and can rise to the high point rapidly. The AUC value is the area covered under the ROC curve, and the calculation Equation is as follows:
where
5 Experimental Results and Analysis
In this section, we analyze the results of the constructed GSAIBAS-CatBoost based on the data set processed as described above. First, in order to verify the predictive performance of the GSAIBAS-CatBoost model, we compare it with eight common machine learning models. Then, this paper also compares GSAIBAS-CatBoost model with BAS-CatBoost, GSA-CatBoost, SOA-CatBoost, WOA-CatBoost, and SSA-CatBoost to further verify the improvement of the accuracy of the proposed GSAIBAS optimization algorithm for CatBoost. Moreover, to prove its generalizability in the field of customer churn prediction, it is also applied to two other imbalanced customer data sets Churn and Telechurn on the official website of Kaggle. All of the above simulations are performed in the Python environment.
5.1 Comparison of Common Classification Models
5.1.1 Prediction Result of Classification Model
The input training data set is used to train machine learning models such as K-Nearest Neighbor (KNN), Support Vector Machine (SVM), Decision Tree (DT), Logistic Regression (LR), Random Forest (RF), Gradient Boosting Decision Tree (GBDT), XGBoost, LightGBM, and CatBoost [69], respectively. In order to facilitate comparison, we set the hyperparameter settings of all nine classification models as the default values. The evaluation metrics such as accuracy, recall and precision of the above nine classification models for credit card customer churn prediction are given in Table 5. It can be clearly seen from the Table 5 and Fig. 8 that, the classification Accuracy, Recall, F1 score and AUC value of the CatBoost model are significantly higher than those of the other eight models under the default parameter settings. For the precision, the random forest performs better. Therefore, in general, the CatBoost model has the best binary classification performance among the common machine learning models, which also proves that make CatBoost as the main model in this paper can effectively identify churn customers.
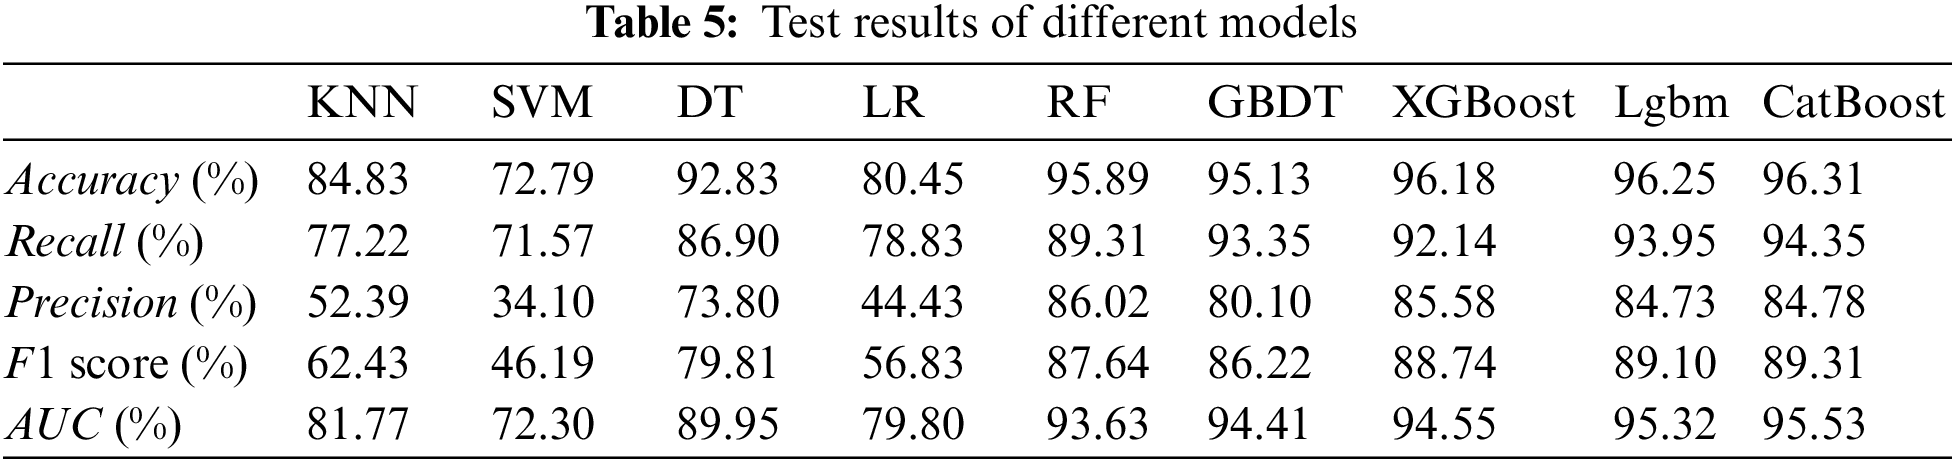

Figure 8: ROC curves comparison
5.1.2 Prediction Results of GSAIBAS-CatBoost Model
In our proposed model, we use an improved swarm intelligence optimization algorithm (GSAIBAS) to optimize the parameters of CatBoost algorithm to improve the classification accuracy. In this experiment, for the credit card customer data set, the detailed parameters of the GSAIBAS-CatBoost model are set as follows: pop = 15, MaxIter = 100, dim = 3 in the GSAIBAS algorithm, loss_function = CrossEntropy, cat_features = [0, 1, 2, 3, 5, 6, 7] in the CatBoost algorithm. The value ranges of optimization parameters in the GSAIBAS-CatBoost model are set as follows: depth: (4, 12), learning_rate: (0.03, 0.3), l2_leaf_reg: (3, 15).
Table 6 shows the comparison results of various indicators between the CatBoost model and GSAIBAS-CatBoost model. As can be seen from the table, the optimal fitness (AUC) obtained in the experiment is 96.1503% and the optimal solutions are: depth = 4, learning_rate = 0.10, l2_leaf_reg = 3. Compared with the CatBoost model under the default parameter settings, the GSAIBAS-CatBoost model has improved in all indicators, and the Accuracy, Recall, Precision, F1 score and AUC value have increased by 0.23%, 1.21%, 0.32%, 0.72% and 0.62%, respectively. Among them, the increase of Recall and AUC value are most obvious. This also proves that the GSAIBAS algorithm has strong parameter optimization ability for CatBoost algorithm.

5.2 Performance Evaluation of GSAIBAS Algorithm
In order to further verify the effectiveness of GSAIBAS algorithm in parameter optimization of CatBoost algorithm, this paper compares GSAIBAS algorithm with the original BAS algorithm, GSA and three other popular swarm intelligence optimization algorithms in recent years, such as seagull optimization algorithm (SOA), whale optimization algorithm (WOA) and sparrow search algorithm (SSA). Among them, Gaurav et al. put forward SOA in 2019 according to the migration behavior and attack behavior characteristics of the seagulls in nature [70], which has strong global search ability and local search ability; WOA simulates the hunting behavior of humpback whales, which has the advantages of simple operation, few adjustment parameters and strong ability to jump out of local optimum [71,72]. SSA was proposed by sparrows’ foraging behavior and anti-predation behavior. This algorithm is novel and has the advantages of strong optimization ability and fast convergence speed [73–75]. Therefore, the parameter optimization performance of GSAIBAS algorithm can be effectively verified by comparing the results of GSAIBAS algorithm with those of the above five optimization algorithms for CatBoost algorithm.
To ensure the fairness of the comparison experiments, we assume that BAS algorithm iterates 100 times for one beetle. Except for the BAS algorithm, the parameters of the other four optimization algorithms, such as population number and iteration times, and the selection of optimization parameters and the setting of value range in CatBoost algorithm are consistent with Section 5.1.2. Furthermore, two evaluation indexes, AUC and Recall, are used to measure the prediction performance of GSAIBAS-CatBoost and BAS-CatBoost, GoldenSA-CatBoost, SOA-CatBoost, WOA-CatBoost and SSA-CatBoost, where the AUC value is the fitness function value in each intelligent optimization algorithm. The higher these two indicators are, the more effectively the model can identify potential customers, and the better the classification and prediction ability. The optimization results of each optimization algorithm obtained by the experiment are shown in Table 7.
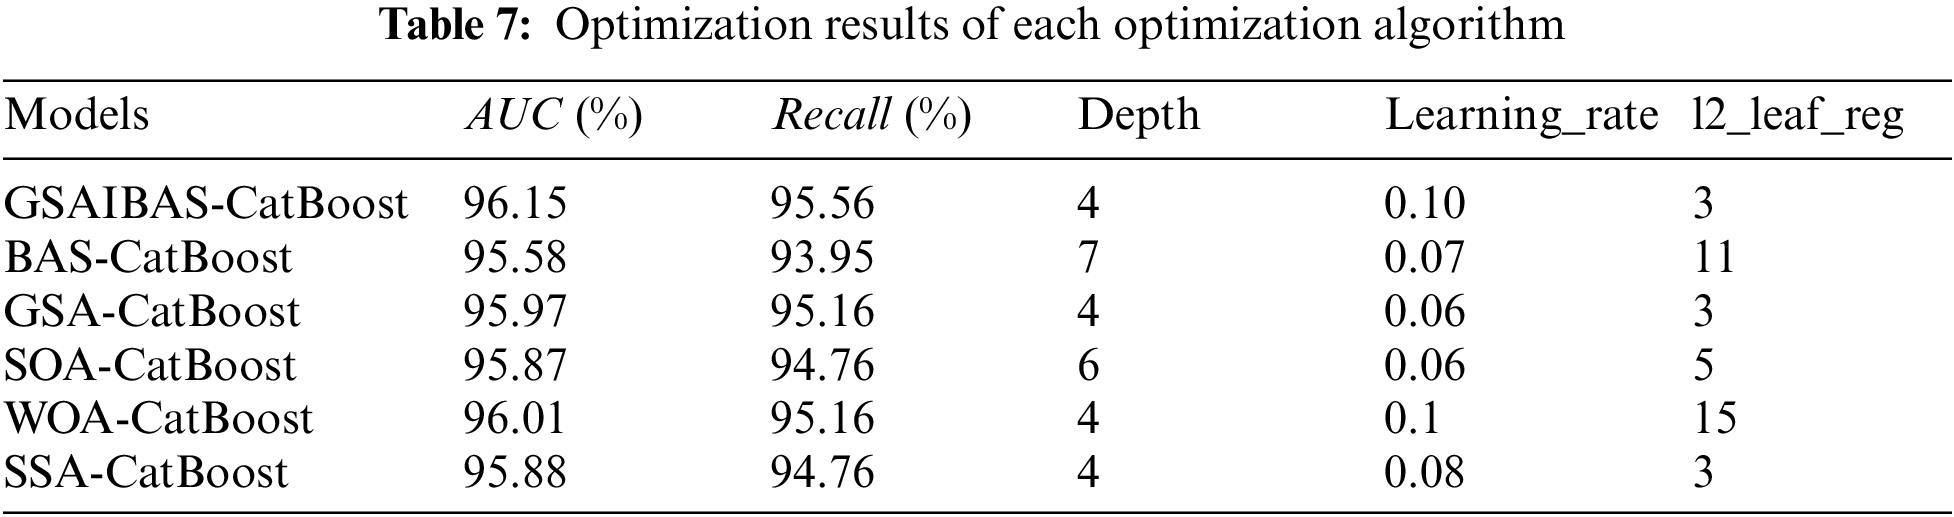
The results show that the six optimization algorithms have different optimization results for the parameters of CatBoost algorithm. Moreover, the GSAIBAS-CatBoost model proposed in this paper has the highest fitness function value (96.15%) under the optimal parameter combination. Fig. 9 shows the Recall and AUC value of the test set of six classification prediction models under the optimal parameter combination. By the comparison, we also find that the improved algorithm proposed in this paper is obviously the best. This shows that GSAIBAS algorithm can effectively improve the prediction ability of CatBoost model, and has better optimization performance for parameters of CatBoost model compared with other optimization methods. Therefore, GSAIBAS algorithm can be used to optimize the CatBoost model to obtain better classification performance.

Figure 9: Recall and AUC value
Fig. 10 shows the parameter optimization curves of the above six optimization algorithms. As can be seen from Fig. 10, the evidence shows that the improvement of the prediction accuracy of the CatBoost model by the BAS algorithm is minimal, and the fitness function value of the 13th iteration reaches 95.58% and it falls into the local optimum. The GSA-CatBoost model performs better, reaching a prediction accuracy of 95.81% after 30 iterations, which is broken at the 45th iteration and finally stabilized at 95.97%. While the WOA-CatBoost model quickly reaches the optimal value of 96.01% at the 5th iteration of the algorithm, and then remains unchanged. The AUC value of SOA-CatBoost model also reaches the optimal solution 95.87% after 14 iterations. The individual fitness of the sparrows reaches 95.88% after 30 iterations of SSA-CatBoost model. In contrast, the AUC value of the GSAIBAS algorithm proposed in this paper reaches 96.12% after 9 iterations, and then it jumps out of the local optimum at the 28th time, and the optimal value reached 96.15% after converging, which is significantly better than the others. It is proved that the GSAIBAS algorithm has a certain improvement in solving speed and accuracy. Moreover, its local mining capacity is better in optimizing the parameters of CatBoost.

Figure 10: Optimization curves
5.3 Further Validation of the Model
In order to ensure the feasibility and universality of GSAIBAS-CatBoost model, the other two customer churn data sets Churn (https://www.kaggle.com/mathchi/Churn-for-bank-customers) and Telechurn (https://www.kaggle.com/barun2104/telecom-churn) from Kaggle data platform are selected for verification belonging to banking and telecommunications respectively. Among them, the data set Churn contains 10,000 pieces of customer data and 10 feature variables, including 5 classification features, and the imbalanced ratio between churners and non-churners is about 1:5; the data set Telechurn contains 3333 customer data and 10 feature variables, including 2 classification features, and the imbalanced ratio is about 1:6.
Firstly, the above two unbalanced data sets are simply preprocessed. For the data set Churn, the redundant features “CustomerId” (customer’s ID information) and “Surname” (customer’s name) are deleted. After data screening, we find that there are no missing values in this data set; For the data set Telechurn, there is no need for any preprocessing. Then the two unbalanced data sets are divided into training set and test set according to the ratio of 7:3, and the training set is balanced by SMOTETomek algorithm, so that the imbalanced ratio becomes 1:1. Finally, the training sample set is input to train the CatBoost model with the default parameters. In order to further improve the prediction accuracy of the model, the original BAS algorithm and GSA before fusion and the GSAIBAS algorithm proposed in this paper are used to optimize the parameters of the CatBoost algorithm, determine the optimal parameter combination, and establish BAS-CatBoost, GSA-CatBoost and GSAIBAS-CatBoost models, respectively. In this experiment, for the convenience of comparison, we also set BAS algorithm to iterate 100 times for a beetle. Except for BAS algorithm, the parameters such as population number and iteration times of the other four optimization algorithms, as well as the selection and range setting of optimization parameters in CatBoost algorithm are consistent with Section 5.1.2. The prediction performance evaluation indexes of each model still choose AUC value and Recall.
Table 8 and Fig. 11 show the test results of each data set. The number of training samples in Table 8 is the total number of samples obtained by sampling. Combined with the experimental results, it can be seen that in the data set Churn, the AUC value and Recall of the GSAIBAS-CatBoost model are increased by 0.91% and 2.57% respectively compared with the CatBoost model with default parameters, and are also improved compared with BAS-CatBoost and GSA-CatBoost models. In the data set TeleChurn, the improvement of the two evaluation indexes is more obvious. Compared with CatBoost model, GSAIBAS-CatBoost model improves the AUC by 2.91% and the Recall by 9.09%. Moreover, compared with the original BAS algorithm, the GSAIBAS intelligent optimization algorithm proposed in this paper improves the AUC value and Recall by 1.87% and 9.09%, respectively. Compared with GSA, the AUC value and Recall are increased by 1.11% and 4.89%, respectively. Therefore, the GSAIBAS-CatBoost model not only has a good prediction effect on the customer churn of credit cards studied in this paper, but also has a good prediction effect on the customer churn of other banks and other industries. That is to say, the early warning model of customer churn proposed in this paper is also effective in solving the problem of customer churn in other fields.


Figure 11: Comparison of the optimal fitness
With the increasingly fierce competition among major banks, how to enhance the value of existing customers and reduce customer churn has become a main task of banks. In this paper, we combine machine learning algorithm and metaheuristic method to design an early-warning model for customer churn of credit card based on GSAIBAS-CatBoost. The purpose of this study is not to propose a new algorithm, but to establish a better customer churn prediction model. After preprocessing the data, we first use the XGBoost algorithm based on gain coverage and frequency for feature reduction. Secondly, we use the SMOTETomek algorithm to balance the data distribution. Then, a GSAIBAS algorithm is proposed to optimize CatBoost to predict customer churn. In the proposed GSAIBAS algorithm, the Sigmoid function and Lévy flight mutation mechanism are introduced to change the fixed-step search into a variable-step search, which overcomes the shortcomings of the original BAS algorithm of simple parameters and easy to fall into local optimization. The improved BAS algorithm is used to perform a secondary search for the optimal location by GSA, which can effectively increase the diversity of search space and improve the convergence accuracy. From the final empirical result, we can conclude that the early-warning model for customer churn of credit card based on GSAIBAS-CatBoost proposed in this paper has high prediction accuracy and recall, which not only provides a new solution for the customer churn problem of bank credit card, but also has important significance to the service transformation of the banking industry and helps bank managers to retain customers with churn tendency. In addition, we found that the model has some generalizability when combined with other customer churn data sets.
Although the above research has made an important contribution to solving the difficult problem of customer churn prediction, there are still shortcomings in the processing of unbalanced customer data. Since the problem of customer churn is essentially a typical nonlinear, high-dimensional and unbalanced binary classification problem, the SMOTETomek comprehensive sampling method is directly used to linearly interpolate the churn customer samples in this paper without fully considering the possible problems such as overlapping category areas and data noise in the customer data set. Therefore, the blind sampling operation lacks rationality and scientificity. In the future research, we will try to balance the customer data from two aspects in practical application: data and algorithm, and consider the penalty loss difference between the churn customers and the non-churn customers when training the classification model while sampling reasonably, so as to further establish a better foundation for improving the prediction accuracy of the customer churn early warning model. In addition, with regard to the proposed GSAIBAS, to further verify the capability of the proposed method to solve real-world engineering problems, in the future work, we can test the proposed method on constrained optimization functions of the benchmark provided for the CEC2020 Real-World Constrained Optimization competition and provide the comparison with the TOP performing algorithms (SASS, COLSHADE, sCMAgES, et al.).
Funding Statement: This work is supported by the National Natural Science Foundation of China (Nos. 72071150, 71871174).
Conflicts of Interest: The authors declare that they have no conflicts of interest to report regarding the present study.
References
1. Devriendt, F., Berrevoets, J., Verbeke, W. (2021). Why you should stop predicting customer churn and start using uplift models. Information Sciences, 548(1), 497–515. [Google Scholar]
2. Slof, D., Frasincar, F., Matsiiako, V. (2021). A competing risks model based on latent dirichlet allocation for predicting churn reasons. Decision Support Systems, 146, 113541. [Google Scholar]
3. Qu, S. J., Feng, C., Jiang, S., Wei, J. P., Xu, Y. T. (2022). Data-driven robust DEA models for measuring operational efficiency of endowment insurance system of different provinces in China. Sustainability, 14(16), 9954. [Google Scholar]
4. Rao, C. J., Zhang, Y., Wen, J. H., Xiao, X. P., Goh, M. (2023). Energy demand forecasting in China: A support vector regression-compositional data second exponential smoothing model. Energy, 263(1), 125955. [Google Scholar]
5. Qu, S. J., Ma, H. R. (2022). The impact of carbon policy on carbon emissions in various industrial sectors based on a hybrid approach. Environment Development and Sustainability (in Press). https://doi.org/10.1007/s10668-022-02673-0 [Google Scholar] [CrossRef]
6. Wei, J. P., Qu, S. J., Jiang, S., Feng, C., Xu, Y. T. et al. (2022). Robust minimum cost consensus models with aggregation operators under individual opinion uncertainty. Journal of Intelligent & Fuzzy Systems, 42(3), 2435–2449. [Google Scholar]
7. Wei, X., Rao, C. J., Xiao, X. P., Chen, L., Goh, M. (2023). Risk assessment of cardiovascular disease based on SOLSSA-CatBoost model. Expert Systems with Applications, 219(9), 119648. [Google Scholar]
8. Abbaszadeh, M., Soltani-Mohammadi, S., Ahmed, A. N. (2022). Optimization of support vector machine parameters in modeling of Iju deposit mineralization and alteration zones using particle swarm optimization algorithm and grid search method. Computers & Geosciences, 165(4), 105140. [Google Scholar]
9. Fuadah, Y. N., Pramudito, M. A., Lim, K. M. (2023). An optimal approach for heart sound classification using grid search in hyperparameter optimization of machine learning. Bioengineering, 10(1), 45. [Google Scholar]
10. Cui, B. (2019). Cascade GA-CatBoost in the predictive diagnosis of gestational diabetes. Taiyuan University of Technology, Taiyuan, China. [Google Scholar]
11. Lu, H. X. (2020). Classification model of Internet of Things intrusion detection based on GWO-CatBoost. Lanzhou University, Lanzhou, China. [Google Scholar]
12. Ghiduk, A. S., Alharbi, A. (2023). Generating of test data by harmony search against genetic algorithms. Intelligent Automation and Soft Computing, 36(1), 647–665. [Google Scholar]
13. Aguila-Leon, J., Vargas-Salgado, C., Chinas-Palaciosa, C. (2023). Solar photovoltaic maximum power point tracking controller optimization using grey wolf optimizer: A performance comparison between bio-inspired and traditional algorithms. Expert Systems with Applications, 211(5), 118700. [Google Scholar]
14. Shial, G., Sahoo, S., Panigrahi, S. (2023). An enhanced GWO algorithm with improved explorative search capability for global optimization and data clustering. Applied Artificial Intelligence, 37(1), 2166232. [Google Scholar]
15. Li, M. X., Yan, C., Liu, W., Liu, X. H. (2021). An early warning model for customer churn prediction in telecommunication sector based on improved bat algorithm to optimize ELM. International Journal of Intelligent Systems, 36(7), 3401–3428. [Google Scholar]
16. Yeboah, A., Afrifa-Yamoah, E. (2023). The influence of social presence on customer loyalty in emerging market retail industry: The mediating role of trust. Journal of African Business, 6(3), 1–22. https://doi.org/10.1080/15228916.2023.2171023 [Google Scholar] [CrossRef]
17. Pu, Y. B., Zaidin, N., Zhu, Y. D. (2023). How do e-brand experience and in-store experience influence the brand loyalty of novel coffee brands in China? Exploring the roles of customer satisfaction and self-brand congruity. Sustainability, 15(2), 1096. [Google Scholar]
18. Lin, C. S., Tzeng, G. H., Chin, Y. C. (2011). Combined rough set theory and flow network graph to predict customer churn in credit card accounts. Expert Systems with Applications, 38(1), 8–15. [Google Scholar]
19. Wang, B. N., Wang, P., Tu, Y. L. (2021). Customer satisfaction service match and service quality-based blockchain cloud manufacturing. International Journal of Production Economics, 240(1), 108220. [Google Scholar]
20. Xu, X. (2021). What are customers commenting on, and how is their satisfaction affected? Examining online reviews in the on-demand food service context. Decision Support Systems, 142(3), 113467. [Google Scholar]
21. Liang, D. C., Dai, Z. Y., Wang, M. W. (2021). Assessing customer satisfaction of O2O takeaway based on online reviews by integrating fuzzy comprehensive evaluation with AHP and probabilistic linguistic term sets. Applied Soft Computing, 98(4), 106847. [Google Scholar]
22. Han, S. H., Lu, S. X., Stephen, C. H. L. (2012). Segmentation of telecom customers based on customer value by decision tree model. Expert Systems with Applications, 39(4), 3964–3973. [Google Scholar]
23. Li, Y., Chu, X. Q., Tian, D., Feng, J. Y., Mu, W. S. (2021). Customer segmentation using K-means clustering and the adaptive particle swarm optimization algorithm. Applied Soft Computing, 113(1), 107924. [Google Scholar]
24. Sun, Z. H., Zuo, T. Y., Liang, D., Ming, X. G., Chen, Z. H. et al. (2021). GPHC: A heuristic clustering method to customer segmentation. Applied Soft Computing, 111(8), 107677. [Google Scholar]
25. Wang, J., Rao, C. J., Goh, M., Xiao, X. P. (2023). Risk assessment of coronary heart disease based on cloud-random forest. Artificial Intelligence Review, 56(1), 203–232. [Google Scholar]
26. Qu, S. J., Xu, L., Mangla, S. K., Chan, F., Zhu, J. L. et al. (2022). Matchmaking in reward-based crowdfunding platforms: A hybrid machine learning approach. International Journal of Production Research (in Press). https://doi.org/10.1080/00207543.2022.2121870 [Google Scholar] [CrossRef]
27. Qu, S. J., Xu, Y., Ji, Y., Feng, C., Wei, J. et al. (2022). Data-driven robust data envelopment analysis for evaluating the carbon emissions efficiency of provinces in China. Sustainability, 14(20), 13318. [Google Scholar]
28. Wei, J. P., Qu, S. J. (2022). The novel data-driven robust maximum expert mixed integer consensus models under multi-role’s opinions uncertainty by considering non-cooperators. IEEE Transaction on Computational Social Systems (in Press). https://doi.org/10.1109/TCSS.2022.3192897 [Google Scholar] [CrossRef]
29. Nie, G. L., Rowe, W., Zhang, L. L., Tian, Y. J., Shi, Y. (2011). Credit card churn forecasting by logistic regression and decision tree. Expert Systems with Applications, 38(12), 15273–15285. [Google Scholar]
30. Caigny, A. D., Coussement, K., de Bock, K. W. (2018). A new hybrid classification algorithm for customer churn prediction based on logistic regression and decision trees. European Journal of Operational Research, 269(2), 760–772. [Google Scholar]
31. de Bock, K. W., van den Poel, D. (2011). An empirical evaluation of rotation-based ensemble classifiers for customer churn prediction. Expert Systems with Applications, 38(10), 12293–12301. [Google Scholar]
32. Vo, N. N. Y., Liu, S. W., Li, X. T., Xu, G. D. (2021). Leveraging unstructured call log data for customer churn prediction. Knowledge-Based Systems, 212(4), 106586. [Google Scholar]
33. Stripling, E., Broucke, S. V., Antonio, K., Baesens, B., Snoeck, M. (2018). Profit maximizing logistic model for customer churn prediction using genetic algorithms. Swarm and Evolutionary Computation, 40(3), 116–130. [Google Scholar]
34. Pustokhina, I. V., Pustokhin, D. A., Aswathy, R. H., Jayasankar, T., Jeyalakshmi, C. et al. (2021). Dynamic customer churn prediction strategy for business intelligence using text analytics with evolutionary optimization algorithms. Information Processing &Management, 58(6), 102706. [Google Scholar]
35. Khan, A. T., Cao, X. W., Li, S., Katsikis, V. N., Brajevic, I. et al. (2022). Fraud detection in publicly traded U.S firms using beetle antennae search: A machine learning approach. Expert Systems with Applications, 191(4), 116148. [Google Scholar]
36. Qu, S. J., Shu, L. L., Yao, J. Y. (2022). Optimal pricing and service level in supply chain considering misreport behavior and fairness concern. Computers & Industrial Engineering (in Press). https://doi.org/10.1016/j.cie.2022.108759 [Google Scholar] [CrossRef]
37. Sun, Y. T., Zhang, J. F., Li, G. C., Ma, G. W., Huang, Y. et al. (2019). Determination of young’s modulus of jet grouted coalcretes using an intelligent model. Engineering Geology, 252(4), 43–53. [Google Scholar]
38. Wu, Q., Ma, Z. P., Xu, G., Li, S., Chen, D. C. (2019). A novel neural network classifier using beetle antennae search algorithm for pattern classification. IEEE Access, 7, 64686–64696. [Google Scholar]
39. Zeng, C., Jiang, H., Bai, X. Y., Song, G. S. (2023). Study on the multi-criteria seismic mitigation optimization of a single pylon cable-stayed bridge across strike-slip fault rupture zones. Engineering Structures, 275, 115228. [Google Scholar]
40. Kou, B., Ren, D. C., Guo, S. J. (2022). Geometric parameter identification of medical robot based on improved beetle antennae search algorithm. Bioengineering, 9(2), 58. [Google Scholar] [PubMed]
41. Qian, J., Wang, P., Pu, C. G., Peng, X. L., Chen, G. G. (2021). Application of modified beetle antennae search algorithm and BP power flow prediction model on multi-objective optimal active power dispatch. Applied Soft Computing, 113(9), 108027. [Google Scholar]
42. Zivkovic, M., Bacanin, N., Venkatachalam, K., Nayyar, A., Djordjevic, A. et al. (2021). COVID-19 cases prediction by using hybrid machine learning and beetle antennae search approach. Sustainable Cities and Society, 66(3), 102669. [Google Scholar] [PubMed]
43. Xie, S., Chu, X. M., Zheng, M., Liu, C. G. (2019). Ship predictive collision avoidance method based on an improved beetle antennae search algorithm. Ocean Engineering, 192(23), 106542. [Google Scholar]
44. Fan, Q. S., Huang, H. S., Li, Y. T., Han, Z. G., Hu, Y. et al. (2021). Beetle antenna strategy based grey wolf optimization. Expert Systems with Applications, 165(5), 113882. [Google Scholar]
45. Shao, L. S., Han, R. D. (2018). Flower pollination algorithm based on beetle antenna search. Computer Engineering and Applications, 54(18), 188–194. [Google Scholar]
46. Yao, X. W., Wang, Z. X., Yao, Y., Huang, W. (2022). A dual search optimization algorithm combining improved beetle antenna search and golden sine algorithm. Journal of Chinese Computer Systems, 43(8), 1644–1652. [Google Scholar]
47. Ezugwu, A. E., Shukla, A. K., Nath, R., Akinyelu, A. A., Agushaka, J. O. et al. (2021). Metaheuristics: A comprehensive overview and classification along with bibliometric analysis. Artificial Intelligence Review, 54(6), 4237–4316. [Google Scholar]
48. Jelen, G., Podobnik, V., Babic, J. (2021). Contextual prediction of parking spot availability: A step towards sustainable parking. Journal of Cleaner Production, 312(5), 127684. [Google Scholar]
49. Abdi, J., Hadipoor, M., Hadavimoghaddam, F., Hemmati-Sarapardeh, A. (2022). Estimation of tetracycline antibiotic photodegradation from wastewater by heterogeneous metal-organic frameworks photocatalysts. Chemosphere, 287, 132135. [Google Scholar] [PubMed]
50. Bentéjac, C., Csörgő, A., Martínez-Muñoz, G. (2021). A comparative analysis of gradient boosting algorithms. Artificial Intelligence Review, 54(3), 1937–1967. [Google Scholar]
51. Ding, Y., Chen, Z. Q., Lu, W. F., Wang, X. Q. (2021). A CatBoost approach with wavelet decomposition to improve satellite-derived high-resolution PM2.5 estimates in Beijing-Tianjin-Hebei. Atmospheric Environment, 249, 118212. [Google Scholar]
52. Zhang, Y. X., Zhao, Z. G., Zheng, J. H. (2020). CatBoost: A new approach for estimating daily reference crop evapotranspiration in arid and semi-arid regions of Northern China. Journal of Hydrology, 588(1), 125087. [Google Scholar]
53. Demir, S., Sahin, E. K. (2023). Predicting occurrence of liquefaction-induced lateral spreading using gradient boosting algorithms integrated with particle swarm optimization: PSO-XGBoost, PSO-LightGBM, and PSO-CatBoost. Acta Geotechnica (in Press). https://doi.org/10.1007/s11440-022-01777-1 [Google Scholar] [CrossRef]
54. Jiang, X. Y., Lin, Z. Y., Li, S., Ji, Y. W., Luan, Y. Z. et al. (2021). Dynamical attitude configuration with wearable wireless body sensor networks through beetle antennae search strategy. Measurement, 167, 108128. [Google Scholar]
55. Yan, P. R., Zhang, Z., Hou, Q. Z., Lei, X. H., Liu, Y. et al. (2023). A novel IBAS-ELM model for prediction of water levels in front of pumping stations. Journal of Hydrology, 616(8), 128810. [Google Scholar]
56. Chen, L. H., Wang, C., Zhong, R. G., Li, Z. G., Zhao, Z. et al. (2023). Prediction of main parameters of steam in waste incinerators based on BAS-SVM. Sustainability, 15(2), 1132. [Google Scholar]
57. Wu, Q., Lin, H., Jin, Y. Z., Chen, Z. Y., Li, S. et al. (2020). A new fallback beetle antennae search algorithm for path planning of mobile robots with collision-free capability. Soft Computing, 24(3), 2369–2380. [Google Scholar]
58. Wang, Q. X., Guo, X. B. (2016). Particle swarm optimization algorithm based on Levi flight. Application Research of Computers, 33(9), 2588–2591. [Google Scholar]
59. Zhang, Y., Qin, L. X. (2020). Improved salp swarm algorithm based on Levy flight strategy. Computer Science, 47(7), 154–160. [Google Scholar]
60. Zhou, X., Zou, H. (2021). Adaptive salp swarm algorithm with hybrid variation of golden sine algorithm. Computer Engineering and Applications, 57(12), 75–85. [Google Scholar]
61. Wang, Y., Zhang, D. M., Zhang, L. N., Li, D. H., Zhou, C. C. (2021). Mayfly optimization algorithm based on golden sine and adaptive fusion. Application Research of Computers, 38(10), 3072–3077. [Google Scholar]
62. Rao, C. J., Gao, M. Y., Wen, J. H., Goh, M. (2022). Multi-attribute group decision making method with dual comprehensive clouds under information environment of dual uncertain Z-numbers. Information Sciences, 602(11), 106–127. [Google Scholar]
63. Ji, Y., Li, H., Zhang, H. (2022). Risk-averse two-stage stochastic minimum cost consensus models with asymmetric adjustment cost. Group Decision and Negotiation, 31(2), 261–291. [Google Scholar] [PubMed]
64. Injadat, M., Moubayed, A., Nassif, A. B., Shami, A. (2021). Machine learning towards intelligent systems: Applications, challenges, and opportunities. Artificial Intelligence Review, 54(5), 3299–3348. [Google Scholar]
65. Rao, C. J., Liu, Y., Goh, M. (2022). Credit risk assessment mechanism of personal auto loan based on PSO-XGBoost model. Complex & Intelligent Systems (in Press). https://doi.org/10.1007/s40747-022-00854-y [Google Scholar] [CrossRef]
66. Rao, C. J., Liu, M., Goh, M., Wen, J. H. (2020). 2-stage modified random forest model for credit risk assessment of P2P network lending to “Three Rurals” borrowers. Applied Soft Computing, 95(1), 106570. https://doi.org/10.1016/j.asoc.2020.106570 [Google Scholar] [CrossRef]
67. Rao, C. J., Wang, C., Hu, Z., Xiao, X. P., Goh, M. (2022). Gray uncertain linguistic multiattribute group decision making method based on GCC-HCD. IEEE Transactions on Computational Social Systems (in Press). https://doi.org/10.1109/TCSS.2022.3166526 [Google Scholar] [CrossRef]
68. Hand, D. J., Till, R. J. (2001). A simple generalization of the area under the ROC curve for multiple class classification problems. Machine Learning, 45(2), 171–186. [Google Scholar]
69. Huang, G. M., Wu, L. F., Ma, X., Zhang, W. Q., Fan, J. L. et al. (2019). Evaluation of CatBoost method for prediction of reference evapotranspiration in humid regions. Journal of Hydrology, 574(1), 1029–1041. [Google Scholar]
70. Cao, Y., Li, Y. Q., Zhang, G., Jermsittiparert, K., Razmjooy, N. (2019). Experimental modeling of PEM fuel cells using a new improved seagull optimization algorithm. Energy Reports, 5(1), 1616–1625. [Google Scholar]
71. Zhu, H. M., Xiao, X. P., Kang, Y. X., Kong, D. K. (2022). Lead-lag grey forecasting model in the new community group buying retailing. Chaos, Solitons and Fractals, 158(4), 112024. [Google Scholar]
72. Sheikhi, S. (2021). An effective fake news detection method using WOA-xgbTree algorithm and content-based features. Applied Soft Computing, 109(2), 107579. [Google Scholar]
73. Gao, M. Y., Yang, H. L., Xiao, Q. Z., Goh, M. (2022). A novel method for carbon emission forecasting based on Gompertz’s law and fractional grey model: Evidence from American industrial sector. Renewable Energy, 181(2), 803–819. [Google Scholar]
74. Zhang, C. L., Ding, S. F. (2021). A stochastic configuration network based on chaotic sparrow search algorithm. Knowledge-Based Systems, 220(10), 106924. [Google Scholar]
75. Chen, L., Dong, T., Nan, G. F., Xiao, Q. Z., Xu, M. et al. (2023). Impact of the introduction of marketplace channel on e-tailer’s logistics service strategy. Managerial and Decision Economics (in Press). https://doi.org/10.1002/mde.3850 [Google Scholar] [CrossRef]
Cite This Article
 Copyright © 2023 The Author(s). Published by Tech Science Press.
This work is licensed under a Creative Commons Attribution 4.0 International License , which permits unrestricted use, distribution, and reproduction in any medium, provided the original work is properly cited.
 Downloads
 Citation Tools