
 Submit a Paper
 Propose a Special lssue
 Open Access
ARTICLE
Outage Probability Analysis for D2D-Enabled Heterogeneous Cellular Networks with Exclusion Zone: A Stochastic Geometry Approach
1 School of Computer Science and Engineering, Macau University of Science and Technology, Taipa, Macau, China
2 Department of Broadband Communication, Peng Cheng Laboratory, Shenzhen, China
3 School of Artificial Intelligence, Dongguan Polytechnic, Dongguan, China
* Corresponding Author: Li Feng. Email:
Computer Modeling in Engineering & Sciences 2024, 138(1), 639-661. https://doi.org/10.32604/cmes.2023.029565
Received 27 February 2023; Accepted 08 May 2023; Issue published 22 September 2023
 View Full Text
 Download PDF
Abstract
Interference management is one of the most important issues in the device-to-device (D2D)-enabled heterogeneous cellular networks (HetCNets) due to the coexistence of massive cellular and D2D devices in which D2D devices reuse the cellular spectrum. To alleviate the interference, an efficient interference management way is to set exclusion zones around the cellular receivers. In this paper, we adopt a stochastic geometry approach to analyze the outage probabilities of cellular and D2D users in the D2D-enabled HetCNets. The main difficulties contain three aspects: 1) how to model the location randomness of base stations, cellular and D2D users in practical networks; 2) how to capture the randomness and interrelation of cellular and D2D transmissions due to the existence of random exclusion zones; 3) how to characterize the different types of interference and their impacts on the outage probabilities of cellular and D2D users. We then run extensive Monte-Carlo simulations which manifest that our theoretical model is very accurate.Keywords
As the number of wireless connected devices grows explosively in the upcoming sixth generation (6G) era [1,2], it can be foreseen that heterogeneous cellular (i.e., smartphones) and device-to-device (i.e., wearable devices) devices will densely coexist to extensively collect and frequently exchange information [3] and have widespread application prospects in many fields [4,5]. In the device-to-device (D2D)-enabled heterogeneous cellular networks (HetCNets) [6,7], D2D devices reuse the cellular spectrum, which may result in severe interference for the reception of cellular signals at the base stations (BSs). To alleviate the interference, an efficient interference management way is to set exclusion zones around the receivers [8–10]. That is, when a BS is receiving desired signals from cellular devices, the exclusion zone, defined as a cycle region, centered at the BS is set, in which the D2D devices are inhibited to perform any transmissions.
Whether the information can be successfully transmitted is an important performance metric for wireless devices. In this paper, we aim to theoretically analyze the outage probabilities (i.e., unsuccessful transmission probabilities) of cellular and D2D devices in D2D-enabled HetCNets with exclusion zone. However, we are facing the following major difficulties. First, in practical network deployment, cellular and D2D devices are randomly located in the space, while BSs are deployed with strict requirements and restrictions, the two facts affect the outage probabilities greatly. It is difficult to model the location randomness of BSs, cellular and D2D devices in practice. Second, cellular transmissions occur randomly, leading to random exclusion zones around the BS receivers, further leading to random D2D transmissions. It is difficult to capture the randomness and interrelation of cellular and D2D transmissions. Third, different types of cellular and D2D devices perform transmissions concurrently; they mutually interfere with each other. It is difficult to characterize the different types of interference and their impacts on the outage probabilities of cellular and D2D devices. The above three difficulties motivate this study.
Consider a D2D-enabled HetCNet with exclusion-zone, we theoretically analyze the outage probabilities of cellular and D2D devices and make the following novel contributions:
• We adopt a stochastic geometry (SG) approach to solve the abovementioned three difficulties. To address difficulty 1, we use Matérn hard-core process (MHCP) to model the real location distribution of BSs and use homogeneous Poisson point processes (HPPPs) to capture the location randomness of cellular and D2D devices in practical networks. To address difficulty 2, we first model the transmitting cellular devices by a thinned HPPP, and then model the activated D2D devices outside the exclusion zones by Poisson hole process (PHP). To address difficulty 3, we characterize mutual interference among the concurrent cellular and D2D transmissions by approximating MHCP of receiving BSs and PHP of activated D2D devices with PPPs and further estimating the intensities of different types of transmitting cellular and D2D devices.
• With our model, we theoretically analyze the outage probabilities of cellular and D2D devices, which are formulated as functions of system parameters, including the intensities of transmitting cellular and D2D devices, the minimum distance among BSs, and the radius of exclusion zones around BSs.
• We verify the accuracy of our theoretical model via extensive Monte-Carlo simulations.
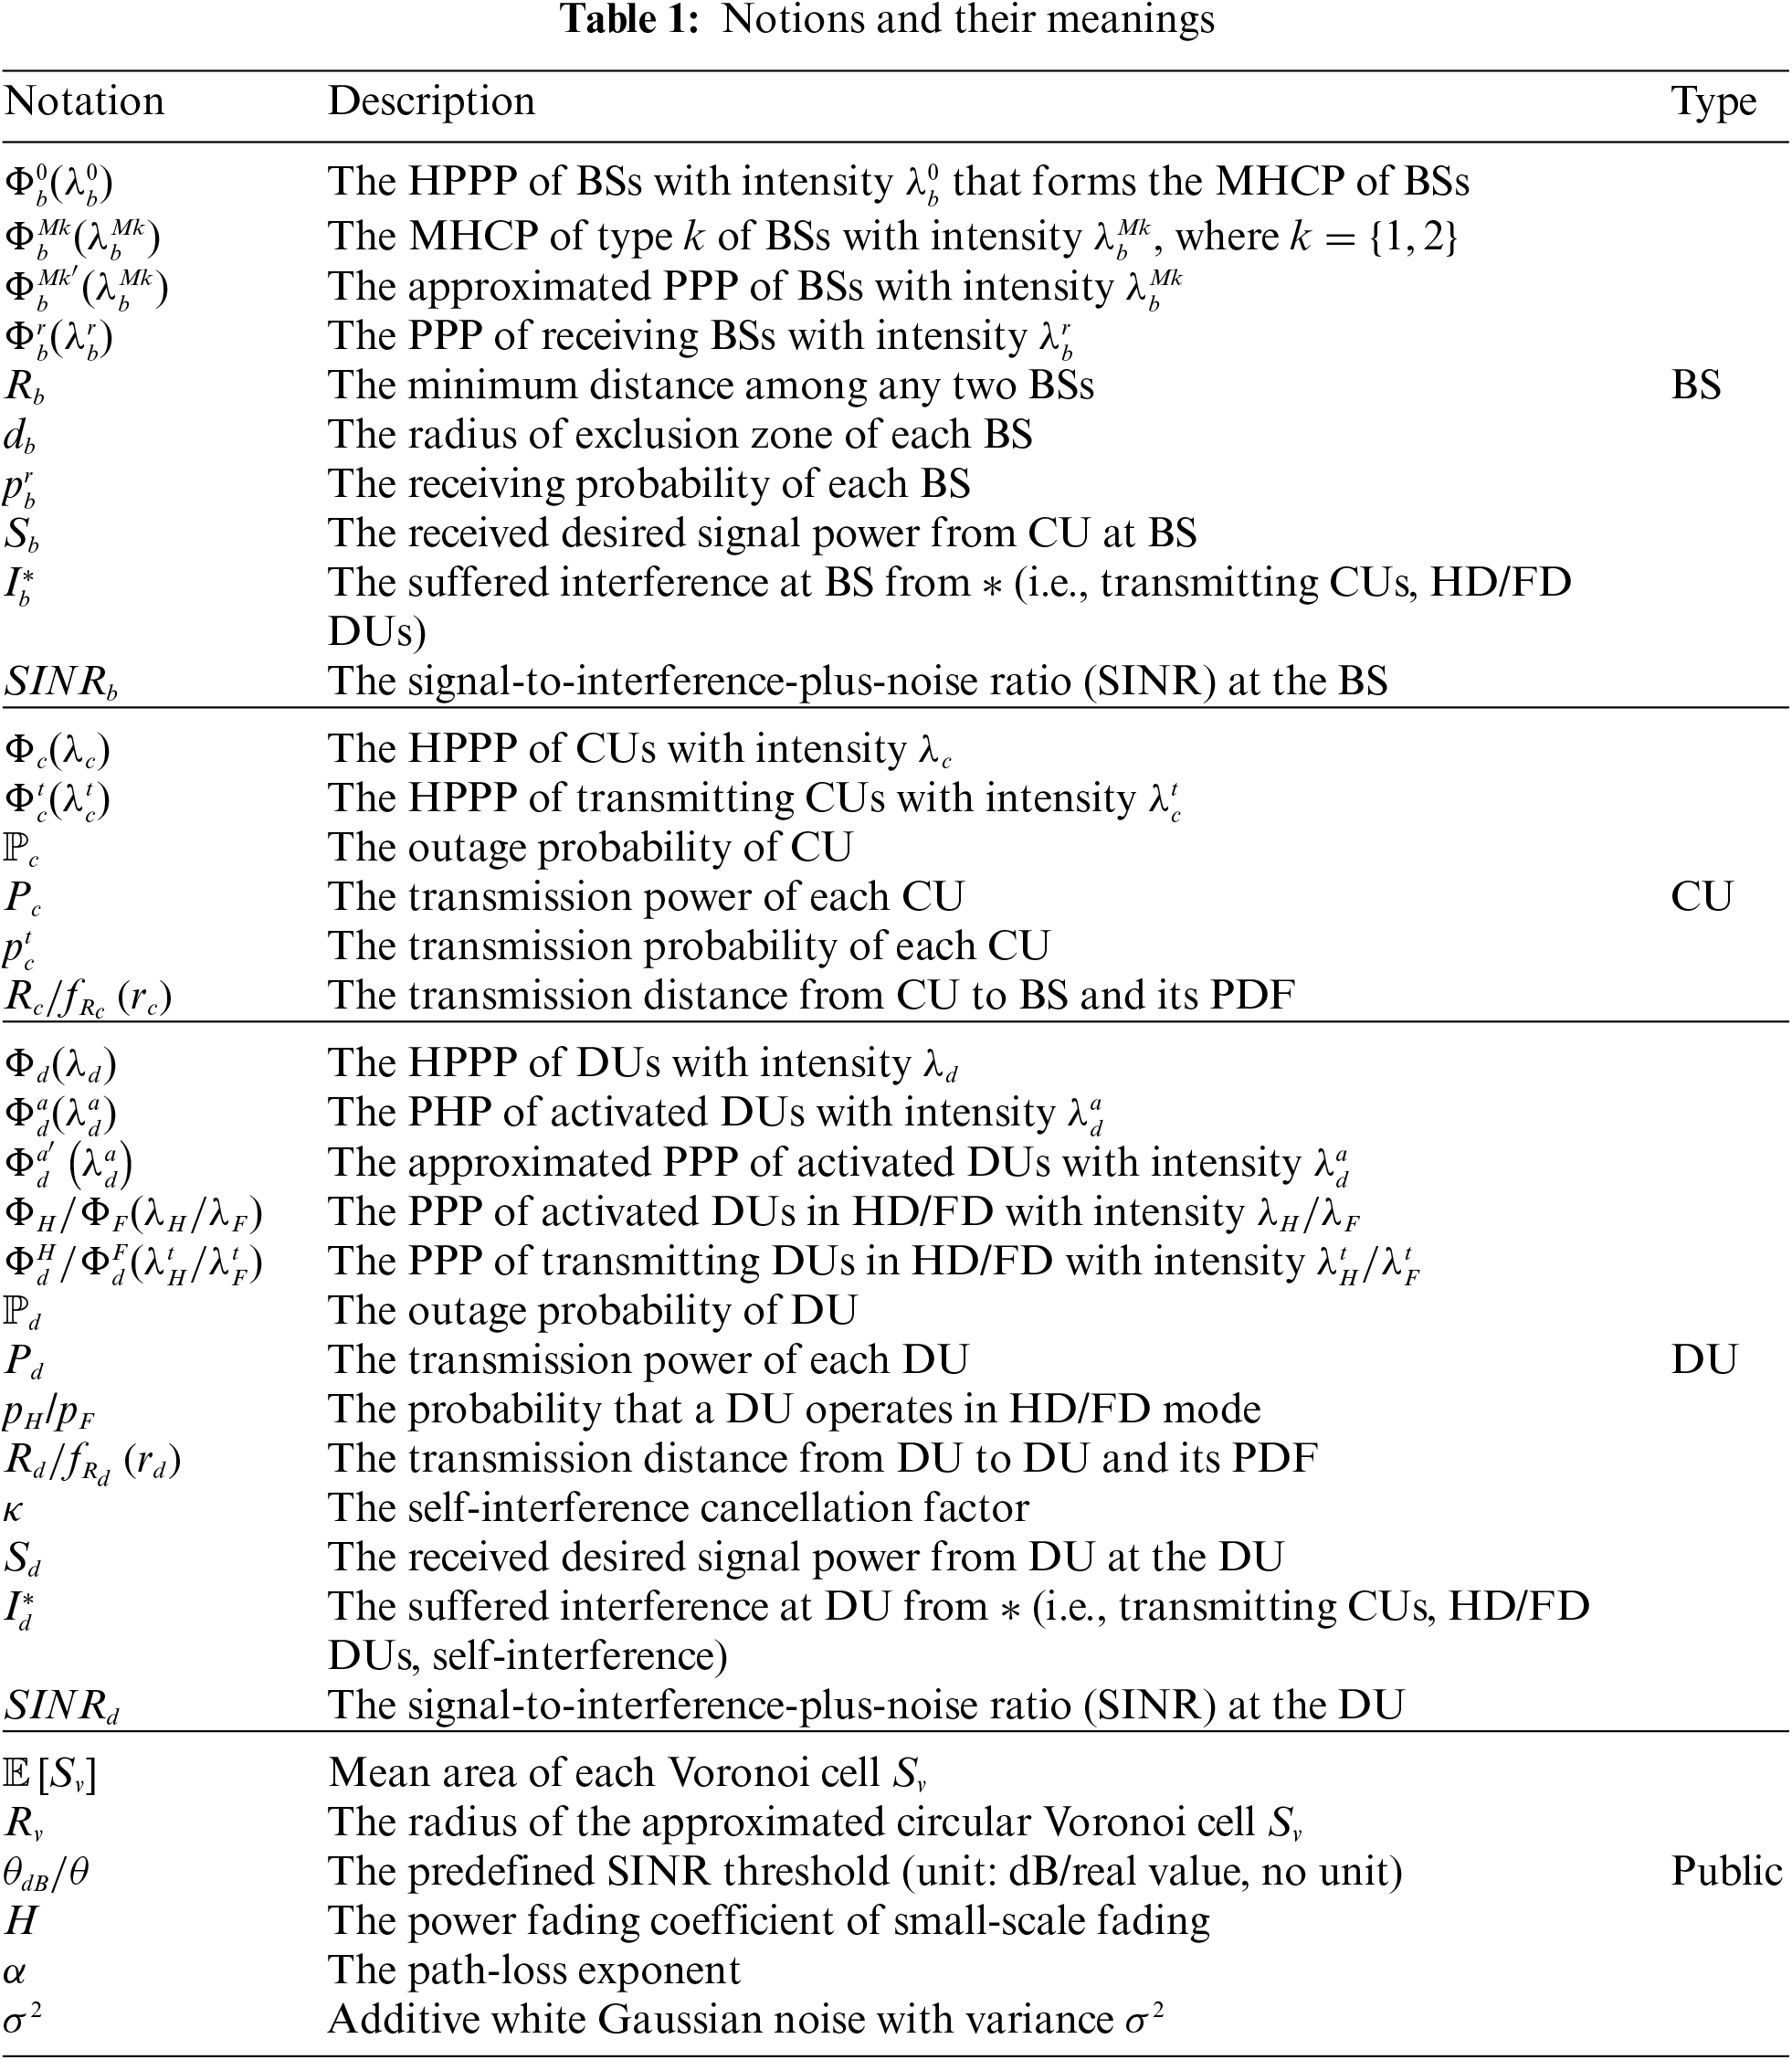
The rest paper is organized as follows. Section 2 presents the related work. Section 3 introduces some stochastic geometry preliminaries. Section 4 specifies the system model of a D2D-enabled HetCNet with exclusion zone. Section 5 theoretically analyzes the outage probabilities of cellular and D2D devices with SG approach. Section 6 verifies the accuracy of our theoretical model via extensive Monte-Carlo simulations. Finally, Section 7 concludes the paper. For the ease of reference, Table 1 lists the main notations and their meanings.
This section presents existing works in terms of performance analysis of D2D-enabled HetCNets by setting exclusion zones or enabling D2D devices to operate in half-/full-duplex mode.
Setting exclusion zones can effectively alleviate the interference among cellular and D2D transmissions. Many existing works have studied the exclusion zones set around transmitters or receivers.
Set exclusion zones around transmitters. Chu et al. in [11] adopted SG to study energy-harvesting-based D2D communication, where they set guard zones (also called exclusion zones) around D2D transmitters to protect D2D transmissions from interference emitted from the cellular devices. Flint et al. in [12] set guard zones around first-tier transmitters in two-tier heterogeneous networks, where they consider the exclusive relationship among the first-tier transmitters and model the spatial distribution of first-tier transmitters by Poisson hard-core process (PHCP). However, we study the D2D-enabled HetCNets with SG and set exclusion zones around the receivers to protect cellular transmissions from interference by D2D transmissions.
Set exclusion zones around receivers. Hasan et al. in [8] introduced guard zone around each receiver to balance the interference and spatial reuse, but this study is for wireless ad hoc networks. Tefek et al. in [9] set two types of exclusion zones around primary receivers and secondary transmitters in two-tier cognitive networks, and analyze the transmission capacities and outage probabilities of primary and secondary users with SG approach. Chen et al. in [10] studied decentralized opportunistic access for D2D underlaid cellular networks with SG and impose cellular guard zones around the BSs where no D2D transmitters can lie in, but they do not consider the minimum distance among BSs. Different from the above works, we adopt SG to study the D2D-enabled HetCNets and consider the exclusive relationship among BSs in practical networks. Besides, D2D devices can operate in half-/full-duplex mode optionally. The performance frameworks in the above works are not suitable in our research scenario.
2.2 Operate in Half-/Full-Duplex Mode
Despite the HD mode, each DU can operate in FD mode optionally to further promote to double the spectral efficiency. Some previous works analyze the performance of HD/FD D2D transmissions.
Operate in HD mode. Huang et al. in [13] studied the energy-efficient mode selection for D2D communications in cellular networks, which enable HD D2D users to select approximated modes, and then analyze the success probability and ergodic capacity for both cellular and D2D links using SG. Sun et al. in [14] controled the transmit power for D2D transmitters based on the statistical channel-state information to mitigate interference among D2D and cellular communications in D2D-underlaid cellular networks, and adopt SG to analyze the success probability and the energy efficiency of D2D communications. In contrast, we analyze the D2D transmissions where D2D devices can operate in HD/FD mode optionally, and we employ exclusion zones around the BS receivers to alleviate the interference.
Operate in FD mode. Badri et al. in [15] and [16] studied FD D2D communication in cellular networks, which enable D2D users to optionally work in HD/FD mode to alleviate the interference and guarantee the quality of service (QoS) of the cellular users. However, they do not consider the real deployment of BSs. Different from the above works, our study captures the location randomness of BS, cellular and D2D devices in real networks, the randomness and interrelation of cellular and D2D transmissions as well as the mutual interference and characterize their impacts on the outage probabilities of cellular and D2D transmissions.
3 Stochastic Geometry Preliminaries
Stochastic geometry (SG) approach, which provides various powerful tools to model the spatial location distribution of wireless devices and characterize the interference effect, has been widely used in wireless networks [17]. Many existing works [15,16,18] adopted homogeneous Poisson point process (HPPP) to model the spatial distribution of the wireless devices, which assumes devices are independently distributed and is the most popular spatial point process owing to its mathematical tractability. However, in practical networks, the transmitters are deployed with strict requirements and restrictions in order to alleviate interference, extend coverage region and reduce deployment costs, and thus an exclusion zone among the locations of the transmitters naturally arises. In this context, hard-core point process (HCPP) [12,19,20], which forbids devices to lie closer than a certain minimum distance has drawn much attention, such as PHCP [12] or MHCP [19,20]. According to whether there is a practical exclusive relationship among devices, we assume that the D2D and cellular users follow HPPPs and assume that base stations follow MHCP in our study. Below, we briefly present some terminologies and SG tools involved in this paper. Readers can refer to [21–24] for further details.
Definition 1. (Poisson point process) A spatial point process
where
Definition 2. (Matérn hard-core process of type I) An MHCP of type I
where
Definition 3. (Matérn hard-core process of type II [25]) An MHCP of type II
The probability that each point
Definition 4. (Poisson hole process) Let
Definition 5. (Probability generating functional) Let
where
For an HPPP with intensity
We convert the above integral from orthogonal coordinates to polar coordinates, i.e.,
where
Definition 6. The Laplace transform (LT)
where
This section specifies the system model of a D2D-enabled heterogeneous cellular network (HetCNet) with exclusion-zone in terms of network deployment, channel model, intensities of transmitting cellular and D2D users.
We study a D2D-enabled HetCNet with exclusion-zone, which consists of multiple base stations (BSs), lots of cellular users (CUs) and D2D users (DUs), as shown in Fig. 1.
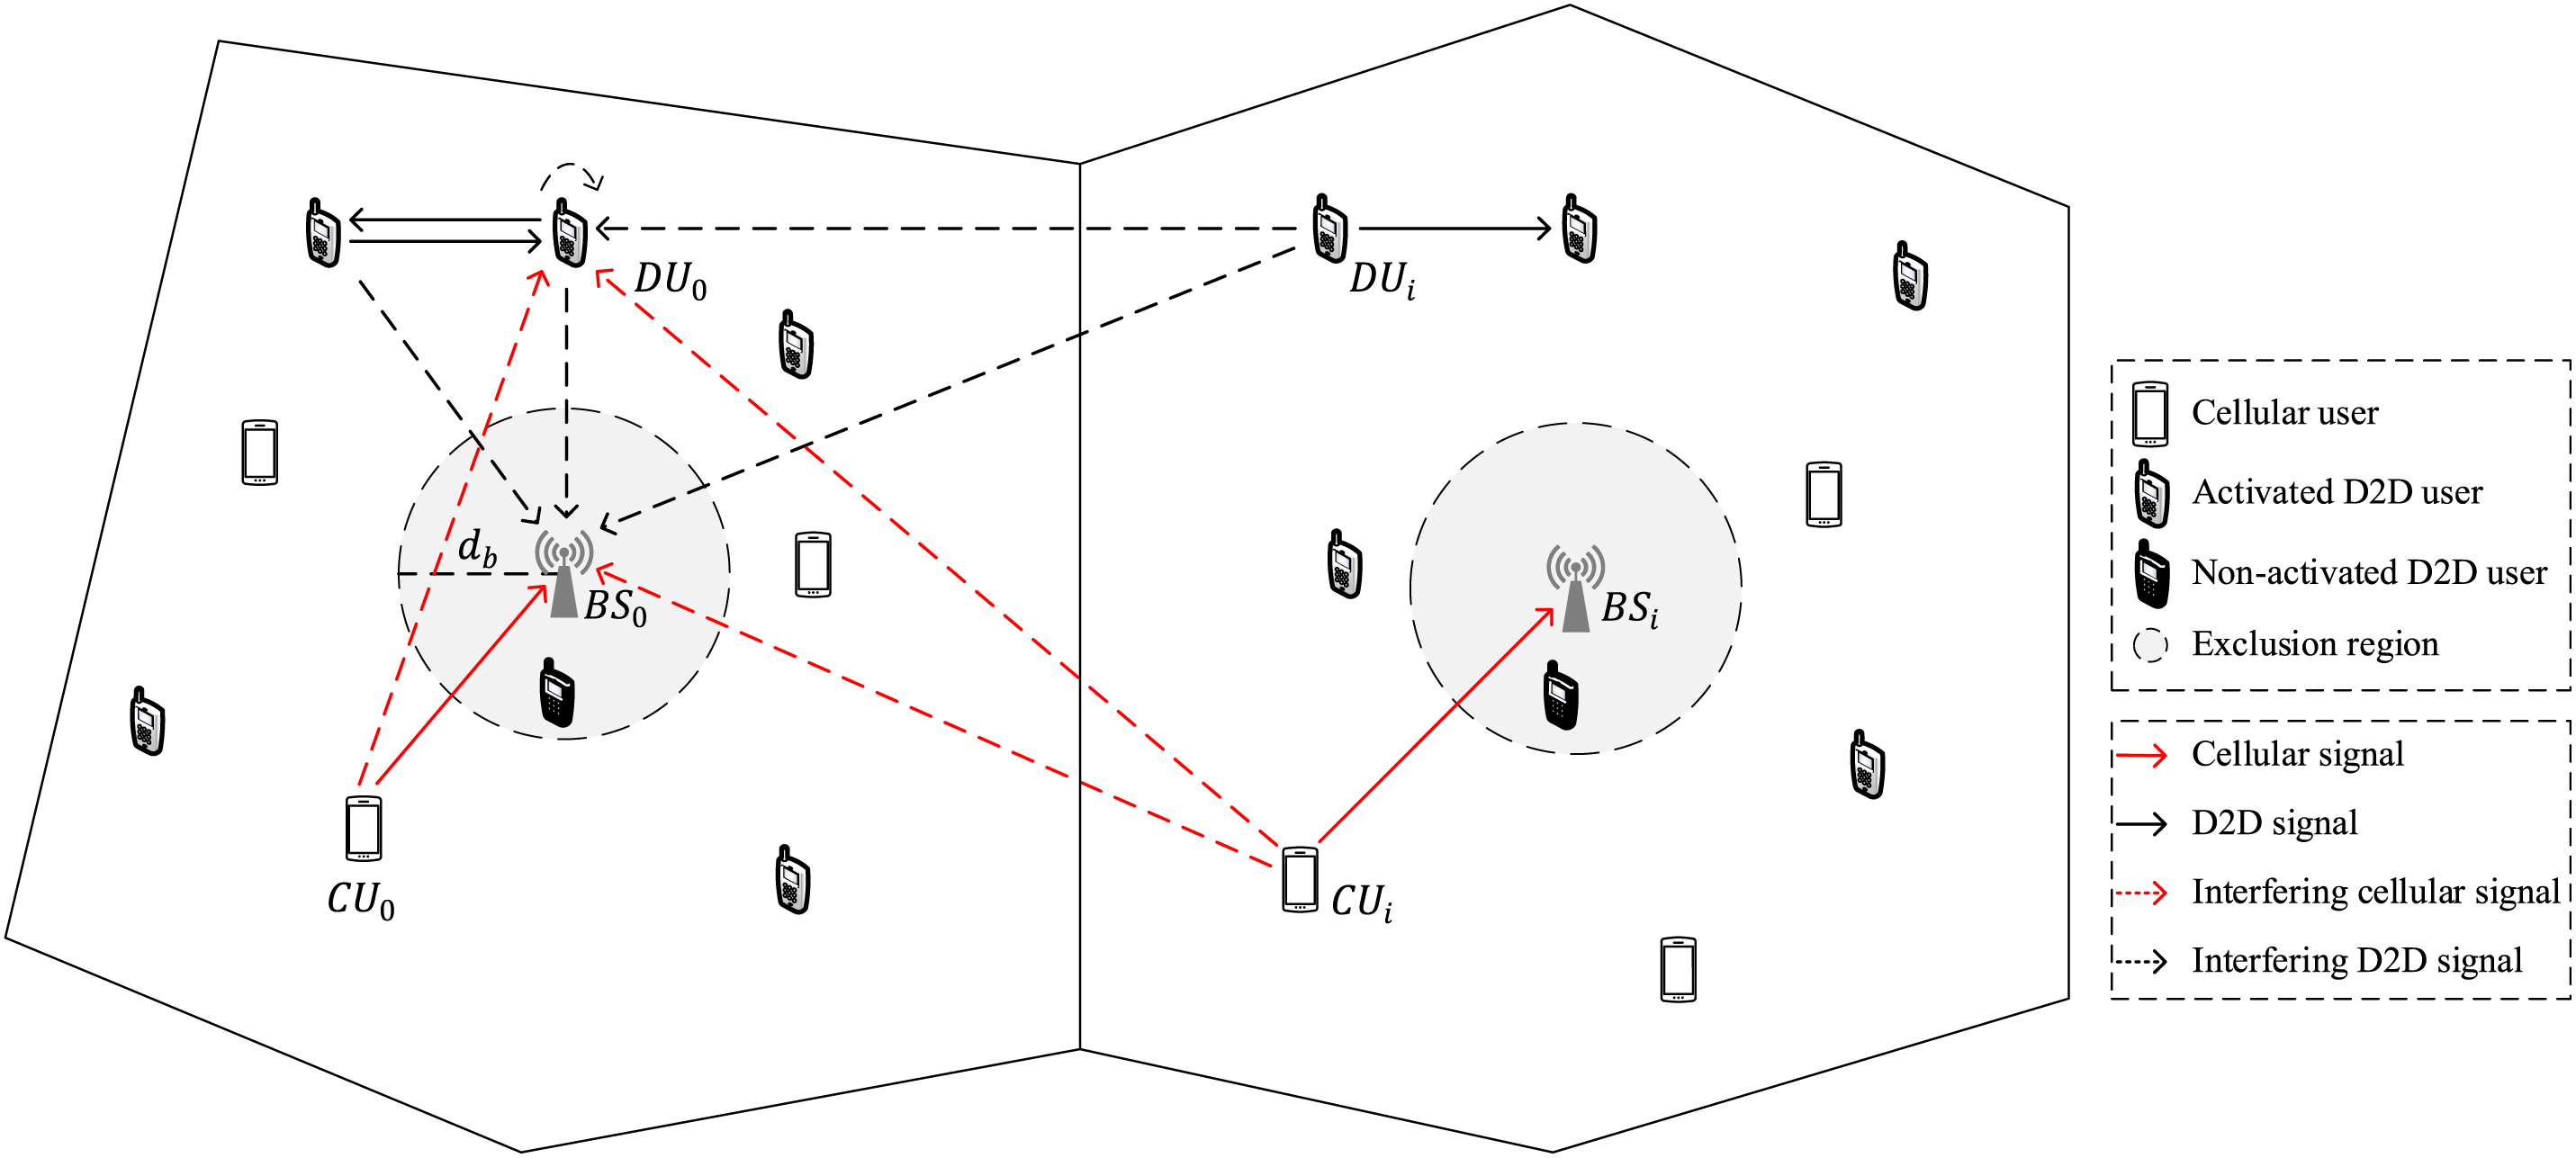
Figure 1: Overview of a D2D-enabled heterogeneous cellular network (HetCNet) with exclusion-zones around the BSs
In a typical HetCNet, the CUs and DUs are randomly located in the space, we model the locations of CUs and DUs by two independent HPPPs
where
We assume that
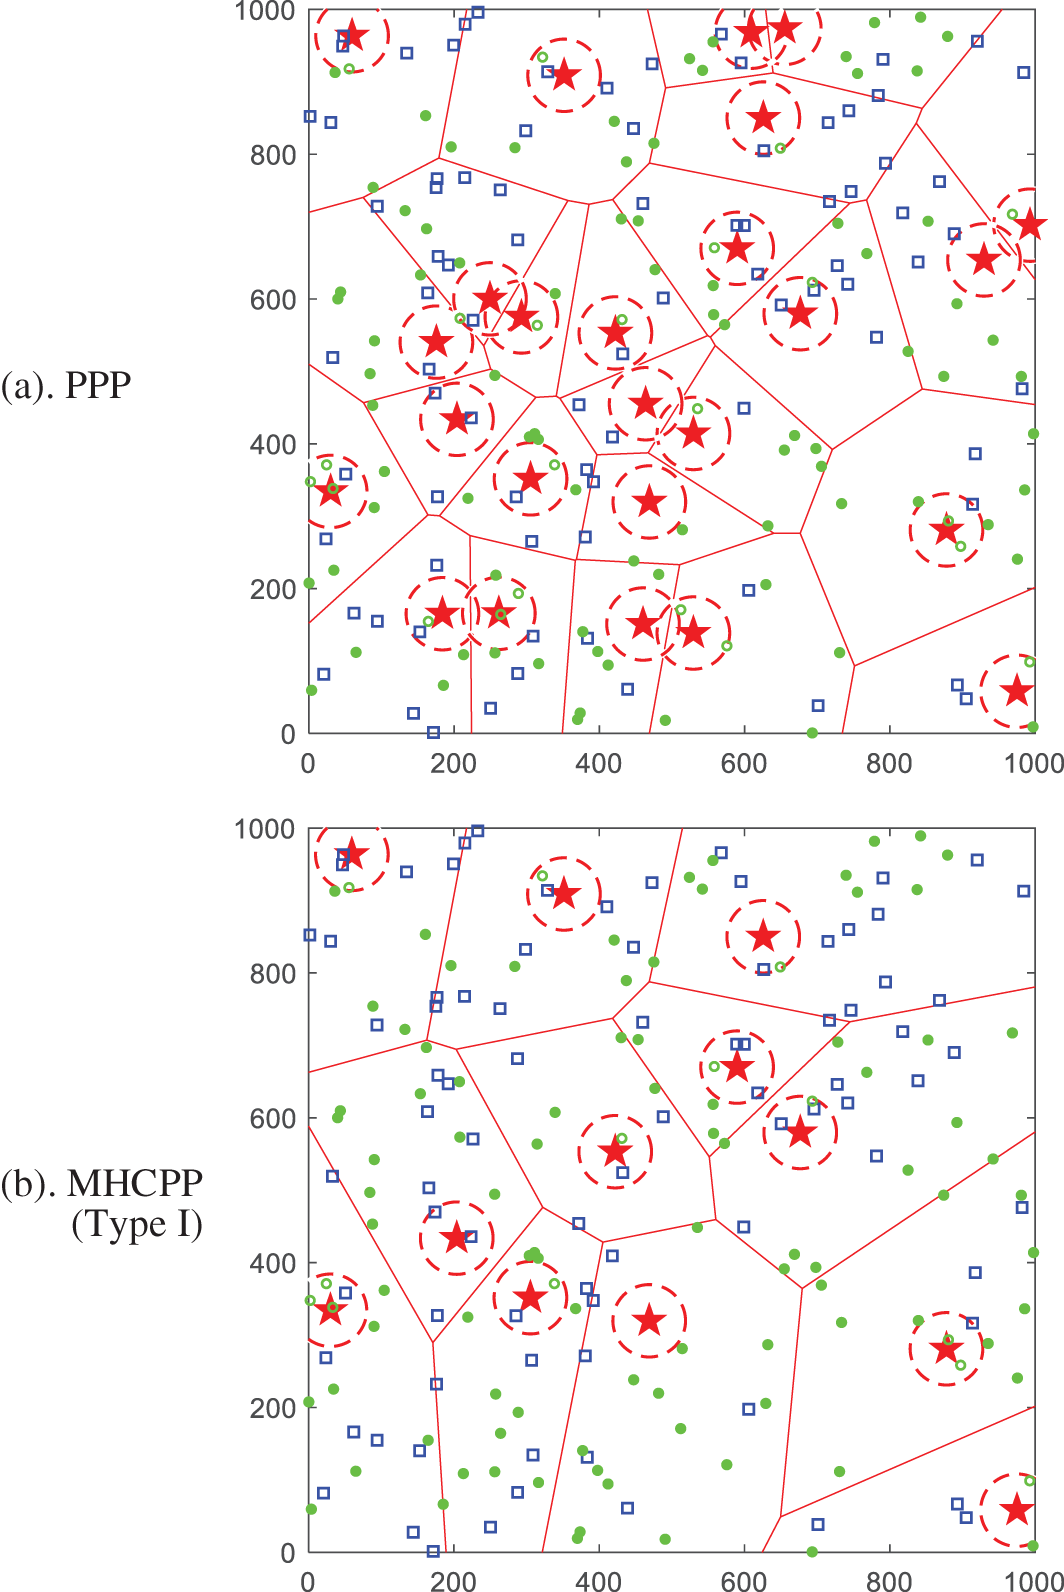

Figure 2: A snapshot of Voronoi tessellation of BSs, CUs and DUs in a 1000 m × 1000 m square region, where λc = 100 CUs km−2, λd = 100 DUs km−2, Rb = 100 m, db = 50 m. (a). BSs follow an HPPP with
In order to facilitate the analysis, we approximate the Voronoi cell as a circle with radius
We assume that DUs utilize the uplink cellular channel to perform D2D transmissions and may choose to operate in either HD or FD mode to transmit to its nearest DU with a fixed power
We assume that all the wireless signals in D2D and cellular transmissions undergo large- and small-scale channel fading. We characterize the large-scale channel fading by the distance dependent power-law path loss model
4.3 Intensity of Transmitting CUs
We assume that all CUs perform ALOHA mechanism to access the channel with probability
4.4 Intensity of Transmitting DUs
Recall that we set exclusion zones at the side of BS which is performing reception from transmitting CUs in its Voronoi cell, that is, when no CUs are transmitting in a cell, the BSs may not perform reception, the exclusion zones are not set. Let
where
Let
Let
where
In
Recall that the DUs can choose to operate in either HD or FD mode [15]. We assume that a DU operates in HD and FD with probability
We assume that half of HD DUs are transmitters and half of them are receivers [15]. Hence, the transmitting HD DUs form a thinned PPP
This section theoretically analyzes the outage probabilities of CUs and DUs with stochastic geometry approach.
5.1 Outage Probability of CUs
We first analyze the outage probability of CUs. Consider a cellular transmission from a tagged CU
where
where
In Eq. (11),
where
For the tagged transmitter
where
Let
Further,
Then, we express
where
In Eq. (17), the LT of
Proof:
In the above proof, Eq.
In Eq.
For the special case
In Eq. (17), the LT of
For the special case
where
In Eq. (17), the LT of
5.2 Outage Probability of DUs
We next analyze the outage probability of DUs in HD/FD mode. Consider a D2D transmission from a tagged DU
where
where
In Eq. (21),
where
For the tagged transmitter
where
Recall that the DU transmits to its nearest DU. Given the tagged DU
where
Let
Further,
Then, we express
where
In Eq. (28), the LT of
If a D2D pair operates in the HD mode:
In Eq. (28), the LT of
In Eq. (28), the LT of
If a D2D pair operates in the FD mode:
In Eq. (28), the LT of
In Eq. (28), the LT of
In this section, we validate the accuracy of our theoretical model via extensive Monte-Carlo simulations and illustrate the outage probabilities of CUs and DUs in the D2D-enabled HetCNet with exclusion-zone. Table 2 shows the parameter settings for each simulation in Figs. 3–6, respectively. In Table 2, we use pattern ‘
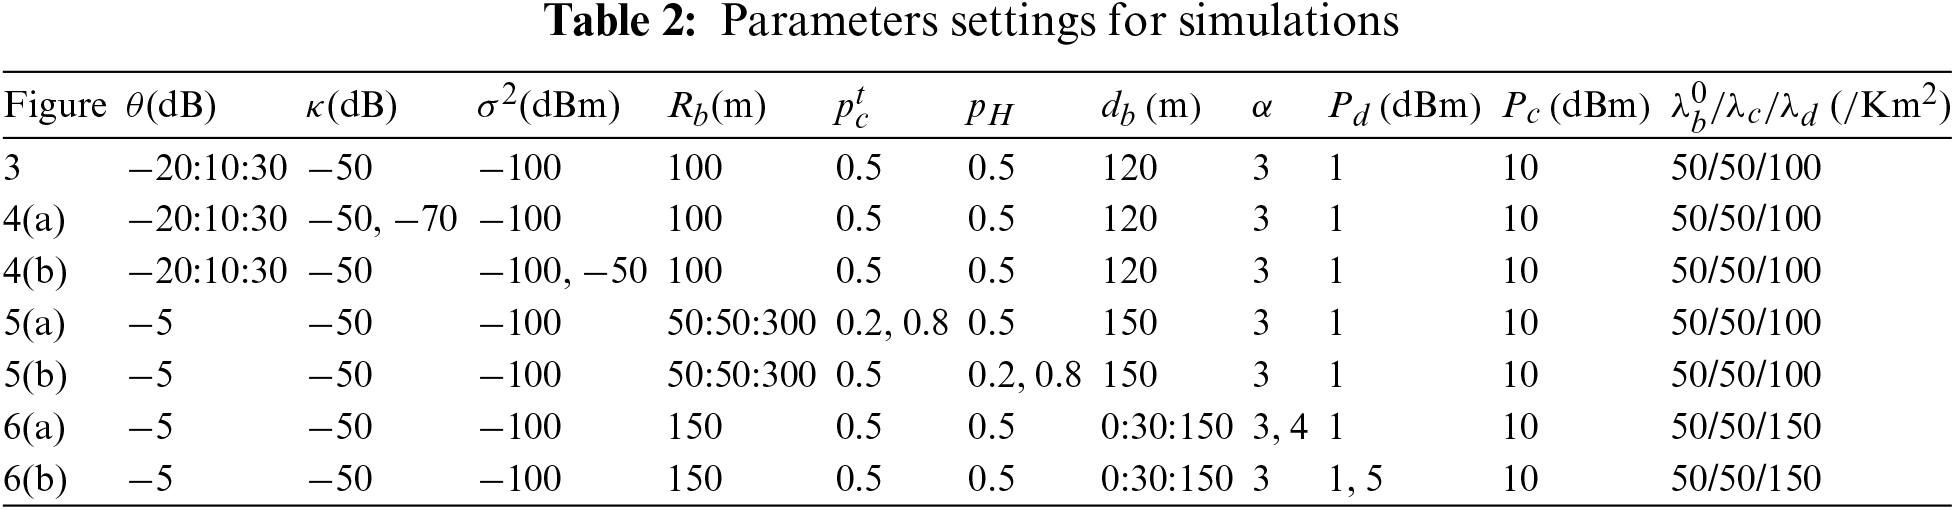

Figure 3:

Figure 4:

Figure 5:

Figure 6:
6.1 Outage Probabilities vs. SINR Threshold in Different BSs Distributions
Here, we verify the accuracy of outage probabilities of CUs
• Given a specific distribution of BSs, both
• Given
• Given
We take the example that BSs follow the type II distribution to verify the accuracy of outage probabilities of CUs
6.2 Outage Probabilities vs. SINR Threshold in Type II Process
Here, we verify the accuracy of outage probabilities of CUs
• Given
• Given
• Given
6.3 Outage Probabilities vs. Minimum Distance of BSs in Type II Process
Here, we verify the accuracy of outage probabilities of CUs
• Given
• Given
• Given
6.4 Outage Probabilities vs. Exclusion Zone of BSs in Type II Process
Here, we verify the accuracy of outage probabilities of CUs
• Given
• Given
• Given
Heterogeneous cellular and D2D devices will densely coexist to collect and exchange information and hence have wide application prospects in many fields. To mitigate the interference among the concurrent cellular and D2D transmissions, exclusion zones are set around BS receivers. This paper develops a theoretical model to analyze the outage probabilities of cellular and D2D users in D2D-enabled HetCNets with exclusion zone. It adopts a stochastic geometry approach to model the location randomness of BSs, cellular and D2D devices. Moreover, it captures the randomness and interrelation between cellular and D2D transmissions and characterizes the complex mutual interference among randomly located cellular and D2D devices. Extensive Monte-Carlo simulation results verify that the theoretical model is very accurate.
Acknowledgement: The authors would like to thank the editor and anonymous reviewers for their valuable suggestions and insightful comments, which have greatly improved the overall quality of this paper.
Funding Statement: This work is funded in part by the Science and Technology Development Fund, Macau SAR (Grant Nos. 0093/2022/A2, 0076/2022/A2 and 0008/2022/AGJ), in part by the National Nature Science Foundation of China (Grant No. 61872452), in part by Special fund for Dongguan’s Rural Revitalization Strategy in 2021 (Grant No. 20211800400102), in part by Dongguan Special Commissioner Project (Grant No. 20211800500182), in part by Guangdong-Dongguan Joint Fund for Basic and Applied Research of Guangdong Province (Grant No. 2020A1515110162), in part by University Special Fund of Guangdong Provincial Department of Education (Grant No. 2022ZDZX1073).
Author Contributions: The authors confirm contribution to the paper as follows: Yulei Wang: Conceptualization, Methodology, Formal analysis, Software, Validation, Writing–original draft, Writing–review & editing. Li Feng: Conceptualization, Methodology, Writing–review & editing, Supervision, Project administration, Funding acquisition. Shumin Yao: Conceptualization, Methodology, Validation, Writing–review & editing. Hong Liang: Validation, Writing–review & editing. Haoxu Shi: Validation, Writing–review & editing. Yuqiang Chen: Validation, Writing–review & editing.
All authors reviewed the results and approved the final version of the manuscript.
Availability of Data and Materials: The data underlying the results presented in the study are available within the article.
Conflicts of Interest: The authors declare that they have no conflicts of interest to report regarding the present study.
1The approximated PPP is inhomogeneous with constant positive density.
2In general, SINR is real ratio value with no unit, SINR threshold
3In our simulation, we set
4Note that the real ratio value of self-interference cancellation factor
References
1. Lin, Z., Li, X., Lau, V. K. N., Gong, Y., Huang, K. (2022). Deploying federated learning in large-scale cellular networks: Spatial convergence analysis. IEEE Transactions on Wireless Communications, 21(3), 1542–1556. https://doi.org/10.1109/TWC.2021.3104834 [Google Scholar] [CrossRef]
2. Zhang, X., Liu, Y., Liu, J., Argyriou, A., Han, Y. (2021). D2D-assisted federated learning in mobile edge computing networks. 2021 IEEE Wireless Communications and Networking Conference (WCNC), Nanjing, China. https://doi.org/10.1109/WCNC49053.2021.9417459 [Google Scholar] [CrossRef]
3. Wang, H., Xu, L., Yan, Z., Gulliver, T. A. (2021). Low-complexity MIMO-FBMC sparse channel parameter estimation for industrial big data communications. IEEE Transactions on Industrial Informatics, 17(5), 3422–3430. https://doi.org/10.1109/TII.2020.2995598 [Google Scholar] [CrossRef]
4. Zhao, Q., Feng, L., Zhao, L., Li, Z., Liang, Y. (2020). SatOpt partition: Dividing throughput-stability region for IEEE 802.11 DCF networks. IEEE Transactions on Vehicular Technology, 69(9), 10278–10290. https://doi.org/10.1109/TVT.2020.3004476 [Google Scholar] [CrossRef]
5. Zhao, Q., Feng, L., Zhao, L., Xie, K., Liang, Y. (2022). Backoff entropy: Predicting presaturation peak for IEEE 802.11 DCF networks. IEEE Transactions on Vehicular Technology, 71(2), 1901–1912. https://doi.org/10.1109/TVT.2021.3131939 [Google Scholar] [CrossRef]
6. Liu, X., Xiao, H., Chronopoulos, A. T. (2020). Joint mode selection and power control for interference management in D2D-enabled heterogeneous cellular networks. IEEE Transactions on Vehicular Technology, 69(9), 9707–9719. https://doi.org/10.1109/TVT.2020.3001874 [Google Scholar] [CrossRef]
7. Shamaei, S., Bayat, S., Hemmatyar, A. M. A. (2019). Interference management in D2D-enabled heterogeneous cellular networks using matching theory. IEEE Transactions on Mobile Computing, 18(9), 2091–2102. https://doi.org/10.1109/TMC.2018.2871073 [Google Scholar] [CrossRef]
8. Hasan, A., Andrews, J. G. (2007). The guard zone in wireless Ad hoc networks. IEEE Transactions on Wireless Communications, 6(3), 897–906. https://doi.org/10.1109/TWC.2007.04793 [Google Scholar] [CrossRef]
9. Tefek, U., Lim, T. J. (2016). Interference management through exclusion zones in two-tier cognitive networks. IEEE Transactions on Wireless Communications, 15(3), 2292–2302. https://doi.org/10.1109/TWC.2015.2502254 [Google Scholar] [CrossRef]
10. Chen, Z., Kountouris, M. (2018). Decentralized opportunistic access for D2D underlaid cellular networks. IEEE Transactions on Communications, 66(10), 4842–4853. https://doi.org/10.1109/TCOMM.2018.2834905 [Google Scholar] [CrossRef]
11. Chu, M., Liu, A., Chen, J., Lau, V. K. N., Cui, S. (2022). A stochastic geometry analysis for energy-harvesting-based device-to-device communication. IEEE Internet of Things Journal, 9(2), 1591–1607. https://doi.org/10.1109/JIOT.2021.3091723 [Google Scholar] [CrossRef]
12. Flint, I., Kong, H. B., Privault, N., Wang, P., Niyato, D. (2017). Analysis of heterogeneous wireless networks using poisson hard-core hole process. IEEE Transactions on Wireless Communications, 16(11), 7152–7167. https://doi.org/10.1109/TWC.2017.2740387 [Google Scholar] [CrossRef]
13. Huang, J., Zou, J., Xing, C. C. (2018). Energy-efficient mode selection for D2D communications in cellular networks. IEEE Transactions on Cognitive Communications and Networking, 4(4), 869–882. https://doi.org/10.1109/TCCN.2018.2873004 [Google Scholar] [CrossRef]
14. Sun, P., Shin, K. G., Zhang, H., He, L. (2017). Transmit power control for D2D-underlaid cellular networks based on statistical features. IEEE Transactions on Vehicular Technology, 66(5), 4110–4119. https://doi.org/10.1109/TVT.2016.2620523 [Google Scholar] [CrossRef]
15. Badri, S., Rasti, M. (2021). Interference management and duplex mode selection in in-band full duplex D2D communications: A stochastic geometry approach. IEEE Transactions on Mobile Computing, 20(6), 2212–2223. https://doi.org/10.1109/TMC.2020.2977899 [Google Scholar] [CrossRef]
16. Ali, K. S., ElSawy, H., Alouini, M. S. (2016). Modeling cellular networks with full-duplex D2D communication: A stochastic geometry approach. IEEE Transactions on Communications, 64(10), 4409–4424. https://doi.org/10.1109/TCOMM.2016.2601912 [Google Scholar] [CrossRef]
17. Hmamouche, Y., Benjillali, M., Saoudi, S., Yanikomeroglu, H., Renzo, M. D. (2021). New trends in stochastic geometry for wireless networks: A tutorial and survey. Proceedings of the IEEE, 109(7), 1200–1252. https://doi.org/10.1109/JPROC.2021.3061778 [Google Scholar] [CrossRef]
18. Wang, Y., Zhao, Q., Yao, S., Feng, L., Liang, H. (2022). Performance modeling of tags-to-WiFi transmissions for contention-based WiFi backscatter networks. 2022 IEEE International Conference on Networking, Sensing and Control (ICNSC), pp. 1–6. https://doi.org/10.1109/ICNSC55942.2022.10004070 [Google Scholar] [CrossRef]
19. Zhang, S., Zhu, Y., Liu, J. (2022). Multi-UAV enabled aerial-ground integrated networks: A stochastic geometry analysis. IEEE Transactions on Communications, 70(10), 7040–7054. https://doi.org/10.1109/TCOMM.2022.3204662 [Google Scholar] [CrossRef]
20. Okegbile, S. D., Maharaj, B. T., Alfa, A. S. (2021). Interference characterization in underlay cognitive networks with intra-network and inter-network dependence. IEEE Transactions on Mobile Computing, 20(10), 2977–2991. https://doi.org/10.1109/TMC.2020.2993408 [Google Scholar] [CrossRef]
21. Illian, J., Penttinen, A., Stoyan, H., Stoyan, D. (2008). Statistical analysis and modelling of spatial point patterns. England: John Wiley & Sons. [Google Scholar]
22. Haenggi, M. (2012). Stochastic geometry for wireless networks. Cambridge: Cambridge University Press. https://doi.org/10.1017/CBO9781139043816 [Google Scholar] [CrossRef]
23. Stoyan, D., Kendall, W. S., Chiu, S. N., Mecke, J. (2013). Stochastic geometry and its applications, 3rd edition. England: John Wiley & Sons. [Google Scholar]
24. Błaszczyszyn, B., Haenggi, M., Keeler, P., Mukherjee, S. (2018). Stochastic geometry analysis of cellular networks, 1st edition. Cambridge: Cambridge University Press. https://doi.org/10.1017/9781316677339 [Google Scholar] [CrossRef]
25. Ghatak, G., Khosravirad, S. R., Domenico, A. D. (2022). Stochastic geometry framework for ultrareliable cooperative communications with random blockages. IEEE Internet of Things Journal, 9(7), 5150–5161. https://doi.org/10.1109/JIOT.2021.3108955 [Google Scholar] [CrossRef]
26. ElSawy, H., Hossain, E., Camorlinga, S. (2012). Characterizing random CSMA wireless networks: A stochastic geometry approach. 2012 IEEE International Conference on Communications (ICC), pp. 5000–5004. https://doi.org/10.1109/ICC.2012.6363772 [Google Scholar] [CrossRef]
27. Ganti, R. K., Haenggi, M. (2006). Regularity in sensor networks. 2006 International Zurich Seminar on Communications, pp. 186–189. https://doi.org/10.1109/IZS.2006.1649111 [Google Scholar] [CrossRef]
28. Chen, H., Liu, L., Dhillon, H. S., Yi, Y. (2019). QoS-aware D2D cellular networks with spatial spectrum sensing: A stochastic geometry view. IEEE Transactions on Communications, 67(5), 3651–3664. https://doi.org/10.1109/TCOMM.2018.2889246 [Google Scholar] [CrossRef]
29. ElSawy, H., Hossain, E. (2014). On stochastic geometry modeling of cellular uplink transmission with truncated channel inversion power control. IEEE Transactions on Wireless Communications, 13(8), 4454–4469. https://doi.org/10.1109/TWC.2014.2316519 [Google Scholar] [CrossRef]
30. Liu, Y., Deng, Y., Jiang, N., Elkashlan, M., Nallanathan, A. (2020). Analysis of random access in NB-IoT networks with three coverage enhancement groups: A stochastic geometry approach. IEEE Transactions on Wireless Communications, 20(1), 549–564. https://doi.org/10.1109/TWC.2020.3026331 [Google Scholar] [CrossRef]
31. Zhang, X., Andrews, J. G. (2015). Downlink cellular network analysis with multi-slope path loss models. IEEE Transactions on Communications, 63(5), 1881–1894. https://doi.org/10.1109/TCOMM.2015.2413412 [Google Scholar] [CrossRef]
32. Wang, Q., Zhou, Y., Dai, H. N., Zhang, G., Zhang, W. (2022). Performance on cluster backscatter communication networks with coupled interferences. IEEE Internet of Things Journal, 9(20), 20282–20294. https://doi.org/10.1109/JIOT.2022.3174002 [Google Scholar] [CrossRef]
33. Deng, N., Zhou, W., Haenggi, M. (2015). Heterogeneous cellular network models with dependence. IEEE Journal on Selected Areas in Communications, 33(10), 2167–2181. https://doi.org/10.1109/JSAC.2015.2435471 [Google Scholar] [CrossRef]
34. Wang, H., Xiao, P., Li, X. (2022). Channel parameter estimation of mmWave MIMO system in urban traffic scene: A training channel-based method. IEEE Transactions on Intelligent Transportation Systems, 1–9. https://doi.org/10.1109/TITS.2022.3145363 [Google Scholar] [CrossRef]
35. Ma, R., Chang, Y. J., Chen, H. H., Chiu, C. Y. (2017). On relay selection schemes for relay-assisted D2D communications in LTE-A systems. IEEE Transactions on Vehicular Technology, 66(9), 8303–8314. https://doi.org/10.1109/TVT.2017.2682123 [Google Scholar] [CrossRef]
36. Park, J., Guvenc, I. (2023). Interference analysis for UAV radar networks with guard zones based on stochastic geometry. IEEE Transactions on Aerospace and Electronic Systems, 59(4), 4092–4104. https://doi.org/10.1109/TAES.2023.3236308 [Google Scholar] [CrossRef]
37. Nguyen, H. Q., Baccelli, F., Kofman, D. (2007). A stochastic geometry analysis of dense IEEE 802.11 networks. IEEE INFOCOM 2007-26th IEEE International Conference on Computer Communications, pp. 1199–1207. https://doi.org/10.1109/INFCOM.2007.143 [Google Scholar] [CrossRef]
38. Alfano, G., Garetto, M., Leonardi, E. (2011). New insights into the stochastic geometry analysis of dense CSMA networks. 2011 Proceedings IEEE INFOCOM, pp. 2642–2650. Shanghai, China. https://doi.org/10.1109/INFCOM.2011.5935092 [Google Scholar] [CrossRef]
39. Haenggi, M. (2011). Mean interference in hard-core wireless networks. IEEE Communications Letters, 15(8), 792–794. https://doi.org/10.1109/LCOMM.2011.061611.110960 [Google Scholar] [CrossRef]
40. Deng, N., Wei, H., Haenggi, M. (2023). Modeling and analysis of air-ground integrated networks with flexible beam coverage. IEEE Transactions on Wireless Communications, 1. https://doi.org/10.1109/TWC.2023.3260470 [Google Scholar] [CrossRef]
41. Andrews, J. G., Baccelli, F., Ganti, R. K. (2011). A tractable approach to coverage and rate in cellular networks. IEEE Transactions on Communications, 59(11), 3122–3134. https://doi.org/10.1109/TCOMM.2011.100411.100541 [Google Scholar] [CrossRef]
42. Gradshteĭn, I. S., Ryzhik, I. M., Jeffrey, A. (2007). Table of integrals, series, and products, 7th edition. London: Academic Press. [Google Scholar]
Cite This Article
 Copyright © 2024 The Author(s). Published by Tech Science Press.
This work is licensed under a Creative Commons Attribution 4.0 International License , which permits unrestricted use, distribution, and reproduction in any medium, provided the original work is properly cited.
 Downloads
 Citation Tools