
 Submit a Paper
 Propose a Special lssue
 Open Access
ARTICLE

Two-Way Neural Network Performance Prediction Model Based on Knowledge Evolution and Individual Similarity
1 College of Computer Science, Sichuan University, Chengdu, 610065, China
2 School of Information Science and Engineering, Guilin University of Technology, Guilin, 541004, China
3 School of Control Engineering, Chengdu University of Information Technology, Chengdu, 610225, China
* Corresponding Author: Xinzheng Wang. Email:
Computer Modeling in Engineering & Sciences 2024, 138(2), 1183-1206. https://doi.org/10.32604/cmes.2023.029552
Received 26 February 2023; Accepted 20 June 2023; Issue published 17 November 2023
 View Full Text
 Download PDF
Abstract
Predicting students’ academic achievements is an essential issue in education, which can benefit many stakeholders, for instance, students, teachers, managers, etc. Compared with online courses such as MOOCs, students’ academic-related data in the face-to-face physical teaching environment is usually sparsity, and the sample size is relatively small. It makes building models to predict students’ performance accurately in such an environment even more challenging. This paper proposes a Two-Way Neural Network (TWNN) model based on the bidirectional recurrent neural network and graph neural network to predict students’ next semester’s course performance using only their previous course achievements. Extensive experiments on a real dataset show that our model performs better than the baselines in many indicators.Graphic Abstract
Keywords
Education plays an essential role in the process of human development. Students’ academic achievement is a crucial criterion for measuring the quality of a university. How to improve education quality is the common concern of all educational stakeholders. Despite the extensive development of education in recent years, education is still facing many problems, such as high dropout and low graduation rates on time [1]. According to National Center for Education Statistics [2], by 2020, only about 64
With the rapid advancement of information technology, data collection has become more convenient, resulting in the rapid growth of data in all fields. Humans have entered the era of big data, and data values are increasingly recognized. It can support the decision-making process and has been well applied in business, medicine, and many other fields [6–8]. Similarly, with various information technologies involved in the education domain, many student-related data are collected and stored in systems, such as their social relations, enrollment records, attendance records, consumption records, book borrowing records, and examination results. Even so, managers can still not be able to guide students in the right direction by implementing student intervention strategies in time unless they take efficient ways to make good use of the data. To realize the value of data, it must be transformed into knowledge [9]. Based on this situation, mining the data from the educational domain has attracted increasing research attention and gradually formed a new branch–Educational Data Mining (EDM), which has been developed rapidly in recent decades [10–13].
As a subfield of data mining, EDM seeks to develop and apply computational and psychological methods for extracting meaningful knowledge from data collected in education-related environments to understand how students learn [14]. EDM can provide educators with valuable information by discovering hidden patterns in educational data. It usually uses the data collected from education systems to better understand the students and their learning styles to design educational policies that will improve their academic performance and reduce failure rates [15]. Many traditional data mining techniques, including visualization, classification, and clustering, have been successfully applied in the educational domain. In addition to some standard features of data mining. Romero et al. [16] pointed out that EDM has some unique characteristics, such as hierarchical and longitudinal data, which requires special data process measures.
In general, EDM methods can be classified into three categories: prediction, clustering, and relationship mining [10]. The goal of prediction is to predict the category or value of an instance. And predicting students’ academic outcomes is an important application area for learning contexts because it helps to design effective mechanisms to improve educational results and prevent dropouts. It can also enhance the quality of teaching and learning, aiding students to succeed in their academic paths [17]. Most education-related researches focus on this goal [18–20]. Analyzing big education data and revealing the hidden information will benefit all stakeholders, such as learners, teachers, and managers. Students with problems can be identified and given timely assistance. Besides, the prediction results can be fed back to students as a reference for their course selection and to teachers so that they can provide better personalized guidance for students. Therefore, predicting students’ curriculum performance becomes essential in educational data mining application research and has received increasing attention [21]. By predicting students’ course performance, students at risk of academic failure can be identified as early as possible so that instructors may have sufficient time to take necessary measures to help them, thus ensuring the quality of talent training. Clustering is an unsupervised method for grouping similar objects. In EDM, it is possible to group the learning patterns, thus study the advantages and disadvantages of different learning models, or recommend learning content [22]. Moubayed et al. [23], for instance, employed the
According to the environments that the performance prediction aims for, it can be further divided into online and offline performance prediction. Online performance prediction uses students’ learning behaviors, practice records, login conditions, etc., on the online platform to predict students’ learning outcomes. The current research on performance prediction is mainly on this aspect [5,26,27], which is because large-scale open online courses (MOOC) [28] and other forms of virtual e-learning platforms can provide a large amount of data for model training. Performance prediction in the online environment can tackle many education-related problems. For instance, regarding the problem of low teacher-student ratio and diverse student backgrounds in MOOC learning. Brinton et al. [29] proposed measures to recommend learning content based on students’ learning behavior automatically. Yang et al. [4] adopted the statistical analysis approach to investigate the high dropout rate problem in the online learning environment.
Despite the advantages of online learning environments, which provide convenient ways for humans to acquire knowledge anywhere and anytime, face-to-face offline class teaching remains the primary method for imparting knowledge in current practice. Predicting students’ achievements in offline learning environments is significant, especially in higher education. It can support educational managers in making policy decisions and provide accurate services to students such as course recommendation, learning path recommendation, and early warning of psychological problems [30]. However, predicting students’ academic performance in the offline learning environment is challenging because quite a few factors can affect students’ performance, such as previous course achievements, demographic features, economic background, and personality. In addition, there are two reasons that make the prediction even more difficult in the face-to-face teaching environment. On the one hand, there is very little data related to students’ curriculum learning due to the difficulty of data collection. On the other hand, students are involved in many courses and may have different learning methods in various courses [31]. Therefore, although there has been a lot of research on performance prediction in recent years and deep learning technology has made great progress in many fields, there is not much research on applying deep learning technology to offline performance prediction, and it still mainly focuses on using traditional machine learning methods. To resolve this problem and fully leverage the advantages of deep learning technology, we need to use better strategies and design better models based on the characteristics of offline data.
Compared with the online learning environment, one distinguishing feature of offline classroom education is that the courses students learn are organized according to their majors, and the curriculums have a strong dependency and strict sequence. The previous courses’ outcomes greatly influence the subsequent ones [14]. Asif et al. [22] used data mining methods to study undergraduate students’ performance and discovered that focusing on some particularly good or poor courses makes it possible to predict student academic outcomes. And they also indicate that the more aggregated the performance, e.g., pass/fail, the higher the prediction accuracy. It suggests that students’ academic achievements in previous courses can be used to predict the results of subsequent courses. Through literature review, Saa et al. [32] found that the most commonly used features for predicting students’ performance in higher education are their previous grades and class performance, which is 26%, and the following factors are their learning activities and demographics, which are 25% and 23%, respectively.
According to the characteristics of offline education data, this paper designs a model based on the graphical neural network and recurrent neural network to predict students’ learning performance. The introduction of the graph neural network aims to solve the impact of small sample size and sparse data. And the introduction of the bidirectional recurrent neural network aims to discover the evolution pattern of students’ ability and knowledge structure over time. Specifically, the goal of the model is to predict students’ performance in the next semester by using their previous course performance. The main contributions of this paper are as follows:
1) In the data preprocessing stage, the matrix decomposition technology is adopted to fill in the null scores, which makes the filled values more reasonable and conducive to the prediction performance of the model.
2) A graph neural network for automatic feature extraction and similarity calculation is proposed to obtain the representation of students, which not only considers the characteristics of students themselves but also synthesizes the characteristics of similar neighbors.
3) The bidirectional recurrent neural network is introduced to capture students’ knowledge structure and capability evolution characteristics based on their previous course achievements.
4) Extensive experimental results show that the proposed model has better prediction performance than the baselines in many indicators.
The remainder of this paper is structured as follows. Section 2 presents some literature related to data mining and academic achievement prediction, followed by a detailed description of the proposed model in Section 3. Section 4 describes the dataset used for evaluation. Section 5 is the experiments and discussions. The conclusion and future work are presented in Section 6.
EDM is a new interdisciplinary field of research devoted to developing methods for analyzing data in the educational context to resolve educational issues. It involves domains such as pedagogy, psychology, statistics, machine learning, data mining, etc., and has consequently attracted growing research interest. There has been a significant amount of research on the application of computer technology in education in recent decades. And many literature reviews studied the progress in this field. For instance, Romero et al. [10] discussed some critical issues in EDM, such as the development of EDM, educational data sources, tools, and datasets. Dutt et al. [12] examined the literature on clustering algorithms and their applicability and usability in the context of EDM from 1983 to 2016, then pointed out EDM’s future development directions and research approaches. Charitopoulos et al. [33] reviewed studies conducted between 2010 and 2018 and evaluated the feasibility of various Machine Learning methods used in education. Xiao et al. [21] reviewed many essential studies on predicting student performance from 2016 to 2021, synthesized the process of developing a student performance prediction model, and put forward some suggestions for future work.
Predicting students’ academic performance is one of the most critical applications in EDM, which can monitor student progress in learning and identify students at risk of failure in advance [27]. Academic performance prediction can be broken down into different levels of granularity, such as question level, course level, and overall achievement. For instance, Marina et al. [34] proposed methods by integrating the time-delay neural network and the recurrent neural network to predict whether a student will answer the next exam question correctly based on their previous interactions in the course. Similarly, Venktesh et al. [35] designed a model that can dynamically choose exam questions according to the learner’s learning profile by predicting the difficulty level of each question in the learning platform database. Course level prediction is typically based on students’ performance in previous courses, their learning behavior over a specific period, and other information to predict the outcome of the course they are learning or will learn. Strecht et al. [36] used data extracted from the university information system to predict the future course result of a student. Many popular classification and regression algorithms were tested in their experiments, including decision trees, SVM, Random Forest, and AdaBoost. The input variables are age, sex, marital status, nationality, delayed courses, etc. For the classification task, the goal is to predict whether students will pass the course, while the regression task is to predict the possible score of students in the course. Their experiments found that Random Forest performed significantly better in regression tasks, while decision trees and SVM obtained the best results in classification tasks. Overall achievement prediction means to predict students’ comprehensive performance, such as GPA, whether they graduate on time. E.g., Asif et al. [22] investigated the possibility of predicting the graduation performance in a four-year university program using only the pre-university grades and the grades from the first and second-year courses. Many algorithms were examined in their experiments, and the results show that different classifiers have different advantages and disadvantages regarding prediction. It is a challenge to deal with all situations using a single predictor.
More and more machine learning algorithms successfully applied in other fields are being introduced to education. Alharbi et al. [37] explored using different prediction algorithms to predict college students’ grades, such as K-Nearest Neighbor (KNN), Singular Value Decomposition (SVD), and Non-negative Matrix Factorization (NMF). Many literature [38–40] adopted Matrix Factorization (MF) to learn the embedding for each student and course and predicts the grades based on corresponding vector embeddings of the course and student. Anand [14] adopted machine learning classification models, including Decision Tree (DT), AdaBoost model, Support Vector Machine (SVM), and Artificial Neural Networks, to predict the performance of students. They conducted experiments on 112 instances with 15 variables, including nine scores from the previous courses. And the students are classified into two categories marked as 1 or 0 based on the percentage a student has scored. In addition to using a single classifier for prediction, researchers also try to combine multiple classifiers for prediction [41].
Among many machine learning approaches used in student academic performance prediction, Decision tree (DT), Linear Regression/Logistic Regression (LR), and Naive Bayes (NB) are the most popular ones [1,13,42–44]. It is mainly due to two reasons: one is that they are simple and easy to implement, while the other is that they are more interpretable. When the predicted targets are numerical values, LR refers to linear regression; when the predicted targets are categories, LR refers to logistic regression. For instance, Polyzou et al. [43] used LR to predict students’ future course outcomes based only on the student’s performance in previous courses. El Aissaoui et al. [44] studied the impacts of multiple factors on students’ academic performance and adopted a multiple linear regression model to predict a student’s final grade. Their approach considers many attributes, such as the student’s school, age, family size, and parent’s cohabitation status. Then the essential variables are selected as the model’s inputs based on the preliminary analysis.
With the advance of Artificial Neural Networks (ANN) and its successful application in other fields, such as natural language processing [45] and computer vision [46], it is gradually being employed in the field of education. Lau et al. [47] adopted conventional statistical analysis and Artificial Neural Network (ANN) to predict the undergraduate student’s Cumulative Grade Point Average (CGPA) based on the data of their socioeconomic backgrounds and entrance examination results. Conventional statistical evaluations are used to identify the factors that likely affect the student’s performance, and the obtained results are input to the ANN for prediction. In their research, they found that female students outperform male students, and the location of the student, whether rural or urban, has no effect on the results. Similarly, Naser et al. [48] introduced ANN to predict students’ performance before the second year of the engineering major to determine which students are likely to learn engineering major successfully and then to make the process for students to choose the engineering major more effectively and efficiently. They took into account many factors in their model inputs, such as the high school scores, scores of science and technology-related subjects, CGPA obtained during the first year, and gender of the student. The model performed well, and the prediction accuracy exceeded 80
In general, the existing research on predicting students’ future course performance mainly focuses on the linear or nonlinear combination of characteristics, such as personal information, past course performance, etc. There is little literature [31,39] dives into the deeper relationship between curriculum, students, and grades. To some extent, students’ achievements in a particular course can reflect the implicit requirements of the course for different capabilities and the capabilities that students have. The model’s prediction performance can be improved by obtaining an accurate feature representation of students and courses. The collaborative filtering technology based on matrix factorization [51], as well as the recently proposed graph neural network [52], have shown promising results in feature representation learning. Besides, many studies [11,21,32] demonstrated that students’ previous achievements have a significant influence on students’ future course performance. Inspired by this, this paper studies the capability representation of students based on their past performance to predict their performance in future courses.
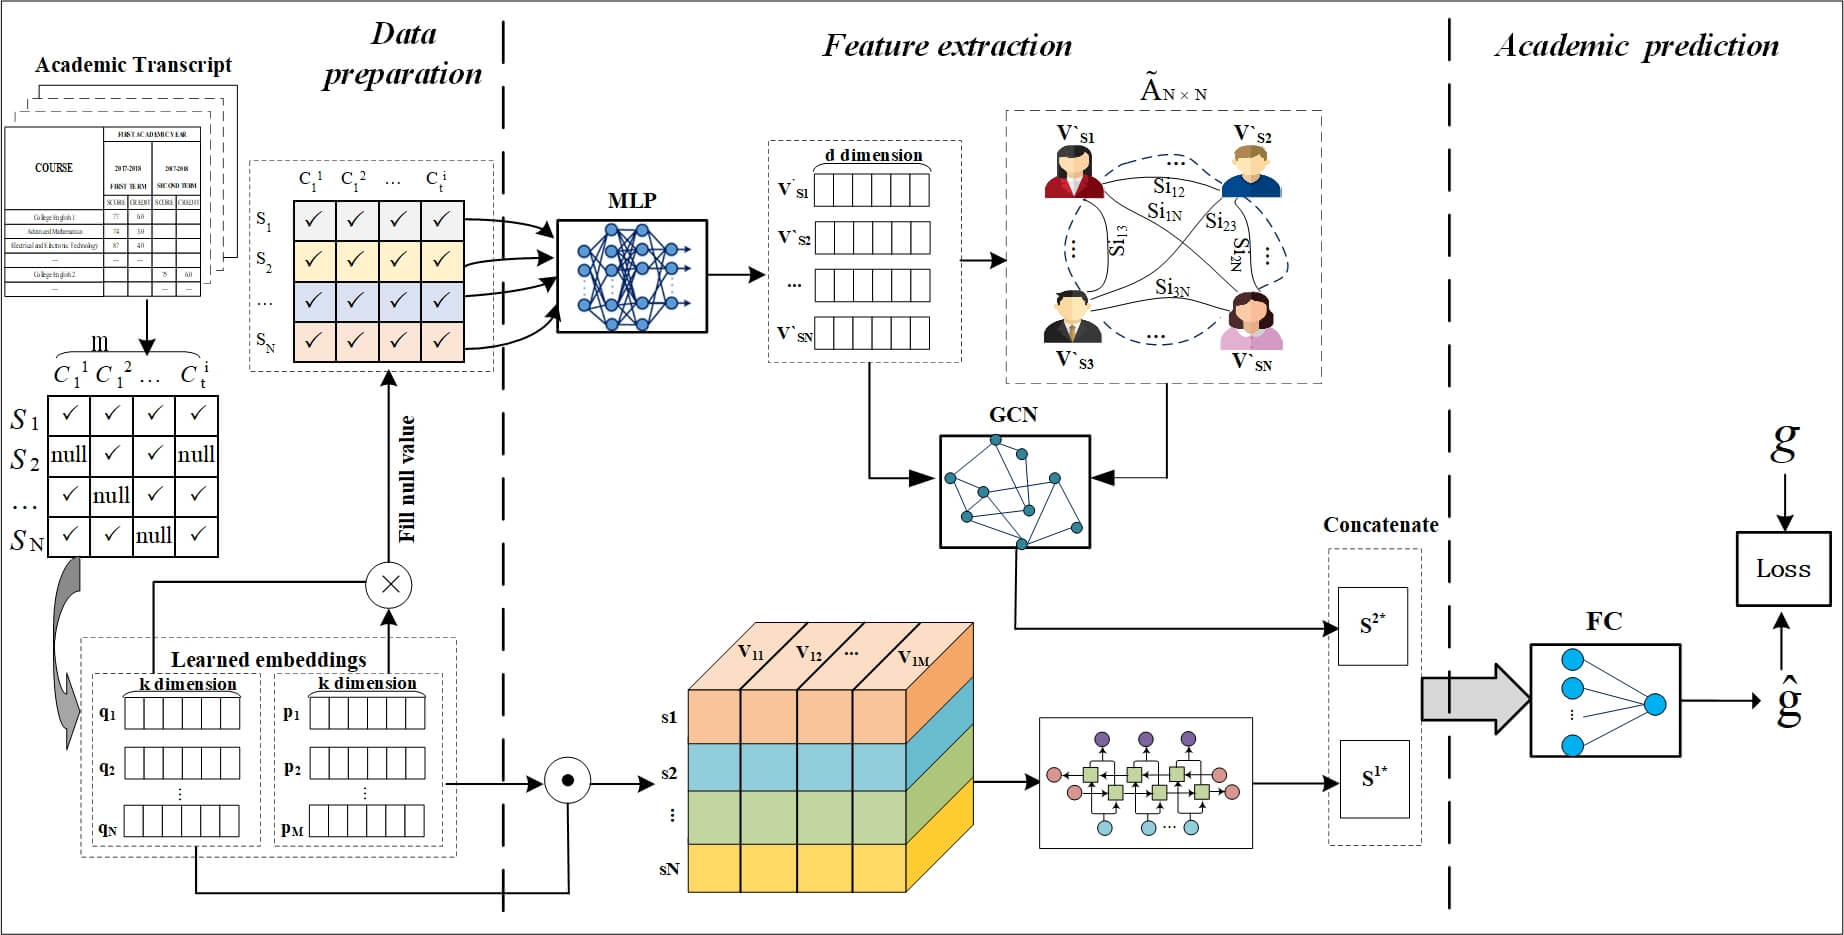
In this section, we will describe the details of our proposed model. Generally speaking, The model consists of three parts: data preparation and preprocessing, feature extraction, and academic prediction. Matrix factorization is a technique widely used in recommendation systems. It can identify the relationship between item and user entities by mapping them to a common low-rank space. Inspired by this, we introduce matrix factorization to study the relationship between students and the course and based on it to fill the empty scores in the data preparation part. And for the feature extraction, we adopt the graphical neural networks to get more information from similar neighbors and introduce the recurrent neural networks to learn the representation of characteristics of the students’ knowledge-evolving process. Finally, input the learned students’ comprehensive representation into the fully connected network to predict their academic performance in the target course. The workflow of the proposed model is shown as Fig. 1.
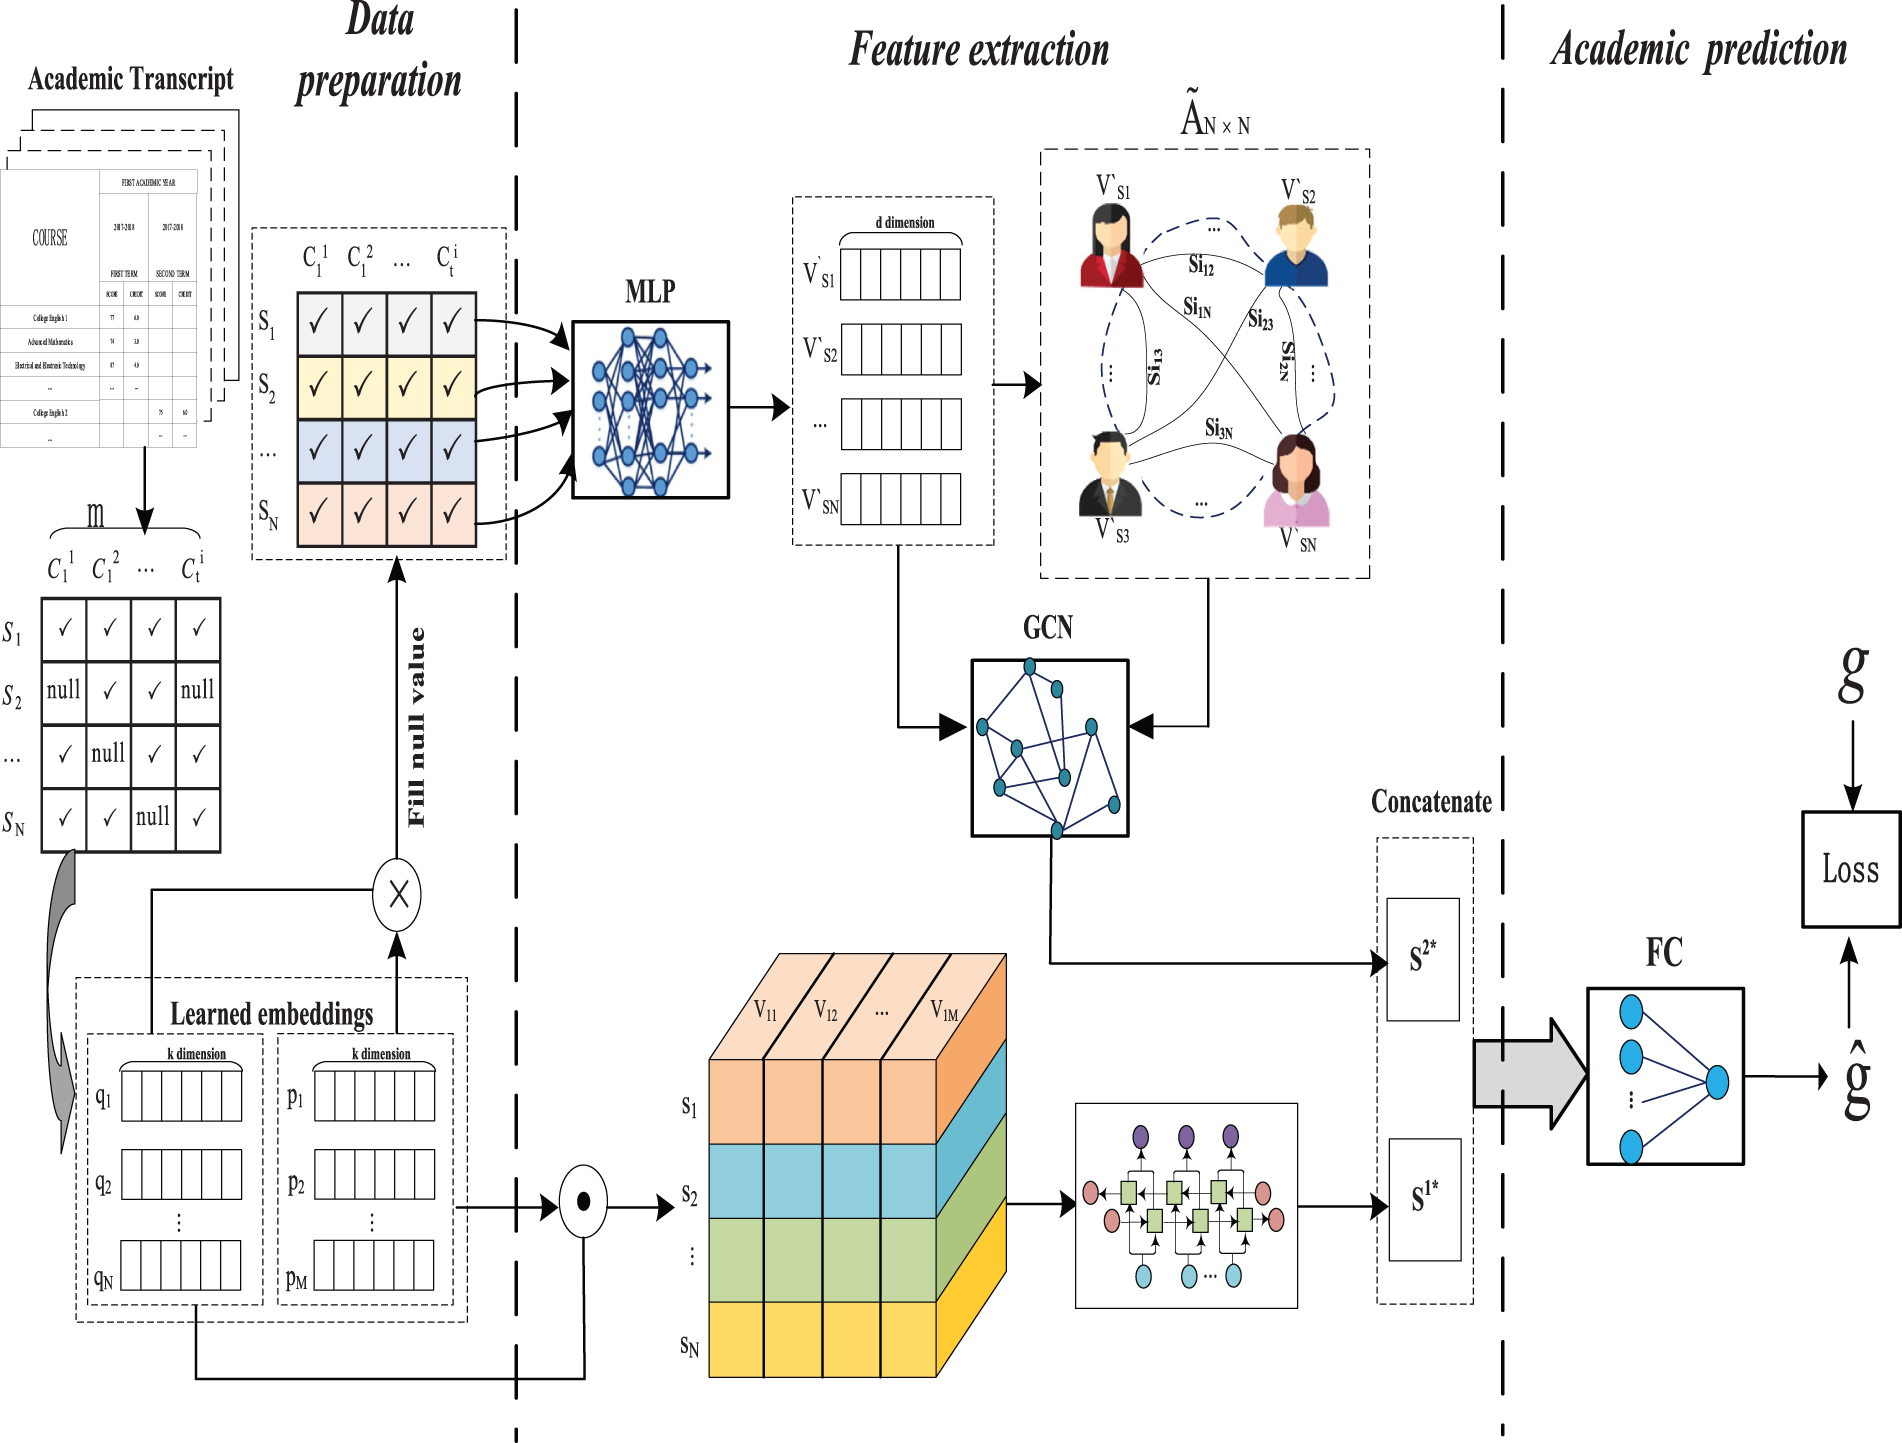
Figure 1: Workflow of the proposed model
The specific implementation process is divided into two steps. The first step is to obtain student grade data from the academic administration system, and use matrix factorization technology to obtain the representation vectors of students and courses, and fill in the blank values in the grade table. This is completed by Part 1 of the workflow. Step 2 uses the student representation vectors and course representation vectors obtained in Step 1 to form a vector representation of the student score vector sequence and input it into GRU to obtain one way of the student feature representation, and its implementation is shown as Eqs. (5)–(11); Input the filled scores into the MLP of the feature extraction part to obtain the second way of the student feature representation, and its implementation is shown as Eqs. (12)–(18), then concatenate the two ways of representation vectors to form a comprehensive student feature vector representation, shown as Eq. (19). This is the feature extraction part. Then input the concatenated vector into a fully connected network for performance prediction, shown as Eq. (20). And this is the performance prediction part. The second step includes the second and third parts of the workflow, which are a whole, and the parameters of the two parts are obtained through backpropagation.
3.1 Data Preparation and Preprocessing
For using the previous achievement to predict students’ performance, the first step is to collect students’ historical academic records data and then use proper methods to process the data into a data form suitable for models. The raw data are extracted from an university educational administration system. Each student has a personal grade sheet that records their results on the course they took. The collected score data should be processed to the table form to fit the model input, in which each row of the table represents a student, and each column represents a course. It should be noted that if the score management system provides the export function of data in this format, this step can be skipped. Due to the diverse nature of courses in universities, such as mandatory and elective courses, and the courses taken by students in the same major are not entirely the same, there are many blank values in the table. Next, a crucial step here is to fill in the null score data. Since the courses in the university have different characteristics, some are compulsory courses, and some are elective courses. Students can have various choices for the elective courses and eventually learn similar knowledge. It makes the score table
The latent vector representation is a technology widely employed in current data mining and deep learning domains to represent various feature attributes of objects as an abstract dense real vector. An earlier application of this aspect is low-rank matrix factorization (MF) [51], a popular technique used in recommendation systems. As a latent factor model, it maps users and items to the same dimension shared latent factor space and uses the inner product of these hidden vectors to represent user-item interactions.
In the learning and assessment process, whether a student can get high scores depends on the course’s capability requirements and the student’s capability in these aspects. Each course aims to cultivate particular abilities, such as students’ computing ability, mathematical logical ability, language expression ability, etc. Through students’ performance in the learned courses, we can infer their ability in some aspects. If the capabilities required by the predicted course are what the students have, they are more likely to get high marks in this course. Motivated by this, our approach is based on representing students’ capability components and the courses’ capability requirements. We get students’ ability representation according to their achievements in the learned courses. At the same time, we obtain the representation of the ability requirements for a specific course according to all students’ achievements in this course.
The basic idea of matrix decomposition technology is to map two kinds of related things to a common low-dimensional vector space. In the educational situation, courses and students are related to each other. And they can be represented as a vector of
Based on the historical score table, estimating the representation of students and the learned courses is actually to optimize Eq. (2).
here
The implementation process of obtaining student and course vectors is as follows: (1) randomly generate each student vector and each learned course vector; (2) calculate the predicted score
After obtaining all student and course vectors, fill in the null score values according to Eq. (1).
To better predict students’ academic performance in a specific course, we need first to extract the representation of students’ characteristics. Many factors, internal and external factors, can influence a student’s achievements in a course. Internal factors include students’ knowledge capability structure, whether careless, etc. And the external factors include the course knowledge and capability requirements, the difficulty of the course, and so on. According to the characteristics of discipline, each course has its particular ability training objectives. And the course scores of a student in the previous semesters form a sequence, which reflects students’ abilities in various aspects and their evolution to a certain extent.
In order to capture various aspect features and represent students more comprehensively, Multilayer Perceptrons (MLP), Graph Neural Networks (GNN), and Recurrent Neural Network (RNN) are introduced in the feature extraction part of the model. MLP is used to extract vector representations of knowledge structure and ability features based on students’ past performance in various courses. Using GNN for feature representation extraction can integrate neighbouring features that are similar to one’s own performance. This way, when predicting one’s performance in a certain course, it is equivalent to referring to the performance of those who are similar to one’s own characteristics, thus can obtain a more reasonable feature representation. The introduction of RNN is aimed at obtaining the evolutionary characteristics of students’ various knowledge and abilities.
The Recurrent Neural Network (RNN) [53] is a type of artificial neural network in which a node’s output is determined by the current input and the hidden state that contains the information about the previous inputs. The inherent characteristics of RNN make it capable of exhibiting temporal dynamic behavior. LSTM [50] and GRU [54] are two excellent RNNs, which have been successfully applied in sequential or time-series related data, such as natural language processing and weather forecasting. The performance of LSTM and GRU is similar, and both can learn long-term dependencies between data. In general, GRU has fewer parameters and is faster than LSTM because GRU has two gates while LSTM has three gates. Therefore, our model adopts the GRU to learn the representation of students’ capability composition and its evolution process.
The student’s final score in a course is the summation of the scores in each knowledge point, which is a comprehensive reflection of the matching degree of the student’s capabilities and the corresponding ability requirements of the course. Therefore, even if two students get the same final score in one subject, they may still have different capabilities components. To convert a student’s score in a specific course into their capability composition representation, we perform an element-wise multiplication of the student vector and the corresponding course vector obtained in the data preparation stage to represent the student’s ability composition vector. Specifically, if
where
In practice, it is difficult to determine the exact order of each course in the same semester with only the results of each semester. Because the order of course scores in the same semester is arbitrary when organizing the data. However, sometimes the courses offered in the same semester also have a specific order in the discipline cultivation plan, and some courses are preliminary for others. For instance, given a twenty-week semester, some courses may be scheduled in the first ten weeks, and others may be arranged in the last ten weeks. To better deal with such a situation, we employed the bidirectional GRU (BiGRU) to get the scores’ forward and backward sequence vector representation. Then concatenate the two vectors of each direction to form the representation of the student.Eqs. (5)–(8) indicates the calculation of the hidden sequences along one direction of GRU. If we denote this procedure as
In addition to personal capability, students’ course performance is also related to the intrinsic characteristics of the course. For example, some courses are very difficult, and students’ scores in these courses are generally low. Therefore, when predicting students’ performance in a specific course, we should also refer to the performance of other students with similar characteristics in this course to make a more reasonable prediction. And some studies are based on such traits to predict student performance. For instance, Alharbi et al. [37] studied use K-Nearest Neighbor (KNN) algorithm to predict students’ performance in the course. In recent years, graphical neural networks (GNN) [52] have been successfully applied in many fields, such as relationship mining, medical diagnosis, and personalized recommendation.
In many cases, especially when the number of samples is small, or the data is sparse, the graphical neural networks perform better than many other methods. The graph neural network’s main idea is to fully use and reference similar neighbors’ information when making predictions or inferences. The operation between the Graph Convolution Layers proposed by Kipf et al. [52] can be illustrated as Eq. (12).
where
Inspired by the literature mentioned above, we introduce the graph neural network to our model to get a better representation of the students. Since the primary motivation of GNN is to aggregate the corresponding neighbors, thus the key to the problem is to obtain the representation of the node’s neighbor information, also known as the adjacency matrix. In graphical neural networks, one’s neighbors usually refer to related or similar objects. However, the relationship and similarities between students are not explicitly provided in our situation, which needs to be constructed. In this paper, we introduced the automatic learning mechanism to obtain the similarity between students in terms of capability and knowledge structure. This is different from other methods [31], as it does not require the use of complex rules to extract relevant features of students and courses. Instead, it automatically obtains features and their relationships through end-to-end training of the model. Concretely, the previous semester scores, of which null values have been filled in, of the students are input into a two-layer Multilayer Perceptron (MLP) to get the vector representation of students and then calculate the similarity of students based on the vectors learned through the networks. The two-layer Multilayer Perceptron can be expressed as Eq. (13).
where
For a dataset with N students, the adjacent matrix
Then the student’s representation
3.3 Academic Performance Prediction
The prediction is performed based on the learned student feature representation. In the previous subsections, we adopted two methods, bidirectional GRU and Graph Neural Networks, to calculate the vector representation of students, and each student got two vectors,
Then input the vector S to the neural networks to predict the student’s performance on the target course. What we adopt here is a one-layer, fully connected neural network. Therefore, the predicted score
where
Almost all university educational management systems store the students’ course achievements. Using the previous course results to predict the upcoming course grades is very important for education managers, instructors, and students. Predicting student’s performance in the fifth semester is even critical. It is because, currently, many universities require students to choose their majors at the end of the second semester of their sophomore year, that is, at the end of the fourth semester. Predicting students’ academic performance in the fifth-semester courses can not only guide them to select courses but also guide them to decide on their major discipline.
For performing the early prediction, longitudinal academic achievement data is needed. And the dataset used in this study is retrieved from the educational management system of a public university in China, which includes 1225 students from the 2017 to 2019 academic year, covering six discipline specialties. There are 44 courses in the data set, twelve of which are courses offered in the fifth semester by different disciplines, and they are the target prediction courses. The results of all courses are represented with a numeric value range between 0 and 100. And the courses that are not marked with numeric values have been omitted. The completion of a specific course required a score of at least 60. Students with achievement scores below 60 mean they failed the course, and those above 60 are successful. In higher education, students who fail to pass their courses are forced to retake them before graduation. In this case, such students may obtain multiple scores for the same course in different semesters, and we only consider the scores obtained in the earliest semester.
All twelve target courses are the professional core courses offered by the College of Computer Information and Engineering, including RFID principle and application, microcomputer principle and interface technology, communication principle, etc. For the convenience of representation, we denote the twelve courses as C1, C2, ..., C12, respectively. To make predictions, we first extract the students who attended the related courses from the total dataset to form twelve sub-datasets. The attributes of university courses may vary. Some are required courses, and some are optional courses. Students must take mandatory courses in a specific semester, while elective courses are more flexible. It will result in sparse course score data. For those courses with fewer students, the scores in that column are mainly empty. If there are too many null values, it will increase the difficulty of data preprocessing and reduce the accuracy of filling values. We set a threshold for choosing the previous courses to obtain a more predictable dataset. For example, only the courses selected by more than 80% of the students in the target courses are retained. Table 1 briefly describes the dataset used in this paper. The course score is between 1 and 100, and the distribution of each target prediction course score is shown in Fig. 2.
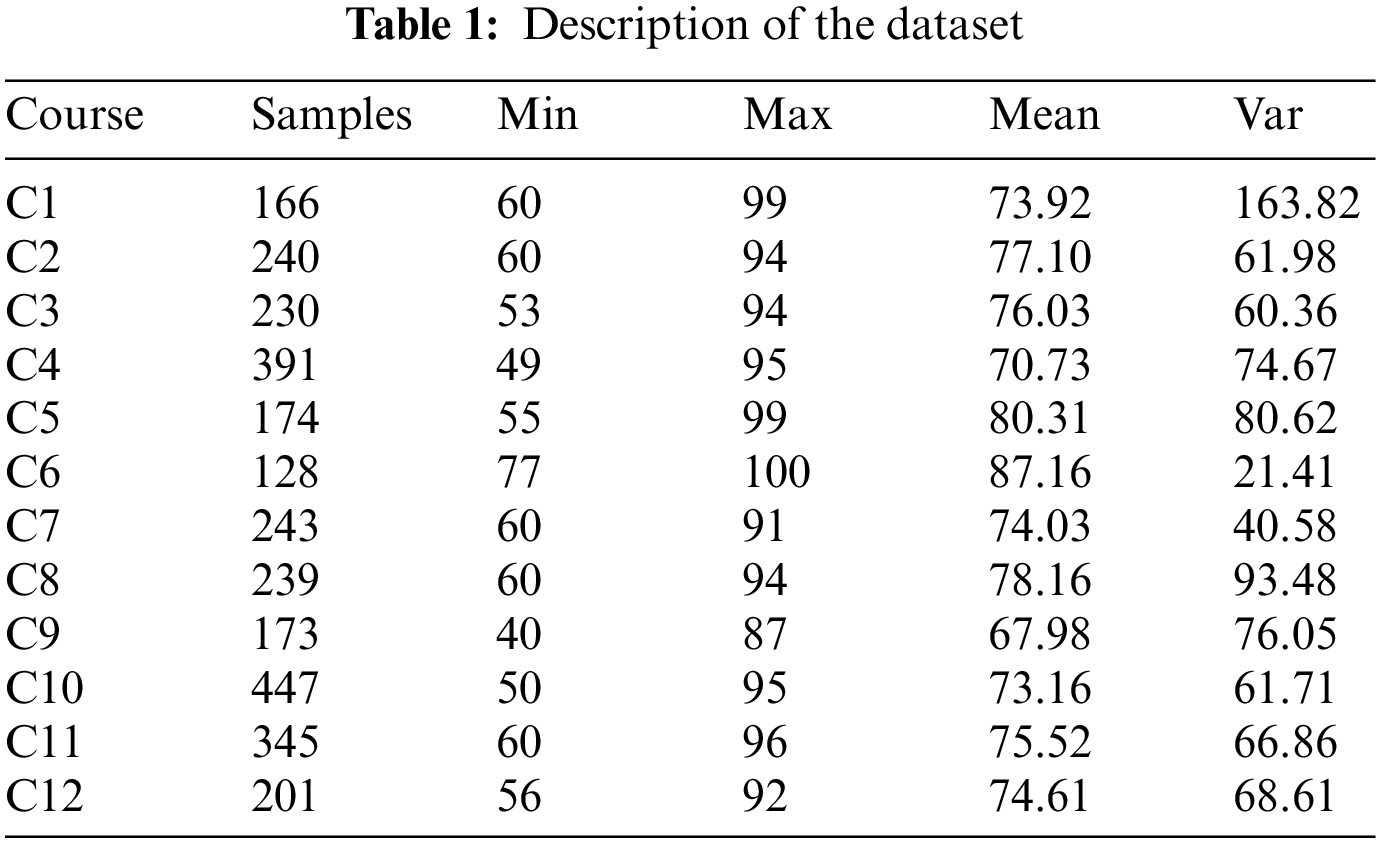
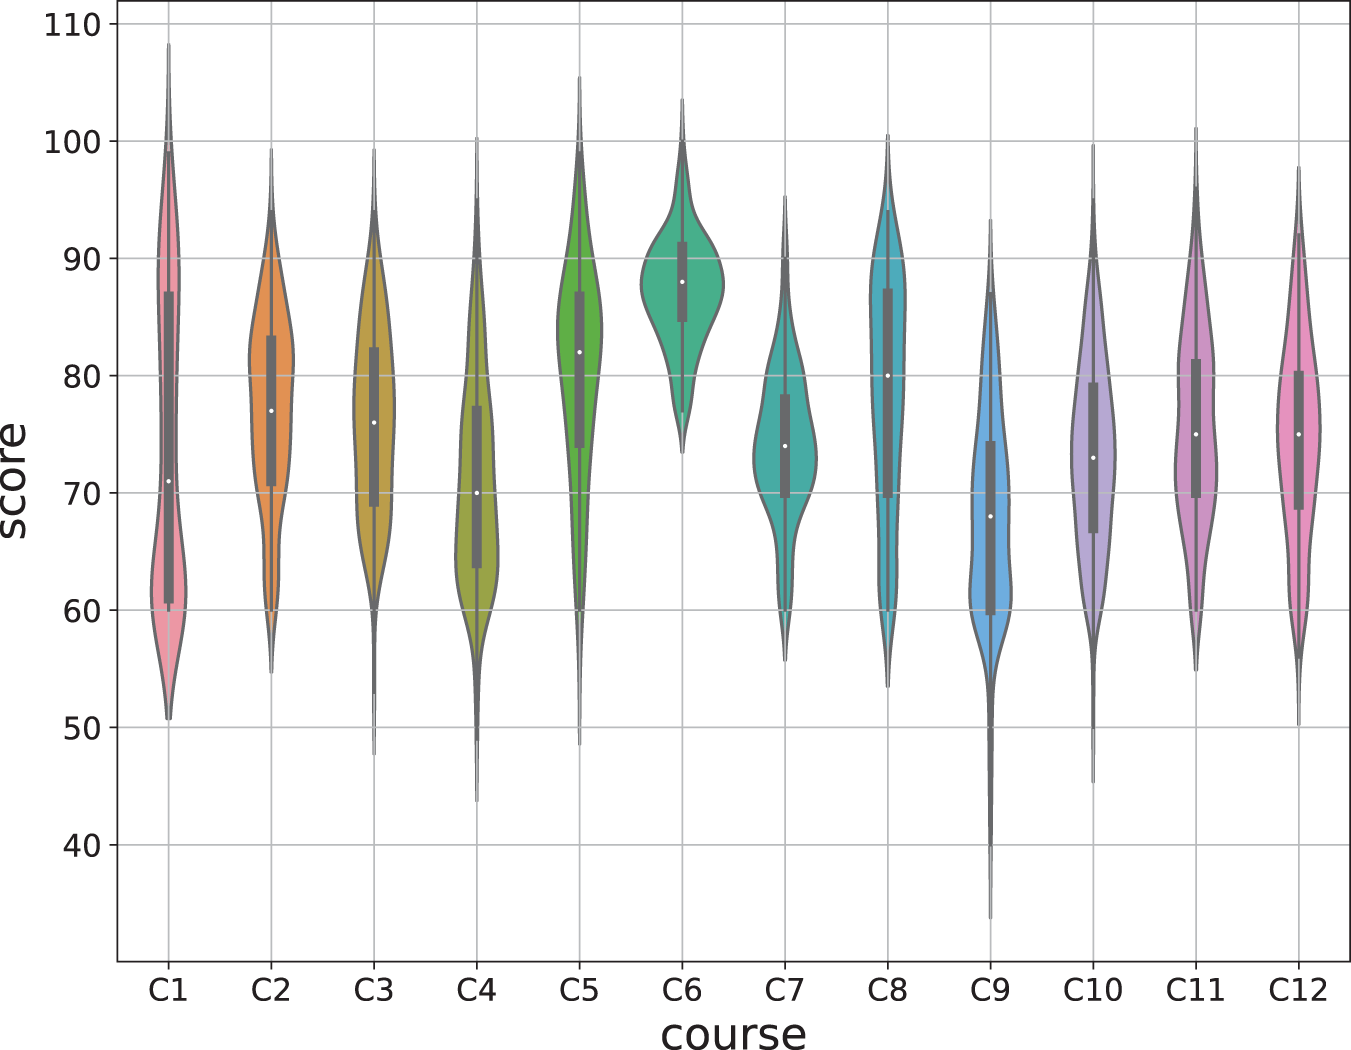
Figure 2: Course score distribution of the dataset
5 Experimental Results and Discussion
For comparing and evaluating the effectiveness of the proposed model, many commonly used EDM methods are adopted as the baselines, including Naïve Bayesian (NB), Linear Regression (LR) [43,44], Decision Tree (DT) [1,42],
For value prediction, Mean Absolute Error (MAE) and Mean Square Error (MSE) are the two commonly used indicators measuring the difference between the predicted value and the actual true value. The smaller the value, the better. Given N instances, the prediction error for instance
where
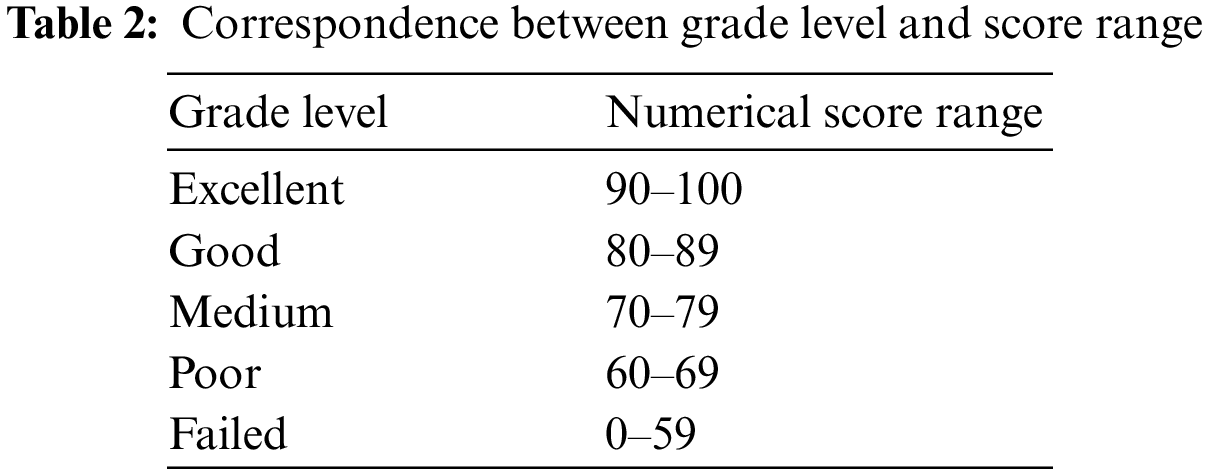
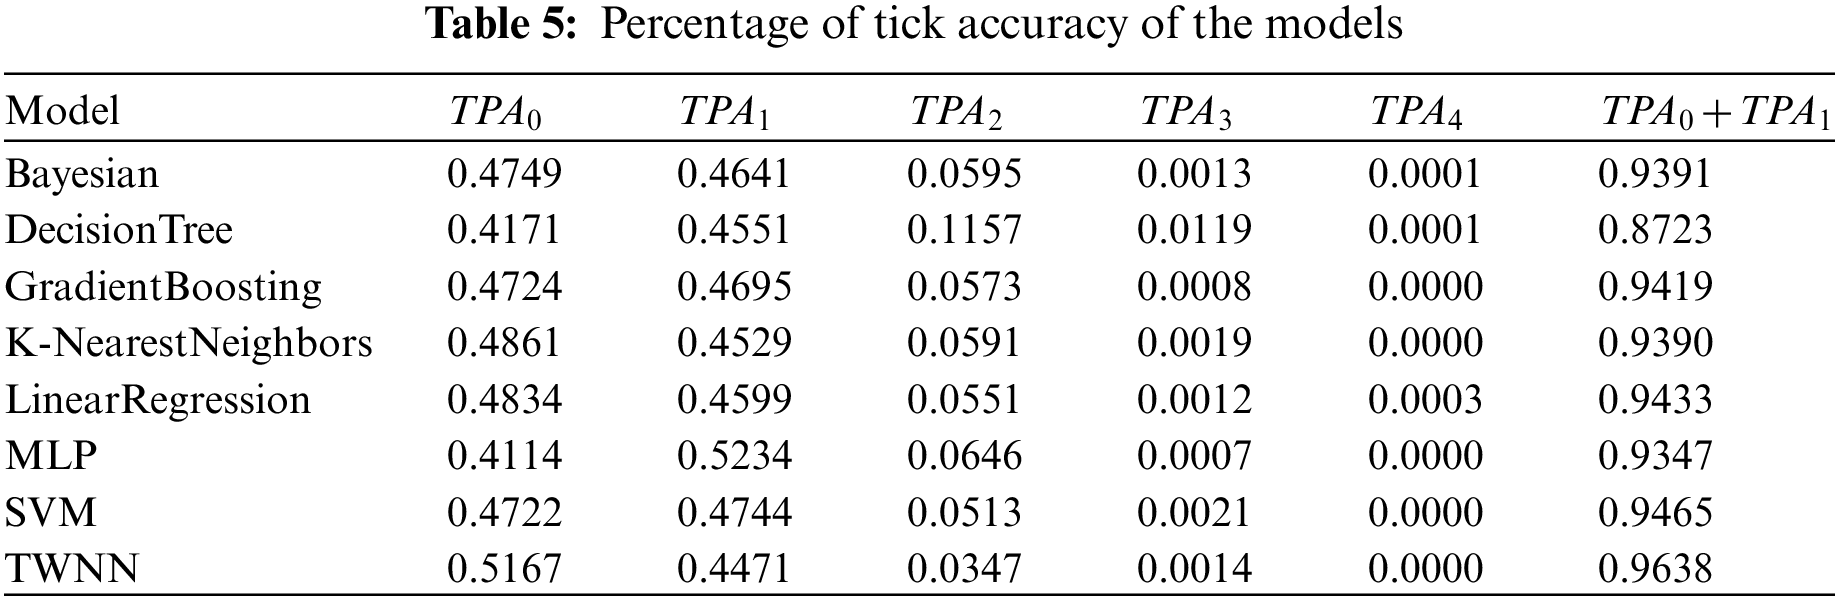
In addition to using the hundred-point score system to express students’ course achievement results, the grading system is another commonly adopted measure. For example, the widely used five-level grading system in china is excellent, good, medium, poor, and failed. Table 2 shows the grade levels and their associated numerical score ranges. Predicting which level of students’ course learning achievements can be viewed as an ordered category classification prediction issue, and its frequent evaluation measure is the Percentage of Tick Accuracy (PTA) [37]. For calculating PTA, the first step is to convert the ground truth score values, and the corresponding predicted score values to the grade level. And then calculate the ticks difference between two consecutive grade levels based on the predicted grade level and the ground truth grade level. The PTAs are calculated as Eq. (24).
where N is the total number of instances,
The experiments were carried out on a desktop PC with 20 GB main memory, 2.4 GHz Intel(R) Core(TM) i5 6200U processor, and 64-bit Windows 10 operating system. The proposed model is implemented in Python 3.9 using the PyTorch 1.12.1 library. In the training phase, mean squared error is adopted as the loss function. The Adam optimization algorithm is used to optimize the loss function, the learning rate is set to 0.01, and the weight decay is set to 0.01. For deep learning, when the sample size is insufficient, the most likely problem is overfitting. The main cause is that the capacity of the model is oversize for the data set sample size. Common solutions to this situation include early stopping, regularization, and dropout [59]. This paper adopts model capacity limitation and dropout methods. Specifically, to avoid the issue of over model capacity, we set the dimensions of the student and course representation vectors of the model to be the same as the number of courses in the data set. And the dimensions of the GRU hidden state to be consistent with them. Meanwhile, during the model training process, the fully connected (FC) layer for academic prediction adopts dropout technique, with a dropout ratio of 0.5.
Cross-validation is a resampling method used to estimate how accurately a model will perform in practice. And the K-fold cross-validation is a commonly used strategy for estimating the skill of machine learning models, especially when the number of the dataset size is relatively small. It randomly divides the set of observations into K folds of approximately equal size. Each time, use one fold as the test set and the rest as the training set to train the model parameters. Our experiments are similar to the K-fold cross-validation approach. And the specific operations are as the following two steps for each sub-dataset of the target prediction course: (1) randomly split the dataset into a training set (70%) and a testing set (30%), and use the training set for model parameters tuning. The testing set is to evaluate the model performance; (2) repeated the process (1) ten times. Following these procedures, each method performs ten rounds on each target course with a different training and testing dataset. Then the final result of each course is the average of the effects on the ten test sets.
Figs. 3 and 4 show the average results of various methods on 12 target courses. Fig. 3 is the results for the MSE indicator, while Fig. 4 is the results for the MAE indicator. From the results of Figs. 3 and 4, it can conclude that the overall performance of the proposed model is better than that of the baselines on both MSE and MAE indicators because the proposed model obtained much lower MSE and MAE values than the baselines. Among the baselines, Bayesian and GradientBoosting performed best on MSE indicators, followed by LinearRegion, SVM, and
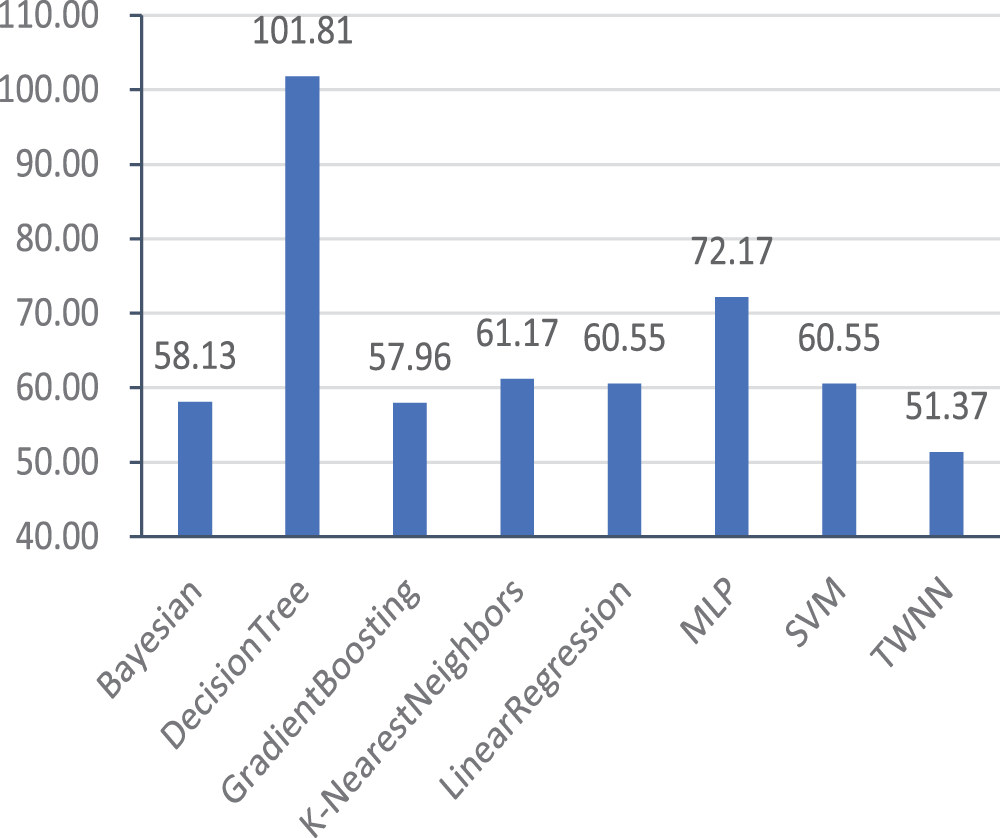
Figure 3: Average MSE of each model

Figure 4: Average MAE of each model
Table 1 shows the variance of each target course score, and Table 3 shows the detailed results of each model on the MSE indicator. As can be seen from Tables 1 and 3, except for DecisionTree and MLP, the MSE value of each method is smaller or very close to the variance of the target course scores, which means that these models are effective in predicting the course performance using the previous course performance. It can also be observed that when the data variance is significant, as shown in Table 1 and Fig. 2, the prediction effect of DecisionTree is much worse, such as its performance in courses C1 and C8. In addition, when the data is very concentrated, it is more challenging to build accurate and effective prediction models. For example, although the MSE value of each model on course C6 is minor, the prediction effect of each model is not significant. It is because the variance of the course score is only 21.44, and the MSE of each model is greater than 21.44 except TWNN, which is just a little smaller than it. In other words, using the average score of the course as the predicted result of the course is better than the predicted result given by the model. There may also be another reason for the poor effect of the model, which is the problem of sample size. For course C6, the number of samples is too small, with only 128 instances total, which is not conducive to training the model.
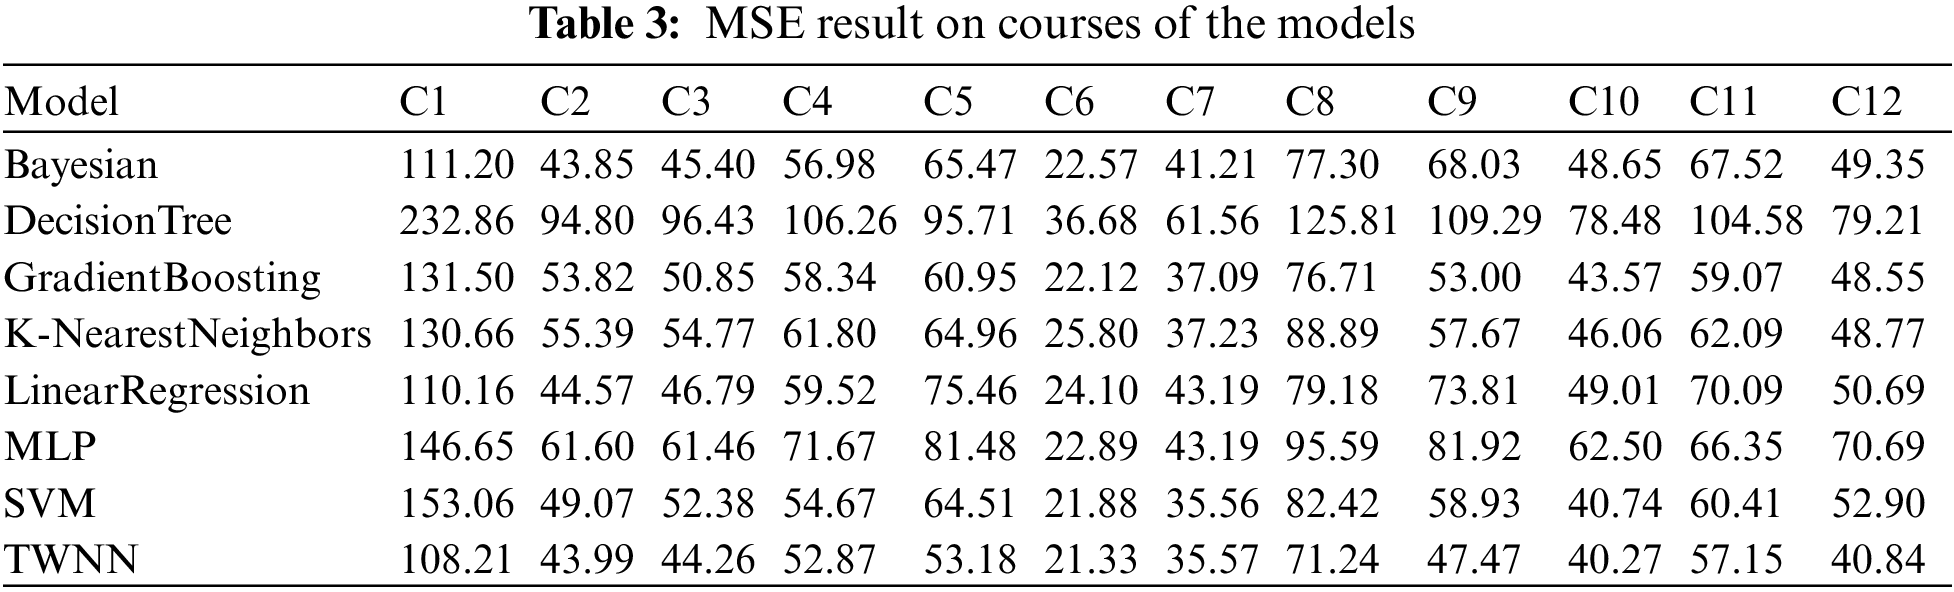
Table 4 shows the detailed results of each model on the MAE indicator. It can be seen from Table 4 that TWNN has good accuracy in predicting scores, and its prediction error is much lower than other methods in most courses. For example, although the score distribution of course C10 is relatively wide, its highest score is 95, and the lowest score is 50, while the average prediction error of TWNN is only 5.06.
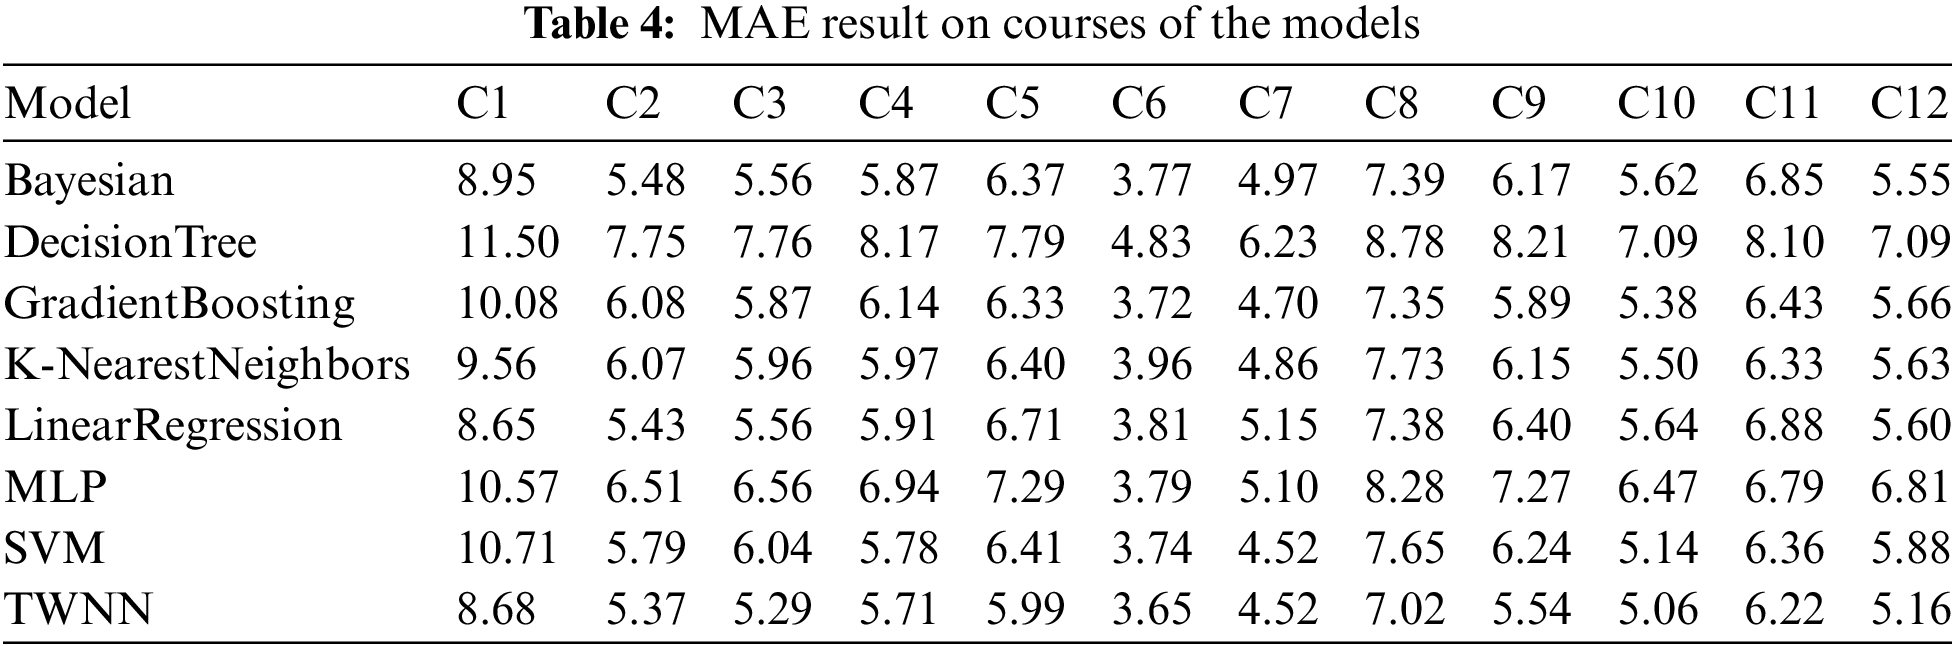
Table 5 shows the Percentage of Tick Accuracy of the models. And it can be seen that for a five-level grading system, TWNN can predict the exact grade level of students in a coming course, and the accuracy is 51.67%. And the accuracy with one tick error is 44.71%. The total percentage of tick accuracy with equal or less than one tick is 96.38%. It is beneficial for finding at-risk students. Because for a five-level system with excellent, good, medium, poor, and fail, if a student’s performance is predicted as the fail level, its probability of failing the course or getting poor academic performance would be more than 96%. And such students need to be given special attention or take necessary measures.
To understand the effectiveness of each component in the proposed Two-Way Neural Networks model, we conducted the ablation experiment study. And Table 6 shows the detailed results of the ablation experiment. And the way column in Table 6 indicates different component combinations, where 2 ways means the combined effect of the bidirectional GRU and graph two parts, GRU indicates the effect when only the bidirectional GRU part works, and graph indicates the effect when only the graph part works. As seen from Table 6, the combined effect of the two parts is better than that of any single one in terms of average effect in all target courses. Of the two components, the graph part plays a significant role in the model. Adding bidirectional GRU to the graph will significantly improve the model’s performance in some cases, such as in course C10. While in some cases, it will degrade the model’s performance, such as in course C1 and course C5. Further research found this may be related to the data set’s distribution characteristics and sample size. When the bidirectional GRU part is added to the graph part, the capacity of the whole model increases, and more training samples are needed [60]. If the sample size is insufficient, the model cannot be effectively trained, which will reduce the effect of the model. And the sample size of courses C1 and C5 is too small, and the total sample size is only 166 and 174, respectively, much smaller than the size of course C10.
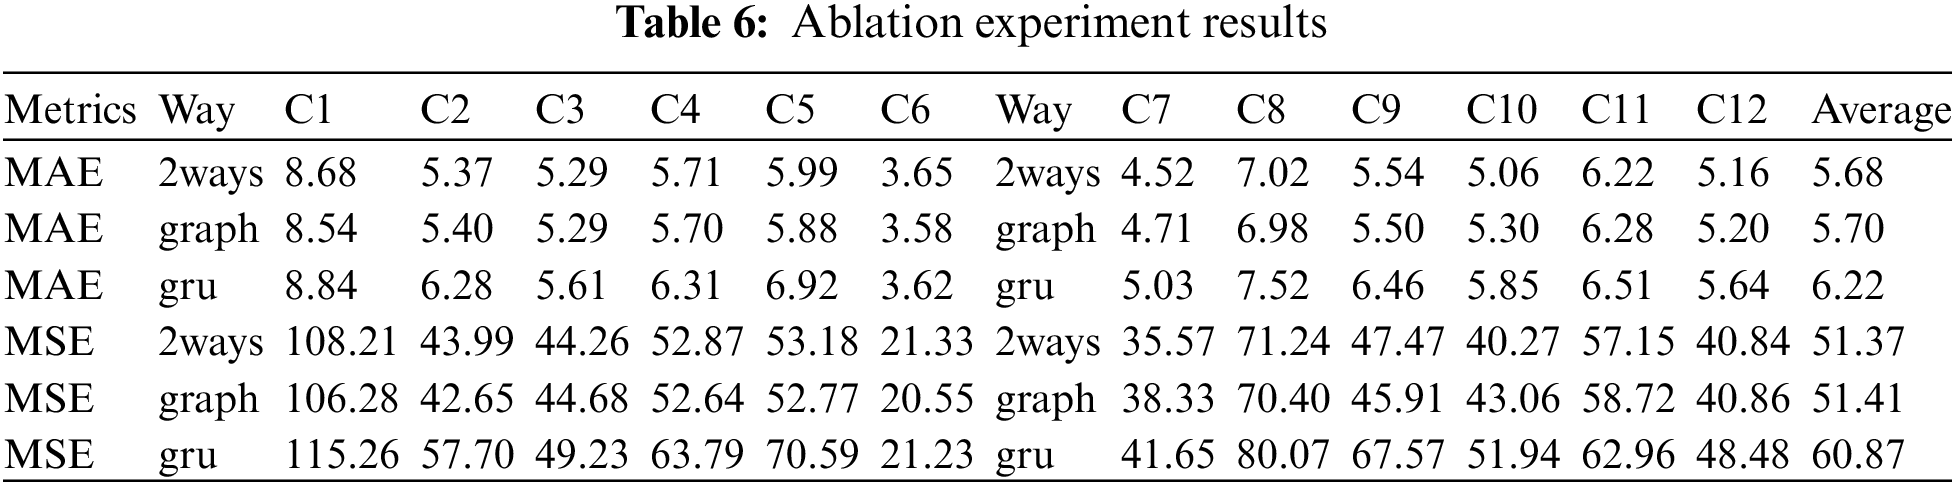
Besides, from Tables 3, 4 and 6, we can also find that among the three deep learning models: MLP, GRU, and GNN, GNN perform best, followed by GRU, and MLP performs the worst. The reasons may be due to the fact that the GNN model not only uses the potential feature information extracted from the students’ previous achievements but also synthesizes the performance of students with similar characteristics in the target prediction course to give the prediction results, thus can further improve the prediction performance of the model. Especially when the sample size is small, this advantage of GNN is more pronounced, which makes the performance of GNN better than other deep learning models. For example, the performance of GNN on course C5 is far better than that of MLP and GRU.
Predicting student performance is helpful for students and educators in improving their learning and teaching processes. Deep learning model, especially graph neural network, has been widely used in recent years and has achieved good results.
A novel Two-Way Neural Networks model based on deep learning technology is proposed to address student achievement prediction in education. It only uses students’ previous course achievements to predict their future course academic performance in the face-to-face offline learning environment. Given the small sample size and sparse data of offline education data, we introduced neural network and matrix decomposition technology into the model. Firstly, the matrix decomposition technology is adopted to fill in the blank values of the course score matrix. And then, the graph neural network is used to get the comprehensive feature representation of students based on the similarity automatically captured by the artificial neural network. Meanwhile, we introduced the bidirectional GRU to capture the evolution of students’ academic achievements and knowledge structure. Finally, the feature representation obtained from the graph neural network and the bidirectional GRU is integrated and input into the fully connected network to predict the students’ scores in future courses. Results on a real dataset show that the proposed model is better than the baselines in the three most used evaluation indicators.
The ablation experiment demonstrates that the graphical neural network plays a dominant role in the TWNN model. Therefore, when the sample size is small, or the training speed of the model needs to be further improved, only the graphical neural network can obtain good results. Combining the two parts can achieve even better results if the sample size is sufficient. It is hoped that the proposed model of learning achievement prediction can provide a new idea for academic performance prediction in the field of education.
Despite the excellent performance of the proposed model, it also has certain limitations. For instance, this paper only studied the predictive effect of students’ previous achievements on future courses. A good deal of literature demonstrates that many factors impact students’ course achievements, including family background, parents’ occupation, psychological characteristics, time and energy spent on related courses, degree of interest in courses, class attendance, etc. In addition, in recent years, Transfer Learning and Few-Shot Learning have aroused extensive interest of researchers, and have been successfully applied in some application fields. For example, the transfer learning method attempts to apply the model trained on one data set to another relevant or similar data set. The applied model does not need to be re trained on a new data entirely, but only needs to fine tune some parameters. This can save training time and reduce the overfitting problem caused by insufficient samples of the target data set. At present, it has been successfully applied in the field of image recognition. This has important reference significance for predicting offline performance. In future research, we will try to expand and enrich the data information source, and exploring more approaches to improve the prediction effect of the model.
Acknowledgement: The authors wish to express their appreciation to the reviewers for their helpful suggestions which greatly improved the presentation of this paper. We are also very grateful to the editors for their patient and friendly reminders, as well as for their efforts in editing the manuscript.
Funding Statement: This work was supported in part by the National Natural Science Foundation of China under Grant Nos. U2268204, 62172061 and 61662017; National Key R&D Program of China under Grant Nos. 2020YFB1711800 and 2020YFB1707900; the Science and Technology Project of Sichuan Province under Grant Nos. 2022YFG0155, 2022YFG0157, 2021GFW019, 2021YFG0152, 2021YFG0025, 2020YFG0322; the Guangxi Natural Science Foundation Project under Grant No. 2021GXNSFAA220074.
Author Contributions: The authors confirm contribution to the paper as follows: study conception and design, draft manuscript preparation: Xinzheng Wang; analysis and interpretation of results: Bing Guo; data collection: Yan Shen. All authors reviewed the results and approved the final version of the manuscript.
Availability of Data and Materials: Data will be made available on request.
Conflicts of Interest: The authors declare that they have no conflicts of interest to report regarding the present study.
References
1. Sultana, S., Khan, S., Abbas, M. A. (2017). Predicting performance of electrical engineering students using cognitive and non-cognitive features for identification of potential dropouts. The International Journal of Electrical Engineering & Education, 54(2), 105–118. [Google Scholar]
2. Irwin, V., de la Rosa, J., Wang, K., Hein, S., Zhang, J. J. et al. (2022). Report on the condition of education 2022 (nces 2022-144). Technical Report, U.S. Department of Education, Washington DC: National Center for Education Statistics. https://nces.ed.gov/pubs2022/2022144.pdf [Google Scholar]
3. Street, H. (2010). Factors influencing a learner’s decision to drop-out or persist in higher education distance learning. Online Journal of Distance Learning Administration, 13(4), 1–5. [Google Scholar]
4. Yang, D., Sinha, T., Adamson, D., Rosé, C. P. (2013). Turn on, tune in, drop out: Anticipating student dropouts in massive open online courses. https://www-cs.stanford.edu/~diyiy/docs/nips13.pdf [Google Scholar]
5. Yang, T. Y., Brinton, C. G., Joe-Wong, C., Chiang, M. (2017). Behavior-based grade prediction for moocs via time series neural networks. IEEE Journal of Selected Topics in Signal Processing, 11(5), 716–728. [Google Scholar]
6. Asuntha, A., Srinivasan, A. (2020). Deep learning for lung cancer detection and classification. Multimedia Tools and Applications, 79(11–12), 7731–7762. [Google Scholar]
7. He, X., Chua, T. S. (2017). Neural factorization machines for sparse predictive analytics. Proceedings of the 40th International ACM SIGIR Conference on Research and Development in Information Retrieval, pp. 355–364. Shinjuku, Tokyo, Japan. [Google Scholar]
8. Wen, P., Yuan, W., Qin, Q., Sang, S., Zhang, Z. (2021). Neural attention model for recommendation based on factorization machines. Applied Intelligence, 51(4), 1829–1844. [Google Scholar]
9. Faroukhi, A. Z., Alaoui, I. E., Gahi, Y., Amine, A. (2020). Big data monetization throughout big data value chain: A comprehensive review. Journal of Big Data, 7, 3. https://doi.org/10.1186/s40537-019-0281-5 [Google Scholar] [CrossRef]
10. Romero, C., Ventura, S. (2010). Educational data mining: A review of the state of the art. IEEE Transactions on Systems, Man, and Cybernetics, Part C (Applications and Reviews), 40(6), 601–618. [Google Scholar]
11. Shahiri, A. M., Husain, W., Rashid, N. A. (2015). A review on predicting student’s performance using data mining techniques. Procedia Computer Science, 72, 414–422. [Google Scholar]
12. Dutt, A., Ismail, M. A., Herawan, T. (2017). A systematic review on educational data mining. IEEE Access, 5, 15991–16005. [Google Scholar]
13. Salloum, S. A., Alshurideh, M., Elnagar, A., Shaalan, K. (2020). Mining in educational data: Review and future directions. In: Advances in intelligent systems and computing, pp. 92–102. Cham: Springer. https://doi.org/10.1007/978-3-030-44289-7_9 [Google Scholar] [CrossRef]
14. Anand, M. (2018). Advances in EDM: A state of the art. In: Advances in intelligent systems and computing, pp. 193–201. Singapore: Springer. [Google Scholar]
15. Fernandes, E., Holanda, M., Victorino, M., Borges, V., Carvalho, R. et al. (2019). Educational data mining: Predictive analysis of academic performance of public school students in the capital of brazil. Journal of Business Research, 94, 335–343. [Google Scholar]
16. Romero, C., Ventura, S. (2020). Educational data mining and learning analytics: An updated survey. WIREs Data Mining and Knowledge Discovery, 10(3), 1. [Google Scholar]
17. Qazdar, A., Er-Raha, B., Cherkaoui, C., Mammass, D. (2019). A machine learning algorithm framework for predicting students performance: A case study of baccalaureate students in Morocco. Education and Information Technologies, 24(6), 3577–3589. [Google Scholar]
18. Rastrollo-Guerrero, J. L., Gómez-Pulido, J. A., Durán-Domínguez, A. (2020). Analyzing and predicting students’ performance by means of machine learning: A review. Applied Sciences, 10(3), 1042. [Google Scholar]
19. Saleh, M. A., Palaniappan, S., Abdallah, N. A. A., Baroud, M. M. B. (2021). Predicting student performance using data mining and learning analysis technique in libyan higher education. Periodicals of Engineering and Natural Sciences, 9(3), 509–519. [Google Scholar]
20. Li, S., Liu, T. (2021). Performance prediction for higher education students using deep learning. Complexity, 2021, 1–10. [Google Scholar]
21. Xiao, W., Ji, P., Hu, J. (2021). A survey on educational data mining methods used for predicting students’ performance. Engineering Reports, 4(5), e12484. [Google Scholar]
22. Asif, R., Merceron, A., Ali, S. A., Haider, N. G. (2017). Analyzing undergraduate students’ performance using educational data mining. Computers & Education, 113, 177–194. [Google Scholar]
23. Moubayed, A., Injadat, M., Shami, A., Lutfiyya, H. (2020). Student engagement level in an e-learning environment: Clustering using k-means. American Journal of Distance Education, 34(2), 137–156. [Google Scholar]
24. Li, M., Shi, R. (2015). Mining the relation between dorm arrangement and student performance. 2015 IEEE International Conference on Big Data (Big Data), pp. 2344–2347. Santa Clara, CA, USA. https://doi.org/10.1109/BigData.2015.7364025 [Google Scholar] [CrossRef]
25. Naganawa, T., Itoh, H., Funahashi, K. (2020). Analysis of the relationship between university attendance and grades by data mining. 2020 IEEE 9th Global Conference on Consumer Electronics (GCCE), pp. 134–137. Kobe, Japan. https://doi.org/10.1109/GCCE50665.2020.9291916 [Google Scholar] [CrossRef]
26. Wang, X., Guo, B., Shen, Y. (2022). Predicting the at-risk online students based on the click data distribution characteristics. Scientific Programming, 2022, 1–12. [Google Scholar]
27. Hao, J., Gan, J., Zhu, L. (2022). MOOC performance prediction and personal performance improvement via bayesian network. Education and Information Technologies, 27(5), 7303–7326. [Google Scholar]
28. Pappano, L. (2012). The year of the MOOC. The New York Times, 2(12), 2012. [Google Scholar]
29. Brinton, C. G., Rill, R., Ha, S., Chiang, M., Smith, R. et al. (2015). Individualization for education at scale: MIIC design and preliminary evaluation. IEEE Transactions on Learning Technologies, 8(1), 136–148. [Google Scholar]
30. Bai, X., Zhang, F., Li, J., Guo, T., Aziz, A. et al. (2021). Educational big data: Predictions, applications and challenges. Big Data Research, 26, 100270. [Google Scholar]
31. Lu, X., Zhu, Y., Xu, Y., Yu, J. (2021). Learning from multiple dynamic graphs of student and course interactions for student grade predictions. Neurocomputing, 431, 23–33. [Google Scholar]
32. Saa, A. A., Al-Emran, M., Shaalan, K. (2019). Factors affecting students’ performance in higher education: A systematic review of predictive data mining techniques. Technology, Knowledge and Learning, 24(4),567–598. [Google Scholar]
33. Charitopoulos, A., Rangoussi, M., Koulouriotis, D. (2020). On the use of soft computing methods in educational data mining and learning analytics research: A review of years 2010–2018. International Journal of Artificial Intelligence in Education, 30(3), 371–430. [Google Scholar]
34. Delianidi, M., Konstantinos Diamantaras, G. C., Nikiforidis, V. (2021). Student performance prediction using dynamic neural models. Fourteenth International Conference on Educational Data Mining (EDM 2021), Paris, France. https://arxiv.org/pdf/2106.00524.pdf [Google Scholar]
35. Venktesh, V., Akhtar, M. S., Mohania, M. K., Goyal, V. (2022). Auxiliary task guided interactive attention model for question difficulty prediction. Artificial Intelligence in Education, 13355, 477–489. [Google Scholar]
36. Strecht, P., Cruz, L., Soares, C., Mendes-Moreira, J., Abreu, R. (2015). A comparative study of classification and regression algorithms for modelling students’ academic performance. International Conference on Educational Data Mining (EDM), Madrid, Spain. [Google Scholar]
37. Alharbi, B., Assiri, F., Alharbi, B. (2021). A comparative study of student performance prediction using pre-course data. ADCAIJ: Advances in Distributed Computing and Artificial Intelligence Journal, 10(1), 49–61. [Google Scholar]
38. Xu, K., Liu, R., Sun, Y., Zou, K., Huang, Y. et al. (2017). Improve the prediction of student performance with hint’s assistance based on an efficient non-negative factorization. IEICE Transactions on Information and Systems, E100-D(4), 768–775. [Google Scholar]
39. Houbraken, M., Sun, C., Smirnov, E., Driessens, K. (2017). Discovering hidden course requirements and student competences from grade data. Adjunct Publication of the 25th Conference on User Modeling, Adaptation and Personalization, New York, NY, USA, Association for Computing Machinery. https://doi.org/10.1145/3099023.3099034 [Google Scholar] [CrossRef]
40. Rechkoski, L., Ajanovski, V. V., Mihova, M. (2018). Evaluation of grade prediction using model-based collaborative filtering methods. 2018 IEEE Global Engineering Education Conference (EDUCON), pp. 1096–1103. Santa Cruz de Tenerife, Spain. https://doi.org/10.1145/3099023.3099034 [Google Scholar] [CrossRef]
41. Siddique, A., Jan, A., Majeed, F., Qahmash, A. I., Quadri, N. N. et al. (2021). Predicting academic performance using an efficient model based on fusion of classifiers. Applied Sciences, 11(24), 11845. [Google Scholar]
42. Bujang, S. D. A., Selamat, A., Ibrahim, R., Krejcar, O., Herrera-Viedma, E. et al. (2021). Multiclass prediction model for student grade prediction using machine learning. IEEE Access, 9, 95608–95621. [Google Scholar]
43. Polyzou, A., Karypis, G. (2016). Grade prediction with models specific to students and courses. International Journal of Data Science and Analytics, 2(3–4), 159–171. [Google Scholar]
44. El Aissaoui, O., El Alami El Madani, Y., Oughdir, L., Dakkak, A., El Allioui, Y. (2020). A multiple linear regression-based approach to predict student performance. In: Ezziyyani, M. (Ed.A multiple linear regression-based approach to predict student performance. Cham: Springer International Publishing. [Google Scholar]
45. Cho, K., van Merrienboer, B., Gulcehre, C., Bahdanau, D., Bougares, F. et al. (2014). Learning phrase representations using RNN encoder-decoder for statistical machine translation. Proceedings of the 2014 Conference on Empirical Methods in Natural Language Processing (EMNLP), Doha, Qatar, Association for Computational Linguistics. https://aclanthology.org/D14-1179 [Google Scholar]
46. Krizhevsky, A., Sutskever, I., Hinton, G. E. (2017). ImageNet classification with deep convolutional neural networks. Communications of the ACM, 60(6), 84–90. [Google Scholar]
47. Lau, E. T., Sun, L., Yang, Q. (2019). Modelling, prediction and classification of student academic performance using artificial neural networks. SN Applied Sciences, 1(9), 1–10. [Google Scholar]
48. Naser, S. A., Zaqout, I., Ghosh, M. A., Atallah, R., Alajrami, E. (2015). Predicting student performance using artificial neural network: In the faculty of engineering and information technology. International Journal of Hybrid Information Technology, 8(2), 221–228. [Google Scholar]
49. Ramanathan, K., Thangavel, B. (2021). Minkowski sommon feature mapbased densely connected deep convolution network with lstm for academic performance prediction. Concurrency and Computation: Practice and Experience, 33(13), e6244. https://doi.org/10.1002/cpe.6244 [Google Scholar] [CrossRef]
50. Hochreiter, S., Schmidhuber, J. (1997). Long short-term memory. Neural Computation, 9(8), 1735–1780. [Google Scholar] [PubMed]
51. Koren, Y., Bell, R., Volinsky, C. (2009). Matrix factorization techniques for recommender systems. Computer, 42(8), 30–37. [Google Scholar]
52. Kipf, T. N., Welling, M. (2016). Semi-supervised classification with graph convolutional networks. arXiv preprint arXiv: 1609.02907. [Google Scholar]
53. Lipton, Z. C., Berkowitz, J., Elkan, C. (2015). A critical review of recurrent neural networks for sequence learning. arXiv preprint arXiv:1506.00019. [Google Scholar]
54. Cho, K., van Merrienboer, B., Bahdanau, D., Bengio, Y. (2014). On the properties of neural machine translation: Encoder-decoder approaches. arXiv preprint arXiv:1409.1259. 1409.1259. [Google Scholar]
55. Nair, V., Hinton, G. E. (2010). Rectified linear units improve restricted boltzmann machines. International Conference on Machine Learning, pp. 807–814. Haifa, Israel. [Google Scholar]
56. Jawthari, M., Stoffová, V. (2021). Predicting students’ academic performance using a modified kNN algorithm. Pollack Periodica, 16(3), 20–26. [Google Scholar]
57. Zhang, W., Wang, Y., Wang, S. (2022). Predicting academic performance using tree-based machine learning models: A case study of bachelor students in an engineering department in China. Education and Information Technologies, 27(9), 13051–13066. [Google Scholar]
58. Francis, B. K., Babu, S. S. (2019). Predicting academic performance of students using a hybrid data mining approach. Journal of Medical Systems, 43(6), 162. [Google Scholar] [PubMed]
59. Srivastava, N., Hinton, G. E., Krizhevsky, A., Sutskever, I., Salakhutdinov, R. (2014). Dropout: A simple way to prevent neural networks from overfitting. The Jornal of Machine Learning Research, 15(1), 1929–1958. [Google Scholar]
60. Zhang, C., Bengio, S., Hardt, M., Recht, B., Vinyals, O. (2021). Understanding deep learning (still) requires rethinking generalization. Communications of the ACM, 64(3), 107–115. [Google Scholar]
Cite This Article
 Copyright © 2024 The Author(s). Published by Tech Science Press.
This work is licensed under a Creative Commons Attribution 4.0 International License , which permits unrestricted use, distribution, and reproduction in any medium, provided the original work is properly cited.
 Downloads
 Citation Tools