
 Submit a Paper
 Propose a Special lssue
 Open Access
ARTICLE

An Adaptive Hybrid Optimization Strategy for Resource Allocation in Network Function Virtualization
1 School of Mathematics, South China University of Technology, Guangzhou, 510640, China
2 School of Electronic and Information Engineering, South China University of Technology, Guangzhou, 510640, China
* Corresponding Author: Delu Zeng. Email:
(This article belongs to the Special Issue: Advanced Computational Models for Decision-Making of Complex Systems in Engineering)
Computer Modeling in Engineering & Sciences 2024, 138(2), 1617-1636. https://doi.org/10.32604/cmes.2023.029864
Received 16 March 2023; Accepted 22 May 2023; Issue published 17 November 2023
 View Full Text
 Download PDF
Abstract
With the rapid development of Network Function Virtualization (NFV), the problem of low resource utilization in traditional data centers is gradually being addressed. However, existing research does not optimize both local and global allocation of resources in data centers. Hence, we propose an adaptive hybrid optimization strategy that combines dynamic programming and neural networks to improve resource utilization and service quality in data centers. Our approach encompasses a service function chain simulation generator, a parallel architecture service system, a dynamic programming strategy for maximizing the utilization of local server resources, a neural network for predicting the global utilization rate of resources and a global resource optimization strategy for bottleneck and redundant resources. With the implementation of our local and global resource allocation strategies, the system performance is significantly optimized through simulation.Keywords
Network Function Virtualization (NFV) [1] is an approach that allows network functions to be implemented using software running on virtualized hardware instead of dedicated physical devices. This approach was proposed by the operator’s alliance to replace dedicated hardware such as firewalls and deep packet inspection devices with virtualized resources on general-purpose hardware such as x86 servers, storage, and switching devices. The virtualization technology used in NFV enables hardware resources, such as computing power, storage capacity, and network bandwidth, to be abstracted and virtualized, so that they can be dynamically allocated and managed using software. This makes it possible for operators to manage these virtual resources more easily and efficiently. NFV provides several benefits for network operators, including the ability to deploy new network services more quickly and cost-effectively. With NFV, operators can quickly spin up new virtualized network functions by deploying and managing software applications on virtualized x86 servers. This is in contrast to traditional hardware-based deployments that require significant time and resources for installation and configuration. As shown in Fig. 1, the NFV architecture consists of x86 servers that host simplified functional applications (APPs) and virtual machines (VMs), which provide the necessary computing resources and software infrastructure needed to support various network functions. The virtual machines can run on top of hypervisors, which allow multiple virtual machines to run on a single physical server. This ability to consolidate multiple network functions onto a single hardware platform provides significant cost savings in terms of hardware and maintenance costs.
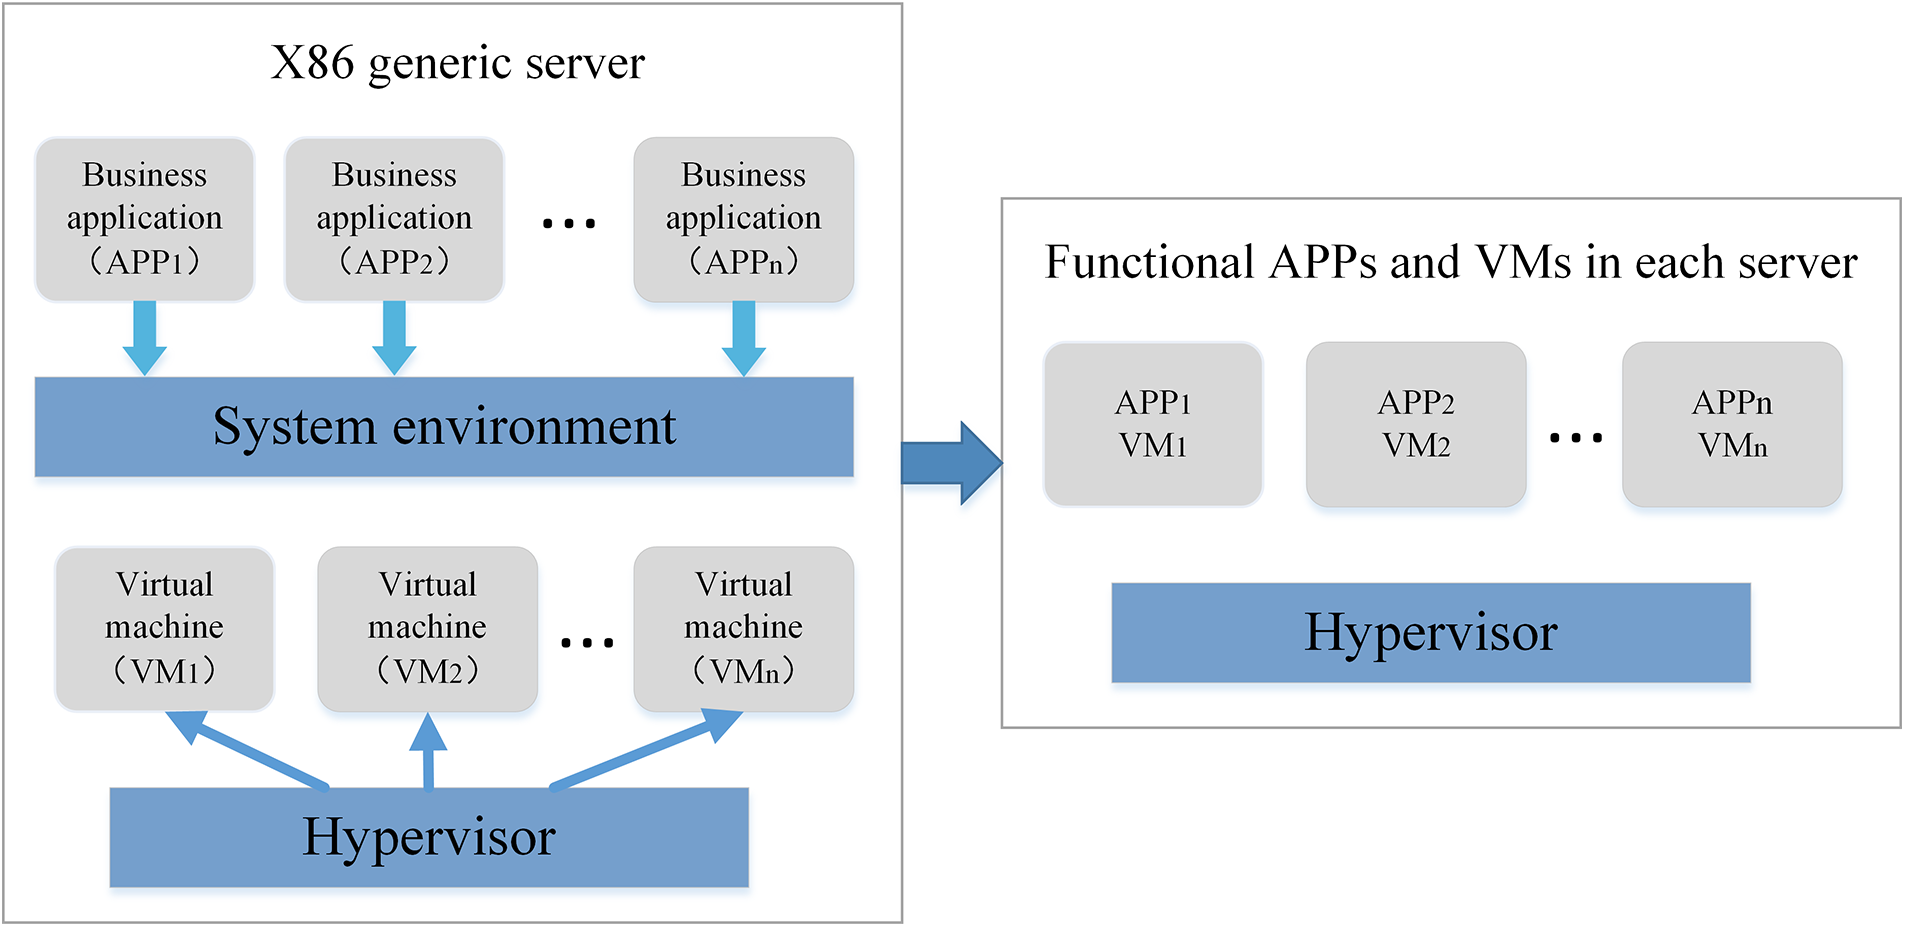
Figure 1: The x86 generic server configuration and simplified functional applications (APPs) and virtual machines (VMs) in each server under NFV technology
In a data center’s network communication, various network service functions are utilized such as firewall, deep packet inspection, and network address translation. These functions are then ordered and configured using a Service Function Chain (SFC) [2]. The SFC is an ordered set of abstract service functions that enable efficient and flexible traffic processing. As data packets travel through the data center’s network, they traverse the services in a collection in a sequential fashion. For example, an SFC such as “Fire Wall (FW)-Quality of Service (QoS)-Deep Packet Inspection (DPI)” can be configured. When a network service receives a data packet, it processes the packet for its specific function, and the traffic is then transferred to the next service function in the service chain until all functions of the service chain are completed.
In the scenario of Network Function Virtualization (NFV), each Service Function Chain (SFC) can create a network connection topology via virtual network services and virtual links. The SFC can then determine the forwarding paths to form an ordered virtual network service sequence. Network services allocated computing and storage resources in the infrastructure to execute these virtual service functions and coordinate virtual connection scheduling, thus completing related services for user data packets. To achieve optimal SFC processing efficiency, it is essential to utilize network resources effectively and efficiently, hence, low resource utilization and high equipment costs are pressing issues. In recent years, with the development of cloud computing technology, researchers and scholars have proposed many algorithms and strategies for virtual machine (VM) layout. These approaches include the VM placement method based on the association of network services in the network forwarding path [3].
Due to the complexity of network services and dynamic service requirements, significant research effort has been dedicated to developing algorithms and optimization methods to automate the scaling and placement of network services based on current requirements. In addition to determining the number and location of NFV’s server virtual machines (VMs), these algorithms must also determine the appropriate allocation of resources to each VM. Typically, VMs are instantiated with a fixed number of resources that are predetermined by the VM developer and specified in the VM descriptor. However, the resource requirements of VMs are not fixed, but rather vary depending on the traffic load. This means that allocating a fixed amount of resources can lead to under-allocation or over-allocation of resources. If resources are under-allocated, VMs may lack resources to process all packets, leading to packet loss, service quality degradation or even service function failure. As a result, operators try to avoid under-allocation by allocating fixed, large amounts of resources to each VM. However, this approach leads to over-allocation, wasted resources, discourages other VMs from using those resources, and results in unnecessarily high costs. Therefore, it is important to explore more efficient methods for allocating resources to VMs. One possible approach is to use dynamic resource allocation techniques based on actual traffic load, in which resources are allocated to VMs dynamically and adaptively. This can avoid both under-allocation and over-allocation of resources, and enables resources to be used in a more efficient manner, thus improving overall resource utilization and reducing costs.
However, these studies have limitations. Some focus exclusively on optimizing resource prediction for a single server, while others concentrate on predicting overall system resources without optimizing local and global resource scheduling in data centers. To address these shortcomings, inspried by [4], we propose an adaptive hybrid optimization strategy that combines dynamic programming with neural networks to enhance resource utilization and service quality intelligently and continuously. This strategy helps ensure good service quality while avoiding over- and under-allocation. Our contributions can be summarized as follows:
• We propose a functional integration framework that includes a virtual machine layout strategy, a redundant virtual machine layout strategy, and a banker resource scheduling optimization algorithm. This framework aims to optimize the allocation of resources within data centers.
• We design a dynamic resource allocation strategy for each virtual machine (VM) in data centers to enhance resource utilization. We assess and compare the impact of this strategy on data centers, and simulation results indicate that it improves resource utilization.
• We develop a neural network and training program to predict the utilization rate of resources and to design adjustment strategies that pre-adjust the allocation of resources after predicting bottleneck and redundant resources. This approach aims to enhance response speed and adjust system resources to a more reasonable level, improving the quality of service.
In this section, we will briefly review some resource allocation algorithms for demanded network services in NFV-based and other network infrastructures.
From the perspective of data resources, Rankothge et al. [5] have proposed a VNFs resource allocation algorithm based on genetic algorithm. Fu et al. [6] have broken down complex VNFS into smaller virtual network functional components (VNFCS) to make more efficient decisions. Kuo et al. [7] have developed load balancing algorithms to ensure that network traffic is evenly distributed and thus prevent congestion in the data center network. Kim et al. [8] have proposed a unified scientific cloud framework upon heterogeneous cloud resources while outperforming conventional cloud systems through various experimental and simulation results. Additionally, some research has been conducted on system security considerations such as strengthening the security of the data center network [9] and improving the fault tolerance of the data center network [10].
The resource allocation strategy heavily relies on algorithms, which serve as the cornerstone of this process. There are various algorithms available to enable efficient resource allocation. For instance, the Best Fit algorithm [11] finds the smallest free partition that meets the requirement to minimize fragmentation of partitions. The Banker algorithm [12] aims to avoid deadlocks before resource allocation. The Ant Colony Optimization algorithm [13] adopts the shortest path for solving optimization problems inspired by ant feeding systems. The Adaptive Dynamic Optimization algorithm [14] breaks down problems into sub-problems of several stages, solves them sequentially, and selects the solutions likely to produce the optimal result from the local solutions. The Energy-aware Dynamic Task Scheduling (EDTS) algorithm [15] minimizes total energy consumption while meeting strict time and probability constraints in applications, compared to critical path scheduling and parallelism-based scheduling algorithms. Mashwani et al. [16] presented a multiswarm-intelligence-based algorithm for solving bound-constrained functions. The algorithm integrates population evolution with SI (Social Influence) based algorithms and addresses the problems of exploration and exploitation. A hybrid TLBO (HTLBO) [17] algorithm was proposed to further enhance the exploration and exploitation capabilities of the baseline TLBO algorithm.
Herrera et al. [18] presented a comprehensive review of NFV resource allocation (NFV-RA) by introducing a novel classification of the main approaches that offer solutions. These include service chain, NFV environment and framework, virtual network functions (VNFs) scheduling, and a comparison of advanced methods for NFV-RA. Zhao et al. [19] achieved the goal of maximizing the throughput of a socially aware network by taking into account the physical and social attributes of mobile users. Hotaling et al. [20] introduced Decision-Explicit Probability Sampling (DEPS) to perform inference of problem properties while accounting for the potential bias introduced by an allocation strategy. Saini et al. [21] applied joint resource allocation to information security, optimizing subcarrier allocation, subcarrier pairing (SCP), and power allocation in a cooperative secure orthogonal frequency division multiple access (OFDMA) communication system, considering untrusted users. Lastly, a resource load balancing scheduling method based on ant colony algorithm [22] also inspired an equalization of resources.
The issue of optimizing resource utilization and network load balance in data centers is challenging, and while several algorithms exist to reconfigure cloud resources, the problem is far from completely resolved. Responsive strategies for resource management rely on quickly reconfiguring resources in response to traffic changes, but these solutions are frequently ineffective due to the excessive time required to reconfigure cloud resources, which may take up to ten minutes [23]. A new approach has recently emerged that suggests an active method of prediction, which helps avoid the latency issues accompanying resource allocation. This approach is based on forecasting traffic changes and predicting resource needs, rather than responding directly to detected changes, assuring faster reconfiguration times and more efficient resource allocation [24]. This approach has several advantages over reactive approaches that rely solely on detecting changes in traffic. By using prediction-based algorithms for resource management, the reconfiguration time required to rebalance resources can be significantly reduced. Furthermore, predicting usage patterns and optimizing resource allocation before the event allows for a more proactive and efficient approach to resource management in data centers.
Both traditional and artificial intelligence techniques are used to estimate traffic and/or resources required. In recent years, many researches have adopted machine learning method to realize resource prediction in NFV. Aiming at the host load prediction problem in cloud infrastructure, Song et al. [25] completed the prediction based on the time series of LSTM cyclic neural network. Mijumbi et al. [26] used graph neural networks to derive a model of the VNF resource requirements from the topology of the subcomponents within the VNF. In [27], VNF-SC was deployed with RL in elastic optical networks for load balancing and service latency minimization. Most similar to our work, they use machine learning methods for resource prediction. In contrast to our approach, their approach requires insight into the internal structure of each VM, ignoring the fact that the same VM may handle different traffic loads and therefore may have different resource requirements, thus limiting the accuracy of their models.
This section describes the architecture of our resource allocation, which comprises two major components, namely the system framework and the system sub-modules.
Our system’s service procedure follows the queuing theory. Upon arrival of the Service Function Chain (SFC), it joins the buffer queue and waits for processing. If there are available resources, the SFCs in the waiting line are assigned in sequential order to the appropriate server and virtual machine (VM) for service processing. Once all the services in the SFC have been processed, the resources occupied are freed up, and the SFC exits the service system. If no resources are currently available, the SFC in the waiting line must wait until they become available. The service system operates continuously, providing service to customers throughout the day.
In our system architecture, the servers are interlinked in a parallel configuration where each server is integrated with every type of APP program. This setup enables the processing of all forms of service chain SFCs on a single server without any back and forth movements. The parallel structure not only facilitates a significant reduction in traffic consumption between servers but also effectively prevents path trace-back issues. Moreover, owing to the complete APP configuration of each server, each server can be considered a self-contained, small-scale service system. The parallel architecture allows the system to keep functioning even if one or multiple servers fail, without affecting the overall services of the system. As a result, we aim to model the service system using this parallel architecture and server configuration, followed by designing resource allocation and optimization strategies.
Theoretical basis for our system modeling includes the integration of various APP programs in the system into the same server. Additionally, each SFC in the system occupies the same network bandwidth resources. Further, every SFC in the same APP occupies a similar size of resources while processing business in the same APP, while the allocated resources may differ while processing SFCs for different APPs. Finally, the time spent evaluating how to select the server or VM for the SFC and the time spent migrating resources between VMs are negligible. A preview of our system framework is shown in Fig. 2.
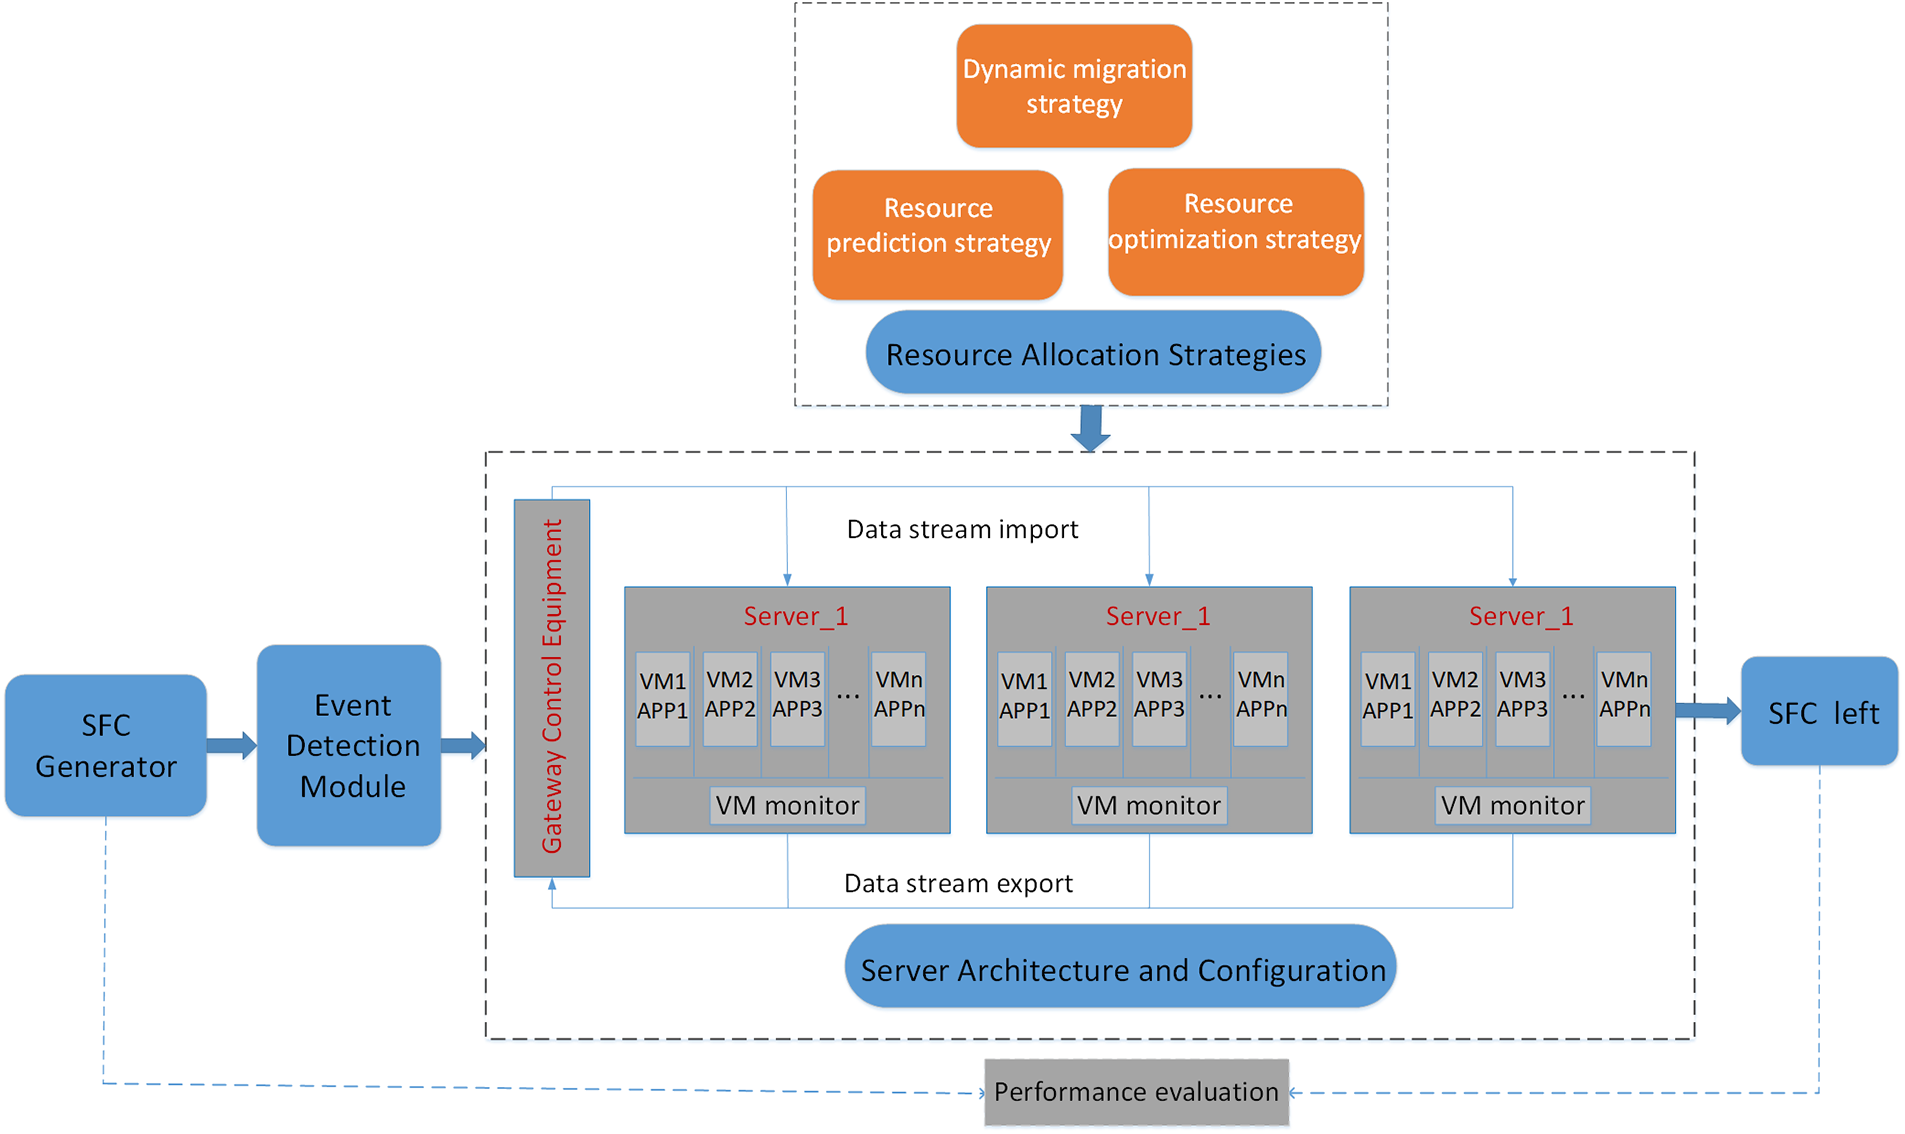
Figure 2: Preview of our system framework. It is the entire procedure from SFC generation to SFC leaving the system which contains four major modules
We produce simulated SFC data streams by combining user demands for APPs. We then compare and evaluate the performance of resource allocation systems and the effectiveness of resource allocation policies. Our main objective is to maximize the utilization rate of CPU, RAM, and Bandwidth by allocating as few resources as possible. This objective can be divided into two aspects. Firstly, we aim to maximize the utilization rate of these three resources while reallocating them and adjusting to the demand of the SFC service chain. Secondly, we aim to control the service waiting length and service waiting time within reasonable limits while also ensuring a certain throughput rate. We strive to use as few resources as possible while still delivering the necessary performance. In addition to this, we also aim to minimize the total system resources and shut down unnecessary virtual machines (VMs). We aim to reduce total system resource consumption while maintaining the same level of throughput and resource utilization. Overall, the first goal is to reallocate the three resources to improve their utilization, and the second goal is to reduce the overall resource consumption. The model can be simplified into two constrained optimization problems, as shown in Eqs. (1) and (2):
where U is utilization of these three types of resources, T indicates time,
where P is the energy consumption rate. We define the energy consumption rate as the ratio of the energy consumption at this time to the energy consumption of all servers, which can be simplified to the ratio of the number of open servers to the total number of servers.
The module of our system is composed of three sub-modules: the SFC generator, SFC event detection module, and resource allocation module.
1. SFC generator.
For the sorting system’s input process and customer arrival rules, we utilize a Poisson flow input. This means that the probability of
This equation demonstrates that the probability of observing a time period between two SFC arrivals less than or equal to time
Additionally, we use the negative exponential distribution to simulate the service time for each APP. The service time for each APP can follow the negative exponential distribution with different parameters. As for the service time of SFC, we use a stack of service times for different APPs.
When simulating the service system, we take into account both the limited capacity of the network service system and the importance of service performance, quality, and user experience. It is essential to prevent the number of customers waiting in line from increasing continuously, which is why we have decided to adopt a mixed queuing rule that includes both the loss system and the waiting system.Under this rule, the waiting queue of the service system can accommodate a limited number of customers, and when all resources are occupied, arriving customers cannot be served immediately. When the number of customers waiting in the queue reaches the maximum capacity, the customer at the end of the queue is no longer able to wait in line for the service and must leave the system. This service order follows the first-come-first-serve rule and is the most practical solution at present. In summary, by considering the limitations of the network service system and its impact on service performance and user experience, we have adopted a mixed queuing rule that allows for both the loss system and the waiting system to coexist, with a limited waiting capacity in the service queue. This approach ensures that customers are served efficiently while maintaining service quality.
We generate a complete SFC randomly by user demand ratio. First of all, all kinds of APPs are sorted and numbered according to their different needs. For example, there are five kinds of APPs in the data center system, then we set the value of the applications as 5, and the order ratio is
where 1 represents occurrence and 0 is not present. a is the generated random number with random distribution.
Lastly, each generated SFC is a set of APP numbers that appear in it, which can be represented by the formula as
2. SFC event detection module
The SFC event detection module has the primary responsibility of detecting events and causing different responses to different events. There are three types of events that this module handles. The first event type is whether the SFC has reached the service system, in which case the SFC is allowed to queue in the buffer. However, if the buffer is full, the SFC is discarded. The second event type is whether the SFC is being processed. When the SFC gets to the end of the process in the VM service, the resources it occupies are released. The third event type is whether the SFC has left the service system. When all the services have finished processing the SFC, the occupied resources are released, and the SFC throughput is increased by one. If the module does not detect any events, it should continue looping detection.
3. Resource allocation module
The main task of the resource allocation module is twofold-it must either select an appropriate service path for an SFC waiting for service or select an available server with sufficient resources. This module continuously monitors the buffer to determine whether there are any SFCs waiting in the queue. If the waiting queue is empty, the module continues to monitor the buffer. However, if there are SFCs waiting in the queue, the SFC of the leader is selected, and the various resource sizes corresponding to different application programs are calculated based on the content of the third section. The available resources in each server are also calculated, and the module determines whether a particular server has enough resources to meet the requirements of the first SFC in the queue. If there are sufficient resources available, one of the servers meeting the requirements is chosen to process the first service chain of the team. If no server meets the necessary requirements, the system resource status of each server is cyclically evaluated. This continues until a server with released resources and sufficient available resources is identified. Once a suitable server is found, the first SFC in the queue can then be processed. When selecting a server for an SFC, the resource allocation module follows specific preferred principles. First, it prefers to select a server that has sufficient available resources corresponding to the application programs required by the SFC. Secondly, if there are multiple servers meeting the requirements under the same optimal conditions, the server with the lowest total available resources is selected based on the Best Fit algorithm [28] as the destination of the SFC. These principles are designed to minimize the number of servers used to handle SFCs for cost-saving and energy consumption reduction.
4 Resource Allocation Strategy
In our system framework of network service function integration, there are three steps in the design of our resource allocation strategy. The first strategy is based on the Best Fit algorithm for the dynamic migration and scheduling of virtual machine resources; the second strategy is the prediction of system functions based on neural networks; the third strategy is based on balanced and extended resource configuration optimization.
4.1 Dynamic Migration Strategy
The Best Fit algorithm [28] is to find free resources from the entire free space that can satisfy the business requirements and have the smallest size. The best fit algorithm flow is as follows: first, all the free areas are sorted from small to large, and then the order is compared with the size of the required resources, the free area where the first available resource size meets the demand is the final selected free area. Compared to the first fit algorithm [29] and the worst fit algorithm [30], this method is more feasible. Because the available resource size allocated to the service every time is the most suitable for this service. This can make the remaining resource fragments in the free area as little as possible and occupy less free area.
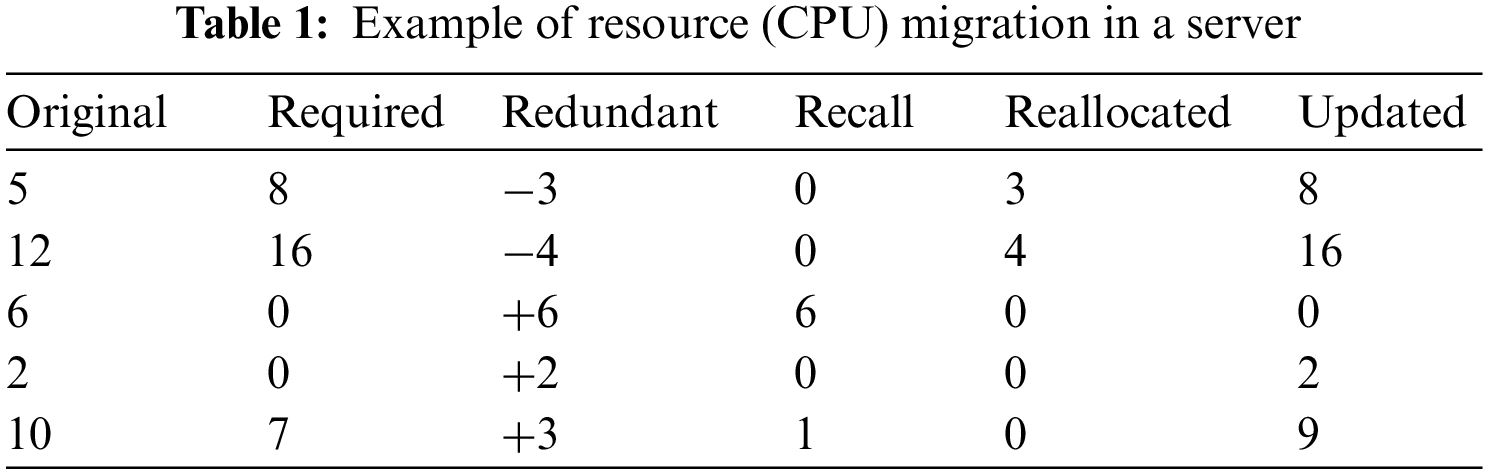
Our resource allocation procedure based on dynamic programming for SFCs is as Algorithm 1. For those corresponding application programs originally have enough available resources, the corresponding demand resources can be directly deducted when the SFC enters the server; however, for those available resources of VM are insufficient for the selected server, but the sum of the resources available to all virtual machines in the server meets the demand, the resources need to be adjusted dynamically by the algorithm above.
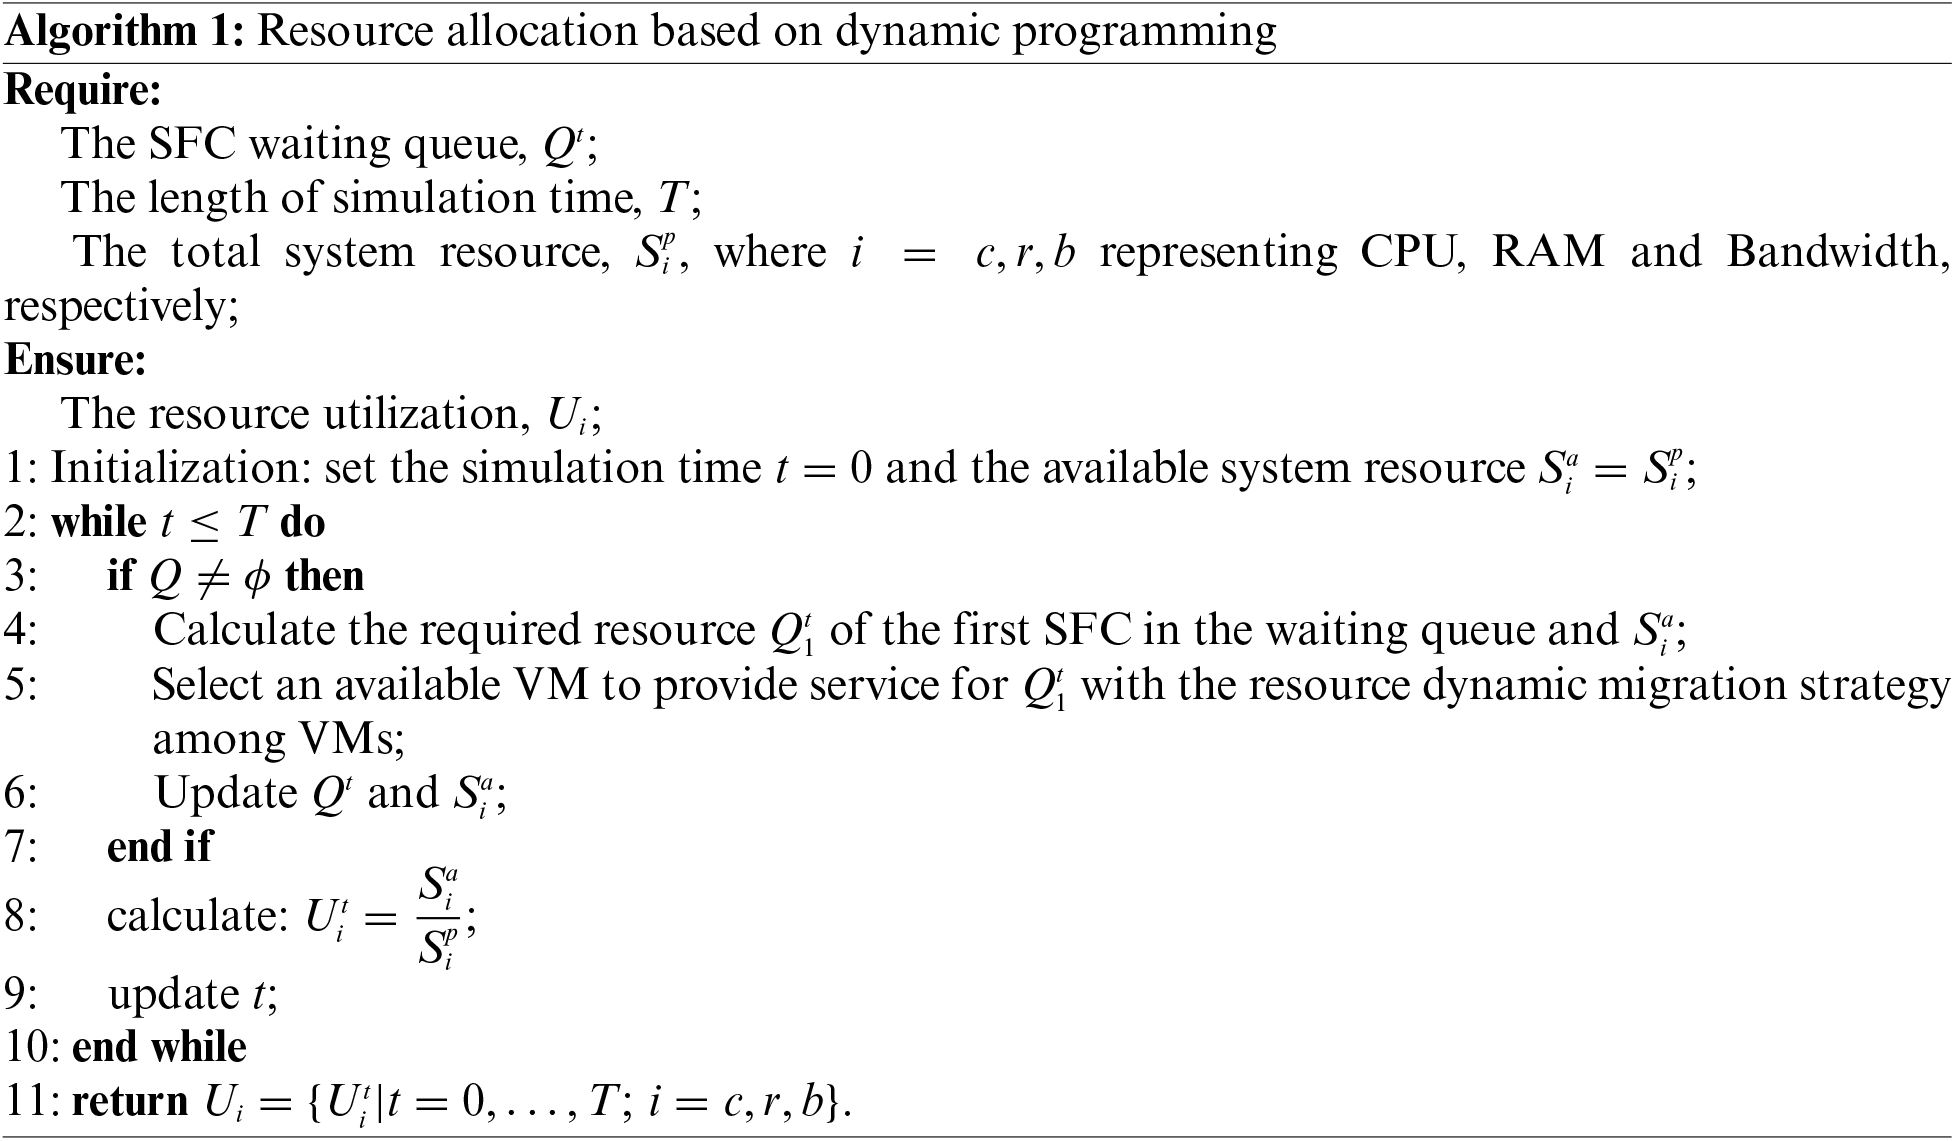
Specifically, for example, when the SFC
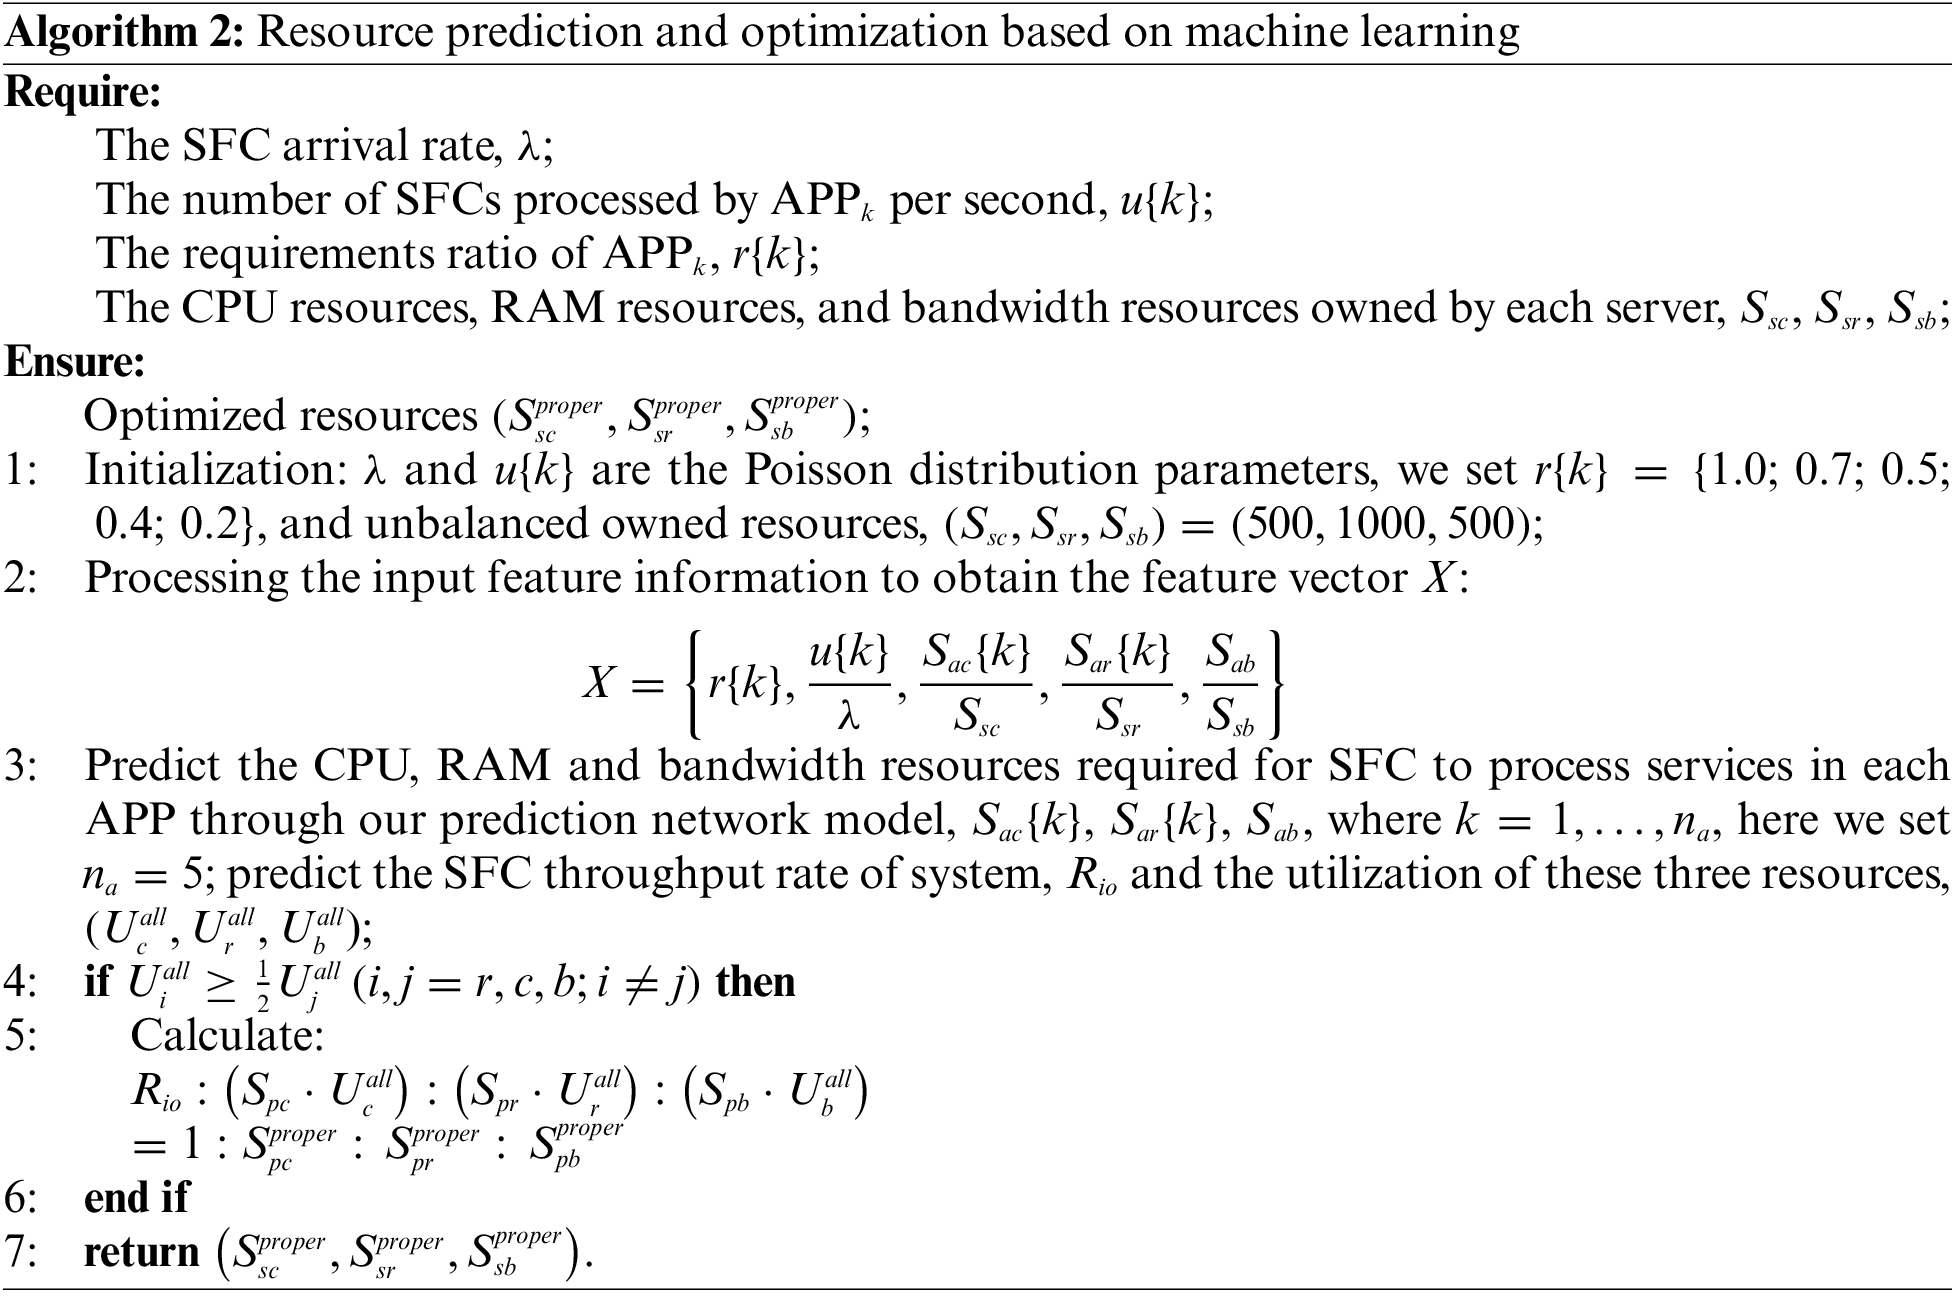
4.2 Resource Prediction Strategy
To understand the performance indicators of a service system in an actual data center, we typically need to operate the system in real-time to observe the necessary index data. However, every time we want to adjust the system resource configuration, the service system must be interrupted, and the system must be restarted after configuring. This process takes up valuable time and energy and causes interruptions in ongoing SFC services, resulting in a poor user experience. As a solution to avoid interrupting the service system and the SFC service, we have developed an off-line adjustment strategy for optimizing the system resource allocation. This involves replacing the observed real-time performance indicators with predicted values of the service system’s performance index in the data center, enabling us to adjust and optimize the system’s resource configuration accordingly. To accomplish this, we have utilized the backpropagation (BP) neural network, which is effective in self-tuning parameters and designing controllers [31]. Through thorough investigation, we have identified two applicable neural networks based on the cyclic steepest descent (CSD) optimization algorithm [32] and the L-BFGS optimization algorithm [33]. We conducted performance comparison experiments to determine the better network that fits the curve between the data center service chain information, system resource configuration information, and system performance indicators. This enables us to make further predictions and optimizations to improve the system’s performance.
The data samples for neural network training and testing are randomly generated by our data center service system. Each data sample includes two items: sample features X and sample tags Y. For the sample features, the information includes: the arrival rate of the SFC
where
The eigenvector contains information about the number of application APP types, and the dimension of the eigenvector can vary depending on the number of APP types in the system. In order to maintain the consistency of the training sample dimensions for the network model, a fixed value of
We generated 10,000 data samples randomly and divided them into non-overlapping training data sets and test data sets with 4:1 ratio. Put the corresponding sample features into the trained regression model and we can get the prediction of the system throughput, system resource utilization and other performance indicators. When we test the trained neural network model, we evaluate the accuracy of the model by calculating the Root Mean-Square Error (RMSE) of the predicted value and the true value of the sample label, the formula is as in (6):
where
To select an appropriate BP neural network structure for our forecasting work, we conducted comparative experiments on different configurations, such as varying the number of neurons in a single hidden layer and adding additional hidden layers to the BP neural network. Ultimately, we determined that the BP neural network structure with two hidden layers, each consisting of 21 neurons, delivered the best performance.
4.3 Resource Optimization Strategy
From the perspective of maintaining the service system’s long-term operations, there exists a proportional relationship between the demand for different resources of the system. The ratio of the system’s throughput and its resource demand also demonstrates a corresponding proportional relationship. Under the resource allocation conditions of the original resource pool
Since the servers in the system shares the resource pool resources evenly, after optimization, the size of each resource in each server can be calculated as in (8):
when the system throughput approaches saturation, it indicates that the system is performing well and has sufficient resources. In this case, the resource with low utilization is considered to be redundant. On the other hand, when a certain resource’s utilization approaches saturation, but the system throughput rate is relatively low, such resources are considered to be bottlenecks. Based on the proportional relationships of the resources mentioned above, we can optimize redundant and bottleneck resources individually.
For the redundant resources, we adjust and optimize these resources by reducing them. Taking the CPU resource as an example, we can get the predicted CPU resource utilization by our neural network, and the total CPU resource in the system resource pool is already known, then the product of the two represents the CPU resource used in the resource pool, and is also the value after the redundant resource is adjusted. It can be formulated as
For the bottleneck resources, our extended optimization method is to do a certain amount of resource expansion. For example, when the CPU resource is bottleneck resource, the system resource pool is configured to
Next, a reasonable resource pool for adjusting CPU resources as a bottleneck resource is as in (10):
To simplify we get
However, when the CPU, RAM and bandwidth resources are all bottomed out, we will not be able to adjust their resources. At this time, although the resource utilization rate tends to 1, the service quality is not high. In order to solve this problem, We can increase CPU resources firstly. If it becomes redundant resources, continue to adjust resources through (9) and (10). Otherwise, continue to increase CPU resources. Through this fine-tuning method, we can improve the quality of our service, reduce queue time and queue length.
The benefits of resource extended optimization is that resources can be dynamically adjusted and resource consumption reduced as business needs change. When the number of SFCs increases, the original resource configuration is not sufficient to complete the service processing efficiently. At this time, various resources need to be expanded. Assuming that the ratio of the original allocation of various resources is reasonable, that is, the redundant resources and bottleneck resources have been adjusted and optimized through the above-mentioned contents. Furthermore, we need to increase each resource on a basis according to the change in the service chain arrival rate. The resource expansion ratio can be calculated as this:
Since we apply the best fit algorithm to allocate suitable servers for the service chain SFCs, we can reduce the number of working servers while maximizing the utilization of server resource. We evaluate the effectiveness of our resource allocation strategies by comparing SFC throughput Rio, CPU resources utilization, RAM resources utilization, bandwidth resource utilization, system energy consumption rate P, the length of the system waiting queue, and the waiting time of the service chain in the waiting queue.
As shown in Fig. 3, under the dynamic resource allocation strategy, the resource utilization of each server with the number 9 and 10 is 0, and then the two idle servers can be shut down. While the static resource allocation requires that all servers be turned on. This means that the dynamic allocation strategy can reduce energy consumption when doing the same task, that is, occupy a smaller number of servers.
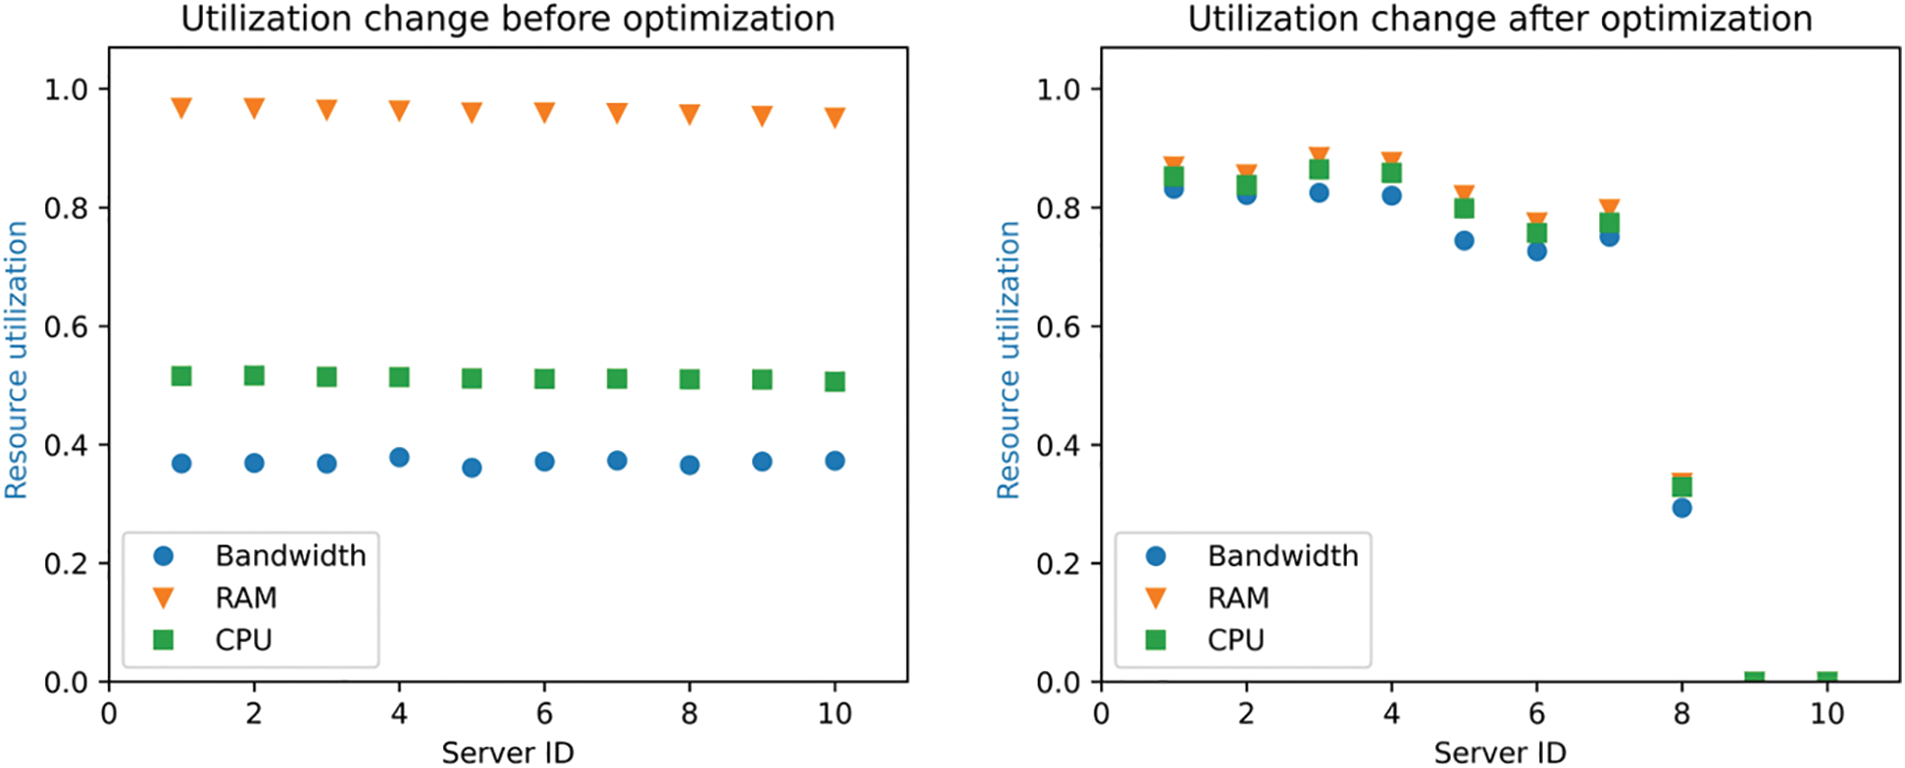
Figure 3: Comparison of resource utilization
The prediction error distribution histograms in Fig. 4 is to count the number of samples with different error values. The abscissa of each sub-graph represents the error value, and the ordinate is the number of samples of the corresponding error value. When the column in the distribution map is concentrated near the zero value of the abscissa and the corresponding ordinate value is higher, the more the data samples have the error value near zero which also indicates the higher of the prediction accuracy with this prediction method to the test sample. So we can see that the prediction error of CPU resource utilization based on L-BFGS algorithm is smaller than the other two methods from Fig. 4. In details, the error value distribution of linear regression model is more dispersed, that is, the number of samples with larger error value is more. And the distribution histogram of error value predicted by neural network is more concentrated near zero value, meanwhile the distribution interval is narrower and the prediction accuracy is higher especially for the neural network with L-BFGS algorithm. There are three sub-graphs correspond to error statistics of CPU resource utilization, RAM resource utilization, and bandwidth resource utilization in Fig. 5. These three color curves of red, green and blue in each sub-graph represents the linear regression model, the BP neural network model based on C-SD optimization algorithm and the BP neural network model based on L-BFGS optimization algorithm. From Fig. 5, we can see that the accumulated sample ratio of three resources utilization with an absolute error below 0.1 are different. Specifically, the BP neural network regression model based on the L-BFGS optimization algorithm has the highest value corresponding to 93% while the corresponding values of the BP neural network regression model of the CSD optimization algorithm are centered around 86% and the corresponding value of the linear regression model is the lowest, roughly 66%. That is, the accuracy of the BP neural network regression model based on the L-BFGS optimization algorithm is the highest. The experimental results in Figs. 4 and 5 show that the BP neural network regression model with the L-BFGS optimization algorithm performs best in resource utilization prediction among these three predicting methods. It can be proved from Table 2 too because the neural network based on L-BFGS has the lowest RMSE value for CPU, RAM, and bandwidth resource utilization predictions.
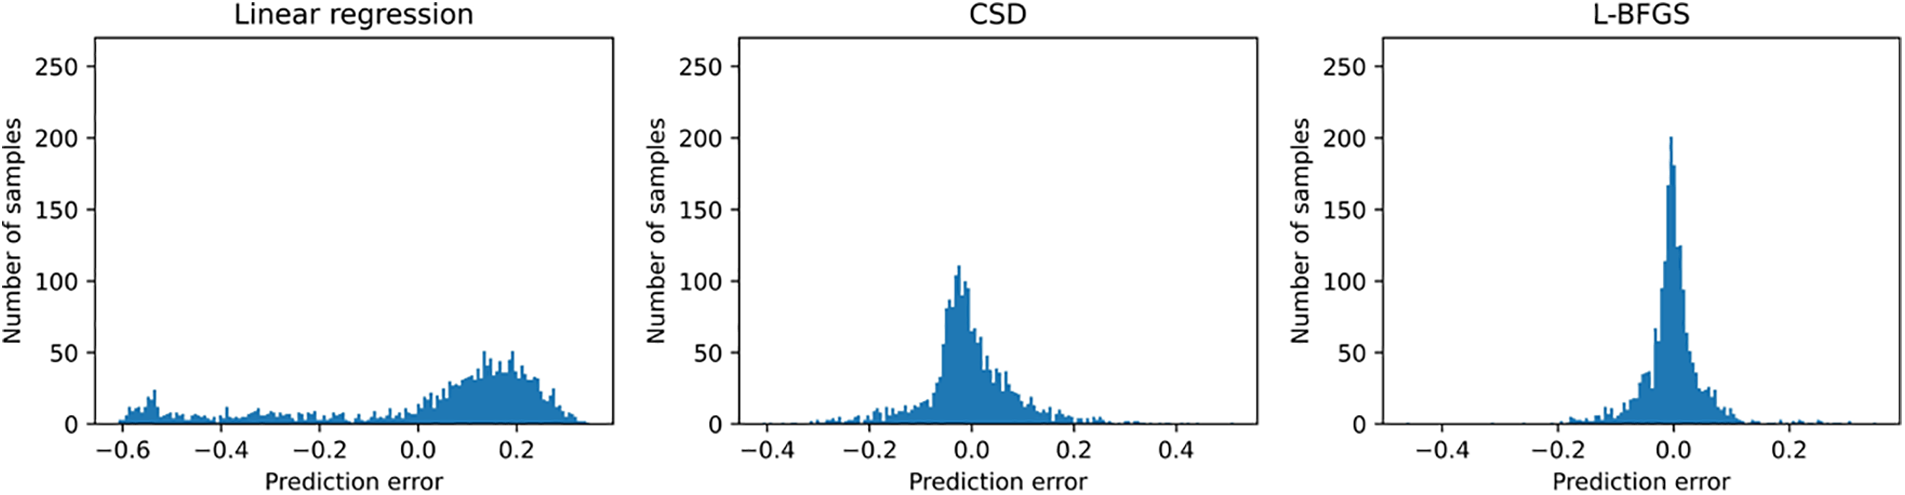
Figure 4: These are prediction error distribution histograms of CPU utilization by three different predicting methods, which are the prediction results of linear regression, neural network with CSD algorithm and neural network with L-BFGS algorithm, respectively. The horizontal axis is the prediction error, and the vertical axis is the number of corresponding sample statistics
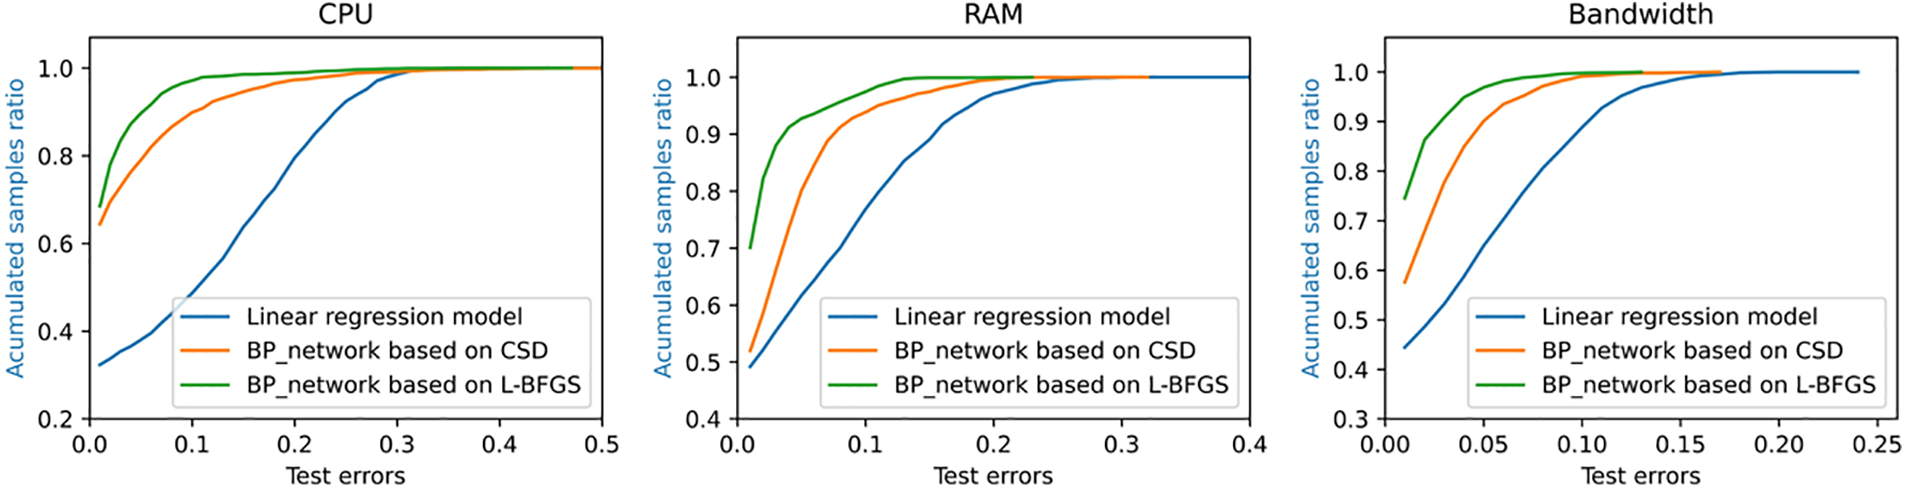
Figure 5: These are graphs of the accumulated sample ratio of three different resources utilization forecast errors, which are CPU, RAM and bandwidth resource utilization
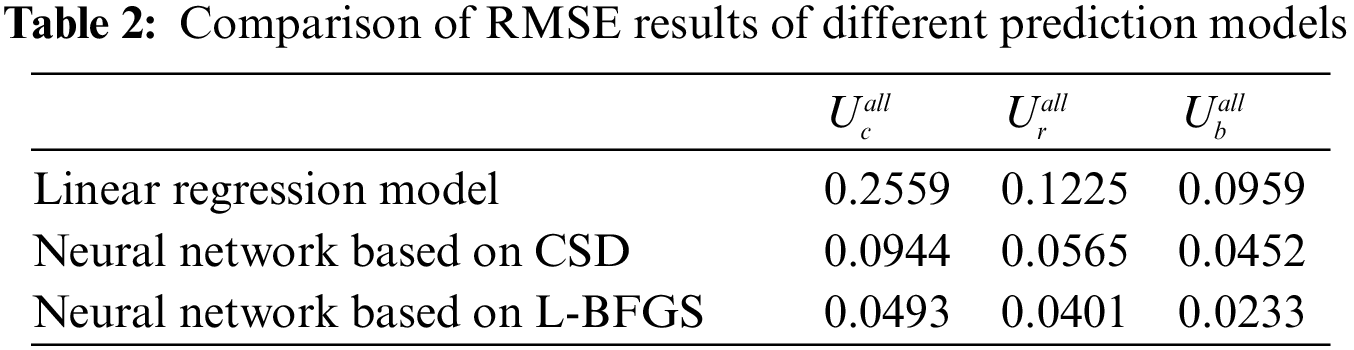
Fig. 6 shows the resource utilization transformation over time in the system and the three resource utilization rates in different servers before and after optimization. We can see from the first sub-graph that the utilization of CPU, RAM, and bandwidth resources is not balanced before optimization, in which the utilization of RAM resources has reached saturation but the utilization of CPU and bandwidth resources is low. The utilization of various resources of each server is in the same disproportion situation as can be seen in the third sub-graph. After the optimization, the resource utilization are balanced and all reach around 1 as shown in the second sub-graph and last sub-graph. Fig. 7 compares the waiting length and wait time of the system service chain before and after optimization. From first two sub-graphs in Fig. 7, we see that the number of waiting service chains for the optimized system is greatly reduced along time compared with the SFC waiting numbers before the optimization. And from the histogram statistics for waiting time in last two sub-graphs, it can also be seen that the waiting time before optimization is longer than the waiting time after optimization. In conclusion, the balanced optimization of resources improve the system service performance effectively.
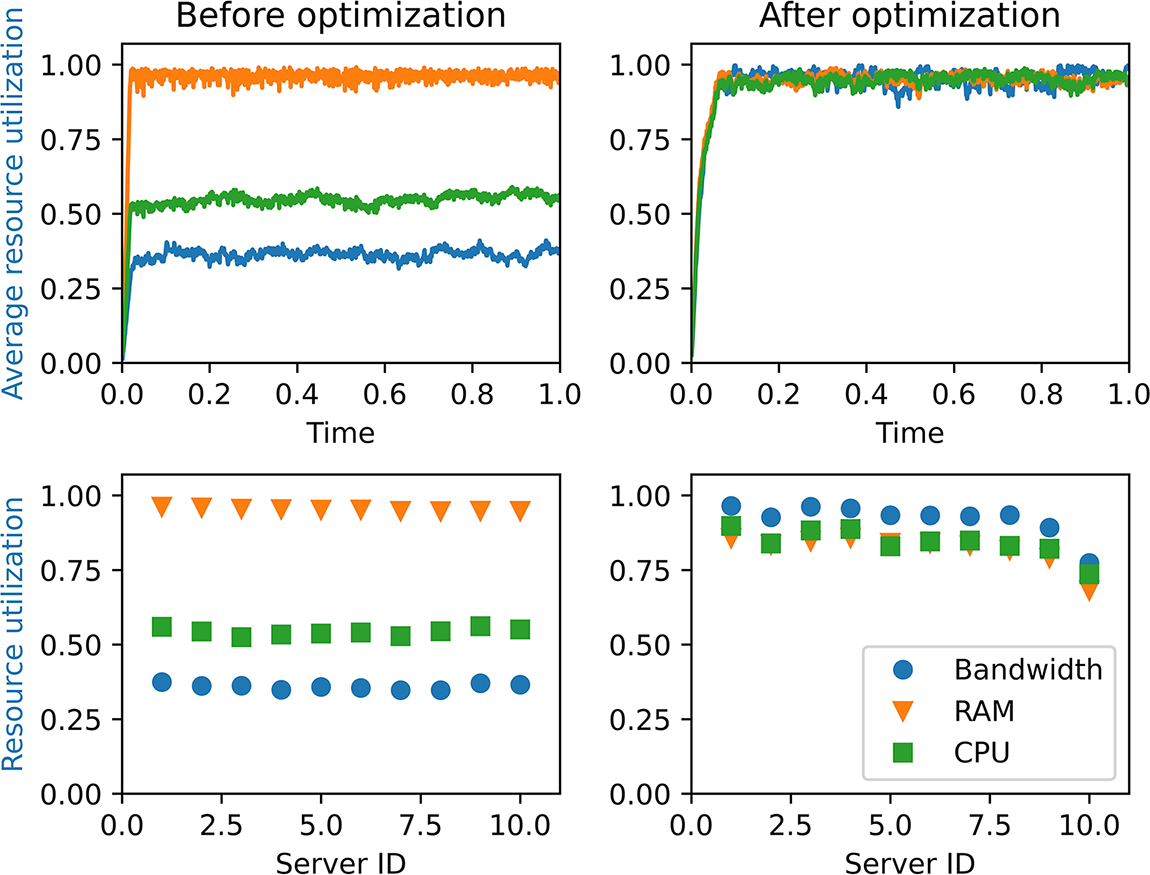
Figure 6: Comparison of the utilization change of various resources (CPU, RAM, bandwidth) of our system before and after optimization. The first column represents the utilization change in one hour and the resource utilization rate of each server before optimization, while the second column represents the utilization change in one hour and the resource utilization rate of each server change trend after optimization, respectively
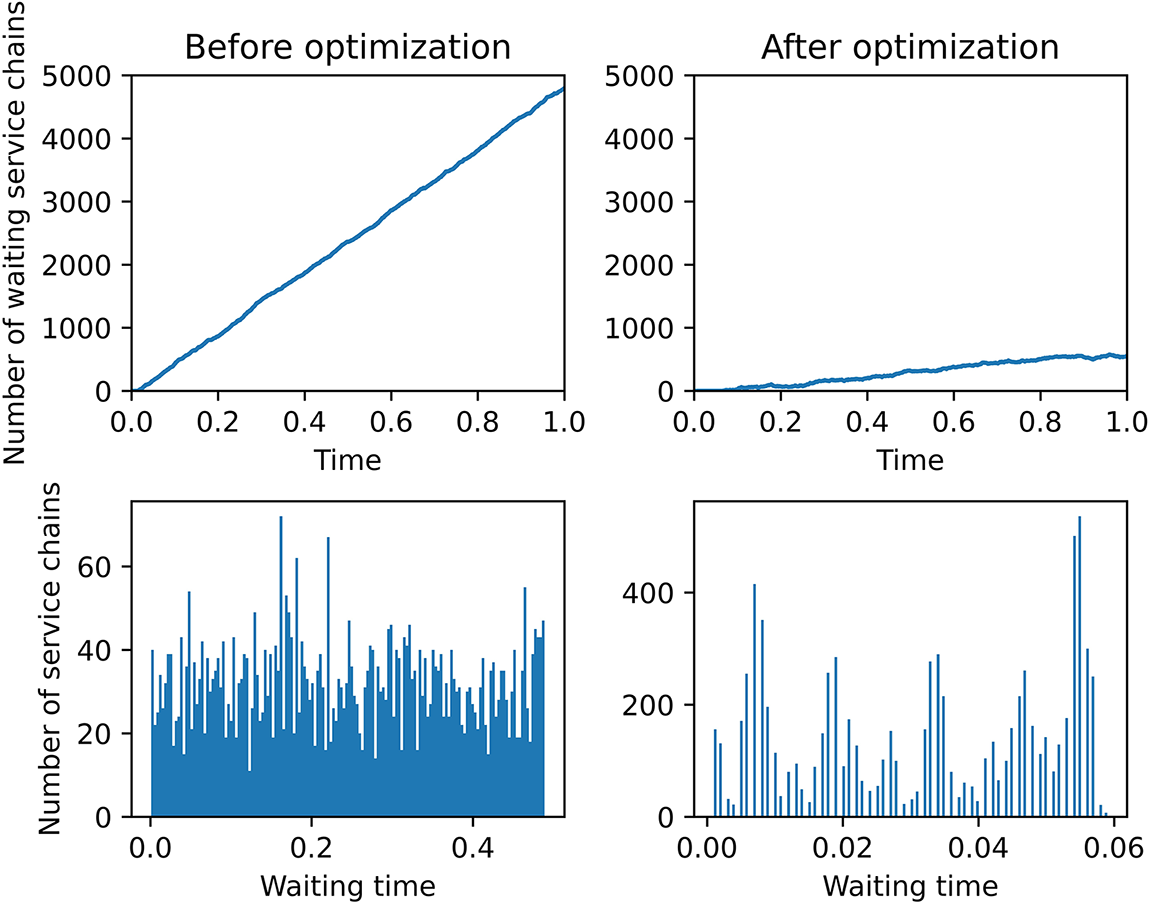
Figure 7: Comparison of customer service quality before and after optimization. The first column represents the SFC waiting queue length change curve and the SFC waiting time distribution histogram before optimization, the second column represent the SFC waiting queue length change curve and the SFC waiting time distribution histogram after optimization. The unit of time is seconds
When conducting resource scheduling in NFV, the following types of uncertainty factors may be encountered:
1. Internal uncertainty factors.
These factors involve the characteristics or performance of the network and services themselves. For example, using virtualization technology to convert network functions into software may result in decreased performance or increased network latency.
2. External uncertainty factors.
These factors involve changes in the environment or network context, such as changes in network traffic volume or network topology adjustments.
3. Parameter uncertainty factors.
These factors refer to uncertain or difficult-to-predict input parameter or resource values, which may cause network performance or service quality instability.
4. Non-parameter uncertainty factors.
These factors refer to factors that do not involve input parameter or resource values, such as service request patterns or hardware failures.
5. Constant uncertainty factors.
These factors refer to constant values that are difficult to determine in NFV deployment, such as network transmission latency or processor performance.
6. Characteristic uncertainty factors.
These factors refer to the characteristics involved in NFV deployment, such as network traffic distribution and service request processing time.
7. Stochastic uncertainty factors.
These factors refer to uncertainty caused by probability distribution or random events, such as the randomness of network traffic or unpredictability of hardware failures.
Determining the structure and quantity of these factors in real-time applications is challenging and requires comprehensive consideration of different types of uncertainty factors to develop appropriate resource scheduling strategies to ensure network performance and service quality.
In this paper, we have proposed resource scheduling optimization strategies for data centers in the context of Network Function Virtualization. These strategies aim to improve system resource utilization and other performance metrics. To validate the effectiveness of our approach, we modeled the data center network service using queuing theory and simulated the generation of service chain data flow in the Matlab platform. We applied our designed resource allocation optimization strategies to the service system, leading to the realization and improvement of system service performance.
However, we must note that the design of the system architecture and integration of the application programs were implemented only in the simulation of the Matlab platform. To achieve the integration of all the application programs in an actual data center, it is necessary to configure enough resources for the general server. Therefore, in our future work, we plan to apply our designed dynamic resource allocation strategies to the metropolitan area network. In doing so, we can observe the service performance and resource utilization of the system in more realistic conditions.
Acknowledgement: We would like to thank the authors for their contributions to this Special Issue. We also thank the journal, CMES, for their support for the publication of this Special Issue. The authors are grateful for the support by the Fundamental Research Program of Guangdong, China, and the National Natural Science Foundation of China.
Funding Statement: The work is supported by the Fundamental Research Program of Guangdong, China, under Grants 2020B1515310023 and 2023A1515011281; and in part by the National Natural Science Foundation of China under Grant 61571005.
Author Contributions: The authors confirm contribution to the paper as follows: study conception and design: Chumei Wen, Delu Zeng; data collection: Chumei Wen, Delu Zeng; analysis and interpretation of results: Chumei Wen, Delu Zeng; draft manuscript preparation: Chumei Wen, Delu Zeng. All authors reviewed the results and approved the final version of the manuscript.
Availability of Data and Materials: The data used in this study can be obtained upon request. Interested researchers should contact the author at cmwen.math@gmail.com for access to the data. Privacy and confidentiality considerations may restrict the release of certain data, as the researchers prioritize protecting the participants’ privacy and complying with ethical guidelines. Hence, sensitive or confidential data cannot be shared publicly.
Conflicts of Interest: The authors declare that they have no conflicts of interest to report regarding the present study.
References
1. Mijumbi, R., Serrat, J., Gorricho, J. L., Bouten, N., de Turck, F. et al. (2015). Network function virtualization: State-of-the-art and research challenges. IEEE Communications Surveys & Tutorials, 18(1), 236–262. [Google Scholar]
2. Bhamare, D., Jain, R., Samaka, M., Erbad, A. (2016). A survey on service function chaining. Journal of Network and Computer Applications, 75(4), 138–155. [Google Scholar]
3. Corradi, A., Fanelli, M., Foschini, L. (2014). VM consolidation: A real case based on openstack cloud. Future Generation Computer Systems, 32(1), 118–127. [Google Scholar]
4. Tang, H., Zeng, D., Liu, X., Huang, J., Liao, Y. (2017). Resource allocation and optimization based on queuing theory and BP network. In: Neural Information Processing, pp. 366–374. Berlin, Germany: Springer. [Google Scholar]
5. Rankothge, W., Le, F., Russo, A., Lobo, J. (2017). Optimizing resource allocation for virtualized network functions in a cloud center using genetic algorithms. IEEE Transactions on Network and Service Management, 14(2), 343–356. [Google Scholar]
6. Fu, X., Yu, F. R., Wang, J., Qi, Q., Liao, J. (2019). Dynamic service function chain embedding for NFV-enabled IoT: A deep reinforcement learning approach. IEEE Transactions on Wireless Communications, 19(1), 507–519. [Google Scholar]
7. Kuo, T. W., Liou, B. H., Lin, K. C. J., Tsai, M. J. (2018). Deploying chains of virtual network functions: On the relation between link and server usage. IEEE/ACM Transactions on Networking, 26(4), 1562–1576. [Google Scholar]
8. Kim, S. H., Kang, D. K., Kim, W. J., Chen, M., Youn, C. H. (2016). A science gateway cloud with cost-adaptive VM management for computational science and applications. IEEE Systems Journal, 11(1), 173–185. [Google Scholar]
9. Tomás, L., Tordsson, J. (2014). An autonomic approach to risk-aware data center overbooking. IEEE Transactions on Cloud Computing, 2(3), 292–305. [Google Scholar]
10. Zhou, A., Wang, S., Cheng, B., Zheng, Z., Yang, F. et al. (2016). Cloud service reliability enhancement via virtual machine placement optimization. IEEE Transactions on Services Computing, 10(6), 902–913. [Google Scholar]
11. Song, W., Xiao, Z., Chen, Q., Luo, H. (2013). Adaptive resource provisioning for the cloud using online bin packing. IEEE Transactions on Computers, 63(11), 2647–2660. [Google Scholar]
12. Dixit, K., Khuteta, A. (2017). A dynamic and improved implementation of Banker’s algorithm. International Journal on Recent and Innovation Trends in Computing and Communication, 5(8), 45–49. [Google Scholar]
13. Afshar, A., Massoumi, F., Afshar, A., Mariño, M. A. (2015). State of the art review of ant colony optimization applications in water resource management. Water Resources Management, 29, 3891–3904. [Google Scholar]
14. Yu, R., Zhong, W., Xie, S., Zhang, Y., Zhang, Y. (2015). QoS differential scheduling in cognitive-radio-based smart grid networks: An adaptive dynamic programming approach. IEEE Transactions on Neural Networks and Learning Systems, 27(2), 435–443. [Google Scholar] [PubMed]
15. Li, Y., Chen, M., Dai, W., Qiu, M. (2015). Energy optimization with dynamic task scheduling mobile cloud computing. IEEE Systems Journal, 11(1), 96–105. [Google Scholar]
16. Mashwani, W. K., Haider, R., Brahim Belhaouari, S. (2021). A multiswarm intelligence algorithm for expensive bound constrained optimization problems. Complexity, 2021, 1–18. [Google Scholar]
17. Mashwani, W. K., Shah, H., Kaur, M., Bakar, M. A., Miftahuddin, M. (2021). Large-scale bound constrained optimization based on hybrid teaching learning optimization algorithm. Alexandria Engineering Journal, 60(6), 6013–6033. [Google Scholar]
18. Herrera, J. G., Botero, J. F. (2016). Resource allocation in NFV: A comprehensive survey. IEEE Transactions on Network and Service Management, 13(3), 518–532. [Google Scholar]
19. Zhao, P., Feng, L., Yu, P., Li, W., Qiu, X. (2017). A social-aware resource allocation for 5G device-to-device multicast communication. IEEE Access, 5, 15717–15730. [Google Scholar]
20. Hotaling, A., Bagrow, J. P. (2019). Accurate inference of crowdsourcing properties when using efficient allocation strategies. arXiv preprint arXiv:1903.03104. [Google Scholar]
21. Saini, R., Mishra, D., De, S. (2019). Subcarrier pairing as channel gain tailoring: Joint resource allocation for relay-assisted secure OFDMA with untrusted users. Physical Communication, 32(3), 217–230. https://doi.org/10.1016/j.phycom.2018.11.015 [Google Scholar] [CrossRef]
22. Chen, X., Xu, J. W., Long, D. (2018). Resource scheduling algorithm of cloud computing based on ant colony optimization-shuffled frog leading algorithm. Journal of Computer Applications, 38(6), 1670. [Google Scholar]
23. Mansouri, Y., Babar, M. A. (2021). A review of edge computing: Features and resource virtualization. Journal of Parallel and Distributed Computing, 150(1), 155–183. [Google Scholar]
24. Kim, H. G., Lee, D. Y., Jeong, S. Y., Choi, H., Yoo, J. H. et al. (2019). Machine learning-based method for prediction of virtual network function resource demands. 2019 IEEE Conference on Network Softwarization (NetSoft). [Google Scholar]
25. Song, B., Yu, Y., Zhou, Y., Wang, Z., Du, S. (2018). Host load prediction with long short-term memory in cloud computing. The Journal of Supercomputing, 74, 6554–6568. [Google Scholar]
26. Mijumbi, R., Hasija, S., Davy, S., Davy, A., Jennings, B. et al. (2017). Topology-aware prediction of virtual network function resource requirements. IEEE Transactions on Network & Service Management, 14(1), 106–120. [Google Scholar]
27. Xuan, H., Zhao, X., Fan, J., Xue, Y., Zhu, F. et al. (2021). VNF service chain deployment algorithm in 5G communication based on reinforcement learning. IAENG Internaitonal Journal of Computer Science, 48(1). [Google Scholar]
28. Albers, S., Khan, A., Ladewig, L. (2021). Best fit bin packing with random order revisited. Algorithmica, 83(9), 2833–2858. [Google Scholar] [PubMed]
29. Ahmed, A., Ibrahim, M. (2017). Analysis of energy saving approaches in cloud computing using ant colony and first fit algorithms. International Journal of Advanced Computer Science and Applications, 8(12). [Google Scholar]
30. Sharma, E. (2020). An approximation algorithm for covering linear programs and its application to bin-packing. arXiv preprint arXiv:2011.11268. [Google Scholar]
31. Hu, Y., Gao, A., Wang, C., Cao, W., Yan, M. (2020). The Lyapunov optimization for two-tier hierarchical-based MAC in cloud robotics. Wireless Communications and Mobile Computing, 2020, 1–11. https://doi.org/10.1155/2020/8876705 [Google Scholar] [CrossRef]
32. Huang, J., Jiao, Y., Lu, X., Shi, Y., Yang, Q. et al. (2022). PSNA: A pathwise semismooth Newton algorithm for sparse recovery with optimal local convergence and oracle properties. Signal Processing, 194(1), 108432. [Google Scholar]
33. Berahas, A. S., Takáč, M. (2020). A robust multi-batch L-BFGS method for machine learning. Optimization Methods and Software, 35(1), 191–219. [Google Scholar]
Cite This Article
 Copyright © 2024 The Author(s). Published by Tech Science Press.
This work is licensed under a Creative Commons Attribution 4.0 International License , which permits unrestricted use, distribution, and reproduction in any medium, provided the original work is properly cited.
 Downloads
 Citation Tools