
 Submit a Paper
 Propose a Special lssue
 Open Access
ARTICLE

Microstrip Patch Antenna with an Inverted T-Type Notch in the Partial Ground for Breast Cancer Detections
1 Department of Biomedical Engineering and Science, Florida Institute of Technology, Melbourne, FL 32901, USA
2 Biomedical Device Innovation Center, Shenzhen Technology University, Shenzhen, 518118, China
3 Department of Electrical and Computer Engineering, International Islamic University Malaysia, Jalan Gombak, Selangor, 53100, Malaysia
* Corresponding Authors: Lulu Wang. Email: ,
; Mehmet Kaya. Email:
Computer Modeling in Engineering & Sciences 2024, 138(2), 1301-1322. https://doi.org/10.32604/cmes.2023.030844
Received 26 April 2023; Accepted 27 July 2023; Issue published 17 November 2023
 View Full Text
 Download PDF
Abstract
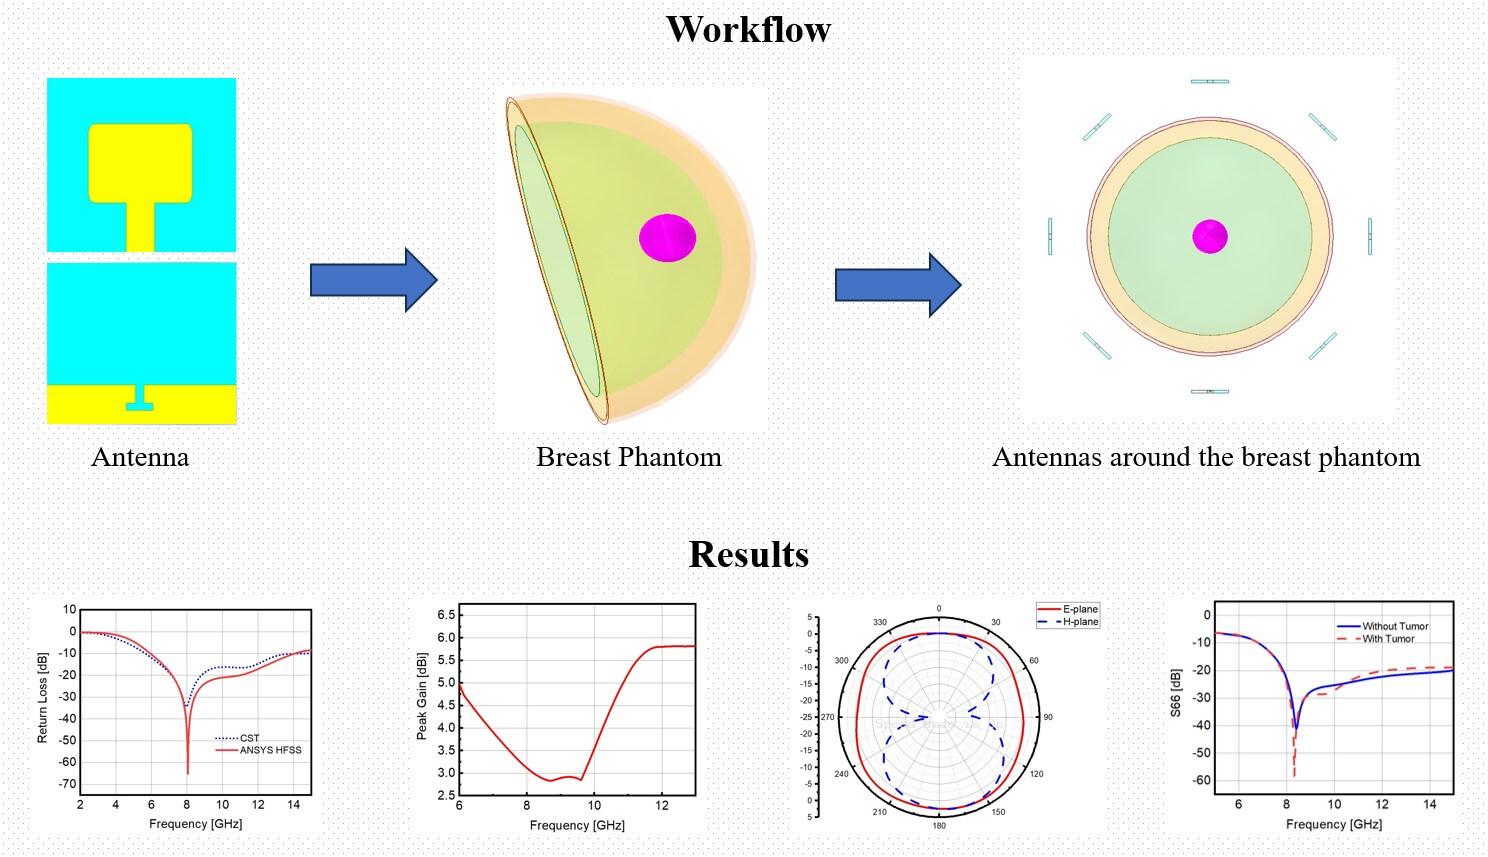
This study designs a microstrip patch antenna with an inverted T-type notch in the partial ground to detect tumor cells inside the human breast. The size of the current antenna is small enough (18 mm × 21 mm × 1.6 mm) to distribute around the breast phantom. The operating frequency has been observed from 6–14 GHz with a minimum return loss of −61.18 dB and the maximum gain of current proposed antenna is 5.8 dBi which is flexible with respect to the size of antenna. After the distribution of eight antennas around the breast phantom, the return loss curves were observed in the presence and absence of tumor cells inside the breast phantom, and these observations show a sharp difference between the presence and absence of tumor cells. The simulated results show that this proposed antenna is suitable for early detection of cancerous cells inside the breast.Graphic Abstract
Keywords
Antennas have been considered one of the most important technical constructions for transmitting and receiving electromagnetic waves in free space and are applicable to wireless communications, radar communications, biomedical applications [1,2], etc. The size and shape of the antenna play an important role in the physical outputs associated with the antenna. Another important parameter for antenna’s outcomes is the frequency at which it will be operated [1]. The size and shape of the antenna are also related to the operating frequency [1,2]. The Federal Communication Commission (FCC) assigned different names corresponding to different frequency ranges, and the FCC declared 3.1 to 10.6 GHz as an ultra-wideband (UWB) regime [3,4]. To obtain physical and applicable outcomes from an antenna associated with an ultra-wideband frequency range, people consider different geometry (e.g., partial ground [5,6], coplanar [7], slots, strips, and notch [5], etc.) for designing the antenna. In [5], the authors considered FR4 substrate to design an ultra-wideband antenna (75 mm × 61 mm × 1.6 mm) and observed that the antenna can operate between 3.8–11 GHz with a maximum gain of 2.75 dBi. In [5], a dual notch band UWB monopole antenna (33 mm × 34 mm × 1.575 mm) has been constructed on a Rogers 5880 substrate for an operating frequency of 1.7–11.1 GHz.
The final state of the irregular growth of the cell, also known as a cancerous cell, inside the breast is considered as a breast tumor [3]. The time evolution of these inhomogeneous metastatic cancerous cells can spread to different sensitive parts of the body, viz., lungs, liver, brain, etc. In 2008, a breast cancer test report stated that the number of breast cancer patients had increased by 20 percent and the death rate was almost 14 percent. In 2012, 1.7 million women were taking treatment for breast cancer [3]. So, this is a global problem, and it is inevitable to detect cancerous cells or malignant tissue in specific areas of the body before further spreading out to other parts of the body [4–6]. The early detection of breast cancer is vital for providing a suitable treatment corresponding to the status of breast cancer. If doctors can detect breast cancer before extreme situations, then the patients can receive proper treatment before further augmentation of cancer [4]. Different methods have been employed to detect breast cancer, viz., X-ray, Nuclear Magnetic Imaging Resonance (NMRI), and ultra-sound, etc. But there are several limitations to employing these methods [6]. The X-rays can produce ionizing radiation, and we know that successive application of the ionizing radiation can change the internal structure of the breast tissues [3]. NMRI and ultra-sound, which are free from the ionizing radiation, are effective ways for observing the cancerous cells inside the breast but these methods are very expensive. NMRI and ultra-sound instruments are not available all over the world. On the other hand, the physical mechanism of the NMRI is related to nuclear science. Some patients feel fear when they are diagnosed by NMRI. So, it is essential to find another way for the early detection of cancerous cells inside the women’s breast. In that case, the best option is microwave imaging technology for early detection of different cancerous cells inside body [4,6]. On the other hand, for biomedical applications, the most suitable range of frequency associated with an antenna is UWB [4,6].
Currently, researchers consider different antennas as an imaging tool for the early detection of breast cancer [7–11]. In [12], a planar monopole antenna has been designed for an operating frequency of 7–14 GHz, and the associated return loss, gain, and efficiency of the proposed antenna have been observed for a specific orientation of a single antenna around the breast phantom. In [7], the authors designed a microstrip patch antenna for observing different physical properties (viz., electric field, magnetic field, and current density, etc.) in the presence and absence of a tumor inside the breast. The number of antennas around the breast phantom plays an important role in collecting large-scale data to precisely determine the size and location of a tumor. Comprehensive information about the different breast components can be achieved by considering more antennas around the breast phantom. On the other hand, the tumor can exist in any arbitrary location inside the breast. In [13], a square patch antenna has been considered to observe the specific absorption rate (SAR) of a tumor inside the breast phantom in the presence and absence of a tumor. In [14], the authors considered a single antenna 20 mm away from the breast phantom and observed a tumor in a specific location inside the breast phantom by studying the SAR value. It is important to study the existence of tumors with different sizes and locations inside the phantom in the presence of multiple antennas around the breast phantom. This study designs a microstrip patch antenna with an inverted T-type notch in the partial ground. It distributes 8 antennas around the breast phantom for comprehensive data collection of different mediums of the breast phantom. Moreover, it considers different sizes of tumors in a specific location and an arbitrary location with a specific size inside the breast phantom for early detection of breast tumors.
The rest of the paper is organized as follows: in Section 2, a new microstrip patch antenna is designed by employing the basic governing equations associated with microstrip patch antenna. In Section 3, breast phantom dielectric properties are described. In Section 4, a breast phantom is modeled, and 8 antennas are distributed around the breast phantom. In Section 5, the results and discussion are provided. In Section 6, a brief comparison with published works is provided. In Section 7, a conclusion is presented.
The perfect design of an antenna can precisely predict the physically applicable outcomes. It is very important to consider available material to construct a new antenna. FR4 substrate is a commonly used low-cost substrate that has relatively high dielectric loss and is considered lossy compared to other high-performance substrates such as RT/Duroid. However, FR4 substrate can still be useful in the frequency range of 6 to 14 GHz because its loss tangent is relatively low in this frequency range, which means that the dielectric losses are not as significant as they would be at higher frequencies. Additionally, the high dielectric constant of FR4 substrate allows for compact antenna designs, which can be advantageous in certain applications where size and weight are critical factors. Therefore, the authors may have chosen to use FR4 substrate in this frequency range to take advantage of its low cost, compact size, and relatively low dielectric losses. Several authors considered FR4 substrate to design antenna for different ranges of operating frequency [15–19]. In [15], the authors considered FR4 substrate to design an antenna which can be operated in a frequency range of 2.5 to 29.0 GHz. In [16], a Koch-fractal antenna has been designed on FR4 substrate and the proposed antenna can operate in the frequency range from 2 to 30 GHz. In [17], a FR4 substrate has been considered to design a star-triangular fractal monopole antenna which can operate in a frequency range of 1 to 30 GHz. The substrate for the current antenna has been considered FR4 lossy material (tangent loss is 0.02) which has a relative permittivity of 4.4. We used ANSYS HFSS software for designing the antenna corresponding microstrip feedline of 50-ohm impedance power source and for validation of antenna results, we also used CST STUDIO SUITE to design a single antenna. The basic governing equations for the microstrip patch width and length can be expressed as [1,20–24]
The microstrip feed line characteristic impedance can be calculated by employing this equation [1]
where FW is the width of the microstrip feed line. Ground plane width and length are calculated with the following formula, respectively [25–27]:
The final design of the proposed antenna can be seen in Fig. 1. For designing the final proposed antenna, we employ four successive iterations to find physically applicable outcomes. In the zeroth iteration [please see Fig. 2a, upper-panel (microstrip patch) and lower-panel (full ground)], we design a simple microstrip patch and a full ground by applying Eqs. (1)–(6). Then, in the first iteration (see Fig. 2b, lower panel), we make our full ground to a partial ground and optimize the length of the partial ground (GL) to find the minimum return loss, and the better optimized GL is observed at 4.3 mm (the figure is not included). In the second iteration, we employ four exponential equations in each corner of the microstrip patch and observe a rigorous increment of the frequency bandwidth (please see Fig. 2c, upper panel). The equations, which have been employed in the patch at each corner, are represented in Table 1.

Figure 1: Final design of the proposed antenna (ANSYS HFSS)

Figure 2: (a) Microstrip patch and full ground; (b) microstrip patch and partial ground; (c) four corners of the patch are making smooth and partial ground; (d) an inverted T-type notch is introduced directly opposite to the microstrip feed line (ANSYS HFSS)

In the third iteration, we have included an inverted T-type notch in the partial ground directly opposite to the microstrip feed line (please see Fig. 2d, lower panel) without any further changing over the patch. The T-notch has been chosen because it provides a wide bandwidth and deep frequency rejection. The slotted antenna achieves larger gain and efficiency by exciting a resonant mode in the slot and coupling it to the main radiator. The slot can improve the antenna performance by reducing surface wave losses and enhancing radiation efficiency, but the design must carefully balance the slot size and position to avoid degrading the performance. In this case, the performance improvement was achieved by optimizing the dimensions and position of the slot to enhance radiation efficiency and reduce losses. This inverted T-type notch significantly minimizes the return loss of the current design of antenna and establishes a proper impedance matching between the external power source and the antenna. The designing parameters associated with the new antenna design are presented in Table 2.

The left panel of Fig. 3 represents the simulation setup of ANSYS HFSS. The box, which encloses the antenna, is the radiation box, and air is considered inside the radiation box. On the other hand, the right panel of Fig. 3 represents the simulation setup of CST STUDIO SUITE.

Figure 3: Simulation setup of ANSYS HFSS (left panel) and CST STUDIO SUITE (right panel)
3 Breast Phantom Dielectric Properties
The structure of a real breast is very complex which has different components, viz., skin, fat, fibro-gland, muscle, artery, blood, and water, etc. So, it is very difficult to address all the components and their dynamic properties in a single framework to run a simulation. In this perspective, people consider a simple static structure which has three fundamental components, viz., breast skin, breast fat, and breast fibro-gland [3,28], etc. The density of different parts of the breast phantom remains constant over the frequency range at which the antenna is going to work but other physical properties like relative permittivity, conductivity, and the loss tangent of the different parts of the breast phantom are going to change according to the operating frequency [29–32]. Table 3 shows the physical properties of the breast phantom at a specific frequency of 8 GHz [12,29–32].

4 Modeling of a Human Breast Phantom
A half spherical shaped breast phantom with three different layers (viz., breast skin, breast fat, breast fibro-gland, etc.) can be seen in Fig. 4. The outer layer of the breast is the breast skin. After this layer, there is a fat layer which is represented by the yellow color in Fig. 4, and finally a layer of fibro-gland is just living center/middle of the half spherical shaped breast phantom [3].

Figure 4: Cross-sectional view of different components of the breast phantom (ANSYS HFSS)
The radius as well as the thickness of the different parts of the breast phantom are different [3]. Here we present the thickness of different layers of the breast phantom in Table 4.

The time evolution of cancerous cells transforms into tumors. So, these tumors are living inside the breast phantom. In Fig. 5, a tumor can be seen in the middle of the half spherical shaped breast phantom. There is an array of 8 antennas around the phantom. The antenna array is 20 mm far away from the skin/outer layer of the half spherical shaped breast phantom for making a good impedance matching. The center of each antenna makes an angle of 45 degrees (360/8 = 45 degrees) with the center of the next antenna corresponding to the center of the breast phantom in the same plane.

Figure 5: The presence of breast tumor inside the breast phantom and the distribution of 8 antennas around the breast phantom (ANSYS HFSS)
5.1 Single Antenna Performance Analysis
The return loss curve describes the amount of power of an antenna is going to return in the backward direction when the antenna operates. If the return loss is minimum for an antenna that means the antenna can transmit maximum power. For designing the antenna, we considered four successive iterations to find better physical outcomes. Here we would like to discuss the return loss associated with a single antenna.
The variation of return loss with frequency for different iterations of a single antenna can be seen in Fig. 6a. It can be seen from this figure that after completing the first iteration, the return loss touches −25.60 dB from −5.22 dB at 8 GHz. In the second iteration, the return loss decreases to −38.59 dB from −25.60 dB, and the minimum return loss is observed at −61.18 dB corresponding to the frequency of 8 GHz after completing the third iteration (please see Fig. 2 for the detail of designing iterations of current proposed antenna). It is interesting that our proposed antenna can operate a frequency range from 6 to 14 GHz and the minimum return loss is observed at 8 GHz. Fig. 6b expresses the comparison of return loss curve of ASYS HFSS and CST STUDIO SUITE design. It can be seen from Fig. 6b that (i) the operating frequency has been observed almost the same from 6–14 GHz for both ASYS HFSS and CST STUDIO SUITE antenna designs; (ii) both antenna designs provide a resonance at 8 GHz.

Figure 6: (a) Return loss for four successive steps (ANSYS HFSS), and (b) the comparison of return loss curves
The distribution of the surface current above the patch can be observed in Fig. 7 and it can be seen from this figure that (a) most of the surface current is distributed over the microstrip feedline and the edges of the microstrip patch; (b) the maximum value of the surface current density are 41.442, 52.845, and 65.535 A/m corresponding to the frequency of 6, 8, and 12 GHz; (b) the minimum surface current is observed in the center and near to the center of the patch; (c) the maximum surface current density increases with the increase in the value of frequency; (d) physically, due to skin effect, with increasing the frequency, most of the charges are living above the surface of the patch and microstrip feedline.


Figure 7: Current distribution over the patch at (a) 6 GHz; (b) 8 GHz; and (c) 12 GHz (ANSYS HFSS)
The radiation pattern, which describes the direction of the propagation of the antenna radiation, is very important to apply in different physical situations. The radiation pattern of the proposed antenna for different frequencies can be observed in Fig. 8. It is clear from this figure that (a) for frequency 6 GHz, the radiation pattern in the E-plane (i.e.,


Figure 8: 2D gain plots of the suggested antenna at a frequency of (a) 6.0 GHz, (b) 8.0 GHz, (c) 10 GHz (ANSYS HFSS)
The relation between the peak gain with frequency can be observed from Fig. 9. Initially, the peak gain is 4.97 dBi at 6 GHz then it slowly decreases to 2.83 dBi at 8.7 GHz and remains almost constant (below 3 dBi) up to around 9.6 GHz and again the peak gain linearly increases to 5.8 dBi at 11.9 GHz. Finally, the peak gain remains almost constant from 11.9 to 14 GHz, and in this frequency regime, the peak gain is around 5.7 to 5.8 dBi. So, the maximum gain is observed at 5.8 dBi for the suggested antenna within the frequency band 6 to 14 GHz.

Figure 9: Peak gain vs. frequency curve (ANSYS HFSS)
5.2 Deep-Seated Breast Tumor Detection
Initially, we consider a spherical shaped tumor with a radius of 5 mm living inside the half spherical shaped breast phantom, and in that case, each antenna element maintains equal distance from the outer surface of the breast phantom and even from the center of the 5 mm tumor. Each antenna is 90 mm far away from the center of the tumor (see Fig. 10).

Figure 10: Deep-seated tumor with 5 mm radius
The return loss curves corresponding to a breast phantom without a tumor and with a tumor, which exists in the deep-seated position of the breast phantom, can determine the presence or absence of the deep-seated tumor inside the breast phantom. Each panel of Fig. 11 shows both return loss curves corresponding to the existence of a tumor (dashed red curves) and without a tumor (solid blue curves). It is clear from this figure that there is a sharp difference between each of the dashed red curves associated with the presence of a tumor and corresponding the solid blue curves associated with the absence of a tumor. This happens due to the dielectric properties of the existing deep-seated tumor inside the breast phantom. If there is no deep-seated tumor inside the breast phantom, then both solid and dotted curves from each panel of Fig. 11 will coincide with each other.


Figure 11: Return loss for different antennas around the breast phantom in the presence and absence of a 5 mm tumor (ANSYS HFSS)
Now, we consider 10 mm radius of a spherical tumor in the same location to run a new simulation and would like to observe the ability of 8 antennas around the breast phantom to detect a tumor with a radius of 10 mm in the deep location of the breast phantom (see Fig. 12).

Figure 12: Deep-seated tumor with 10 mm radius
The return loss curves correspond to the presence of a 10 mm deep-seated tumor (dashed red curves), and the absence of the tumor (solid blue curve) again provides a sharp difference as well as tumor existence (see Fig. 13).


Figure 13: Return loss for different antennas around the breast phantom in the presence and absence of a 10 mm tumor (ANSYS HFSS)
Now, we again consider a 15 mm deep-seated tumor inside the breast phantom (see Fig. 14), and Fig. 15 represents the return loss curves corresponding to the existence and absence of tumor.

Figure 14: Deep-seated tumor with 15 mm radius

Figure 15: Return loss for different antennas around the breast phantom in the presence and absence of a 15 mm tumor (ANSYS HFSS)
We can see from each panel of return loss curves that the dashed red curve corresponding to the existence of a tumor inside the phantom and the solid blue curve corresponding to the absence of a tumor does not coincide with each other for each point of frequency. So, our suggested antenna can detect a deep-seated tumor with a radius of 5, 10, and 15 mm, etc.
Now, we are determining the numerical values of return loss for both the presence and absence of the tumor, and their differences for a 5, 10, and 15 mm radius of deep-seated tumors. The difference between the return loss values (
Table 5 represents the detailed numerical values of three different simulations (i.e., 5, 10, and 15 mm radius deep-seated tumor inside breast phantom and breast phantom without tumor). From this Table 5, for 5 mm deep-seated tumors, the lowest and highest values of

5.3 Superficially Located Breast Tumor Detection
Here we would like to discuss that the current antenna array is able to detect the existence of a spherical tumor with a 2 mm radius in different superficial locations inside the breast phantom. For this purpose, we change the tumor location from deep-seated position to different arbitrary positions. Different position of a spherical breast tumor with 2 mm radius can be seen in each panel of Fig. 16. Each panel of Fig. 16 represents an arbitrary position of a 2 mm radius tumor; for example, Fig. 16a, a tumor with a 2 mm radius exists near to antenna 1. Similarly, in Figs. 16b and 16c, a tumor is present near antenna 2 and antenna 3, etc. Table 6 represents the

Figure 16: Different positions of a 3 mm tumor inside the breast phantom (ANSYS HFSS)

Similarly, we can consider the 5 mm radius of a spherical tumor in different arbitrary locations inside of the breast phantom (see Fig. 17). Table 7 represents the ΔS values for different arbitrary positions of a 5 mm tumor.

Figure 17: Different positions of a 5 mm tumor inside the breast phantom (ANSYS HFSS)

Again, a spherical size tumor with a 10 mm radius has been considered in different arbitrary locations inside of the breast phantom (see Fig. 18). Table 8 represents the ΔS values for different arbitrary positions of a 10 mm tumor.


Figure 18: Different positions of a 10 mm tumor inside the breast phantom (ANSYS HFSS)

Tables 6–8 represent the difference between the return losses in the absence and presence of a tumor with different radius in an arbitrary position associated with 8 simulations, and each
6 Comparison of Current Research Outcomes with the Existing Literature
Now, we are looking at a comparison between the current proposed antenna with others existing antennas as Table 9 shows. In that case, we consider the substrate, size, operating frequency, return loss, and maximum gain, etc.

In this paper, we design a microstrip patch antenna over the FR4 (lossy) substrate with an inverted T-type notch in the partial ground. Our current antenna is small size
Acknowledgement: Nure Alam Chowdhury is grateful to S. M. Kayser Azam for his support.
Funding Statement: This research was funded by the International Science and Technology Cooperation Project of the Shenzhen Science and Technology Commission (GJHZ20200731095804014).
Author Contributions: Conceptualization: Lulu Wang; Methodology: Lulu Wang, Nure Alam Chowdhury, Md Shazzadul Islam, Linxia Gu, Mehmet Kaya; Software: Nure Alam Chowdhury, Lulu Wang; Formal analysis: Lulu Wang, Nure Alam Chowdhury, Md Shazzadul Islam, Linxia Gu, Mehmet Kaya; Writing-original draft preparation: Nure Alam Chowdhury; Writing—review and editing: Lulu Wang, Nure Alam Chowdhury, Md Shazzadul Islam, Linxia Gu, Mehmet Kaya; Project administration: Lulu Wang, Linxia Gu, Mehmet Kaya. All authors reviewed the results and approved the final version of the manuscript.
Availability of Data and Materials: All data are presented inside the manuscript.
Conflicts of Interest: The authors declare that they have no conflicts of interest to report regarding the present study.
References
1. Balanis, C. A. (2016). Antenna theory: Analysis and design (Fourth edition). Hoboken, New Jersey: Wiley. [Google Scholar]
2. Pozar, D. M. (2012). Microwave engineering (Fourth edition). Hoboken, New Jersey: Wiley. [Google Scholar]
3. Ahmed, S. S., Mahdi, J. F., Kadhim, M. A. (2020). Design of ultra-wideband microwave antenna array for detection breast cancer tumors. IOP Conference Series: Materials Science and Engineering, 881(1), 012112. https://doi.org/10.1088/1757-899X/881/1/012112 [Google Scholar] [CrossRef]
4. Wang, L. (2017). Early diagnosis of breast cancer. Sensors, 17(7), 1572. https://doi.org/10.3390/s17071572 [Google Scholar] [PubMed] [CrossRef]
5. Alamro, W., Seet, B. C., Wang, L., Parthiban, P. (2022). Early-stage lung tumor detection based on superwideband microwave reflectometry. Electronics, 12(1), 36. https://doi.org/10.3390/electronics12010036 [Google Scholar] [CrossRef]
6. Wang, L. (2018). Microwave sensors for breast cancer detection. Sensors, 18(2), 655. https://doi.org/10.3390/s18020655 [Google Scholar] [PubMed] [CrossRef]
7. Caliskan, R., Gültekin, S. S., Uzer, D., Dündar, Ö. (2015). A microstrip patch antenna design for breast cancer detection. Procedia-Social and Behavioral Sciences, 195, 2905–2911. https://doi.org/10.1016/j.sbspro.2015.06.418 [Google Scholar] [CrossRef]
8. Selvaraj, V., Baskaran, D., Rao, P. H., Srinivasan, P., Krishnan, R. (2021). Breast tissue tumor analysis using wideband antenna and microwave scattering. IETE Journal of Research, 67(1), 49–59. https://doi.org/10.1080/03772063.2018.1531067 [Google Scholar] [CrossRef]
9. Elsaadi, M., Muhmed, H., Alraheem, M. A., Miftah, H., Salah, O. (2019). Square patch antenna for breast cancer diagnosis at 2.45 GHz. Circuits and Systems, 10(4), 45–53. https://doi.org/10.4236/cs.2019.104004 [Google Scholar] [CrossRef]
10. Rambe, A. H., Jusoh, M., Al-Bawri, S. S., Abdelghany, M. A. (2022). Wearable UWB antenna-based bending and wet performances for breast cancer detection. Computers, Materials & Continua, 73(3), 5575–5587. https://doi.org/10.32604/cmc.2022.030902 [Google Scholar] [PubMed] [CrossRef]
11. Syed, A., Sobahi, N., Sheikh, M., Mittra, R., Rmili, H. (2021). Modified 16-quasi log periodic antenna array for microwave imaging of breast cancer detection. Applied Sciences, 12(1), 147. https://doi.org/10.3390/app12010147 [Google Scholar] [CrossRef]
12. Islam, M. S., Kayser Azam, S. M., Zakir Hossain, A. K. M., Ibrahimy, M. I., Motakabber, S. M. A. (2022). A low-profile flexible planar monopole antenna for biomedical applications. Engineering Science and Technology, an International Journal, 35, 101112. https://doi.org/10.1016/j.jestch.2022.101112 [Google Scholar] [CrossRef]
13. Elsaadi, M., Muhmed, H., Alraheem, M. A., Miftah, H., Salah, O. (2019). Square patch antenna for beast cancer diagnosis at 2.45 GHz. Circuits and Systems, 10(4), 45–53. https://doi.org/10.4236/cs.2019.104004 [Google Scholar] [CrossRef]
14. AlOmairi, A., Atilla, D. C. (2021). Ultra-wide-band microstrip patch antenna design for breast cancer detection. Electrica, 22(1), 41–51. https://doi.org/10.5152/electrica.2021.21053 [Google Scholar] [CrossRef]
15. Rahman, M. N., Islam, M. T., Mahmud, M. Z., Samsuzzaman, M. (2017). Compact microstrip patch antenna proclaiming super wideband characteristics. Microwave and Optical Technology Letters, 59(10), 2563–2570. https://doi.org/10.1002/mop.30770 [Google Scholar] [CrossRef]
16. Chitra, R. J., Nagarajan, V. (2016). Design and development of koch fractal antenna. 2016 International Conference on Communication and Signal Processing (ICCSP), pp. 2294–2298. https://doi.org/10.1109/ICCSP.2016.7754104 [Google Scholar]
17. Waladi, V., Mohammadi, N., Zehforoosh, Y., Habashi, A., Nourinia, J. (2013). A novel modified startriangular fractal (MSTF) monopole antenna for super-wideband applications. IEEE Antennas and Wireless Propagation Letters, 12, 651–654. https://doi.org/10.1109/LAWP.2013.2262571 [Google Scholar] [CrossRef]
18. Singhal, S. (2018). Octagonal Sierpinski band-notched super-wideband antenna with defected ground structure and symmetrical feeding. Journal of Computational Electronics, 17(3), 1071–1081. https://doi.org/10.1007/s10825-018-1194-9 [Google Scholar] [CrossRef]
19. Singhal, S. (2017). Asymmetrically fed octagonal Sierpinski band-notched super-wideband antenna. Journal of Computational Electronics, 16(1), 210–219. https://doi.org/10.1007/s10825-016-0948-5 [Google Scholar] [CrossRef]
20. Tewary, T., Maity, S., Mukherjee, S., Roy, A., Sarkar, P. P. et al. (2022). High gain miniaturrized super-wideband microstrip patch antenna. International Journal of Communication Systems, 35(11). https://doi.org/10.1002/dac.5181 [Google Scholar] [CrossRef]
21. Bhatia, S. S., Sahni, A., Rana, S. B. (2018). A novel design of compact monopole antenna with defected ground plane for wideband applications. Progress in Electromagnetics Research M, 70, 21–31. https://doi.org/10.2528/PIERM18050201 [Google Scholar] [CrossRef]
22. Guruva Reddy, A., Madhavi, M., Rakesh Kumar, P. (2020). Compact slotted multiband patch antenna with defected ground structure for wireless communication. Journal of Physics: Conference Series, 1706(1), 012150. https://doi.org/10.1088/1742-6596/1706/1/012150 [Google Scholar] [CrossRef]
23. Merlin Teresa, P., Umamaheswari, G. (2022). Compact slotted microstrip antenna for 5G applications operating at 28 GHz. IETE Journal of Research, 68(5), 3778–3785. https://doi.org/10.1080/03772063.2020.1779620 [Google Scholar] [CrossRef]
24. Moradikordalivand, A., Rahman, T. A. (2013). Broadband modified rectangular microstrip patch antenna using stepped cut at four corner method. Progress in Electromagnetics Research, 137, 599–619. https://doi.org/10.2528/PIER13011714 [Google Scholar] [CrossRef]
25. Przesmycki, R., Bugaj, M., Nowosielski, L. (2020). Broadband microstrip antenna for 5G wireless systems operating at 28 GHz. Electronics, 10(1), 1. https://doi.org/10.3390/electronics10010001 [Google Scholar] [CrossRef]
26. Islam, Md. S., Ibrahimy, M. I., Motakabber, S. M. A., Hossain, A. K. M. Z. (2018). A rectangular inset-fed patch antenna with defected ground structure for ISM band. 2018 7th International Conference on Computer and Communication Engineering (ICCCE), pp. 104–108. https://doi.org/10.1109/ICCCE.2018.8539260 [Google Scholar] [CrossRef]
27. Shrestha, S., Lee, S. R., Choi, D. Y. (2014). A new fractal-based miniaturized dual band patch antenna for RF energy harvesting. International Journal of Antennas and Propagation, 2014, 1–9. https://doi.org/10.1155/2014/805052 [Google Scholar] [CrossRef]
28. Aydın, E. A., Kaya Keleş, M. (2017). Breast cancer detection using K-nearest neighbors data mining method obtained from the bow-tie antenna dataset: AVŞAR AYDIN and Kaya Keleş. International Journal of RF and Microwave Computer-Aided Engineering, 27(6), e21098. https://doi.org/10.1002/mmce.21098 [Google Scholar] [CrossRef]
29. Lazebnik, M., McCartney, L., Popovic, D., Watkins, C. B., Lindstrom, M. J. et al. (2007). A large-scale study of the ultrawideband microwave dielectric properties of normal breast tissue obtained from reduction surgeries. Physics in Medicine and Biology, 52(10), 2637–2656. https://doi.org/10.1088/0031-9155/52/10/001 [Google Scholar] [PubMed] [CrossRef]
30. Lazebnik, M., Popovic, D., McCartney, L., Watkins, C. B., Lindstrom, M. J. et al. (2007). A large-scale study of the ultrawideband microwave dielectric properties of normal, benign, and malignant breast tissues obtained from cancer surgeries. Physics in Medicine and Biology, 52(20), 6093–6115. https://doi.org/10.1088/0031-9155/52/20/002 [Google Scholar] [PubMed] [CrossRef]
31. Cheng, Y., Fu, M. (2018). Dielectric properties for non-invasive detection of normal, benign, and malignant breast tissues using microwave theories: Microwave properties of breast tissues. Thoracic Cancer, 9(4), 459–465. https://doi.org/10.1111/1759-7714.12605 [Google Scholar] [PubMed] [CrossRef]
32. Zerrad, F. E., Taouzari, M., Makroum, E. M., Ahmad, S., Alkurt, F. O. et al. (2022). Symmetrical and asymmetrical breast phantoms with 3D-printed anatomical structure for microwave imaging of breast cancer. IEEE Access, 10, 96896–96908. https://doi.org/10.1109/ACCESS.2022.3205004 [Google Scholar] [CrossRef]
Cite This Article
 Copyright © 2024 The Author(s). Published by Tech Science Press.
This work is licensed under a Creative Commons Attribution 4.0 International License , which permits unrestricted use, distribution, and reproduction in any medium, provided the original work is properly cited.
 Downloads
 Citation Tools