
 Submit a Paper
 Propose a Special lssue
 Open Access
ARTICLE
Tensile Strain Capacity Prediction of Engineered Cementitious Composites (ECC) Using Soft Computing Techniques
1 Civil Engineering Department, University of Halabja, Halabja, Iraq
2 University of Sulaimani, College of Engineering, Civil Engineering Department, Sulaimani, Iraq
3 Civil Engineering Department, Komar University of Science and Technology, Sulaimani, Iraq
4 Department of Engineering, Kurdistan Institution for Strategic Studies and Scientific Researches, Sulaimani, Iraq
5 Department of Civil Engineering, American University of Sharjah, Sharjah, 26666, UAE
* Corresponding Author: Rabar H. Faraj. Email:
(This article belongs to the Special Issue: Meta-heuristic Algorithms in Materials Science and Engineering)
Computer Modeling in Engineering & Sciences 2024, 138(3), 2925-2954. https://doi.org/10.32604/cmes.2023.029392
Received 16 February 2023; Accepted 04 August 2023; Issue published 15 December 2023
 View Full Text
 Download PDF
Abstract
Plain concrete is strong in compression but brittle in tension, having a low tensile strain capacity that can significantly degrade the long-term performance of concrete structures, even when steel reinforcing is present. In order to address these challenges, short polymer fibers are randomly dispersed in a cement-based matrix to form a highly ductile engineered cementitious composite (ECC). This material exhibits high ductility under tensile forces, with its tensile strain being several hundred times greater than conventional concrete. Since concrete is inherently weak in tension, the tensile strain capacity (TSC) has become one of the most extensively researched properties. As a result, developing a model to predict the TSC of the ECC and to optimize the mixture proportions becomes challenging. Meanwhile, the effort required for laboratory trial batches to determine the TSC is reduced. To achieve the research objectives, five distinct models, artificial neural network (ANN), nonlinear model (NLR), linear relationship model (LR), multi-logistic model (MLR), and M5P-tree model (M5P), are investigated and employed to predict the TSC of ECC mixtures containing fly ash. Data from 115 mixtures are gathered and analyzed to develop a new model. The input variables include mixture proportions, fiber length and diameter, and the time required for curing the various mixtures. The model’s effectiveness is evaluated and verified based on statistical parameters such as R2, mean absolute error (MAE), scatter index (SI), root mean squared error (RMSE), and objective function (OBJ) value. Consequently, the ANN model outperforms the others in predicting the TSC of the ECC, with RMSE, MAE, OBJ, SI, and R2 values of 0.42%, 0.3%, 0.33%, 0.135%, and 0.98, respectively.Keywords
Nomenclature
| TSC | Tensile strain capacity |
| ECC | Engineered cementitious composite |
| ANN | Artificial neural network |
| LR | Linear relationship model |
| LR | Nonlinear model |
| MLR | Multi-logistic model |
| M5P | M5P-tree model |
| R2 | Coefficient of determination |
| MAE | Mean absolute error |
| RMSE | Root mean squared error |
| OBJ | Objective function |
| SI | Scatter index |
| FA | Fly ash |
| PP | Polypropylene |
| PE | Polyethylene |
| PVA | Polyvinyl alcohol |
| CS | Compressive strength |
| C | Cement |
| S | Sand |
| F | Fiber |
| SP | Superplasticizer |
| w/b | Water to binder ratio |
| MSS | Maximum size of sand |
| FL | Fiber length |
| FD | Fiber diameter |
| T | Curing time |
| SD | Standard deviation |
As one of the most economical and durable materials, concrete is extensively used in constructing various structures worldwide. To enhance the properties of this material and to make it more durable and robust, the construction industry, with the aid of researchers, continuously invests in developing its beneficial characteristics by introducing new materials and technologies. A remarkable result of this extensive research is the engineered cementitious composite (ECC), which has gained recognition for its high performance in the construction industry. Researchers have identified several weaknesses in plain concrete, including low tensile strength, brittleness, and low ultimate tensile strain. Addressing these deficiencies and introducing new materials have become significant research objectives. The fiber-reinforced high-performance material, known as engineered cementitious composite (ECC), developed by Li and his colleagues in 1992, is among the most effective alternatives to plain concrete [1–4]. The ECC’s microstructure was optimized using micromechanical models to enhance ductility properties, reduce fracture widths to as low as 100 µm, and increase tensile strain capacity by 5% more than regular concrete [5].
ECC is preferred in various construction fields, such as retrofitting structures damaged by earthquakes, patching concrete pavements and slabs, and restoring dams due to its high strain capability, resistance against spalling, low micro-cracks, and high impermeability [6–10]. ECC is known for its high ductility, allowing it to deform significantly without fracturing or losing strength. This characteristic makes ECC well-suited for earthquake-resistant structures and other applications where toughness and durability are crucial. FRC, while stronger than plain concrete, is generally less ductile than ECC. Additionally, ECC is highly crack-resistant because of its unique combination of high tensile strength and ductility. FRC also offers good crack resistance but might not perform as effectively as ECC in high-stress applications [11].
The ECC mixture typically consists of cement, fly ash, sand, water, and a chemical admixture with randomly scattered fibers. As indicated by [11], the proportions of the composting materials and their physical and chemical properties contribute to the design of the mixture. The types of fibers used in ECC production are generally polypropylene (PP), polyethylene (PE), and polyvinyl alcohol (PVA) composites. The rationale for using fiber in ECC is to enhance the tensile capacity of the material. Since PVA fiber possesses higher tensile strength than PP fiber, the flexural strength and toughness of ECC containing PVA fiber exceed that of ECC containing PP fiber [12]. The compressive strength of ECC is comparable to both ordinary and high-strength concretes. Due to its ductile property, as opposed to the brittleness of ordinary concrete, ECC is employed in a broad range of applications and has a promising future in various industries [13].
The compressive strength of concrete is a critical property when evaluating the overall quality of the material, leading other mechanical and durability parameters to be indirectly correlated with compressive strength [14,15]. For ECC, properties such as direct tensile strength and tensile strain capacity are more crucial to investigate. Several sets of specimens must be prepared, cured under various conditions, and tested to determine these properties for ECC. Concrete strength is often based on the 28-day strength capacity. Consequently, work might be halted until this point based on existing regulations, which can hinder project completion timelines and increase testing costs [16].
Determining the TSC of concrete without trials and preparing specimens has become one of the most challenging issues in construction material science [17], as the mixture proportion and component properties significantly affect the properties of ECC. With ongoing research on the TSC of ECC, the standard procedure for determining ECC characteristics may no longer be practical. Some researchers have derived regression models from the literature to link other ECC variables to its TSC. It is crucial to establish a simple, time-efficient procedure to predict experimental outcomes, especially since the TSC of ECC is highly sensitive to mixture proportions and various other variables. One potential solution could be soft computing approaches [18–20]. The primary advantage of this approach is its ability to offer solutions to both linear and nonlinear problems when mathematical models cannot demonstrate the relationships between central problem aspects [21,22].
Artificial intelligence systems have emerged as genuine tools for researchers studying cement-based composites to determine these materials’ mechanical properties and provide the most effective methodologies. Machine learning has advanced as a potent method for gauging the structural and material performance of such materials [23]. An extensive set of actual data with features is required to make machine learning models more robust and inclusive. Cavaleri et al. [23] proposed ensemble algorithms for predicting the bond strength of corroded reinforced concrete. They found that the models accurately depict the nonlinear behavior of corroded reinforced concrete. Another study used the M5P model tree to assess the dynamic modulus of asphalt concrete [24]. Ahmed et al. [25] adapted three standard models, linear, nonlinear, and multi-logistic regression, to predict the compressive strength (CS) of fly ash-based geopolymer concrete, using twelve actual mixture proportions and curing methods as model inputs. Moreover, the impact of the molarity of NaOH, nano-silica content, the ratio of sodium hydroxide to sodium silicate, the binder content, the aggregate amount, and the age of CS in the geopolymer concrete was investigated, and five distinct models, including the ANN and M5P tree, were developed to predict and estimate CS in the composites. Due to the limitations of soft computing models in predicting ECC characteristics, another effort was made by [26,27] to forecast the compressive and tensile strengths of ECC mixtures. This research developed an ANN model using data from 79 experiments and 12 input parameters from existing literature. The results underscored the ANN model’s efficacy in estimating the compressive and tensile strengths of ECC that includes PVA fiber in its composition. Since prior research in this area was deemed insufficient, the present study utilized five different ML models and ten input parameters to predict ECC’s TSC.
Since ECCs are commonly used in structural applications where ductility is paramount, there are few studies on estimating the TSC of ECCs with fly ash, complicating their efficient use in construction. Additionally, the building industry increasingly seeks novel building materials with unique properties to extend the longevity of concrete structures. This necessitates the creation of new models to anticipate the behavior and properties of these materials. The primary aim of this study is to explore the effects of various mixture proportions, such as cement (C), fly ash (FA), sand (S), fiber (F), w/b ratio, and superplasticizer (SP), on the TSC of ECC mixtures over both short (3 days) and long (90 days) durations. Extensive experimental data from 115 specimens, combined with diverse modeling approaches, were employed to achieve the following objectives: (i) examine the influence of cement, fly ash, sand, fibers, and SP contents, along with curing time, w/c ratio, maximum aggregate size, fiber length, and diameter, on the TSC of eco-friendly ECC containing fly ash, (ii) enable the construction industry to use the model for estimating ECC’s TSC without additional laboratory tests and analysis, (iii) confirm the model’s reliability compared to others (ANN, nonlinear, linear, and multi-logistic relation models) in terms of TSC prediction accuracy for sustainable ECC with fly ash. Moreover, an essential goal of this research is to develop mathematical models to predict the TSC of a novel composite type (ECC with fly ash) and leverage the model’s benefits in the construction sector.
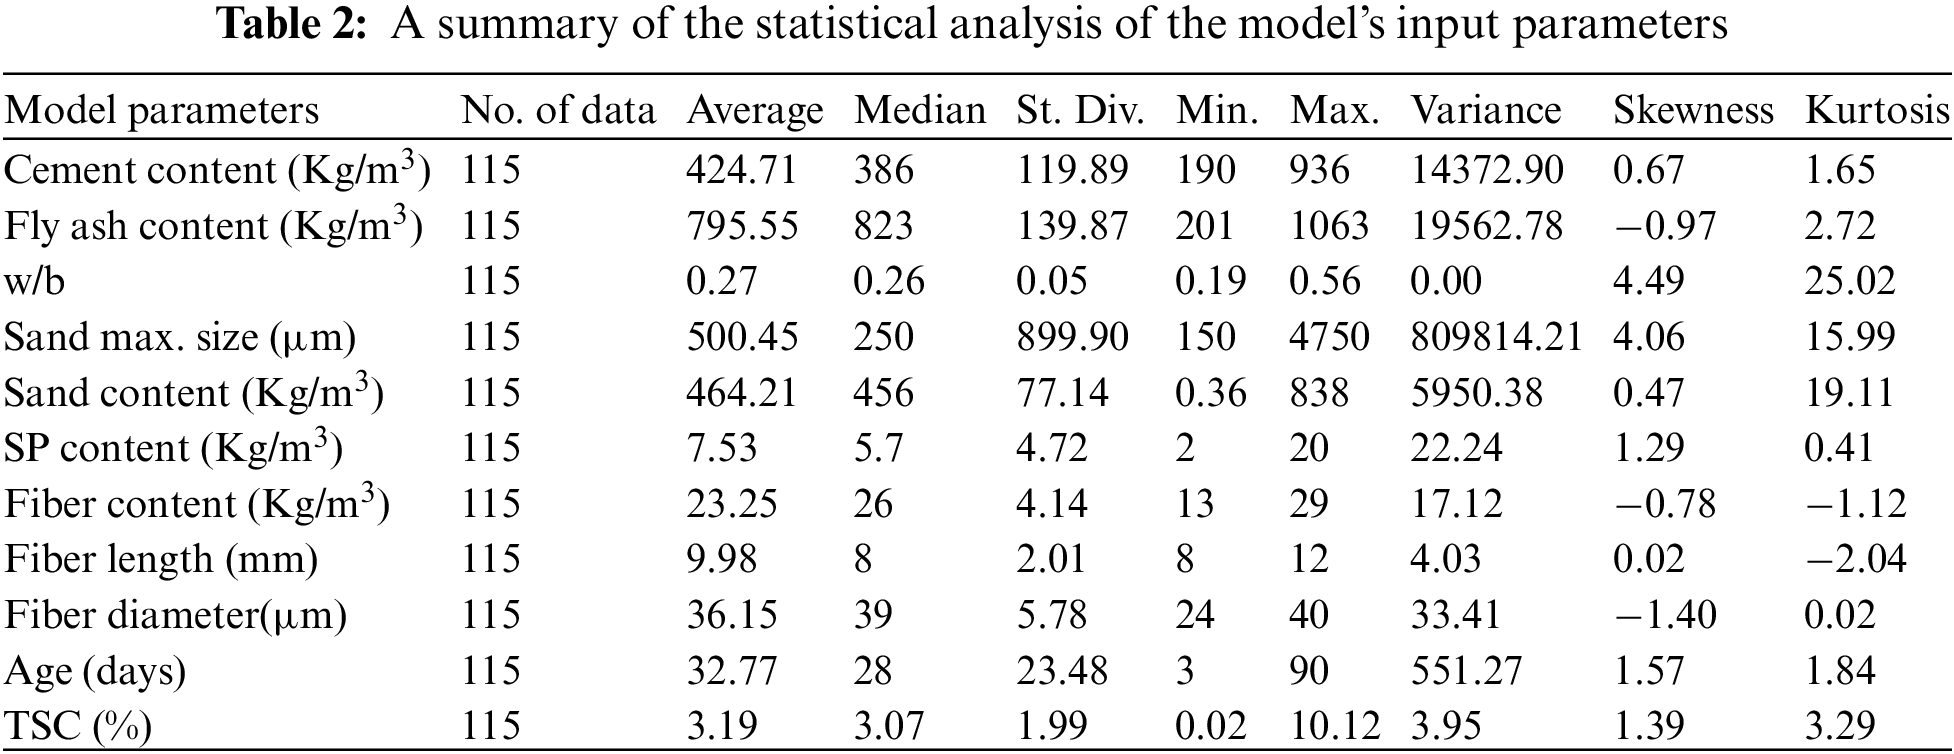
Data from various previous studies were collected to achieve the objectives of this research, totaling 115 datasets. These datasets were entered into an Excel sheet, after which they were arranged, divided, and statistically analyzed. The data were then randomly distributed and separated into two groups: the major group, which constituted 70% of the data, was used to generate the models and is referred to as training data, while the remaining 30% of the data was used to test the generated models [17,28].
The TSC of the ECC composites produced with different mix proportions and fly ash contents has been collected and presented in Table 1. This table encompasses most previous studies on this topic, particularly those that examined the effect of the composting material proportion on the properties of the ECC. The test results, including the fundamental parameters presented in Table 1, were used to predict the TCS of ECC using different approaches previously mentioned and compared to the reported measured TCS%. The workflow is illustrated in Fig. 1.
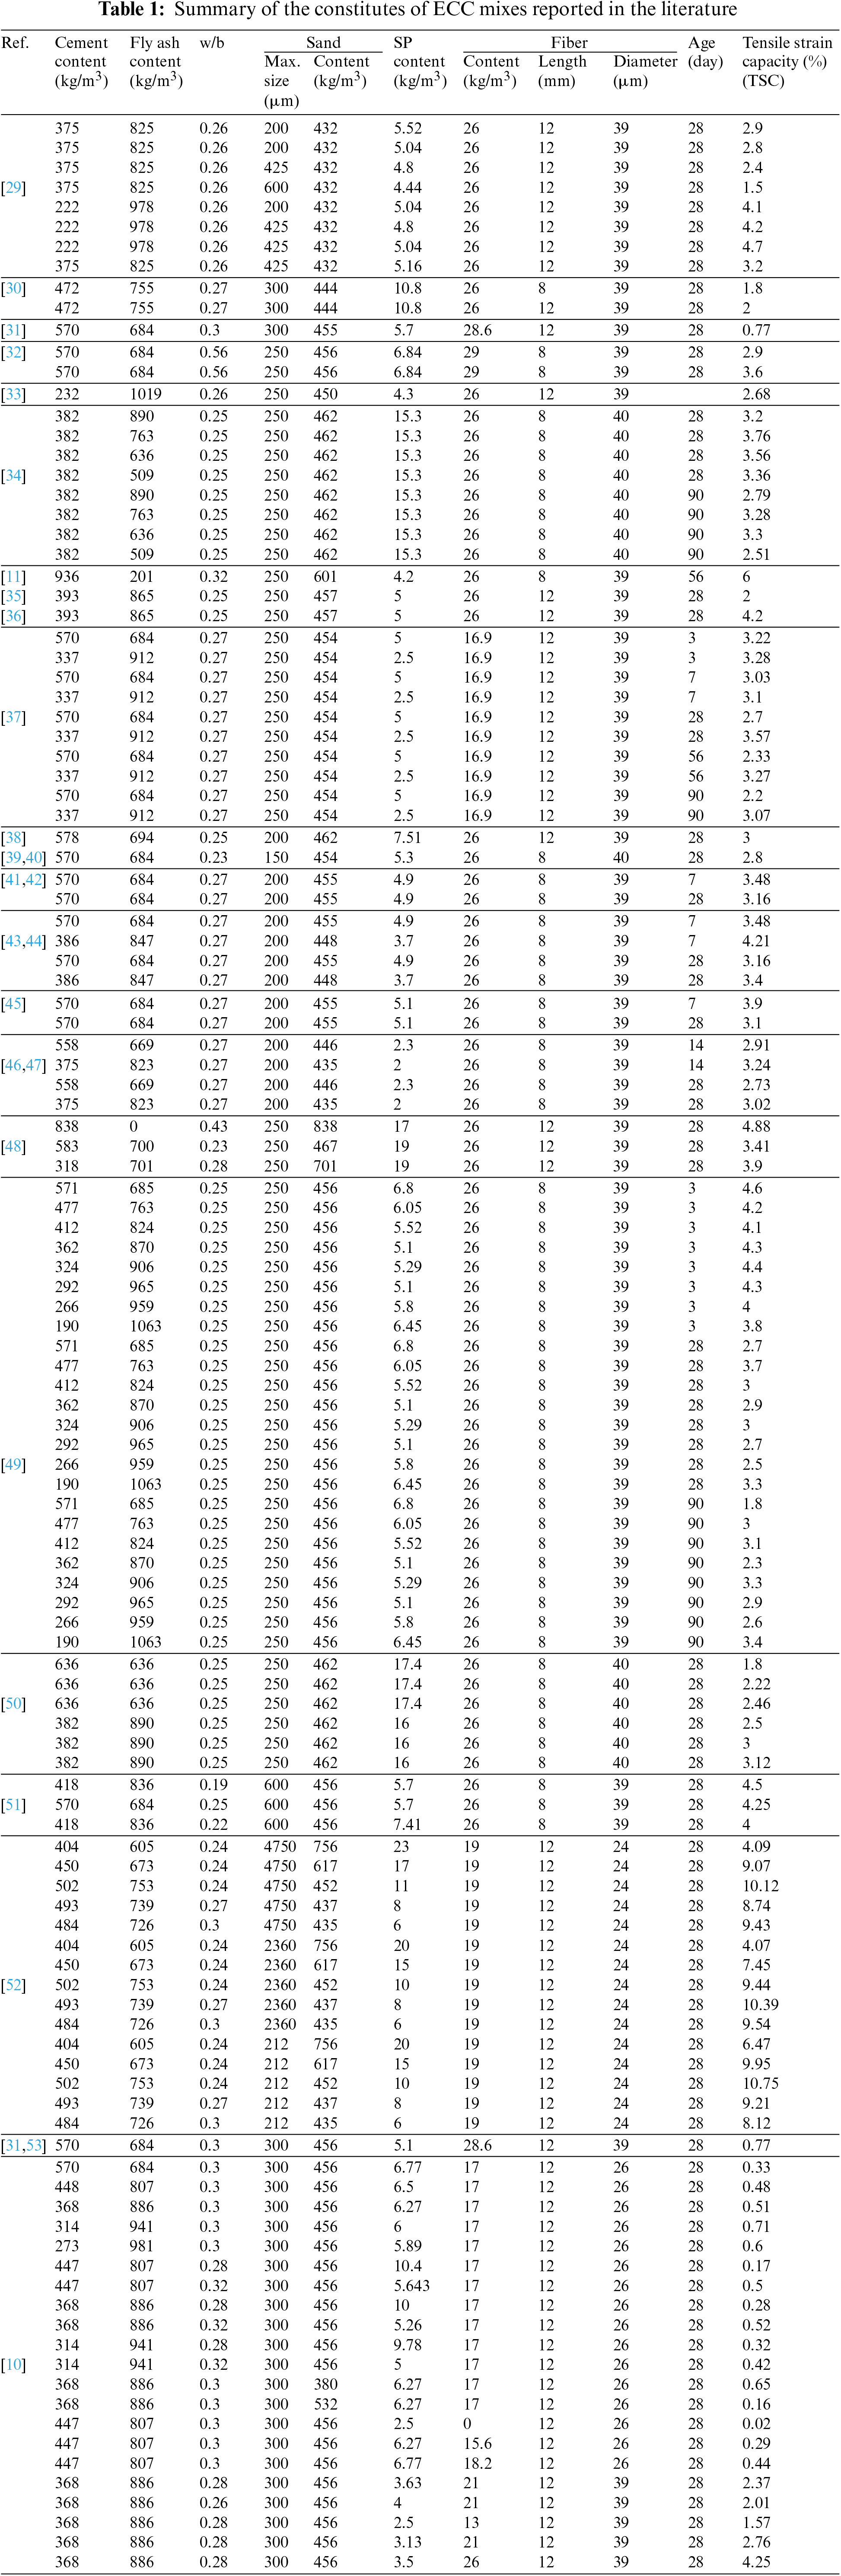
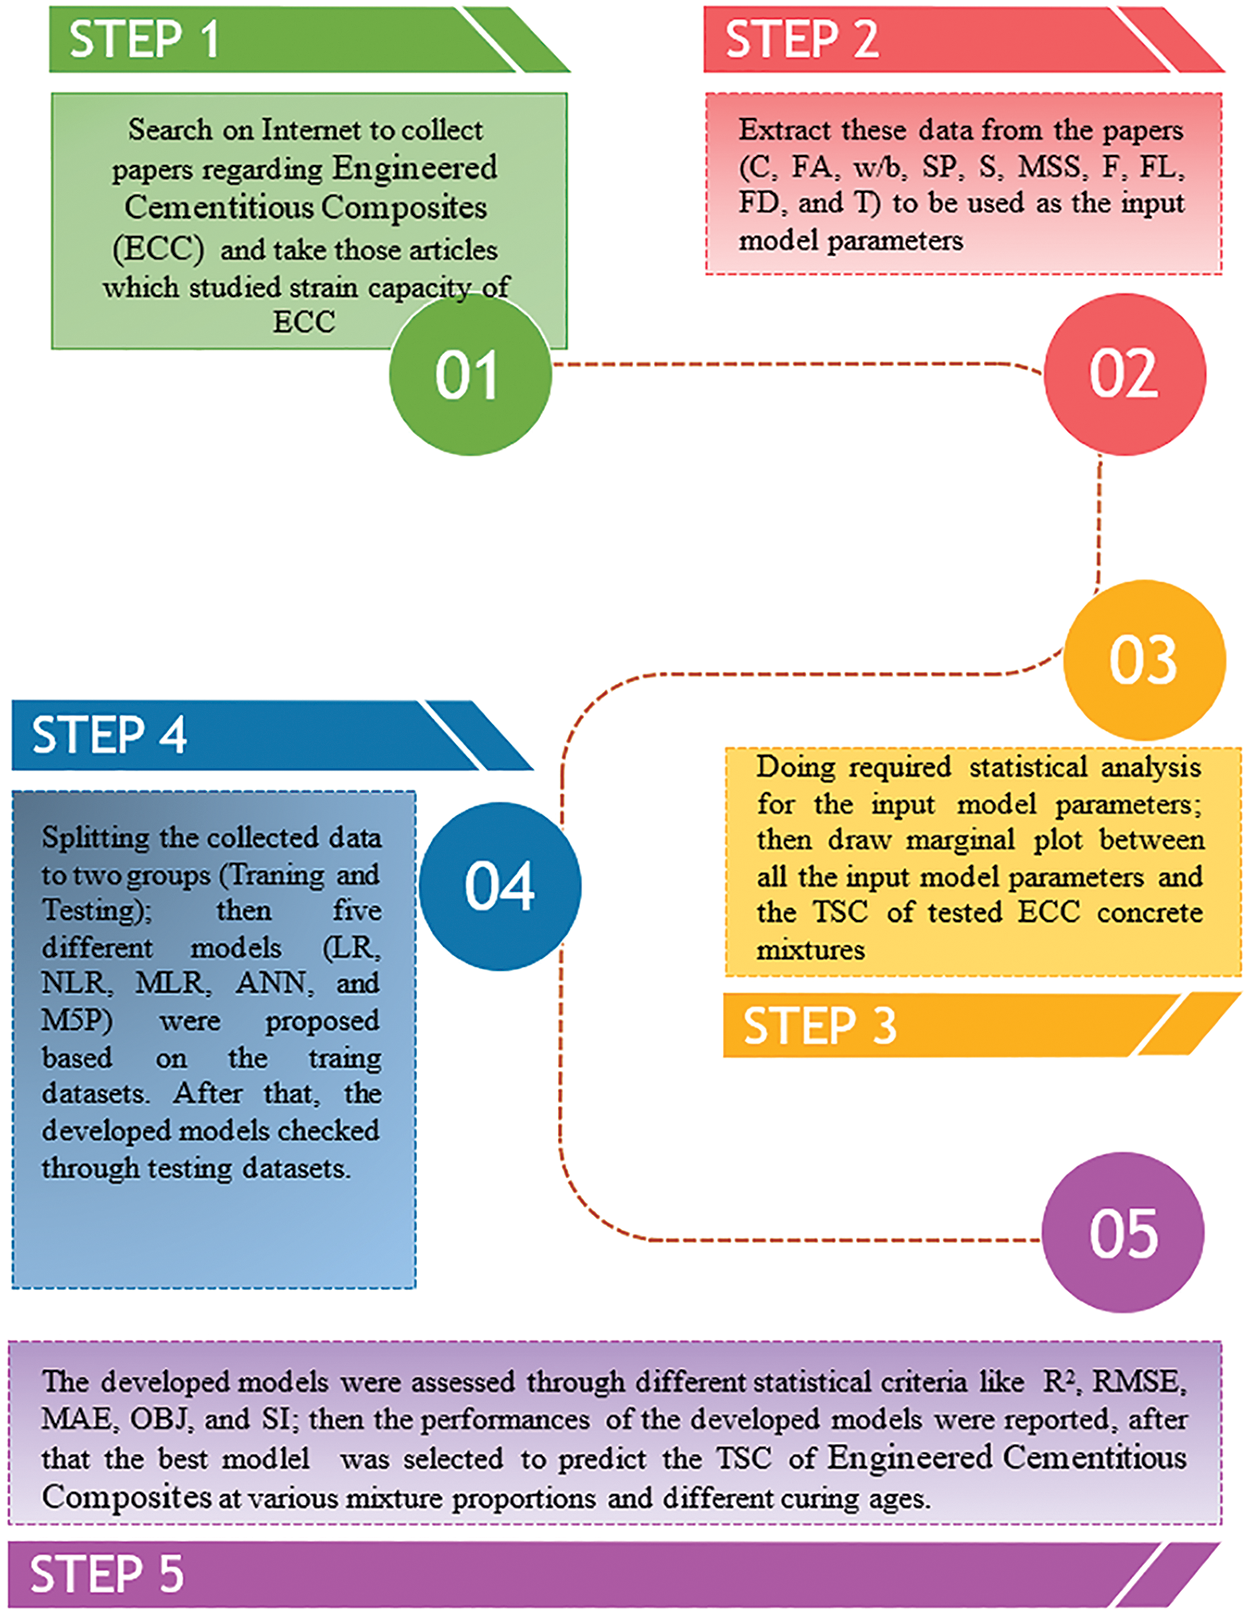
Figure 1: The research methodology in terms of a flow chart diagram
At this stage of the study, the relationships between the dependent and independent variables were investigated to determine the strength of the association between them and with the TSC of ECC. The relationships of cement content, fly ash content, w/b ratio, maximum aggregate size (sand), sand content, SP content, fiber (content, diameter, and length), and curing time were plotted against the empirical direct tensile strain as depicted in Figs. 2a–2j successively. A normal distribution of TSC from previous research was illustrated in Fig. 3. To demonstrate the distribution of each variable and its relationship with the TSC, statistical functions such as standard deviation (SD), skewness, variance, minimum, average, maximum, and kurtosis were calculated and summarized in Table 2. As derived from the literature, the properties and behavior of ECC, especially TSD, are significantly influenced by the length and diameter of the fibers used in their structure. Based on this data, fiber length, diameter, and fiber content were all considered as input variables.
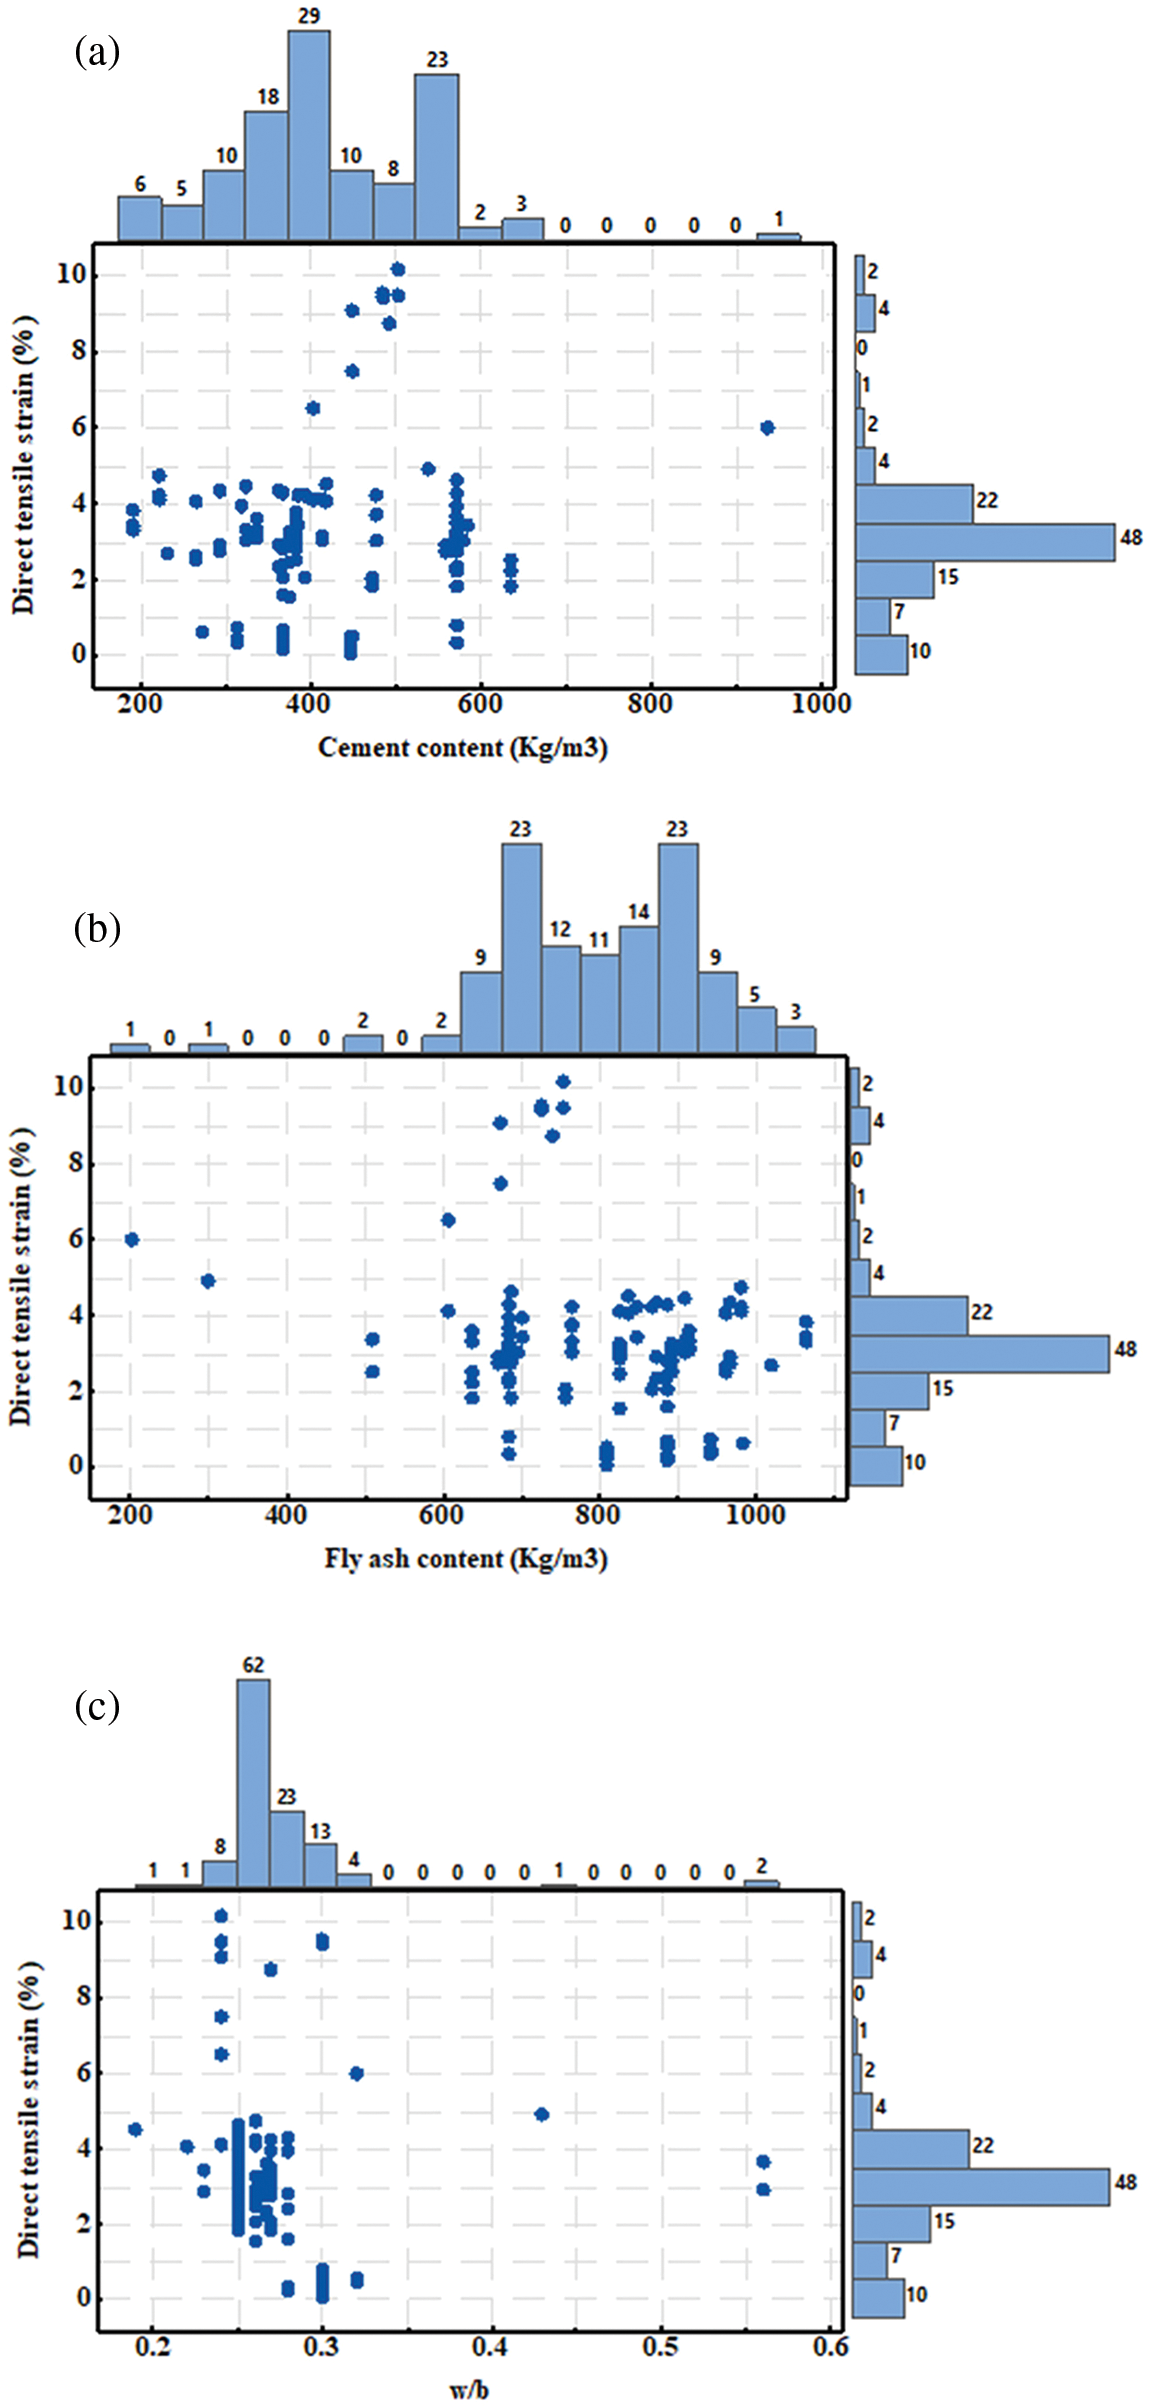

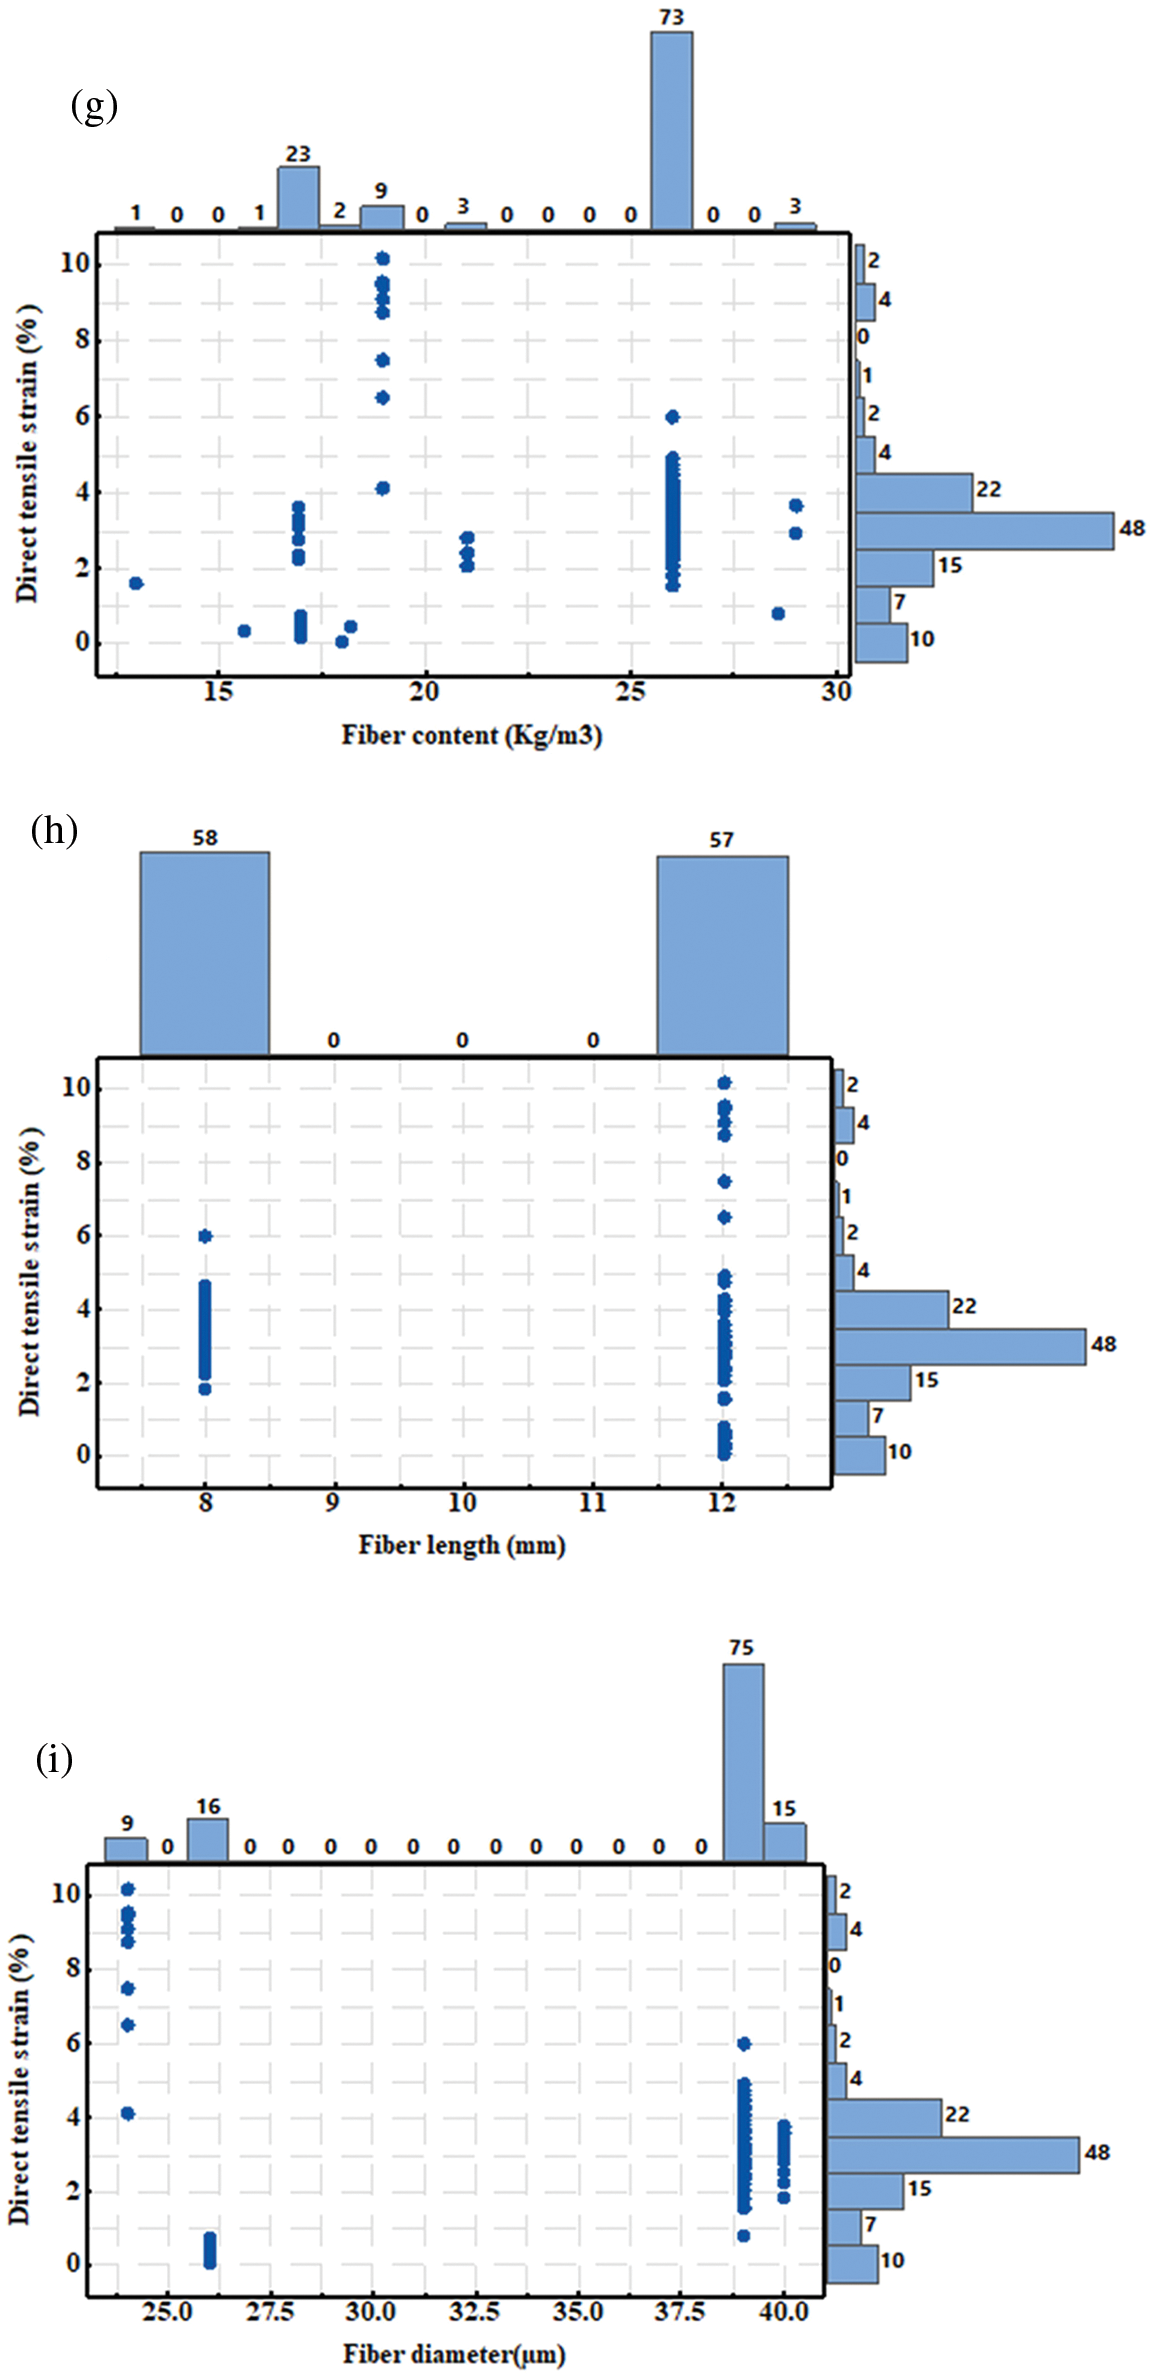
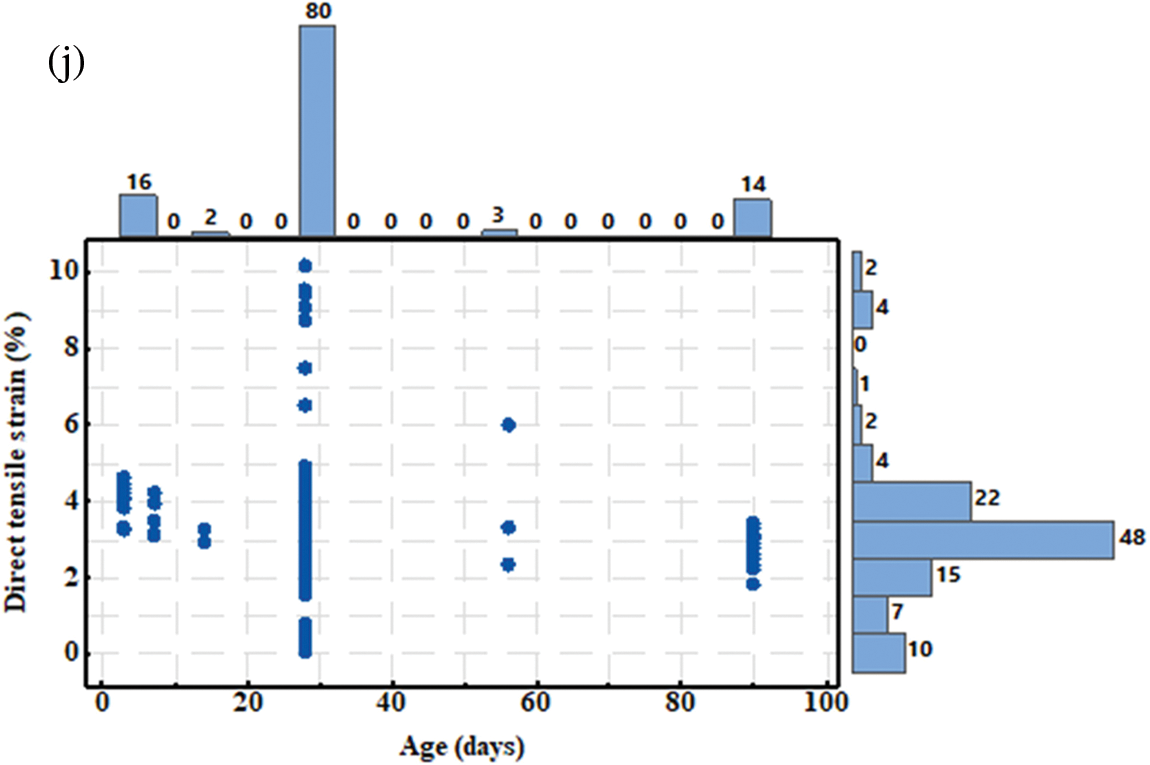
Figure 2: Marginal plot for the TSC of ECC vs. (a) cement content; (b) fly ash content; (c) w/b; (d) sand maximum size; (e) sand content; (f) superplasticizer content; (g) fiber content; (h) fiber length; (i) fiber diameter; (j) specimens ages

Figure 3: The TSC histogram of the gathered datasets at various curing ages
Generally, the fibers used in previous research were of the PVA type with lengths and diameters of 6–12 mm and 12–40 µm, respectively. The contents of these fibers ranged from 4.55 to 39 kg/m3. The type of cement used in most prior studies was OPC, adhering to the specifications of ASTM C 150 with fineness values between 300 and 400 m2/kg and a specific gravity ranging from 3.05 to 3.20. The type of fly ash used as a cement replacement was Class-F, with contents ranging from 201 to 1150 kg/m3. Sand contents were between 380 and 756 kg/m3, with maximum sizes of 100–4750 µm. The superplasticizer employed in the ECC mixture from previous research was polycarboxylate-based, possessing high water-reducing capabilities to minimize water content and enhance workability.
From the literature and the results of the analysis in Section 3, it is clear that a direct relationship between the TSC of ECC and its individual constituents is not available. Therefore, all ingredients could be combined and incorporated into a single model to determine the influence of each parameter on the TSC. Consequently, five distinct soft-computing techniques were proposed, as explained below.
4.1 Linear Relationship Model (LR)
As previously mentioned, this research aims to incorporate as many variables as possible that are strongly related to the TSC of ECC into a model. The linear regression model is a common tool used to evaluate the compressive strength of ECC [54], as represented in Eq. (1).
where
where TSC = Tensile Starin Capacity, C = Cement content (kg/m3), FA = Fly ash content (kg/m3), w/b = Water to Binder ratio, MSS = The maximum size of sand (µm), S = Sand content (kg/m3), SP = Superplasticizer dosage (kg/m3), F = Fiber content (kg/m3), FL = Fiber length (mm), FD = Fiber diameter (µm).
where α1, α2, α3, α4, α5, α6, α7, α8, α9, α10, and α11 are the model parameters. Since the changes in the factors are linear, Eq. (2) can be utilized to replace Eq. (1). Many factors affect the TSC and interact with one another, but this is not necessarily the case. Subsequently, the model should be updated frequently for a better prediction of the compressive strength [54,55].
The relationship between different variables of Eqs. (1) and (2) can be generated as stated in Eq. (3); from this, the TSC of ordinary ECC and ECC incorporated flay ash can be predicted. Eq. (3) can efficiently be used to design NLR [56,57].
Similar to the LR model, the sum of error squares and the least square approach were determined using the Excel solver. The abbreviations in the equation are identical to those for the LR model.
When the expected variables contain a parameter higher than two stages, the use of MLR, a statistical method similar to a multiple linear regression model, can be used [58]. Eq. (4) is utilized to calculate variance among predictable and independent variables.
The disadvantage of this equation is its inadequacy to predict the TSC of ECCs, not including FA. Using this equation, the fly ash or other ingredient contents should be greater than zero.
The Weka software package (version 3.8.5) was used for ML predictions [59]. The ANN is the inverse of the forward neural network [55,60,61]. The model consists of three distinct layers: input, output, and hidden layers. The input layer receives the signal to be investigated, and the output layer presents the results of fundamental tasks such as classification and prediction. In the computational ANN engine, an infinite number of hidden layers exist between the input and output layers. Similarly to a feed-forward network, data transfer occurs from the source to the target layer in the ANN engine. Multiple hidden layers were refined over trial cycles to determine the most appropriate number of hidden layers for error reduction and R2 [62]. To establish an optimal network topology, the derived ANN model was evaluated for various layers using both projected TSC and actual measured TSC of ECCs to achieve the best fit between them.
It was determined that the ANN structure composed of one hidden layer and seven neurons (Fig. 4) was the best-performing network with the highest R2 and lowest MAE and RMSE (as shown in Fig. 5). Eqs. (5)–(7) provide the ANN model’s general equations [63].

Figure 4: ANN model optimal network architecture

Figure 5: Choose the best-hidden layer and neurons for an ANN model based on the model’s R2, MAE, and RMSE performances
From linear node 0:
From sigmoid node 1:
From sigmoid node 2:
The modified version of the Quinlan M5 technique is referred to as the M5P-tree [64,65]. The key advantage of this model is its ability to handle a vast amount of data efficiently across countless attributes and dimensions. The nodes in the M5P tree display both error estimates and information on tree division criteria. The evaluation of any function linked to a specific node is determined by the feature that significantly reduces the anticipated error. The tree-division criteria of the M5P-tree model are derived from the error estimates at the node levels. The M5P-tree error represents the standard deviation of a node’s class value. The division of nodes is guided by the feature that minimizes the projected error after analyzing each attribute. Due to the model’s branching structure, the smaller nodes (sub-trees) possess a lower standard deviation than others. Once all potential structures are evaluated, the parent nodes (larger nodes) reflect the structure with the highest likelihood of error reduction. This partitioning also leads to the formation of a vast tree-like structure, which can promote overfitting.
As shown below, the general equation of the M5P-tree model is similar to the linear regression equation–Eq. (8).
4.6 Assessment Criteria for the Developed Models
With the help of several assessment tools, namely the coefficient of determination (R2), the Scatter Index (SI), the OBJ, the RMSE, and the MAE, the efficiency of the proposed models was evaluated. The following equations are suitable for this evaluation:
where yp = Predicted route pattern, tp = Actual route pattern, T′ = The mean of the actual value, y′ = The mean of the projected value, tst = Tested dataset, n = No. of patterns (collected data) in the link dataset, tr = Trained dataset.
The indications of SI parameter for the performance are as follows [66,67]:
>0.3 = Performance is Poor
0.2–0.3 = Performance is Fair
0.1–0.2 = Performance is Well
<0.1 = Performance is Excelent
The relationship between measured and predicted TSC of ECC for both training and testing samples is depicted in Figs. 6a and 6b. By optimizing the sum of error squares and least square methods, the value of each parameter in the existing model was calculated.

Figure 6: Comparison of the TSC of ECC mixtures that were tested and the TSC that the LR model predicted; (a) training datasets; (b) testing datasets
According to this model, the TSC of ECC-incorporated fly ash was significantly influenced by the w/b ratio and the diameter of the fiber content. The LR model with different weighted parameters is presented in Eq. (14).
From the equation above, it is evident that the w/b ratio greatly influences the TSC. This observation aligns with empirical findings in the literature. The assessment parameters R2, RMSE, and MAE were 0.73, 0.96%, and 0.7%, respectively. Moreover, the OBJ and SI values for the training datasets were 0.94% and 0.308.
Using data from the literature, the relationship between predicted and actual TSC of ECC incorporating fly ash for both training and testing datasets is shown in Figs. 7a and 7b. It was established that the maximum size of sand content, fiber concentration, and fiber diameter are the most influential parameters on the CS of ECC mixtures, as substantiated by an extensive set of experiments noted in Table 1. Adjusting the fiber amount and increasing the maximum sand content size significantly impacted the CS of ECC incorporating fly ash.

Figure 7: Comparison of the TSC of ECC mixtures that were tested and the TSC that the NLR model predicted; (a) training datasets; (b) testing datasets
The following equation is the suggested model for the NLR model with different variable parameters (Eq. (15)):
The R2, RMSE, and MAE measured using this model were 0.68, 1.05%, and 0.83%. The OBJ and SI values of the training dataset were 1.19% and 0.33, respectively.
The comparison of actual and predicted TSC of ECC with fly ash for both training and testing datasets, derived from earlier studies, is illustrated in Figs. 8a and 8b. Based on previous research data presented in Table 1, content is the primary factor affecting the TCS of ECC mixtures with fly ash. The MLR model with varying parameters can be utilized to predict the TSC of ECC containing fly ash.


Figure 8: Comparison of the TSC of ECC mixtures that were tested and the TSC that the MLR model predicted; (a) training datasets; (b) testing datasets
The R2, RMSE, and MAE measured using this model were 0.67, 1.07% and 0.84%. The OBJ and SI values of the training dataset were 1.21% and 3.34, respectively.
Various hidden layers, neurons, momentum, learning rate, and iterations were explored to identify the ANN with the highest efficiency, as depicted in Fig. 5. The investigation determined that the CS of ECC with fly ash is best predicted when the ANN includes one hidden layer, seven neurons per side (Fig. 9), 2000 iterations, a 0.2 learning rate, and 0.1 momentum. The predicted and measured TSC of ECC containing fly ash for training and testing datasets are shown in Figs. 9a and 9b. The training datasets exhibited +10% and −20% error lines, while testing datasets showed +15% and −5% error lines, indicating superior performance compared to other proposed models.
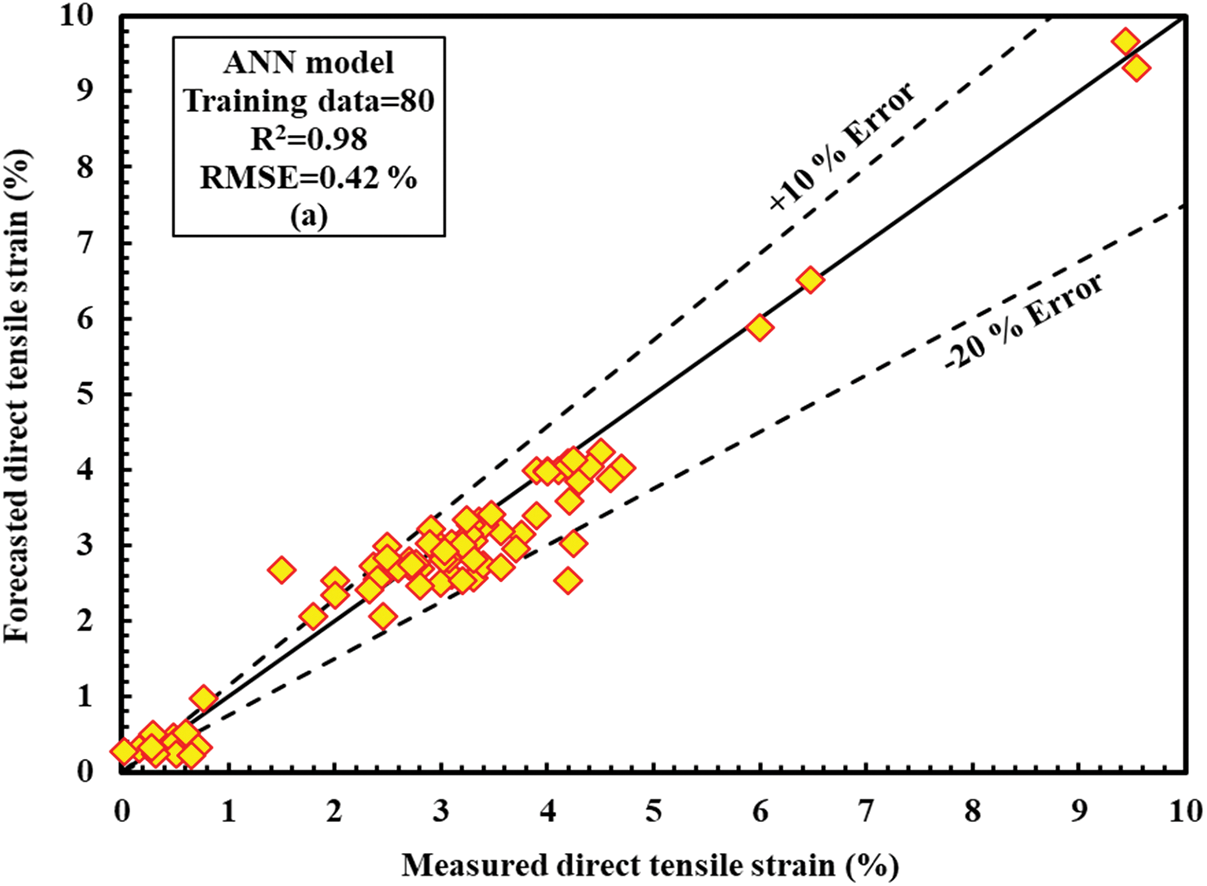

Figure 9: Comparison of the TSC of ECC mixtures that were tested and the TSC that the ANN model predicted; (a) training datasets; (b) testing datasets
The R2, RMSE, and MAE measured using this model were 0.98, 0.42% and 0.30%. The OBJ and SI values of the training dataset were 0.33% and 0.135, respectively.
The actual and predicted TSC of ECC mixtures with fly ash for both training and testing datasets are demonstrated in Figs. 10a and 10b. The TSC of ECC mixtures containing fly ash is notably affected by the w/b ratio, consistent with other investigated models and in line with empirical data in Table 1. Moreover, Eq. (17) represents the model with variables chosen based on the tree regression function.

Figure 10: Comparison of the TSC of ECC mixtures that were tested and the DTS that the M5P model predicted; (a) training datasets; (b) testing datasets
The assessment parameters R2, RMSE, and MAE for this model were 0.85, 0.98%, and 0.73%, respectively, and the OBJ and SI values of the training dataset were 0.78% and 0.314.
The precision of each model in predicting the tensile strain capacity of ECC was assessed using the statistical indices listed in Section 4.5. The ANN model has a higher R2 and lower RMSE and MAE values when compared to the LR, NLR, MLR, and M5P models, as demonstrated in Figs. 11–13 for R2 values, RMSE, and MAE, respectively. Fig. 14 compares model TSC estimations based on testing datasets for ECC mixes, including fly ash. Fig. 15 also displays the residual error for all models using training and testing datasets. In both Figs. 14 and 15, the estimated and predicted results of TSC for the ANN model are closer, demonstrating that the ANN model outperforms other models.

Figure 11: R2 results for training and testing datasets for various proposed models

Figure 12: RMSE results for training and testing datasets for various proposed models
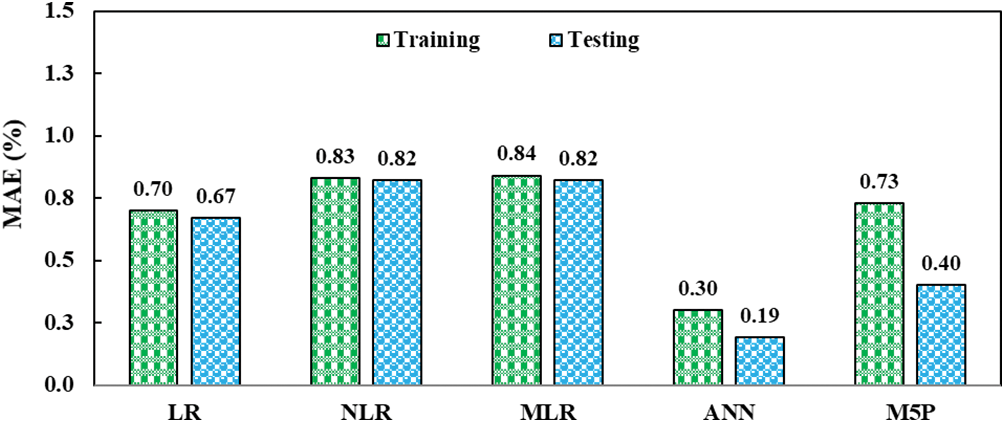
Figure 13: MAE results for training and testing datasets for various proposed models

Figure 14: Comparison of model predictions of the TSC of ECC mixtures with data from the test datasets

Figure 15: TSC of ECC mixes residual error diagram utilizing entire datasets for all models
The OBJ values for all developed models are shown in Fig. 16. The LR, NLR, MLR, M5P, and ANN models have 0.94%, 1.19%, 1.21%, 0.78%, and 0.33%, respectively. The ANN model had an OBJ value 226% less than that of the NLR and MLR models; it is also 184% less than the LR model and 136% lower than the M5P model. This indicates that the ANN approach is more robust in forecasting the TSC of ECC mixes, including FA.

Figure 16: All of the models’ OBJ values
The SI values for the given models are presented in Fig. 17 throughout the training and testing processes. Fig. 17 suggests that, except for the ANN model, the SI values for all phases were higher than 0.3, indicating poor performance. The SI training dataset values for the ANN model, however, were between 0.1 and 0.2, indicating that the ANN model performed well. Moreover, consistent with other performance measures, the ANN model has lower SI values than other methods. In the training phase, the ANN model has a 128% lower SI value than the LR model and a 226% lower SI value in the testing phase. Additionally, compared to the NLR and MLR models, the ANN model had lower SI values in all stages, such as 152% lower in training and 344% lower in the testing stage. This further illustrates that the ANN model is more proficient and precise in predicting the TSC of ECC mixes, including FA, than the LR, NLR, M5P, and MLR models.
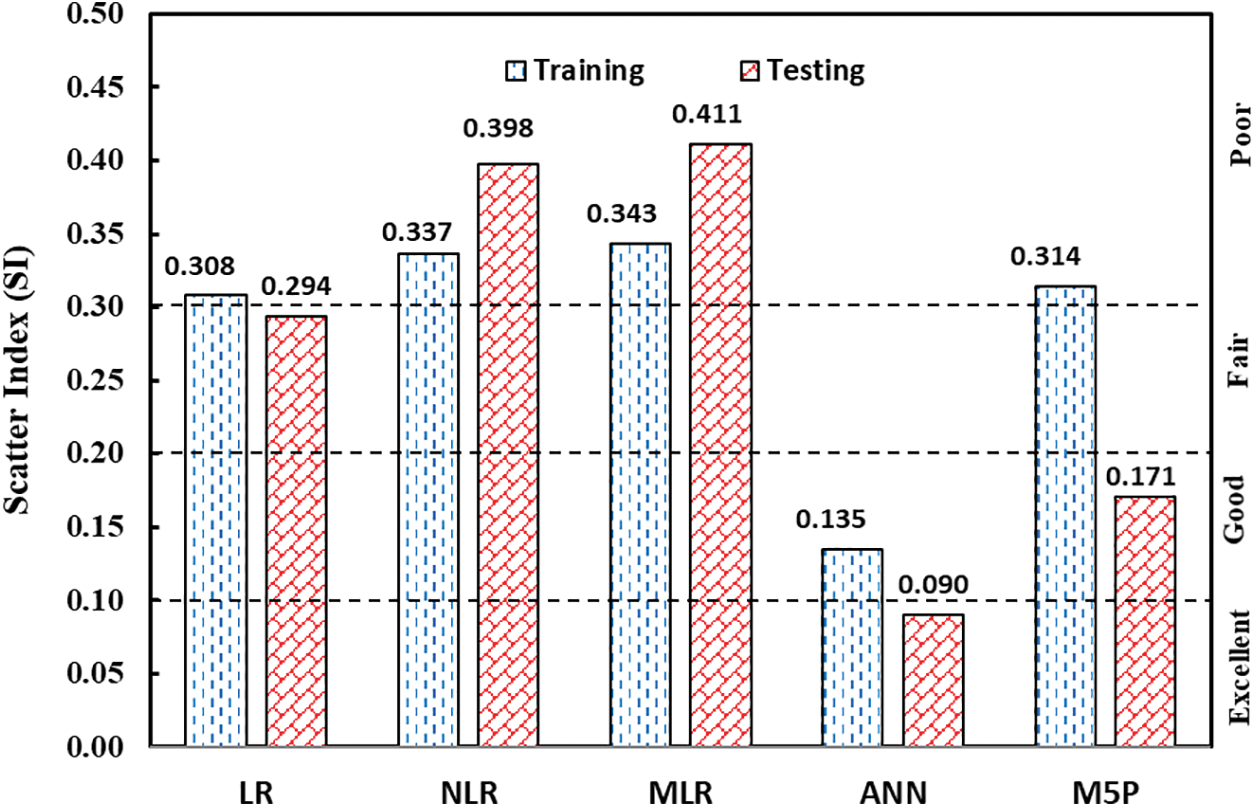
Figure 17: SI performance parameter results of several created models
Models for tensile strain capacity prediction that are precise and accurate can save time and money. The following conclusions were drawn based on a study and simulation of data from prior research to predict the TSC of ECC for 115 different mixed compositions:
1. In the production of ECC mixes, the range of some ingredients falls within a narrow range of available input space. This phenomenon is attributed to the special mix proportion of this concrete type. Therefore, the application of the proposed models should be verified for mix proportions outside the ranges provided in this study.
2. The mixture proportion and quality of materials are crucial in producing ECC because the TSC is highly sensitive to the amount and quality of materials.
3. Among various models developed to predict the TSC of ECC mixtures, the ANN model outperformed other models in all phases based on different assessment criteria, with higher R2 values, lower OBJ values, lower RMSE, lower SI, and lower MAE values.
4. Except for the ANN model, the SI values for all models and stages exceeded 0.3, suggesting suboptimal performance.
5. The SI value for the ANN model in the training phase ranged between 0.1 and 0.2, indicating good performance; for the testing phase, the value ranged from 0 to 0.1, suggesting that the ANN model performed exceptionally well.
6. The OBJ value of the ANN model is 226% lower than those of the NLR and MLR models; it is also 184% lower than that of the LR model and 135% lower than the M5P model. This demonstrates that the ANN model is more accurate and adept at forecasting the TSC of ECC mixes, including F.
7. The overall findings and analysis revealed that specific quantities of FA can be effectively utilized in ECC production to produce sustainable, environmentally friendly, and structurally sound ECCs. Furthermore, the models developed in this study, especially the ANN model, can efficiently estimate the mix proportions and TSC of ECCs, thereby reducing the number of experimental tests and trial batches in the laboratory.
Acknowledgement: None.
Funding Statement: The authors received no specific funding for this study.
Author Contributions: The authors confirm their contribution to the paper as follows: study conception and design: Rabar H. Faraj, Hemn Unis Ahmed, and Hardi Saadullah Fathullah; data collection: Rabar H. Faraj, Hemn Unis Ahmed, and Alan Saeed; analysis and interpretation of results: Rabar H. Faraj and Hemn Unis Ahmed; draft manuscript preparation: Hardi Saadullah Fathullah, Alan Saeed Abdulrahman and Farid Abed. All authors reviewed the results and approved the final version of the manuscript.
Availability of Data and Materials: All the data are available in the paper.
Conflicts of Interest: The authors declare that they have no conflicts of interest to report regarding the present study.
References
1. Li, V. C. (1992). Performance driven design of fiber reinforced cementitious composites. Proceedings of 4th RILEM International Symposium on Fiber Reinforced Concrete, University of Sheffield. [Google Scholar]
2. Li, V. C. (1992). Postcrack scaling relations for fiber reinforced cementitious composites. Journal of Materials in Civil Engineering, 4(1), 41–57. https://doi.org/10.1061/10.1061/(ASCE)0733-9399(1992)118:11(2246) [Google Scholar] [CrossRef]
3. Li, V. C., Leung, C. K. (1992). Steady-state and multiple cracking of short random fiber composites. Journal of Engineering Mechanics, 118(11), 2246–2264. https://doi.org/10.1061/(ASCE)0733-9399(1992)118:11(2246) [Google Scholar] [CrossRef]
4. Li, V. C., Wu, H. C. (1992). Conditions for pseudo strain-hardening in fiber reinforced brittle matrix composites. Applied Mechanics Reviews, 45(8), 390–398. [Google Scholar]
5. Li, V. C., Wang, S., Wu, C. (2001). Tensile strain-hardening behavior of polyvinyl alcohol engineered cementitious composite (PVA-ECC). Materials Journal, 98(6), 483–492. [Google Scholar]
6. Lim, Y. M., Li, V. C. (1997). Durable repair of aged infrastructures using trapping mechanism of engineered cementitious composites. Cement and Concrete Composites, 19(4), 373–385. https://doi.org/10.1016/S0958-9465(97)00026-7 [Google Scholar] [CrossRef]
7. Şahmaran, M., Al-Emam, M., Yıldırım, G., Şimşek, Y. E., Erdem, T. K. et al. (2015). High-early-strength ductile cementitious composites with characteristics of low early-age shrinkage for repair of infrastructures. Materials and Structures, 48(5), 1389–1403. https://doi.org/10.1617/s11527-013-0241-z [Google Scholar] [CrossRef]
8. Maalej, M., Quek, S. T., Ahmed, S. F. U., Zhang, J., Lin, V. W. J. et al. (2012). Review of potential structural applications of hybrid fiber engineered cementitious composites. Construction and Building Materials, 36, 216–227. https://doi.org/10.1016/j.conbuildmat.2012.04.010 [Google Scholar] [CrossRef]
9. Qudah, S., Maalej, M. (2014). Application of engineered cementitious composites (ECC) in interior beam-column connections for enhanced seismic resistance. Engineering Structures, 69, 235–245. https://doi.org/10.1016/j.engstruct.2014.03.026 [Google Scholar] [CrossRef]
10. Pan, Z., Wu, C., Liu, J., Wang, W., Liu, J. (2015). Study on mechanical properties of cost-effective polyvinyl alcohol engineered cementitious composites (PVA-ECC). Construction and Building Materials, 78, 397–404. https://doi.org/10.1016/j.conbuildmat.2014.12.071 [Google Scholar] [CrossRef]
11. Li, L. Z., Bai, Y., Yu, K. Q., Yu, J. T., Lu, Z. D. (2019). Reinforced high-strength engineered cementitious composite (ECC) columns under eccentric compression: Experiment and theoretical model. Engineering Structures, 198, 109541. https://doi.org/10.1016/j.engstruct.2019.109541 [Google Scholar] [CrossRef]
12. Yang, E. H., Li, V. C. (2010). Strain-hardening fiber cement optimization and component tailoring by means of a micromechanical model. Construction and Building Materials, 24(2), 130–139. https://doi.org/10.1016/j.conbuildmat.2007.05.014 [Google Scholar] [CrossRef]
13. Madhavi, K. B., Venugopal, M., Rajesh, V., Suresh, K. (2016). Experimental study on bendable concrete. International Journal of Engineering Research & Technology, 5(10), 501–550. [Google Scholar]
14. Neville, A. M., Brooks, J. J. (1987). Concrete technology, pp. 242–246. England: Longmann Scientific & Technical. [Google Scholar]
15. Neville, A. M. (1995). Properties of concrete. London: Longman. [Google Scholar]
16. Gupta, S., Sihag, P. (2022). Prediction of the compressive strength of concrete using various predictive modeling techniques. Neural Computing and Applications, 1–11. https://doi.org/10.1007/s00521-021-06820-y [Google Scholar] [CrossRef]
17. Shariati, M., Mafipour, M. S., Ghahremani, B., Azarhomayun, F., Ahmadi, M. et al. (2020). A novel hybrid extreme learning machine-grey wolf optimizer (ELM-GWO) model to predict compressive strength of concrete with partial replacements for cement. Engineering with Computers, 1–23. https://doi.org/10.1007/s00366-020-01081-0 [Google Scholar] [CrossRef]
18. Skentou, A. D., Bardhan, A., Mamou, A., Lemonis, M. E., Kumar, G. et al. (2022). Closed-form equation for estimating unconfined compressive strength of granite from three non-destructive tests using soft computing models. Rock Mechanics and Rock Engineering, 56, 487–514. https://doi.org/10.1007/s00603-022-03046-9 [Google Scholar] [CrossRef]
19. Emad, W., Mohammed, A. S., Kurda, R., Ghafor, K., Cavaleri, L. et al. (2022). Prediction of concrete materials compressive strength using surrogate models. Structures, 46, 1243–1267. Elsevier. https://doi.org/10.1016/j.istruc.2022.11.002 [Google Scholar] [CrossRef]
20. Aggarwal, S., Bhargava, G., Sihag, P. (2021). Prediction of compressive strength of SCC-containing metakaolin and rice husk ash using machine learning algorithms. In: Computational technologies in materials science, pp. 193–205. Tyler and Francis: CRC Press. [Google Scholar]
21. Gao, W., Karbasi, M., Derakhsh, A. M., Jalili, A. (2019). Development of a novel soft-computing framework for the simulation aims: A case study. Engineering with Computers, 35(1), 315–322. https://doi.org/10.1007/s00366-018-0601-y [Google Scholar] [CrossRef]
22. Almohammed, F., Sihag, P., Sammen, S. S., Ostrowski, K. A., Singh, K. et al. (2022). Assessment of soft computing techniques for the prediction of compressive strength of bacterial concrete. Materials, 15(2), 489. https://doi.org/10.3390/ma15020489 [Google Scholar] [PubMed] [CrossRef]
23. Cavaleri, L., Barkhordari, M. S., Repapis, C. C., Armaghani, D. J., Ulrikh, D. V. et al. (2022). Convolution-based ensemble learning algorithms to estimate the bond strength of the corroded reinforced concrete. Construction and Building Materials, 359, 129504. https://doi.org/10.1016/j.conbuildmat.2022.129504 [Google Scholar] [CrossRef]
24. Behnood, A., Daneshvar, D. (2020). A machine learning study of the dynamic modulus of asphalt concretes: An application of M5P model tree algorithm. Construction and Building Materials, 262, 120544. https://doi.org/10.1016/j.conbuildmat.2020.120544 [Google Scholar] [CrossRef]
25. Ahmed, H. U., Mohammed, A. S., Mohammed, A. A., Faraj, R. H. (2021). Systematic multiscale models to predict the compressive strength of fly ash-based geopolymer concrete at various mixture proportions and curing regimes. PLoS One, 16(6), e0253006. https://doi.org/10.1371/journal.pone.0253006 [Google Scholar] [PubMed] [CrossRef]
26. Uddin, M. N., Li, L. Z., Ahmed, A., Almajhali, K. Y. M. (2022). Prediction of PVA fiber effect in engineered composite cement (ECC) by artificial neural network (ANN). Materials Today: Proceedings, 65, 537–542. https://doi.org/10.1016/j.matpr.2022.03.088 [Google Scholar] [CrossRef]
27. Alaloul, W. S., Musarat, M. A., Haruna, S., Tayeh, B. A., Norizan, M. N. B. (2022). Chemical attack on concrete containing a high volume of crumb rubber as a partial replacement for fine aggregate in engineered cementitious composite (ECC). Canadian Journal of Civil Engineering, 49(1), 11–17. https://doi.org/10.1139/cjce-2020-0343 [Google Scholar] [CrossRef]
28. Qadir, W., Ghafor, K., Mohammed, A. (2019). Characterizing and modeling the mechanical properties of the cement mortar modified with fly ash for various water-to-cement ratios and curing times. Advances in Civil Engineering, 2019, 7013908. https://doi.org/10.1155/2019/7013908 [Google Scholar] [CrossRef]
29. Huang, X., Ranade, R., Ni, W., Li, V. C. (2013). Development of green engineered cementitious composites using iron ore tailings as aggregates. Construction and Building Materials, 44, 757–764. https://doi.org/10.1016/j.conbuildmat.2013.03.088 [Google Scholar] [CrossRef]
30. Huang, X., Ranade, R., Ni, W., Li, V. C. (2013). On the use of recycled tire rubber to develop low E-modulus ECC for durable concrete repairs. Construction and Building Materials, 46, 134–141. https://doi.org/10.1016/j.conbuildmat.2013.04.027 [Google Scholar] [CrossRef]
31. Meng, D., Lee, C. K., Zhang, Y. X. (2017). Flexural and shear behaviours of plain and reinforced polyvinyl alcohol-engineered cementitious composite beams. Engineering Structures, 151, 261–272. https://doi.org/10.1016/j.engstruct.2017.08.036 [Google Scholar] [CrossRef]
32. Soe, K. T., Zhang, Y. X., Zhang, L. C. (2013). Material properties of a new hybrid fibre-reinforced engineered cementitious composite. Construction and Building Materials, 43, 399–407. https://doi.org/10.1016/j.conbuildmat.2013.02.021 [Google Scholar] [CrossRef]
33. Yu, J., Lin, J., Zhang, Z., Li, V. C. (2015). Mechanical performance of ECC with high-volume fly ash after sub-elevated temperatures. Construction and Building Materials, 99, 82–89. https://doi.org/10.1016/j.conbuildmat.2015.09.002 [Google Scholar] [CrossRef]
34. Zhu, W., Bartos, P. J., Porro, A. (2004). Application of nanotechnology in construction. Materials and Structures, 37(9), 649–658. https://doi.org/10.1007/BF02483294 [Google Scholar] [CrossRef]
35. Liu, H., Zhang, Q., Gu, C., Su, H., Li, V. C. (2016). Influence of micro-cracking on the permeability of engineered cementitious composites. Cement and Concrete Composites, 72, 104–113. https://doi.org/10.1016/j.cemconcomp.2016.05.016 [Google Scholar] [CrossRef]
36. Liu, H., Zhang, Q., Li, V., Su, H., Gu, C. (2017). Durability study on engineered cementitious composites (ECC) under sulfate and chloride environment. Construction and Building Materials, 133, 171–181. https://doi.org/10.1016/j.conbuildmat.2016.12.074 [Google Scholar] [CrossRef]
37. Kan, L. L., Shi, R. X., Zhu, J. (2019). Effect of fineness and calcium content of fly ash on the mechanical properties of engineered cementitious composites (ECC). Construction and Building Materials, 209, 476–484. https://doi.org/10.1016/j.conbuildmat.2019.03.129 [Google Scholar] [CrossRef]
38. Lepech, M. D., Li, V. C. (2009). Water permeability of engineered cementitious composites. Cement and Concrete Composites, 31(10), 744–753. https://doi.org/10.1016/j.cemconcomp.2009.07.002 [Google Scholar] [CrossRef]
39. Qian, S. Z., Zhou, J., Schlangen, E. (2010). Influence of curing condition and precracking time on the self-healing behavior of engineered cementitious composites. Cement and Concrete Composites, 32(9), 686–693. https://doi.org/10.1016/j.cemconcomp.2010.07.015 [Google Scholar] [CrossRef]
40. Qian, S., Zhou, J., de Rooij, M. R., Schlangen, E., Ye, G. et al. (2009). Self-healing behavior of strain hardening cementitious composites incorporating local waste materials. Cement and Concrete Composites, 31(9), 613–621. https://doi.org/10.1016/j.cemconcomp.2009.03.003 [Google Scholar] [CrossRef]
41. Şahmaran, M., Li, V. C. (2008). Durability of mechanically loaded engineered cementitious composites under highly alkaline environments. Cement and Concrete Composites, 30(2), 72–81. https://doi.org/10.1016/j.cemconcomp.2007.09.004 [Google Scholar] [CrossRef]
42. Şahmaran, M., Li, V. C. (2009). Influence of microcracking on water absorption and sorptivity of ECC. Materials and Structures, 42(5), 593–603. https://doi.org/10.1617/s11527-008-9406-6 [Google Scholar] [CrossRef]
43. Şahmaran, M., Li, V. C. (2007). De-icing salt scaling resistance of mechanically loaded engineered cementitious composites. Cement and Concrete Research, 37(7), 1035–1046. https://doi.org/10.1016/j.cemconres.2007.04.001 [Google Scholar] [CrossRef]
44. Şahmaran, M., Li, V. C. (2009). Durability properties of micro-cracked ECC containing high volumes fly ash. Cement and Concrete Research, 39(11), 1033–1043. https://doi.org/10.1016/j.cemconres.2009.07.009 [Google Scholar] [CrossRef]
45. Sahmaran, M., Li, M., Li, V. C. (2007). Transport properties of engineered cementitious composites under chloride exposure. ACI Materials Journal, 104(6), 604–611. [Google Scholar]
46. Şahmaran, M., Lachemi, M., Hossain, K. M., Li, V. C. (2009). Internal curing of engineered cementitious composites for prevention of early age autogenous shrinkage cracking. Cement and Concrete Research, 39(10), 893–901. https://doi.org/10.1016/j.cemconres.2009.07.006 [Google Scholar] [CrossRef]
47. Sahmaran, M., Yücel, H. E., Demirhan, S., Artfytfk, M. T., Li, V. C. (2012). Combined effect of aggregate and mineral admixtures on tensile ductility of engineered cementitious composites. ACI Materials Journal, 109(6), 627–637. [Google Scholar]
48. Şahmaran, M., Özbay, E., Yücel, H. E., Lachemi, M., Li, V. C. (2012). Frost resistance and microstructure of engineered cementitious composites: Influence of fly ash and micro poly-vinyl-alcohol fiber. Cement and Concrete Composites, 34(2), 156–165. https://doi.org/10.1016/j.cemconcomp.2011.10.002 [Google Scholar] [CrossRef]
49. Yang, E. H., Yang, Y., Li, V. C. (2007). Use of high volumes of fly ash to improve ECC mechanical properties and material greenness. ACI Materials Journal, 104(6), 620–628. [Google Scholar]
50. Yao, Y., Zhu, Y., Yang, Y. (2012). Incorporation superabsorbent polymer (SAP) particles as controlling pre-existing flaws to improve the performance of engineered cementitious composites (ECC). Construction and Building Materials, 28(1), 139–145. https://doi.org/10.1016/j.conbuildmat.2011.08.032 [Google Scholar] [CrossRef]
51. Gencturk, B., Hosseini, F. (2015). Evaluation of reinforced concrete and reinforced engineered cementitious composite (ECC) members and structures using small-scale testing. Canadian Journal of Civil Engineering, 42(3), 164–177. https://doi.org/10.1139/cjce-2013-0445 [Google Scholar] [CrossRef]
52. Guan, X., Li, Y., Liu, T., Zhang, C., Li, H. et al. (2019). An economical ultra-high ductile engineered cementitious composite with large amount of coarse river sand. Construction and Building Materials, 201, 461–472. https://doi.org/10.1016/j.conbuildmat.2018.12.207 [Google Scholar] [CrossRef]
53. Meng, D., Huang, T., Zhang, Y. X., Lee, C. K. (2017). Mechanical behaviour of a polyvinyl alcohol fibre reinforced engineered cementitious composite (PVA-ECC) using local ingredients. Construction and Building Materials, 141, 259–270. https://doi.org/10.1016/j.conbuildmat.2017.02.158 [Google Scholar] [CrossRef]
54. Zain, M. F. M., Abd, S. M. (2009). Multiple regression model for compressive strength prediction of high: Performance concrete. Journal of Applied Sciences, 9, 155–160. https://doi.org/10.3923/jas.2009.155.160 [Google Scholar] [CrossRef]
55. Demircan, E., Harendra, S., Vipulanandan, C. (2011). Artificial neural network and nonlinear models for gelling time and maximum curing temperature rise in polymer grouts. Journal of Materials in Civil Engineering, 23(4), 372–377. https://doi.org/10.1061/(ASCE)MT.1943-5533.0000172 [Google Scholar] [CrossRef]
56. Sarwar, W., Ghafor, K., Mohammed, A. (2019). Modeling the rheological properties with shear stress limit and compressive strength of ordinary Portland cement modified with polymers. Journal of Building Pathology and Rehabilitation, 4(1), 25. https://doi.org/10.1007/s41024-019-0064-6 [Google Scholar] [CrossRef]
57. Ahmed, H. U., Mohammed, A. S., Faraj, R. H., Qaidi, S. M., Mohammed, A. A. (2022). Compressive strength of geopolymer concrete modified with nano-silica: Experimental and modeling investigations. Case Studies in Construction Materials, 16, e01036. https://doi.org/10.1016/j.cscm.2022.e01036 [Google Scholar] [CrossRef]
58. Faraj, R. H., Ahmed, H. U., Rafiq, S., Sor, N. H., Ibrahim, D. F. et al. (2022). Performance of self-compacting mortars modified with nanoparticles: A systematic review and modeling. Cleaner Materials, 100086. https://doi.org/10.1016/j.clema.2022.100086 [Google Scholar] [CrossRef]
59. Hall, M., Frank, E., Holmes, G., Pfahringer, B., Reutemann, P. et al. (2009). The WEKA data mining software: An update. ACM SIGKDD Explorations Newsletter, 11(1), 10–18. [Google Scholar]
60. Sihag, P., Jain, P., Kumar, M. (2018). Modelling of impact of water quality on recharging rate of storm water filter system using various kernel function based regression. Modeling Earth Systems and Environment, 4(1), 61–68. https://doi.org/10.1007/s40808-017-0410-0 [Google Scholar] [CrossRef]
61. Faraj, R. H., Mohammed, A. A., Omer, K. M., Ahmed, H. U. (2022). Soft computing techniques to predict the compressive strength of green self-compacting concrete incorporating recycled plastic aggregates and industrial waste ashes. Clean Technologies and Environmental Policy. https://doi.org/10.1007/s10098-022-02318-w [Google Scholar] [PubMed] [CrossRef]
62. Faraj, R. H., Mohammed, A. A., Mohammed, A., Omer, K. M., Ahmed, H. U. (2021). Systematic multiscale models to predict the compressive strength of self-compacting concretes modified with nanosilica at different curing ages. Engineering with Computers, 1–24. https://doi.org/10.1007/s00366-021-01385-9 [Google Scholar] [CrossRef]
63. Ahmed, H. U., Abdalla, A. A., Mohammed, A. S., Mohammed, A. A., Mosavi, A. (2022). Statistical methods for modeling the compressive strength of geopolymer mortar. Materials, 15, 1868. https://doi.org/10.3390/ma15051868 [Google Scholar] [PubMed] [CrossRef]
64. Quinlan, J. R. (1992). Learning with continuous classes. 5th Australian Joint Conference on Artificial Intelligence, vol. 92, pp. 343–348. Perth, WA, Australia. [Google Scholar]
65. Malerba, D., Esposito, F., Ceci, M., Appice, A. (2004). Top-down induction of model trees with regression and splitting nodes. IEEE Transactions on Pattern Analysis and Machine Intelligence, 26(5), 612–625. https://doi.org/10.1109/TPAMI.2004.1273937 [Google Scholar] [PubMed] [CrossRef]
66. Li, M. F., Tang, X. P., Wu, W., Liu, H. B. (2013). General models for estimating daily global solar radiation for different solar radiation zones in mainland China. Energy Conversion and Management, 70, 139–148. https://doi.org/10.1016/j.enconman.2013.03.004 [Google Scholar] [CrossRef]
67. Golafshani, E. M., Behnood, A., Arashpour, M. (2020). Predicting the compressive strength of normal and High-Performance Concretes using ANN and ANFIS hybridized with Grey Wolf Optimizer. Construction and Building Materials, 232, 117266. https://doi.org/10.1016/j.conbuildmat.2019.117266 [Google Scholar] [CrossRef]
Cite This Article
 Copyright © 2024 The Author(s). Published by Tech Science Press.
This work is licensed under a Creative Commons Attribution 4.0 International License , which permits unrestricted use, distribution, and reproduction in any medium, provided the original work is properly cited.
 Downloads
 Citation Tools