
 Submit a Paper
 Propose a Special lssue
 Open Access
ARTICLE

Numerical Simulation of Surrounding Rock Deformation and Grouting Reinforcement of Cross-Fault Tunnel under Different Excavation Methods
1 Key Laboratory of Ministry of Education for Geomechanics and Embankment Engineering, Hohai University, Nanjing, 210098, China
2 Jiangsu Research Center for Geotechnical Engineering Technology, Hohai University, Nanjing, 210098, China
* Corresponding Author: Cong Zhang. Email:
Computer Modeling in Engineering & Sciences 2024, 138(3), 2445-2470. https://doi.org/10.32604/cmes.2023.030847
Received 27 April 2023; Accepted 07 September 2023; Issue published 15 December 2023
 View Full Text
 Download PDF
Abstract
Tunnel construction is susceptible to accidents such as loosening, deformation, collapse, and water inrush, especially under complex geological conditions like dense fault areas. These accidents can cause instability and damage to the tunnel. As a result, it is essential to conduct research on tunnel construction and grouting reinforcement technology in fault fracture zones to address these issues and ensure the safety of tunnel excavation projects. This study utilized the Xianglushan cross-fault tunnel to conduct a comprehensive analysis on the construction, support, and reinforcement of a tunnel crossing a fault fracture zone using the three-dimensional finite element numerical method. The study yielded the following research conclusions: The excavation conditions of the cross-fault tunnel array were analyzed to determine the optimal construction method for excavation while controlling deformation and stress in the surrounding rock. The middle partition method (CD method) was found to be the most suitable. Additionally, the effects of advanced reinforcement grouting on the cross-fault fracture zone tunnel were studied, and the optimal combination of grouting reinforcement range (140°) and grouting thickness (1 m) was determined. The stress and deformation data obtained from on-site monitoring of the surrounding rock was slightly lower than the numerical simulation results. However, the change trend of both sets of data was found to be consistent. These research findings provide technical analysis and data support for the construction and design of cross-fault tunnels.Keywords
The construction of tunnels has rapidly expanded due to their ability to shorten running distances, improve transportation capacity, and reduce accidents [1,2]. As tunnels continue to develop in deeper depths, longer distances, and more complex geology, they encounter complex geological conditions such as dense faults (Fig. 1). The construction of tunnels in complex geological conditions poses a significant challenge in current tunnel construction practices [3,4]. As such, the exploration of effective cross-fault tunnel excavation and reinforcement methods is crucial for the design and construction of tunnel engineering projects.

Figure 1: Typical fault fracture zone
The construction of the tunnel that crosses the fault fracture zone is extremely complex due to the challenging conditions on site. Several studies have been conducted on tunnel excavation methods [5–7]. Sato and Kumar et al. [8,9] have investigated the relationship between fault slip, fault thickness, and surrounding rock conditions to determine the conditions for slippage in tunnels through faults and to develop tunnel construction methods. In a study conducted by Zhou et al. [10], large-scale physical model tests were performed to examine the excavation conditions of cross-weak sandwich tunnels. These results were then compared and analyzed using the finite element analysis method. The findings indicated that this analysis method was successful in effectively simulating the construction process of cross-fault tunnels. Cui et al. [11] examined the deformation characteristics of shallow buried loess tunnel using the CD excavation method. They conducted large-scale three-dimensional indoor model tests under the hard, soft, and fluid-plastic states and analyzed the surface displacement difference, pre-convergence rate, extrusion displacement, and radial stress release rate of the excavation face. Arora et al. [12] utilized 3D finite element analysis software to simulate the excavation of a tunnel boring machine (TBM) in clay-rich rock that had been extruded. Through this analysis, they were able to uncover the changes in stress level and tunnel convergence that occurred as a result of the shallow buried tunnel’s extrusion. Liu et al. [13] conducted a study using a combination of physical model testing and numerical analysis to verify settlement and stress responses. They concluded that the change in settlement value caused by the slope coverage depth of different sections was obtained through this method. In addition, Han et al. [14], Su et al. [15], and Sun et al. [16] have conducted research on the construction method of cross-fault tunnel and have made notable progress. The three-dimensional finite element method can accurately describe the deformation and stress situation of tunnels during excavation, so it is widely used in tunnel construction simulation analysis.
Reinforcement and grouting technology are essential during tunnel construction. To ensure the effectiveness of grouting materials, numerical simulations and model tests were conducted to analyze their rheological properties, grouting process, and grouting theory [17–19]. Xu et al. [20] utilized the numerical manifold method to simulate tunnel grouting reinforcement, and proposed an explicit integration scheme to evaluate the reinforcement effect of rock tunnel grouting. The results showed that the convergence deformation and expansion caused by tunnel excavation were effectively controlled. Additionally, Lee et al. [21] conducted a study on the permeation and diffusion law of grouting using a combination of physical model tests and numerical simulations. They revealed the filling and spreading of grouting in the joint. Zhang et al. [22] introduced a novel approach for reinforcing tunnel surrounding rock mass using self-stress grouting. They conducted theoretical analysis, physical experiments, and field experiments to investigate the range and thickness of fracture rock mass that can be reinforced through this method. Yang et al. [23] suggested a controllable grouting method and two grouting materials that can be used for the construction of shallow buried shield tunnels under karst underground. They also provided a reasonable range for the grouting materials. Meanwhile, Huang et al. [24] discussed the restorative effect of soil grouting on the longitudinal performance of cross-fault shallow buried tunnels. They also analyzed how grouting thickness can affect the recovery of longitudinal performance. Fan et al. [25] examined the reinforcement effect of jet piles on the foundation of loess tunnel and analyzed the impact of changes in geometric parameters of jet piles on the stability of tunnel foundation in loess tunnels. They also established a relationship between the length of spray piles and the reinforcement efficiency. Compared with other tunnel reinforcement methods, the grouting method has the advantages of high flexibility, wide application range, and high practicability. By taking measures to improve the application effect of grouting reinforcement technology, not only can the construction progress of engineering projects be accelerated, but also the quality of engineering operations can be improved.
However, despite extensive research, the response characteristics of surrounding rock under different construction schemes remain unclear due to the complex geological conditions in the cross-fault zone. Further exploration is needed to determine the appropriate construction method. During the excavation of cross-fault tunnels, it is common to encounter issues such as rock falling and collapse in the fracture zone. To address these problems, grouting reinforcement measures are necessary. However, the specific scope and thickness of the grouting reinforcement require further clarification.
This paper conducts a numerical simulation analysis of tunnel construction and grouting reinforcement, using the Xianglushan diversion tunnel project as a basis. The study examines the impact of different excavation and grouting methods and compares and analyzes the findings with on-site monitoring and measurement. The study reveals the deformation of surrounding rock and the stress distribution law of the tunnel’s surrounding rock. The optimal construction method of cross-fault tunnel was given. The optimal range and optimal thickness of grouting reinforcement were determined. The stress and deformation distribution of the surrounding rock during tunnel construction were also analyzed and compared with finite element analysis. The results of this research provide valuable reference and data support for the safe construction of of cross-fault tunnel.
2 Numerical Model for Cross Fault Tunnel Excavation
The Xianglushan mountain tunnel, spanning 63.426 kilometers, is situated in Yunnan Province, China. This water delivery tunnel is designed to transport water from the Shigu River to the central Yunnan region where water resources are scarce. The Xianglushan Tunnel is 63.426 km long, with 8.4 m in diameter and a Grade V surrounding rock. Located in the Xianshuihe–Diandong seismic zone in the Qinghai–Tibet area, the site has numerous geological problems, including some complex strata, structural areas, and severe fault zones. The regional geological conditions are complex, and many fault fracture zones with different dip angles are crossed by tunnels. The fault fracture zone section is characterized by poor surrounding rock geological conditions and stratum transition from soft rock to hard rock. The location of tunnel is seen in Fig. 2, while Table 1 displays the relevant physical parameters of the surrounding rock, fractured zone, and reinforcement materials.

Figure 2: Geographical location of the Xianglushan tunnel

Tunnel excavation poses intricate challenges such as soil nonlinearity, boundary conditions, and extrusion effects, rendering the Moore-Coulomb model inadequate for addressing them. The small strain soil hardening model (HSS) available in PLAXIS2D/3D software is capable of describing various mechanical properties of soil, including expansion, compression hardening, and shear hardening. Moreover, it can also depict the attenuation phenomenon of soil characteristics with strain in the small strain range, making it an ideal choice for simulating tunnel excavation construction processes.
The HSS model includes three stiffness coefficients and two small strain parameters in addition to the basic mechanical parameters of soil in the mole-coulomb model. Fig. 3 shows the constitutive model approximation curve, which represents the hyperbolic relationship between axial strain and deviating stress [26,27].

Figure 3: Approximate curve of HSS constitutive model
The small strain soil hardening model is the same as the soil hardening model, and volume hardening and shear hardening can be considered at the same time. In practice, these two situations often occur simultaneously, and in this case, it depends on the stress path and material properties to determine which hardening is dominant. In this case, the constitutive model partitions different working conditions. The constitutive model illustrated in Fig. 4 divides various operating conditions and employs different hardening equations for each situation. This form allows for more accurate calculations when engineering under complex stress paths, such as the load-and-unload problem encountered in tunnel excavation engineering. Calculate the elastic partial strain by the elastic modulus Eur, calculate the elastic shear strain and plastic shear strain under any deviatoric stress, and calculate the elastic and plastic volume strain by Eoed and determination coefficient. The soil hardening model finds the relationship between stress and strain in this way, and calculates strain from stress.

Figure 4: Hardening distribution of soil constitutive model
The HSS model contains 11 HSS model parameters and 2 small strain parameters [28–30]. In Table 2, 11 HSS model parameters: Triaxial test stiffness (Eur), Triaxial unloading/reloading stiffness (Eurref) and Oedometer load strength (Eoed), Effective cohesion

For the purpose of modeling and analysis, a typical cross-fault tunnel section located in Xianglushan Mountain was chosen. The numerical calculation model and network division are depicted in Fig. 5a. The size of the model was 100 m × 100 m × 80 m, with a tunnel height of 10 m and a buried depth of 30 m. The tunnel was distributed axially along the Y axis and had a horseshoe-shaped section. The width of the fault fracture zone in the middle of the type is 10 m, with an inclination angle of 75°, and there is only one fault zone. The excavation of the tunnel had an impact range of 3 to 5 times its diameter, and the model size was designed to meet this requirement. Plate elements were used to simulate the initial support, and the model meshing is illustrated in Fig. 5b. The analysis steps are the same under different calculation conditions. The analysis steps are listed in Table 3, and the detailed calculation process of the model is shown in Fig. 6.
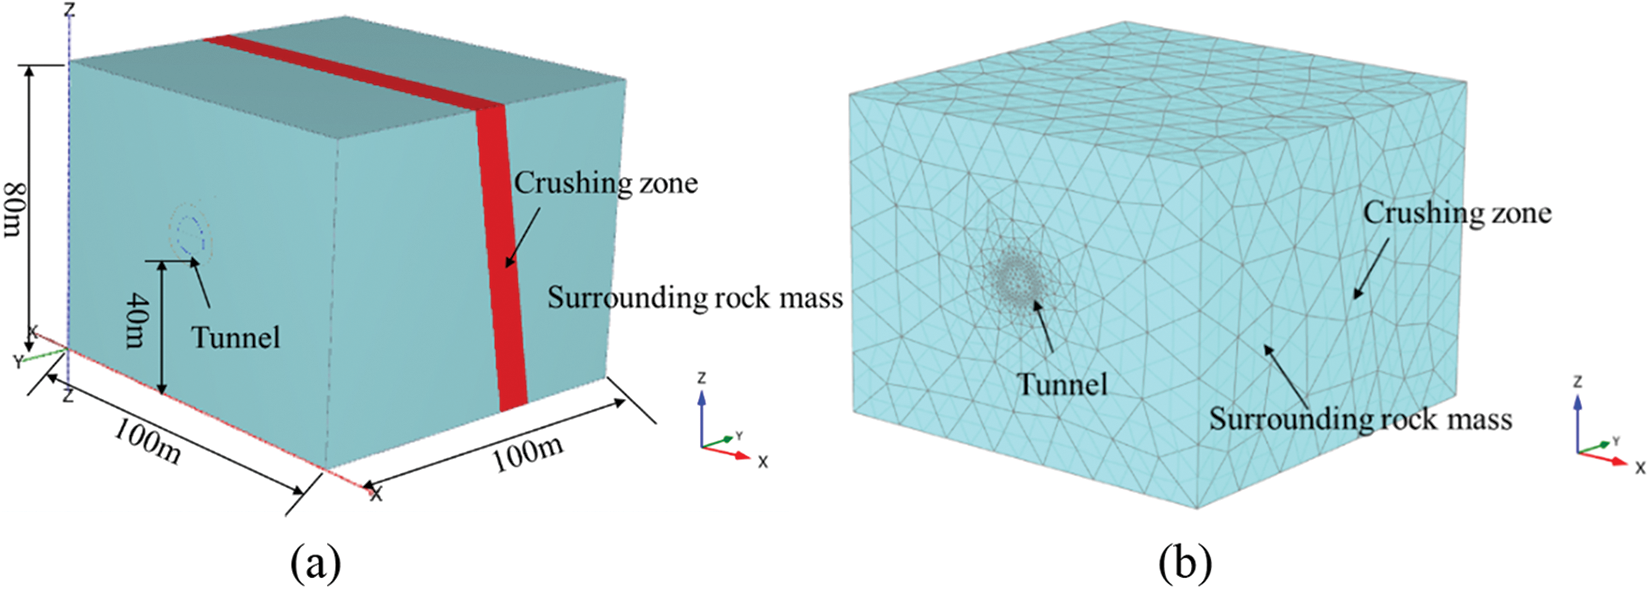
Figure 5: (a) Numerical calculation model; (b) model network partitioning

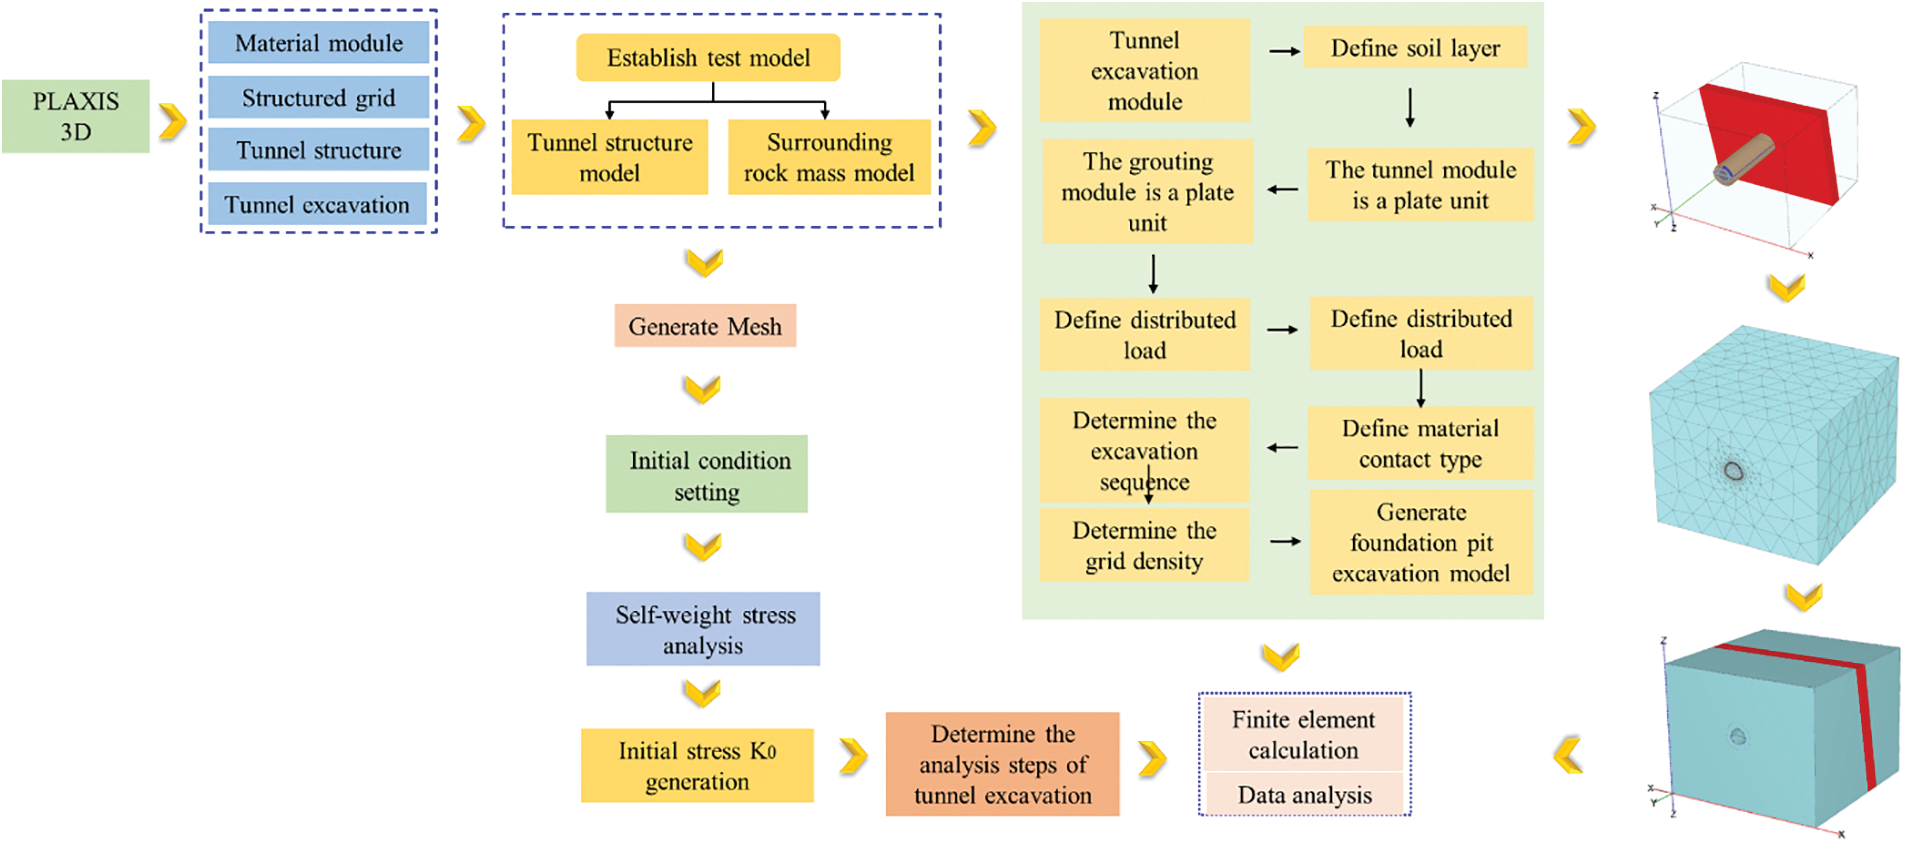
Figure 6: Model establishment and calculation process
2.4 Numerical Simulation of Working Conditions
This study thoroughly examines the geological conditions of Xianglushan Tunnel and constructs numerical models for different excavation methods to compare their effectiveness. The bench method, ring excavation reserved core geotechnical method, and middle partition method were selected to correspond with working conditions I, II, and III as outlined in Table 4. This paper presents a comprehensive analysis of the geological conditions of Xianglushan Tunnel. The study utilizes numerical models to compare the effectiveness of different excavation methods, namely the bench method, ring excavation reserved core geotechnical method, and middle partition method. These methods were selected to correspond with working conditions I, II, and III as outlined in Table 4. The excavation of the tunnel caused the surrounding rock supporting the tunnel body to be excavated, and a void appeared behind the face of the tunnel, and the stress of the surrounding rock was redistributed, causing the surrounding rock to deform toward the tunnel clearance. However, the physical properties of the surrounding rock in the fault zone area are poor, and when the tunnel is excavated near the fault zone, the deformation in the direction of the tunnel clearance is relatively large. Therefore, the position 20 m before and after the excavation to the fault zone was selected for comparative analysis to study the influence of the fault zone on the deformation and stress of the surrounding rock during tunnel excavation. The cross-fault section and the 20 m before and after the section were recorded and labeled as A-A section, B-B section, and C-C section, respectively, as illustrated in Fig. 7. The research focused on investigating the impact of fault fracture zones on the deformation behavior of tunnel surrounding rocks. Additionally, the study compared and analyzed the effectiveness of different tunnel excavation methods in controlling the deformation of the surrounding rocks.

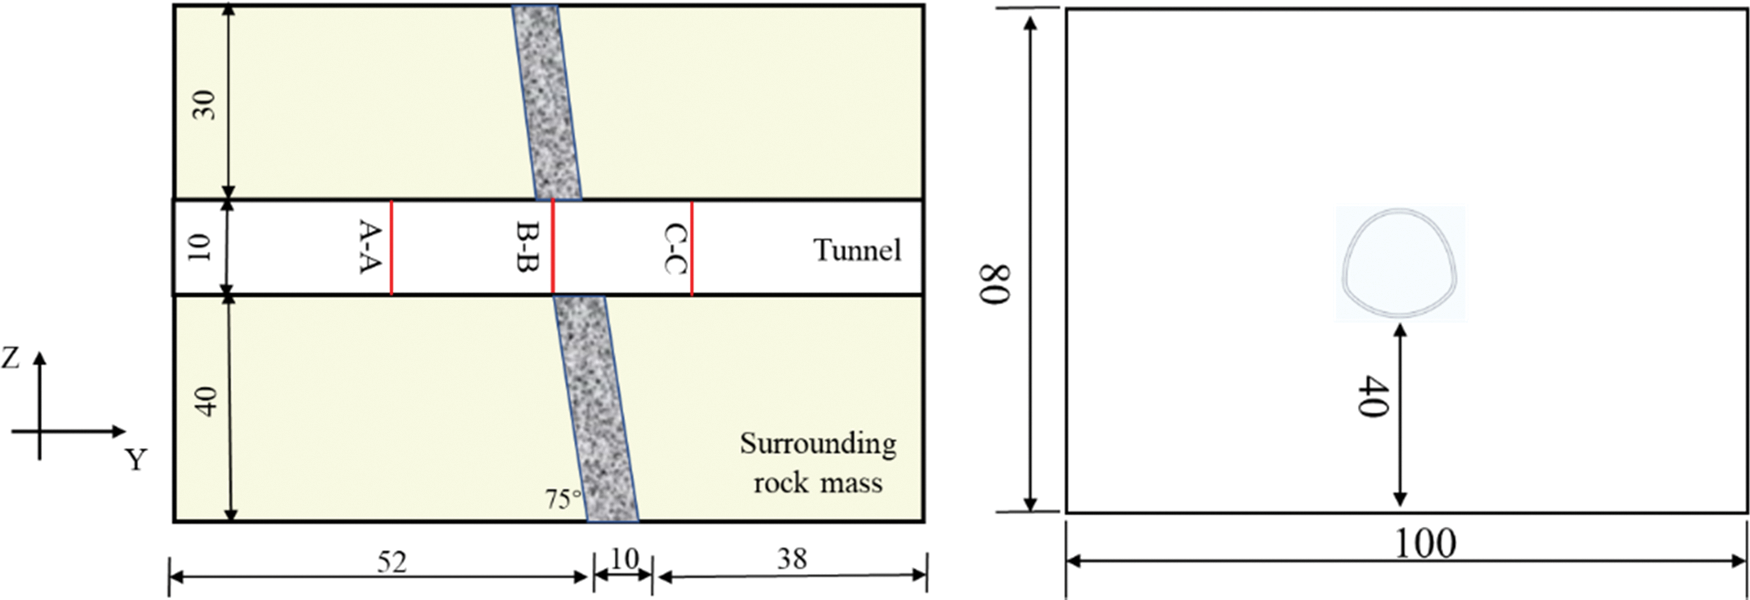
Figure 7: Location map of fault fracture zone (Unit: m)
3.1 Deformation of Tunnel Surrounding Rock
Fig. 8 displays the displacement cloud of the surrounding rock of the tunnel under various excavation conditions. Upon completion of the bench method tunnel excavation, the crown and spandrel at the fault experienced downward settlement, while the haunch and invert saw upward uplift. The deformation ranged from −28 to 28 mm. At a depth of Y = 50 m in the vertical section of the tunnel model, significant deformation of the surrounding rock was observed at the fault. Additionally, there was downward settlement at the crown of the fault, while the invert was in a state of uplift. Fig. 8b shows that after completion of the ring cut method, deformation ranged from −22.5 to 22.5 mm, with larger variability at the crown and invert. The ring cut method resulted in significantly less deformation of the surrounding rock of the tunnel compared to the bench method. This reduction had a notable impact on the deformation of the surrounding rock. Fig. 8c illustrates that the deformation pattern of the surrounding rock was similar between the bench method and the ring cut method. The study found that the deformation using the center diaphragm method was between −22.5 and 22.5 mm, with a reduction of 35.7% and 20.0% compared to the previous two methods for controlling surrounding rock deformation. This suggests that the center diaphragm method is more effective in controlling deformation.
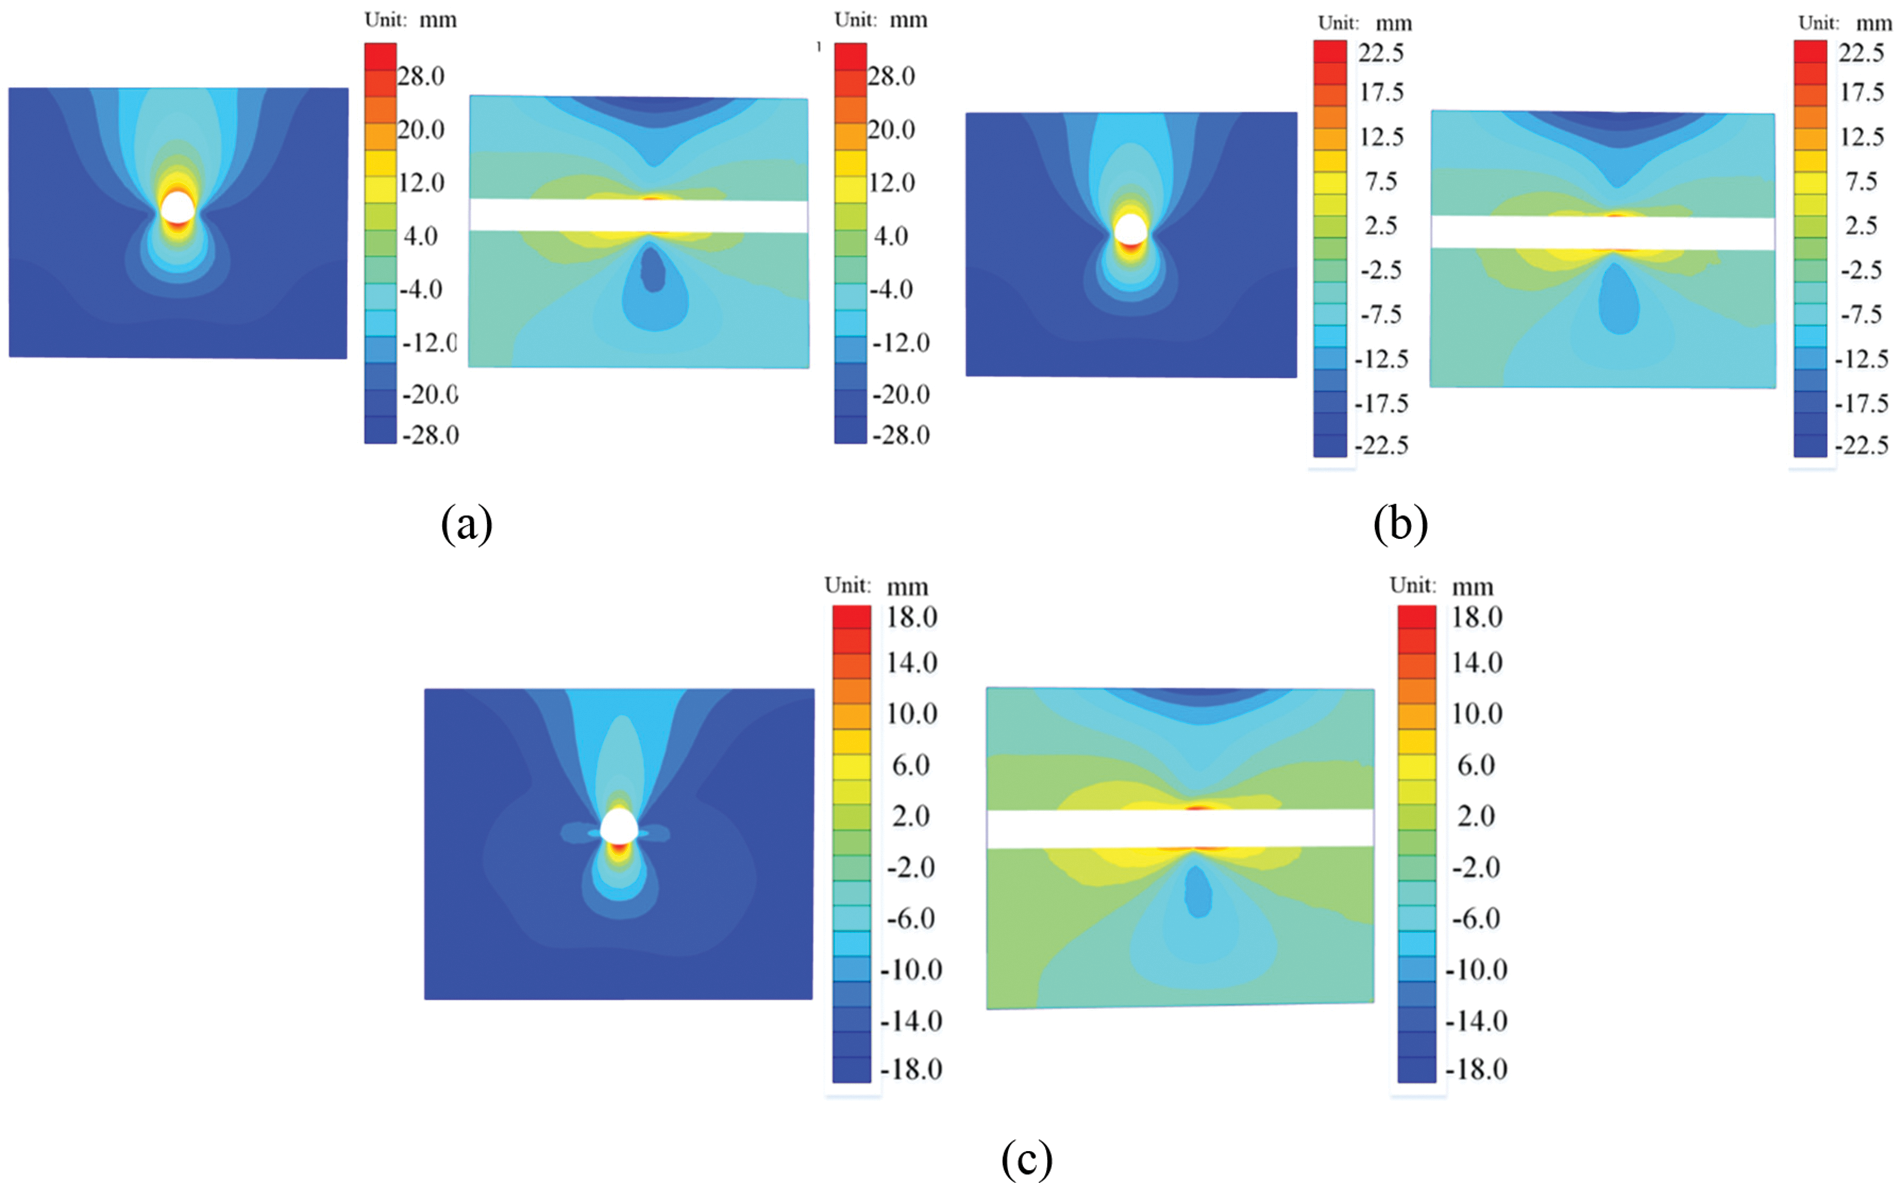
Figure 8: Displacement cloud map under different excavation conditions
Fig. 9 illustrates the displacement deformation of both the invert and crown post-excavation. Notably, the deformation of the surrounding rock at the fault was greater than that of the surrounding rock at other locations. The maximum displacement of the crown was observed on the hanging wall of the fault, while the maximum displacement of the invert was located on the footwall of the fault. The fault would impact the deformation of the rock surrounding the tunnel. The displacement of the vault would change in a ‘V’ shape, with greater deformation of the surrounding rock occurring closer to the fault. The deformation of the surrounding rock of the tunnel decreases as the distance from the fault increases, suggesting that the fault has an impact on the deformation pattern of the tunnel’s surrounding rock. As a result, the excavation of the tunnel should take into account the influence range of the fault.
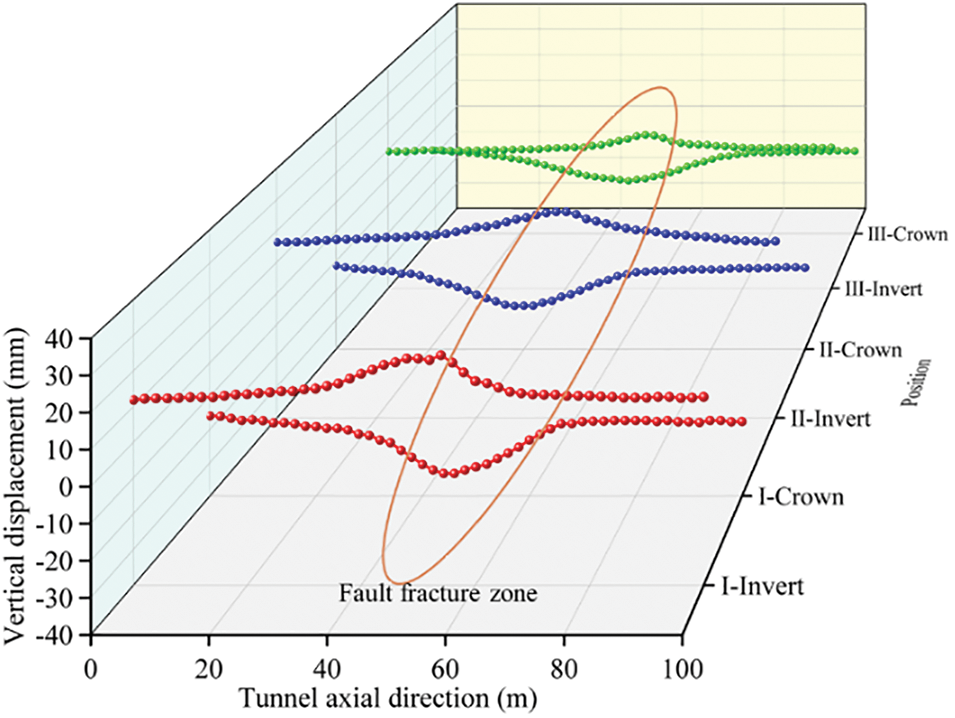
Figure 9: Vertical (Z-direction) displacement of crown and invert under three working conditions
To compare the deformation of the surrounding rock in sections A-A, B-B, and C-C, settlement displacement of the vault and elevation arch under different excavation conditions was analyzed and displayed in Fig. 10. The excavation of the A-A section using the bench method caused significant deformation in the early stages, resulting in sharp increases in crown and invert displacement as shown in Figs. 10a and 10b. During the initial support of the A-A section, there was a gradual increase in the crown and invert displacements. However, after the excavation of the B-B section was completed and initial support was applied, there was no further increase in crown displacement settlement. Similarly, during the excavation of the C-C section, the displacement settlement of the crown remained stable. As depicted in Figs. 10c and 10d, the settlement of the crown in the ring cut method was found to be smaller than that of the bench method during excavation. Moreover, the settlement of the crown was observed to be more significant both before and after the fault. Additionally, the displacement of the invert was reduced by 14.8%. The decrease in uplift displacement was greater near the fault for the A-A and C-C sections using the ring cut method compared to the bench method. This suggests that the ring cut method provides better control over the upright arch uplift displacement of the cross-fault tunnel. According to Figs. 10e and 10f, the settlement variation law of the crown was found to be similar to that of the bench method and the ring cut method. Out of the three construction methods, the center diaphragm method crown and invert exhibited the smallest settlement. The center diaphragm method resulted in a significant decrease in the maximum settlement of the crown and invert at A-A-section, B-B section, and C-C section, with reductions of 49.4%, 46.9%, and 47.9%, and 45.2%, 46.5%, and 63.9%, respectively, compared to the bench method. Similarly, compared to the ring cut method, the center diaphragm method also showed a decrease in the maximum settlement of the crown and vert at different sections, with reductions of 36.1%, 34.2%, and 30.1%, and 31.5%, 37.2%, and 52.9%, respectively. The results indicate that the center diaphragm method had the most effective displacement control, followed by the ring cut method, with the bench method being the least effective.


Figure 10: Displacement variation curves at different cross-sections. (a) Crown of the bench method; (b) invert of the bench method; (c) crown of the ring cut method; (d) invert of the ring cut method; (e) crown of the center diaphragm method; (f) invert of the center diaphragm method
Fig. 11a displays the maximum displacement of the crown for each section in three different construction methods was displayed. The center diaphragm method showed a reduction of 49.4%, 46.9%, and 47.9% in the maximum settlement of the crown in the A-A section, B-B section, and C-C section, respectively, as compared to the bench method. Compared to the ring cut method, the center diaphragm method exhibited the best control effect on the displacement of the crown, with a decrease of 36.1%, 34.2%, and 30.1%, respectively. The ring cut method followed with a slightly lower decrease in maximum settlement, while the bench method showed the worst control effect. The center diaphragm method resulted in a reduction of 45.2%, 46.5%, and 63.9% in the maximum uplift of the invert in each section, respectively. In addition, the amount of inverted arch uplift at the A-A section, B-B section, and C-C section was also reduced. When compared to the ring cut method, the center diaphragm method showed a greater reduction in uplift of the invert, with decreases of 31.5%, 37.2%, and 52.9%, respectively. Overall, the center diaphragm method demonstrated superior control over the amount of upright arch uplift among the three excavation methods.
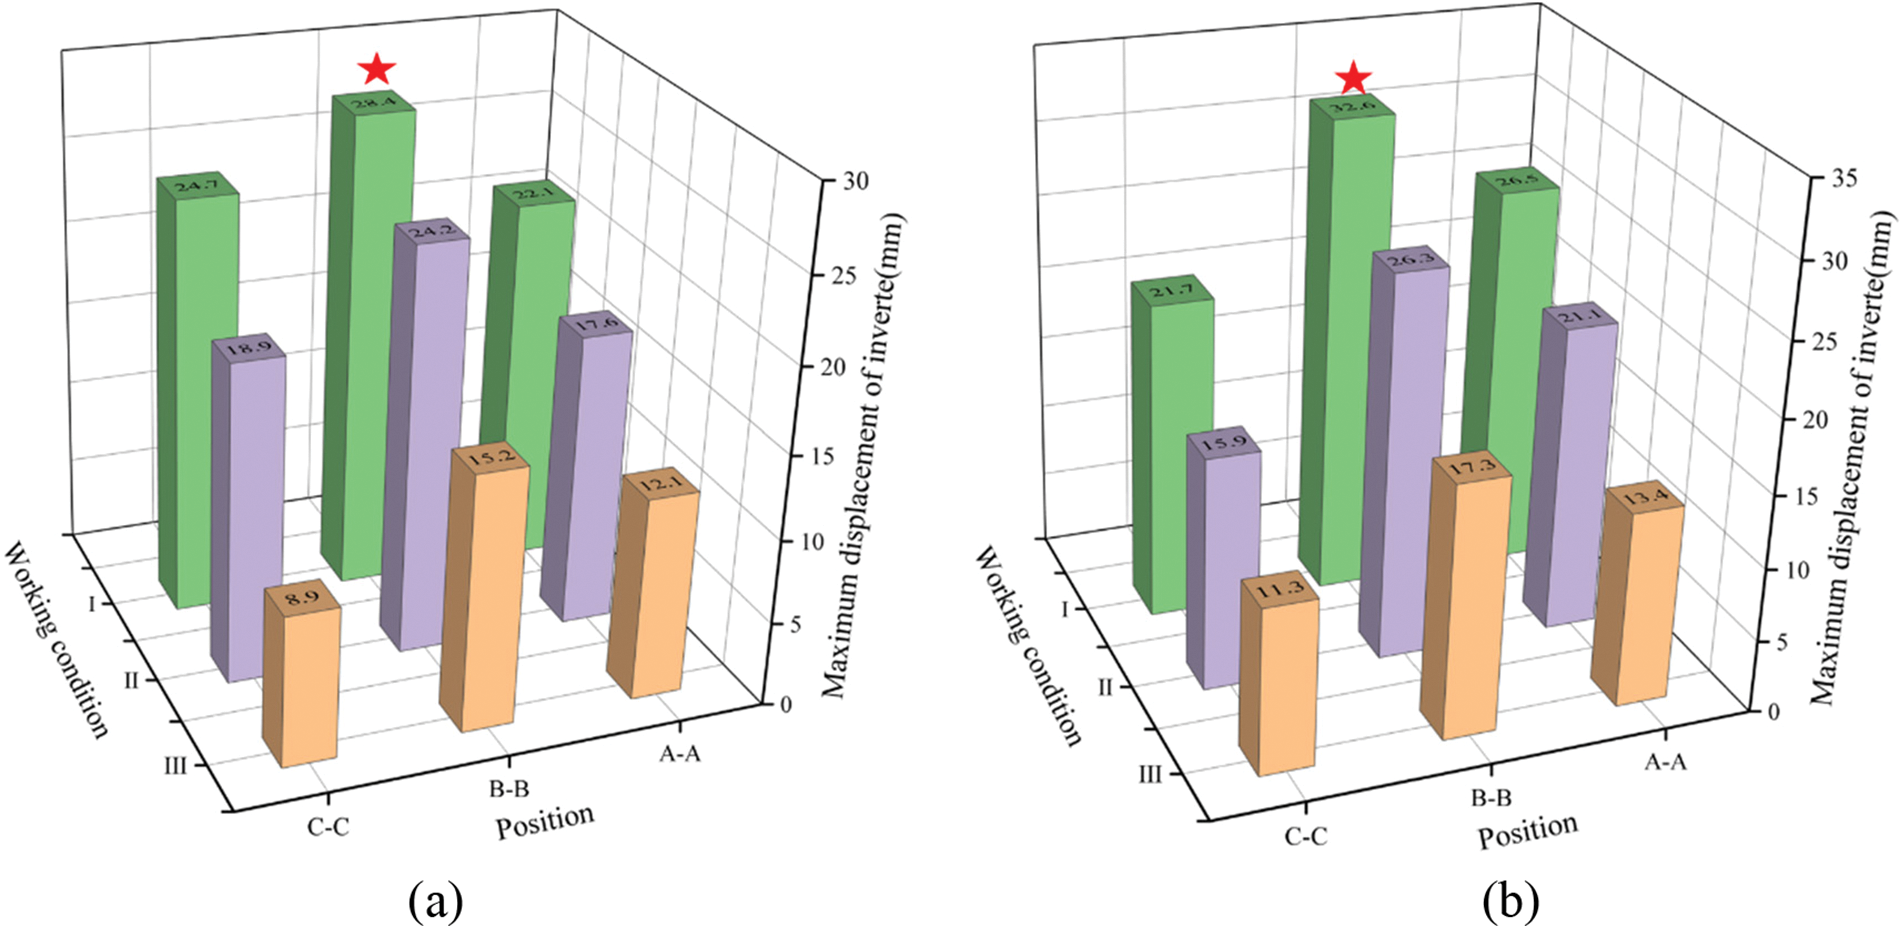
Figure 11: Comparison and analysis of maximum displacement values. (a) Invert; (b) crown
3.2 Stress in Tunnel Surrounding Rock
Fig. 12 displays the stress cloud of the surrounding rock of the tunnel is displayed for the three excavation methods. Once the excavation was completed and the initial support of the cross-fault tunnel was in place, the area around the tunnel was in a compressed state. The maximum compressive stress was observed at the arch foot, while the smallest compressive stress was observed at the crown. The excavation of the tunnel altered the stress distribution of the surrounding rock, leading to varying stress distribution patterns at different points along the tunnel. The ring cut method resulted in a tensile stress area in the crown and reduced compressive stress in other positions compared to the bench method. This corresponds to the displacement deformation of the surrounding rock of the tunnel at the fault. Additionally, the ring cut method caused less deformation in the surrounding rock compared to the bench method. In the B-B section of the center diaphragm method, the tunnel crown and spandrel were in a tensile state, while the haunch, arch foot, and invert were in a compression state. The arch foot experienced the highest compressive stress, measuring 0.47 MPa, while the crown experienced the highest tensile stress, measuring 0.18 MPa. Table 5 shows the stress distribution positions and values for the first and third stresses. The compressive stress at the arch foot was found to be the largest, while the tensile stress at the crown was the largest when compared to the bench method and the ring cut method. The maximum compressive stress at the arch foot and the crown was reduced by 44.3% and 33.8%, respectively. According to the analysis, the center diaphragm method had the most effective stress control of the surrounding rock, followed by the ring cut method. The bench method, however, exhibited the weakest control effect.

Figure 12: Stress cloud chart

In Fig. 13a, the contact pressure between the surrounding rock and the initial support of the B-B section was found to be the largest among the three sections, namely A-A, B-B, and C-C, at the step method fault. The contact pressure of the A-A section and the C-C section did not differ significantly from that of the initial support. In the B-B section of the fault, the contact pressure was highest at the spandrel, followed by the haunch. The contact pressure was lowest at the crown and the invert. The maximum contact stress of the left arch was found to be 1.03 MPa. In the A-A and C-C sections, the maximum contact stress of the left spandrel was 0.52 MPa and 0.49 MPa, respectively. In comparison, the maximum contact stress of the left spandrel in the B-B section reduced by 60.0% and 62.3%, respectively. This indicates that the fault significantly influenced the distribution of contact stress. During the construction of the tunnel, it is important to consider the initial support at the fault and the protection of the fault fracture zone. This is due to the fact that the contact pressure between the surrounding rock of the tunnel and the initial support at the fault is much greater than in other sections. Therefore, extra attention should be given to ensure the safety and stability of the tunnel in this area. The results from Fig. 14 indicate that the center diaphragm method significantly reduced the maximum contact stress of the left spandrel at the A-A, B-B, and C-C sections compared to the bench method by 59.6%, 44.6%, and 44.9%, respectively. Similarly, compared to the ring cut method, the center diaphragm method reduced the maximum contact stress of the left spandrel by 41.7%, 15.3%, and 20.6% at the same sections. The results showed that the center diaphragm method had a better control effect on the contact pressure between the surrounding rock and the initial support compared to the previous two excavation methods, as evidenced by a significant reduction in contact pressure.
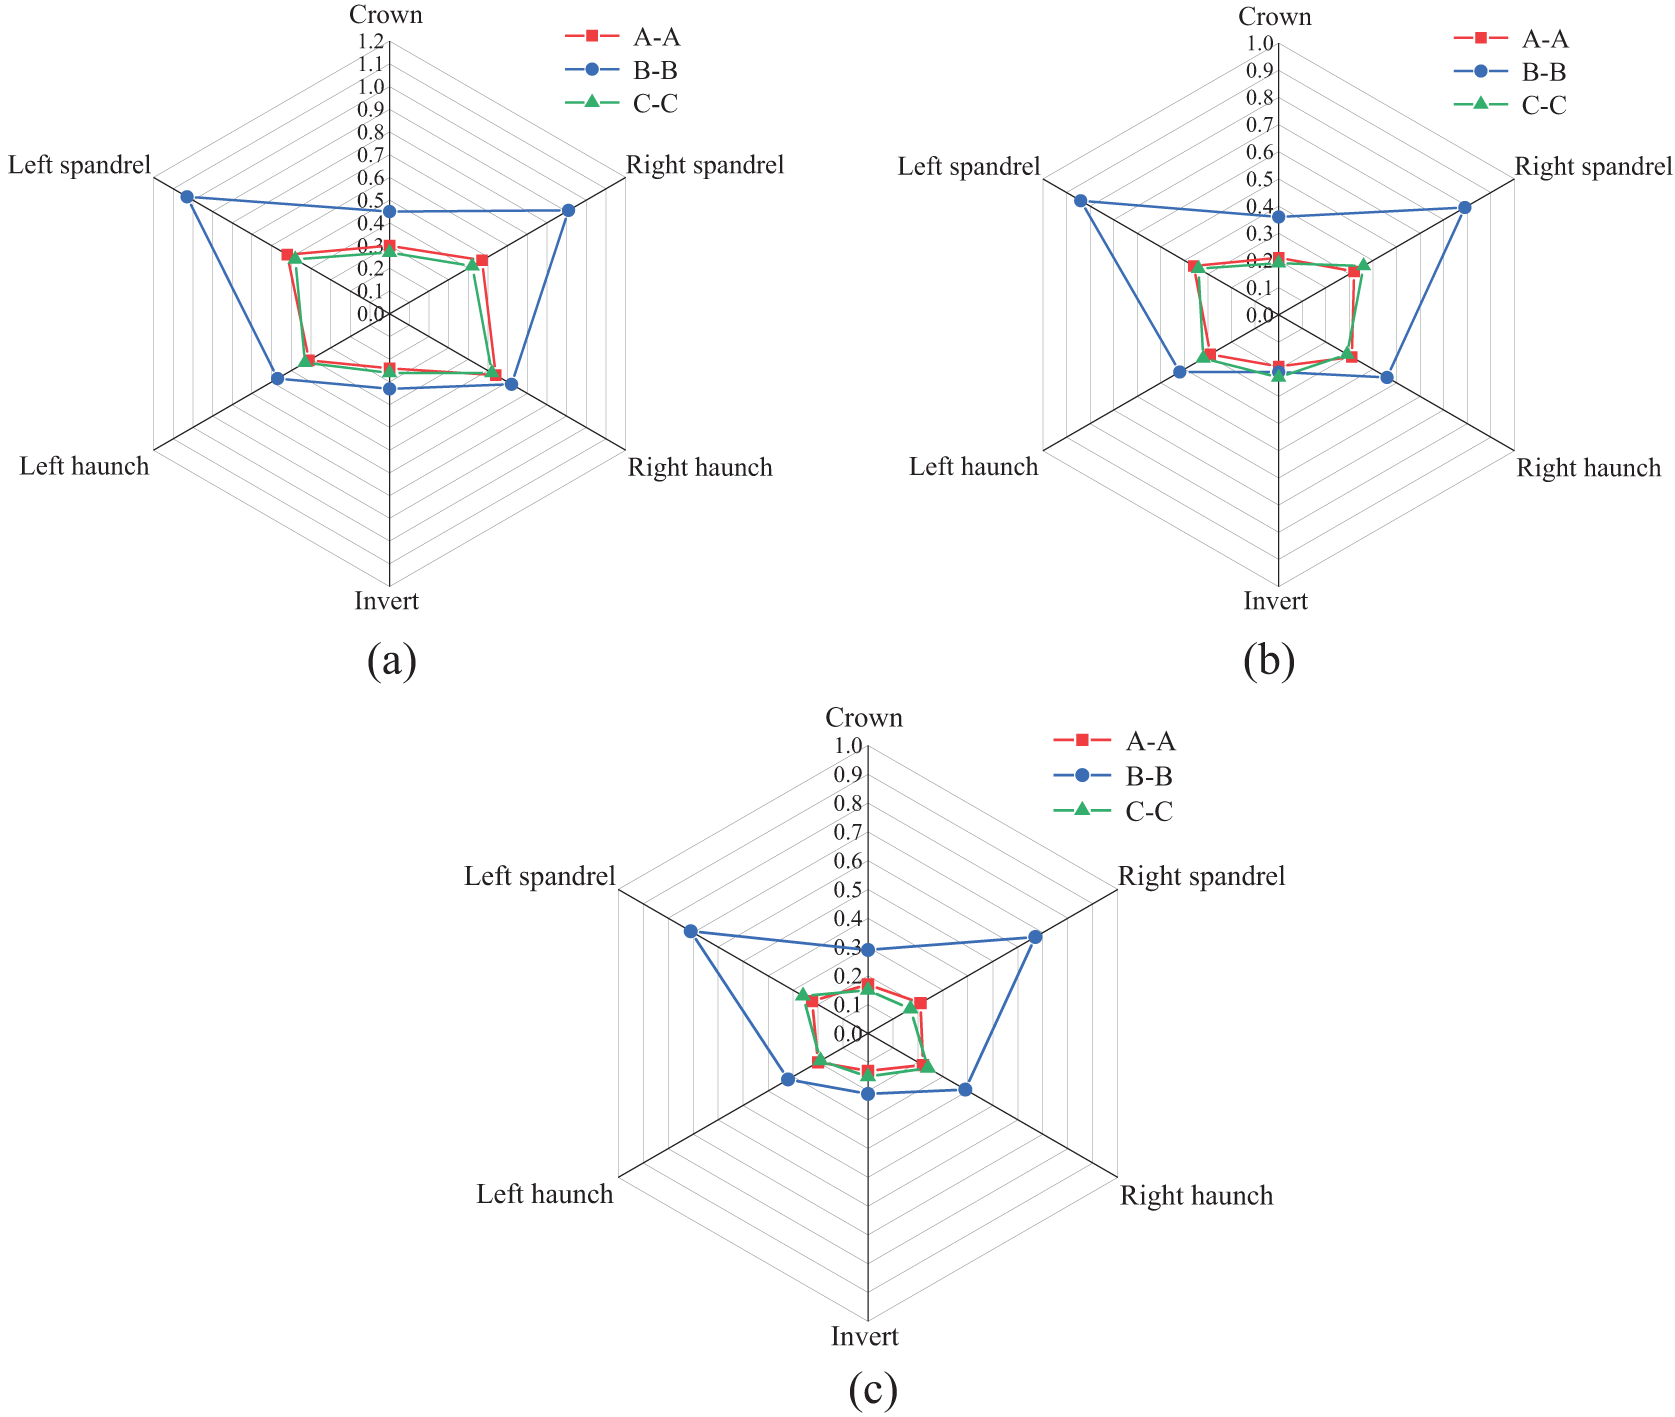
Figure 13: Contact pressure distribution. (a) Bench method; (b) ring cut method; (c) center diaphragm method
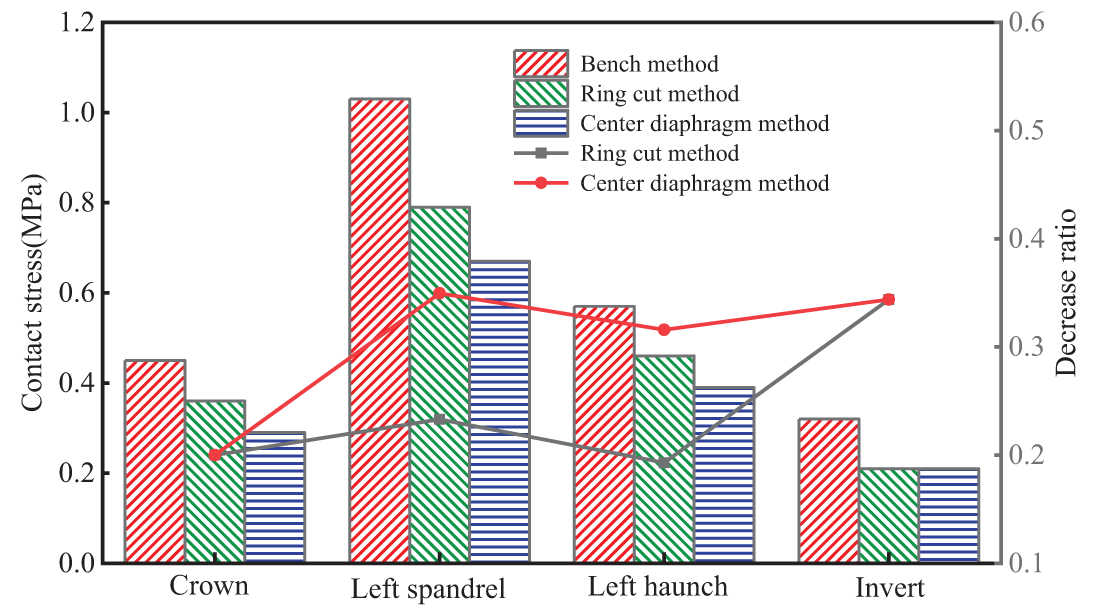
Figure 14: Comparative analysis of contact pressure at different tunnel positions
3.4 Grouting Reinforcement Effect
During the excavation of cross-fault tunnels, it was expected that the surrounding rock at the fracture zone would fall and collapse. To prevent large deformation of the surrounding rock at the fault, appropriate reinforcement measures were implemented. In this section, the advanced grouting reinforcement method was adopted based on the CD construction excavation method. The grouting effect was carefully considered by taking into account the influence of ring grouting range and grouting thickness. Additionally, finite element software was used to model and analyze the results.
3.4.1 The Influence of Circular Grouting Range on Grouting Effect
Fig. 15 displays the displacement cloud of the surrounding rock at the crown and the invert was significantly reduced after grouting reinforcement, when compared to the displacement cloud observed under the ungrouping condition III. During working condition III, the maximum displacement deformation of the surrounding rock of the cross-fault tunnel was measured at 21.2 mm. Meanwhile, under working conditions IV, V, and VI (with grouting ranges of 120°, 140°, and 160°), the maximum displacement deformations were 17.4, 14.3, and 13.7 mm, respectively. Compared to working condition III, the maximum displacement deformation of the surrounding rock decreased by 17.9%, 32.5%, and 35.4% under working conditions IV, V, and VI, respectively. Moreover, as the grouting range increased, the displacement deformation of the surrounding rock gradually decreased. However, the decrease rate of displacement deformation of the surrounding rock decreased slower with the increase of grouting range. When the grouting range exceeds a certain value, it contributes less to the reduction of the surrounding rock deformation of the tunnel. Therefore, selecting an appropriate grouting range is beneficial for controlling the surrounding rock deformation and construction cost. Among the three grouting ranges mentioned, 140° is the optimal value.
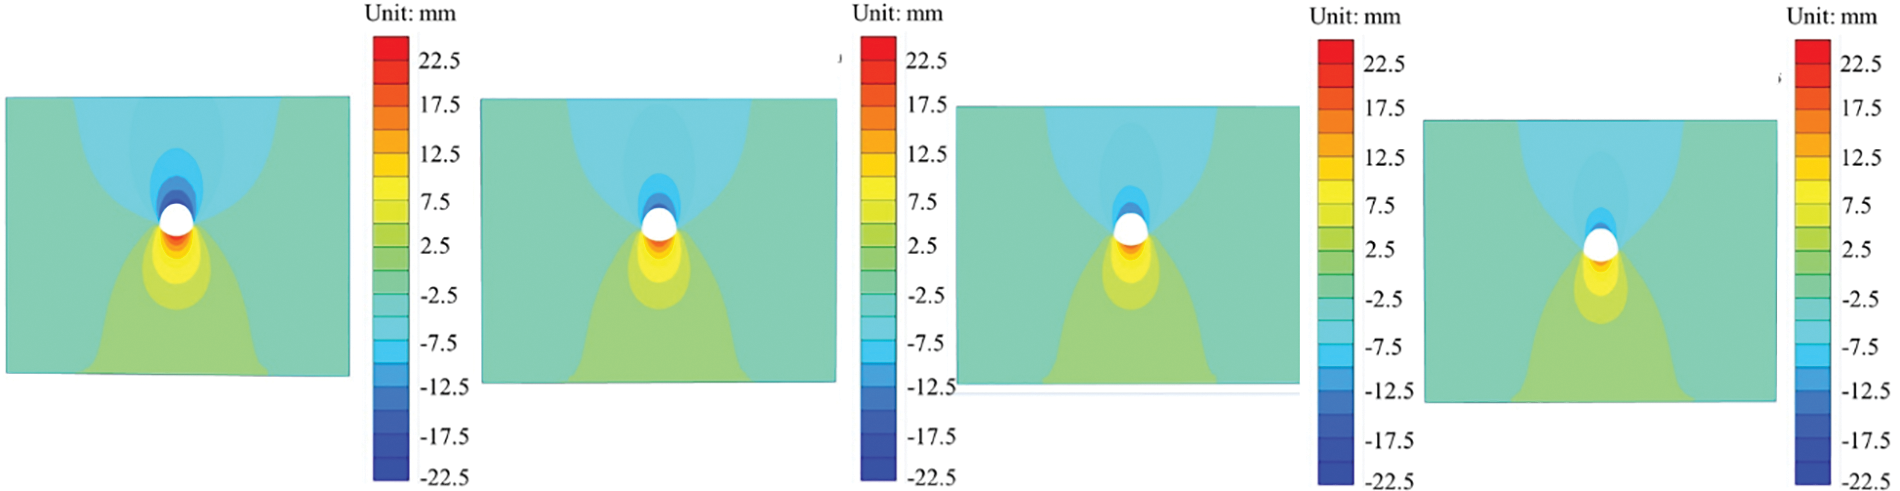
Figure 15: Cloud chart of displacement under different grouting ranges
As depicted in Fig. 16, following the excavation and initial support, the tunnel’s surrounding area is subjected to pressurization. The maximum compressive stress is observed at the crown, while the minimum compressive stress is found at the invert. This phenomenon occurs because the excavation alters the stress distribution pattern of the surrounding rock, leading to a redistribution of stress and varying stress distribution characteristics across different tunnel locations.
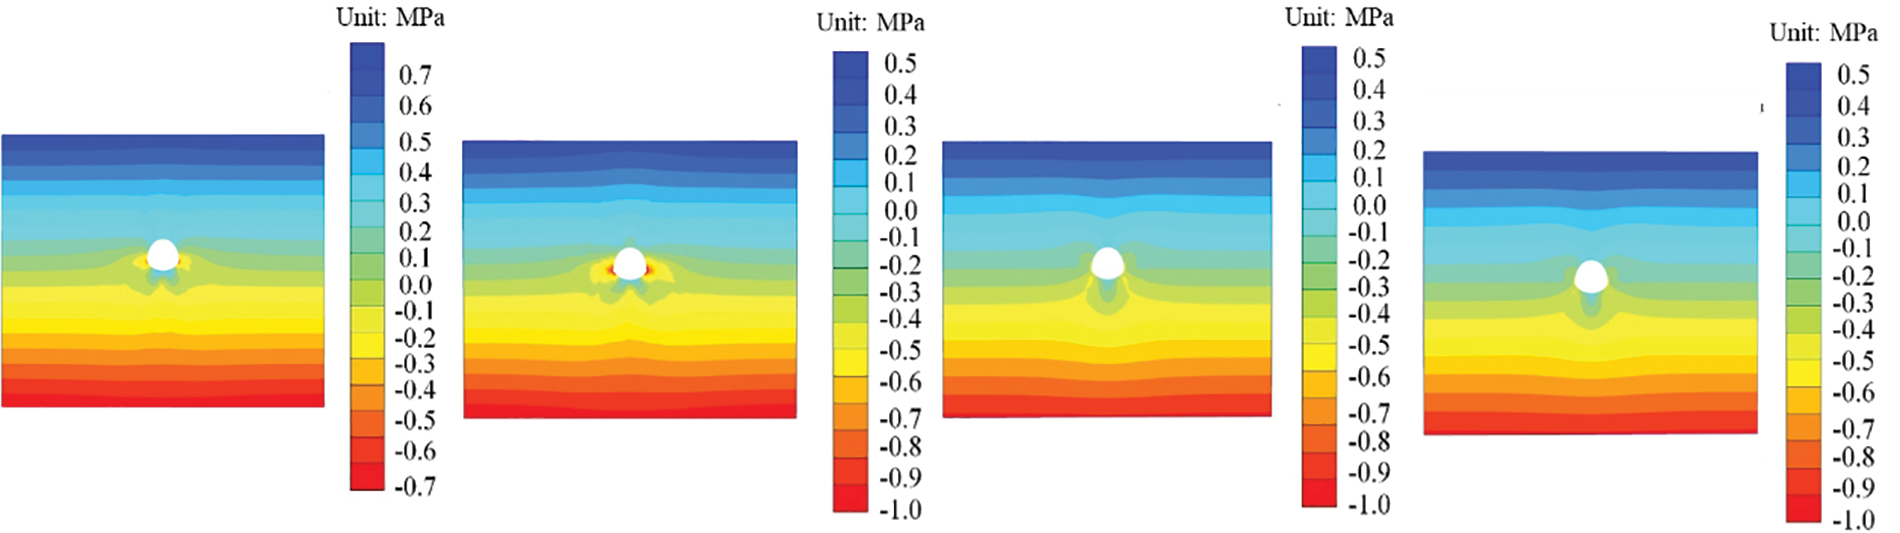
Figure 16: Stress cloud map under different grouting ranges [31]
Fig. 17a illustrates the development law of the invert displacement in different grouting ranges. The displacement of the invert at the fault section was the largest, and the deformation of the surrounding rock of the tunnel increased with decreasing distance from the fault. Conversely, the deformation of the surrounding rock decreased with increasing distance from the fault. The maximum displacement of the invert during working conditions III, IV, V, and VI were 26.2, 22.3, 20.6, and 19.2 mm, respectively. In comparison to Working Case III, the maximum displacement of the invert decreased by 14.9%, 21.4%, and 26.7% in the annular grouting range of 120°, 140°, and 160°, respectively. According to Fig. 17b, the maximum settlement displacement of the crown is 26.5, 17.8, 15.7, and 15.2 mm for the ungrouping reinforcement condition and the annular grouting range of 120°, 140°, and 160°, respectively. Furthermore, the maximum settlement displacement of the crown decreased by 32.8%, 40.7%, and 42.6% under working conditions III, IV, V, and VI. Based on the analysis, it was found that the advanced grouting reinforcement had a positive correlation with the grouting range. As the range of grouting increased, the control effect on crown settlement improved. However, the enhancement effect of the control effect was not linear and became less noticeable as the grouting range increased.
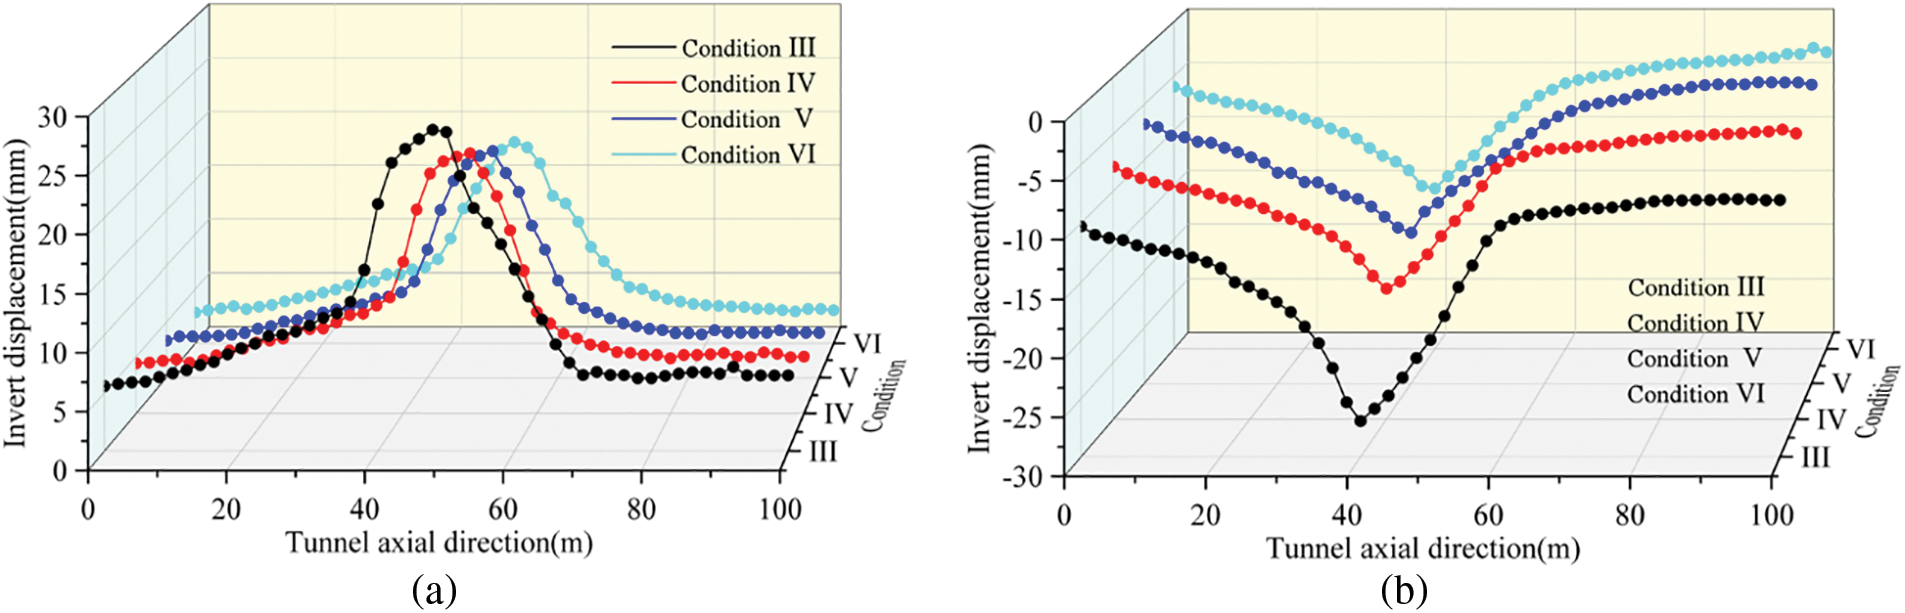
Figure 17: Displacement curves of inverted arch and arch crown in different grouting ranges. (a) Invert; (b) crown
3.4.2 The Influence of Grouting Thickness on Grouting Effect
As depicted in Fig. 18, the displacement cloud of the unrouted working condition III was compared with the displacement of the surrounding rock at the crown and the invert after grouting reinforcement, which had a significant reduction effect. The maximum displacement deformation of the surrounding rock in the middle span fault tunnel under working condition II was recorded as 21.2 mm. The maximum displacement deformation of the surrounding rock was measured under different working conditions (VII, VIII, and IX) with varying grouting thicknesses (0.6, 1.0, and 1.4 m). The results showed that the maximum displacement deformations were 16.8, 14.3, and 13.2 mm, respectively. Compared to working condition III, the maximum displacement deformations in working conditions VII, VIII, and IX decreased by 20.8%, 32.5%, and 37.7%, respectively. Increasing the grouting thickness can have a significant effect on reducing displacement deformation of the surrounding rock in a cross-fault. As the grouting thickness increases, the displacement deformation of the tunnel’s surrounding rock at the fault also decreases. Additionally, the amplitude of displacement deformation across the fault decreases as the grouting thickness increases. Stress cloud map under different grouting thicknesses is shown in Fig. 19.
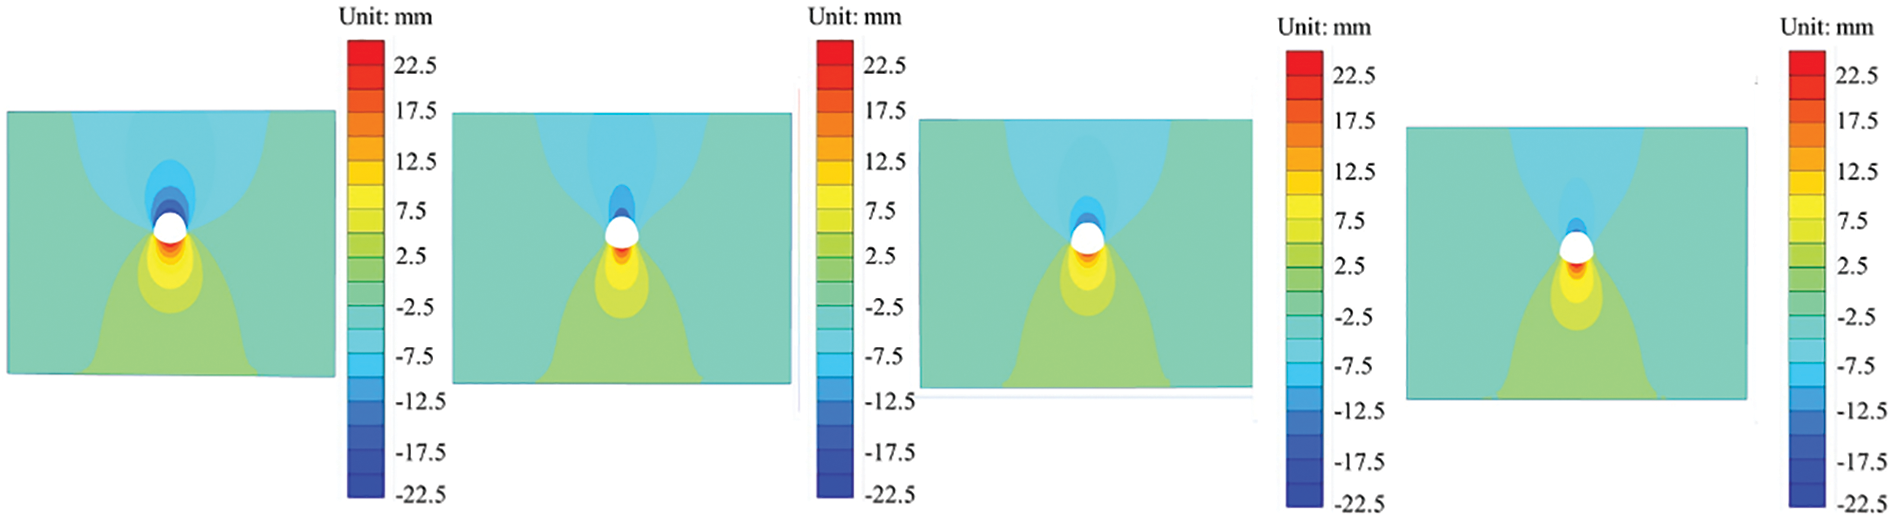
Figure 18: Cloud chart of displacement under different grouting thicknesses
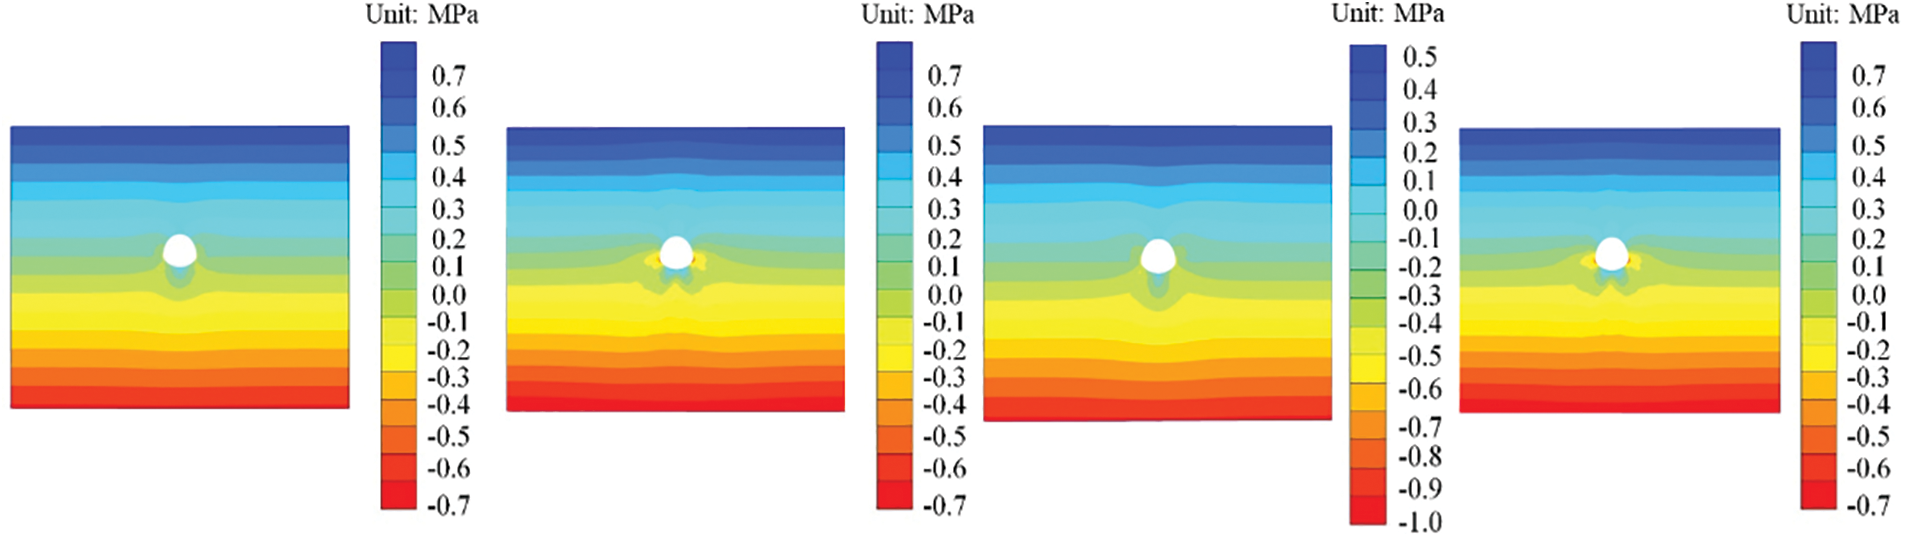
Figure 19: Stress cloud map under different grouting thicknesses [31]
Fig. 20a displays the uplift displacement of the invert was greatest at the fault and decreased in distance from the fault after the cross-fault tunnel excavation was completed. The maximum displacements of the invert under working conditions III, VII, VIII and IX were 26.2, 24.3, 22.6 and 21.2 mm, respectively. In comparison to Case III, the maximum uplift displacement of the invert decreased by 7.3%, 13.7%, and 19.1% in conditions VII, VIII, and IX, respectively. The maximum settlement displacement of the crown under working conditions III, VII, VIII, and IX were 26.5, 23.8, 16.2, and 15.7 mm, respectively. Furthermore, the maximum crown settlement displacement in working conditions VII, VIII, and IX reduced by 10.2%, 38.9%, and 40.8%, respectively, when compared to the reinforced condition in Case III. Based on the analysis, a grouting thickness of 0.6 m resulted in a crown reduction of 10.2%. However, when the grouting thickness was increased to 1.0 and 1.4 m, the crown reduction was approximately 40%. This suggests that the effectiveness of controlling surrounding rock deformation varies with different grouting thicknesses. Additionally, it was observed that increasing the grouting thickness beyond 1.0 m did not significantly improve the control effect on surrounding rock deformation.
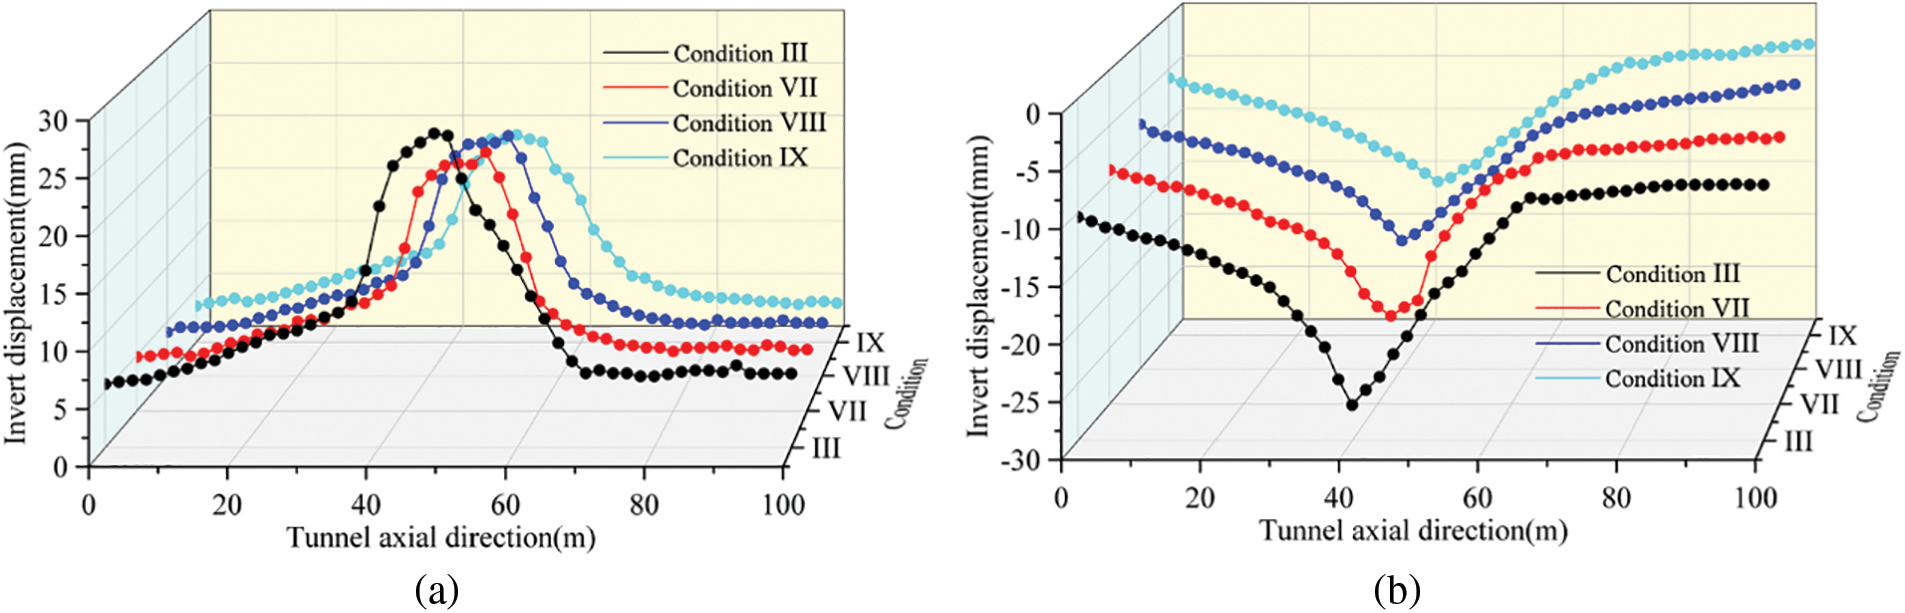
Figure 20: Displacement curves of the invert and crown with different grouting thicknesses. (a) Invert; (b) crown
4 Analysis of On-Site Monitoring and Measurement of Xianglushan Tunnel
To ensure accurate and rational construction and design of water diversion projects, numerical simulations were conducted and verified to provide data assurance for the safe construction and stability of the water diversion tunnel. In the Xianglushan Tunnel monitoring project, the starting section of the tunnel’s surrounding rock crown settlement and headroom convergence is monitored every 10 m starting from DK347 + 850. Optional stress monitoring, such as surrounding rock pressure and bolt axial force, is conducted in the diversion tunnel at DK347 + 920 and DK348 + 000 sections. The Xianglushan Tunnel adopts a combination of TBM method and drilling and blasting method. Various instruments including the level instrument, convergence, and total station were utilized for measurement in this monitoring project. The layout of the project can be seen in Fig. 21.
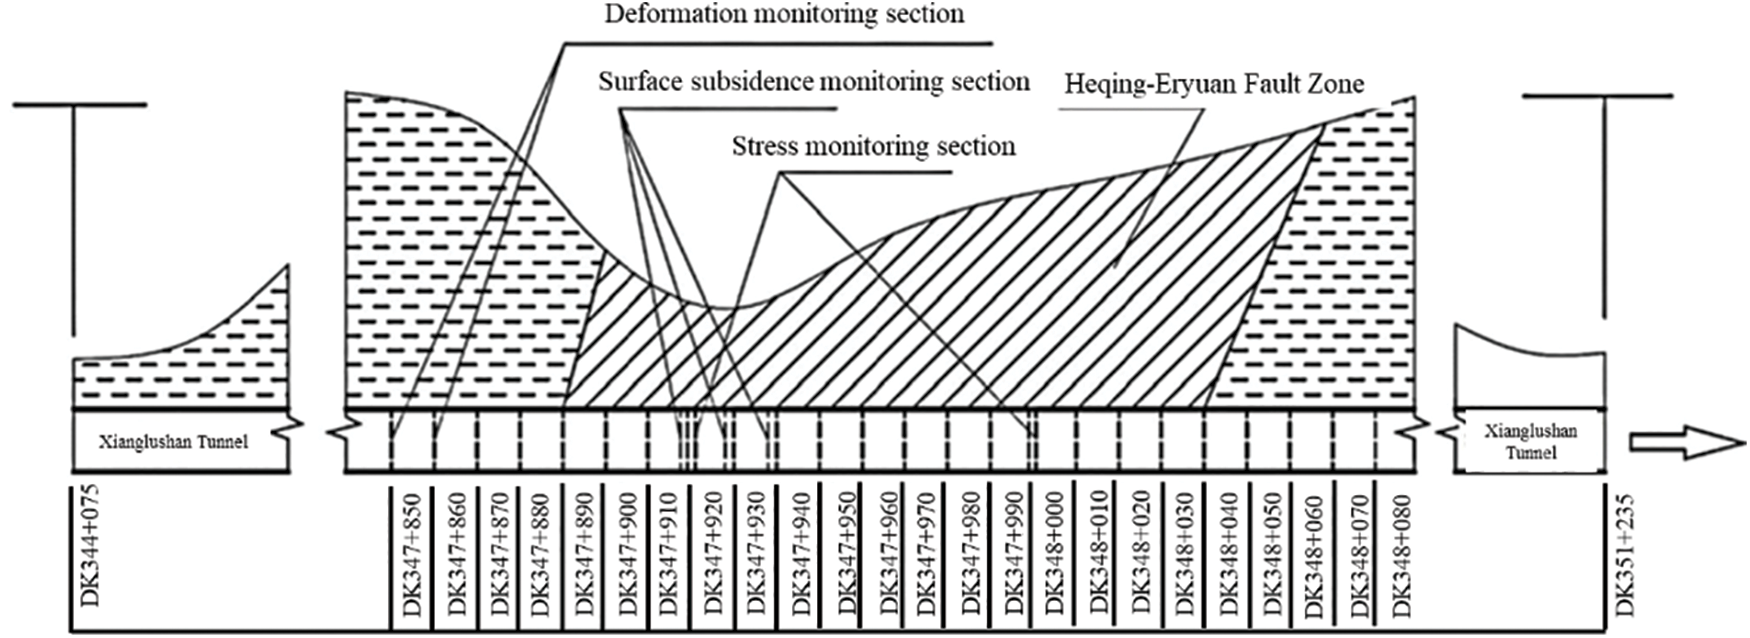
Figure 21: Tunnel monitoring items and layout of monitoring points (Unit: m)
4.1 Monitoring Results of Surrounding Rock Pressure
The monitoring data of the surrounding rock pressure of the tunnel in the previous section was used to create a map of the pressure distribution, as depicted in Fig. 22. Additionally, a temporal curve of the pressure was generated and is shown in Fig. 23. According to the monitoring data of the surrounding rock of the tunnel, the pressure distribution of section DK347 + 920 and section DK348 + 000 was uneven. The maximum pressure values of the surrounding rock were observed at 30° of the left haunches, with values of 0.255 and 0.444 MPa for the two sections, respectively. At section DK347 + 920, the surrounding rock pressure reached its maximum value of 0.255 MPa, while the pressure at other monitoring points was relatively low. The right arch foot and right foot wall of section DK348 + 000 had higher pressure values of 0.361 and 0.232 MPa, respectively, compared to section DK347 + 920. The rock pressure of three monitoring points in section DK348 + 000 continued to increase over time, while the surrounding rock pressure of the other sections remained stable.
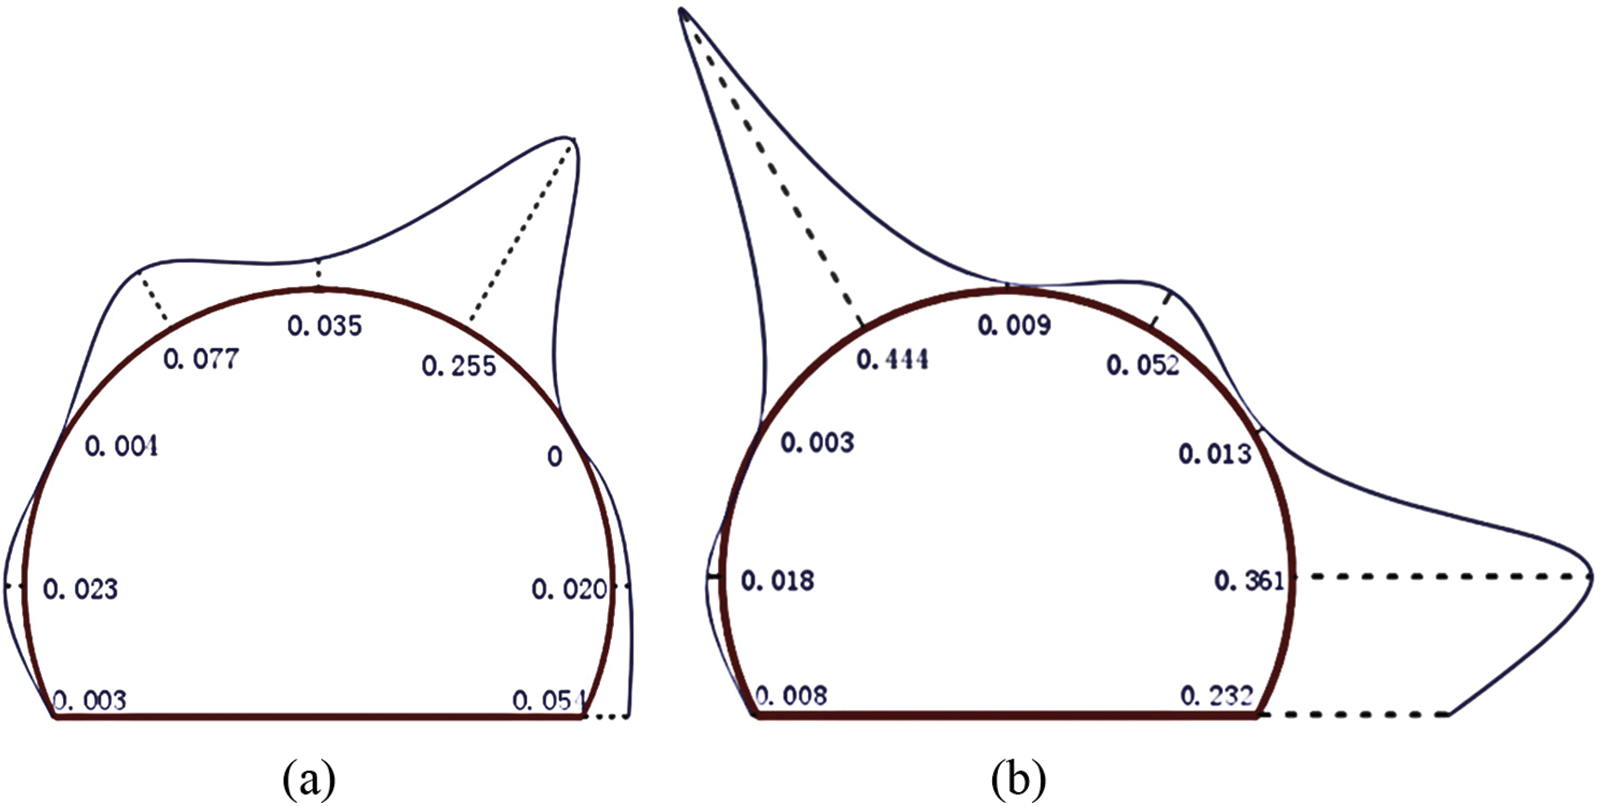
Figure 22: Stress distribution diagram of surrounding rock at different cross-sections. (a) DK347 + 920; (b) DK348 + 000 (Unit: MPa)
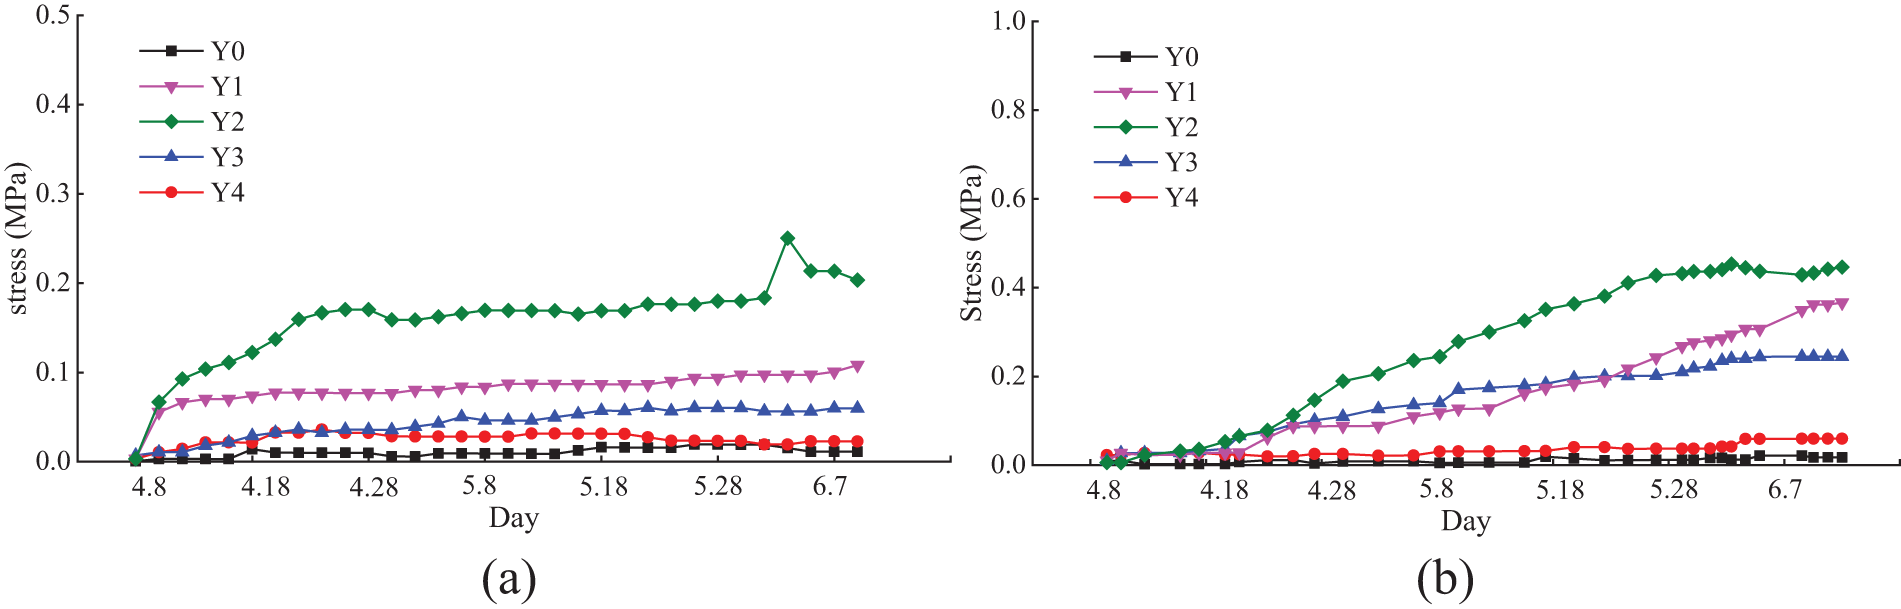
Figure 23: Temporal curves of surrounding rock pressure at different cross-sections. (a) DK347 + 920; (b) DK348 + 000
4.2 Displacement Monitoring Results
In order to study and reveal the settlement law of tunnel displacement, settlement monitoring of the tunnel crown was conducted in five sections. Among these sections, DK347 + 860, DK347 + 880, and DK347 + 900 was selected for analysis to provide more targeted research. Fig. 24 displays the temporal curve of tunnel vault settlement. The displacement settlement law of the three cross-section monitoring points of the tunnel was found to be consistent upon comparing Figs. 24a–24c. The displacement settlement showed a sharp increase in the initial stages of tunnel excavation, however, with the passage of time, the settlement rate gradually slowed down and eventually stabilized across all three monitoring sections. During the first week of excavation, the tunnel face had the highest settlement rate at the crown, with a maximum value of 2.5 mm/d. However, the rate gradually decreased over the next 20 days until it reached a stable point, with no significant changes in settlement value.
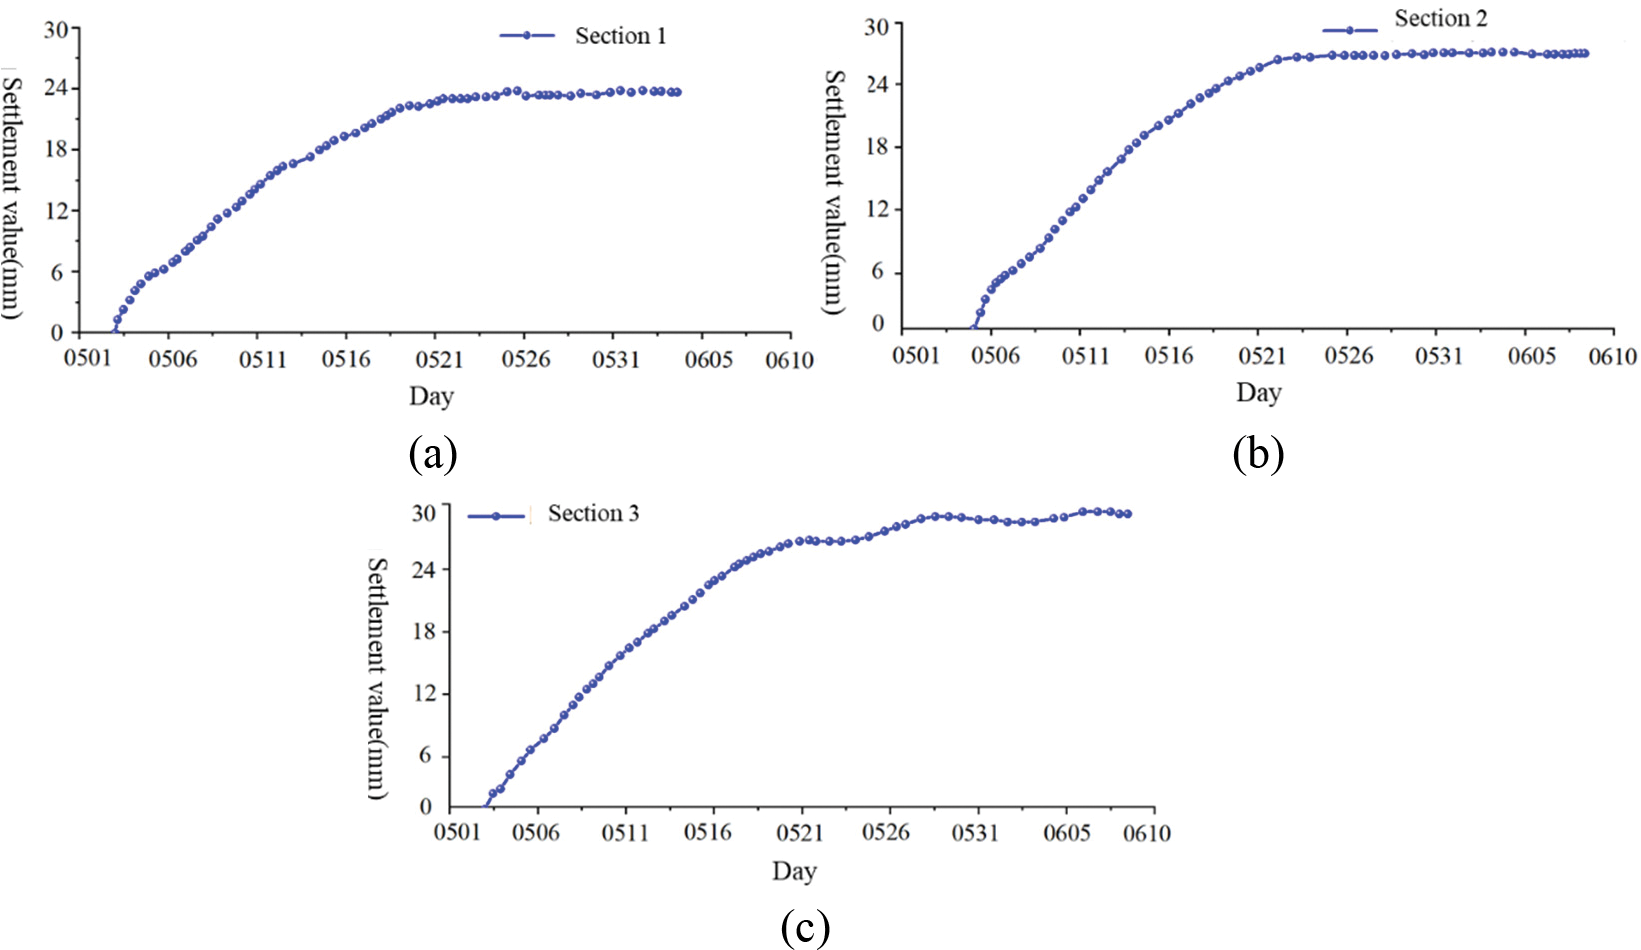
Figure 24: Temporal curve of arch sinking at different sections. (a) DK347 + 860; (b) DK347 + 880; (c) DK347 + 900
4.3 Numerical Simulation Comparative Analysis
4.3.1 Comparative Analysis of Surrounding Rock Stress
Fig. 25 displays the data collected through on-site monitoring was found to be small in comparison to the numerical simulation calculations. However, the data was consistent with the simulations. Upon comparing the two sets of data, it was discovered that the on-site monitoring was conducted after the construction had already taken place, leading to a delay in the monitoring process. The monitoring point stopped recording the original pressure, so the data collected only reflected the pressure after release. Additionally, when conducting numerical simulations, conservative parameters were selected to ensure project safety. This approach allowed for simulation results to be used as a guide for engineering purposes. The pressure on the surrounding rock of the tunnel arch often becomes smaller due to the release of stress. However, in engineering sites, monitoring and measurement on site only begin after the stress of the tunnel surrounding rock is released, resulting in a simulation result that is too high. Considering measurement errors, the numerical simulation results may be smaller than the on-site monitoring values, but the difference is not significant.
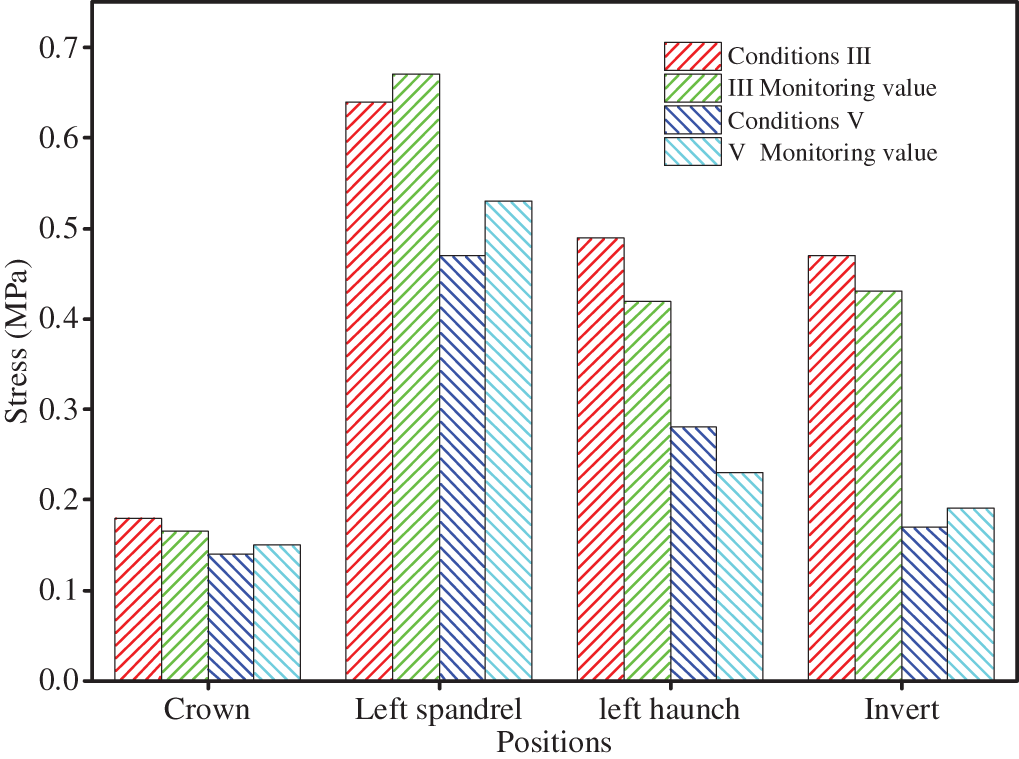
Figure 25: Stress comparison analysis
4.3.2 Displacement Comparison Analysis
This study analyzed the monitoring data of crown settlement, invert uplift, and headroom convergence deformation of typical sections in cross-fault tunnels. The data was collected through on-site monitoring and simulation results were also taken into consideration. Fig. 26 displays the tunnel deformation settlement results and stress results showed a similar variation law, where the data obtained through on-site monitoring was smaller than that obtained through numerical simulation. However, the overall trend of settlement was consistent between the on-site monitoring data and the numerical simulation calculation results.
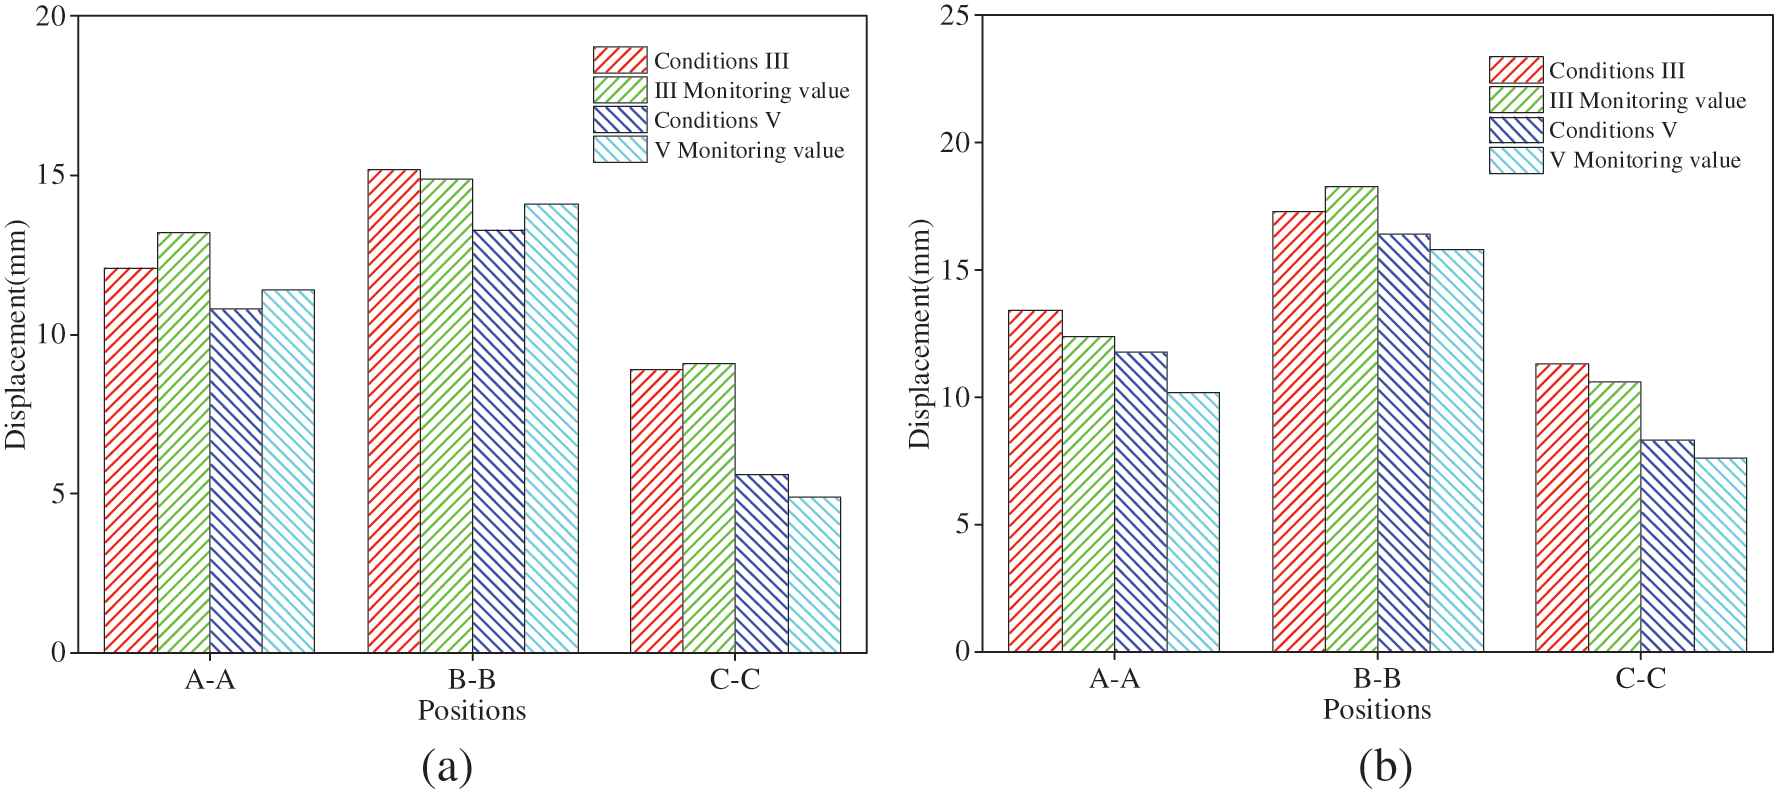
Figure 26: Comparison of displacements at different positions. (a) Invert; (b) crown
In conclusion, it can be seen that when tunnels cross faults, they often have large deformation characteristics. This characteristic is manifested in large deformation, normal and rapid initial deformation rate, and long deformation duration [32,33]. When the initial support is applied to the surrounding rock of the tunnel, the pressure of the surrounding rock can quickly reach a stable state. In this state, after the secondary lining is applied, the stress will still increase slowly to a small extent, but this growth develops slowly and can maintain a state of balance [34,35]. By comparing the results of on-site visual inspection, after the support and secondary lining are applied to the tunnel, the surrounding rock and lining surface are good, without large deformation and cracking, and the large deformation of the surrounding rock of the tunnel crossing the fault can be well controlled and maintained stable. Therefore, through the long-term monitoring and real-time observation of the tunnel site, data support can be provided for the safe construction and support of the tunnel.
During cross-fault tunnel excavation, the surrounding rock at the fracture zone may fall or collapse, causing large deformation. Therefore, appropriate reinforcement measures must be taken to prevent such occurrences. The deformation and stress control effect of the surrounding rock of the center diaphragm method were determined to be the best through the study of tunnel excavation and grouting methods using the finite element method. Additionally, the study provided the optimal grouting range and thickness. The accuracy and rationality of the numerical simulation results were verified by the fact that the on-site monitoring data was slightly smaller than the numerical simulation data in comparison to the construction site of the cross-fault tunnel.
The physical properties of the surrounding rock of cross-fault tunnels are poor, which weakens the interaction between the tunnel and the surrounding rock. The bench method and ring cut method require multiple step excavations, which can increase disturbances to the surrounding rock and result in poor control over crushing the surrounding rock. The center diaphragm method involves forming a closed unit after excavating and supporting the palm surface. This method promotes stability in the surrounding rock and minimizes headroom displacement and surface settlement. During engineering projects, monitoring and measurement of the site begins after the stress of the tunnel’s surrounding rock is released, which can result in significant simulation outcomes. The data obtained through on-site monitoring and numerical simulation calculations were consistent in terms of the overall trend. During the initial stages of tunnel excavation, the stress of the surrounding rock was released, leading to a gradual increase in stress and deformation with the progress of excavation.
When selecting the excavation method for cross-fault tunnels, it is important to consider various factors such as the characteristics of surrounding rock, tunnel burial depth, and geological characteristics. Based on these factors, the appropriate excavation method should be chosen [36–38]. In the area passing through the fault fracture zone, due to the poor physical properties of the surrounding rock, common construction methods such as the bench method are no longer applicable, and center diaphragm method forms a closed unit after excavating and supporting the face. This method is suitable for areas with poor surrounding rock properties, improves the stability of surrounding rock, and effectively reduces headroom displacement and surface settlement. For the stability of the surrounding rock in the fault area, it is necessary to study the reinforcement measures, and the grouting reinforcement method is widely used, but for the fault area, the grouting range and grouting thickness have a great influence on the reinforcement strength.
The center diaphragm method demonstrated superior stress and deformation control of surrounding rock, with a thorough analysis of its deformation control effect. A tunnel composite control advanced grouting design method was proposed based on advanced grouting reinforcement and on-site monitoring and measurement. The research results presented in this study provide technical references for designing, constructing, and supporting cross-fault tunnels. In future research, physical model tests of large-scale cross-fault tunnel excavations should be carried out more effectively to simulate on-site tunnel excavation. Additionally, the numerical simulation analysis results presented in this paper could be compared and analyzed for mutual verification.
This paper presents multiple numerical calculation models for cross-fault tunnel excavation. The study investigates the deformation control effect of surrounding rock for three excavation methods and analyzes the grouting reinforcement effect. The paper comparatively studies the deformation law of surrounding rock, stress distribution of surrounding rock, and initial support contact pressure. Based on the analysis, the paper draws specific conclusions:
(1) The impact of faults on the deformation of the rock surrounding tunnel excavation is substantial. Among these methods, the center diaphragm method was found to be the most effective in controlling the displacement of surrounding rock in cross-fault tunnels.
(2) The excavation of a tunnel has an impact on the distribution of stress in the surrounding rock, leading to a redistribution of stress and varying stress distribution patterns at different points along the tunnel. With the center diaphragm method, both the crown and spandrel were under tensile stress, while the arch foot experienced the most compressive stress.
(3) When comparing the reinforcement effects of grouting with different ranges, it was found that the maximum settlement displacement of the crown was reduced by 32.8%, 40.7%, and 42.6% in the 120°, 140°, and 160° annular grouting ranges, respectively, when compared to the grouted reinforcement condition. As the grouting range increases, the displacement deformation of the surrounding rock gradually decreases. The optimal angle for grouting range is 140°.
(4) When compared to the grouted reinforcement condition, the maximum uplift displacement of the invert decreased by 7.3%, 13.7%, and 19.1% for grouting thicknesses of 0.6, 1.0, and 1.4 m, respectively. Additionally, the maximum settlement displacement of the crown decreased by 10.2%, 38.9%, and 40.8% for the same thicknesses. Based on the findings, a grouting thickness of 1 m was determined to be optimal.
(5) By comparing the on-site inspection results, after the tunnel is supported by grouting and secondary lining, there is no large deformation and cracking of the surrounding rock and lining, and the large deformation of the surrounding rock of the tunnel crossing the fault can be well controlled and kept stable. The long-term monitoring and real-time observation of the tunnel site can provide data support for the safe construction and support of the tunnel.
Acknowledgement: The authors wish to express their appreciation to the reviewers for their helpful suggestions which greatly improved the presentation of this paper.
Funding Statement: This work was supported by the Postgraduate Research and Practice Innovation Program of Jiangsu Province (Grant No. KYCX22_0621), the National Natural Science Foundation of China (Grant No. 52209130) and was also supported by Jiangsu Funding Program for Excellent Postdoctoral Talent.
Author Contributions: The authors confirm contribution to the paper as follows: study conception and design: Duan Zhu, Cong Zhang; data collection: Zhende Zhu; analysis and interpretation of results: Duan Zhu, Lun Dai; draft manuscript preparation: Duan Zhu, Baotian Wang. All authors reviewed the results and approved the final version of the manuscript.
Availability of Data and Materials: The data that support the findings of this study are available from the corresponding author upon reasonable request.
Conflicts of Interest: The authors declare that they have no conflicts of interest to report regarding the present study.
Reference
1. Shi, P., Zhang, D., Pan, J., Liu, W. (2016). Geological investigation and tunnel excavation aspects of the weakness zones of Xiang’an subsea tunnels in China. Rock Mechanics and Rock Engineering, 49(12), 1–15. https://doi.org/10.1007/s00603-016-1076-z [Google Scholar] [CrossRef]
2. Tu, H., Zhou, H., Qiao, C., Gao, Y. (2020). Excavation and kinematic analysis of a shallow large-span tunnel in an up- soft/low-hard rock stratum. Tunnelling and Underground Space Technology, 97(3), 103245. https://doi.org/10.1016/j.tust.2019.103245 [Google Scholar] [CrossRef]
3. Zhang, C., Zhu, Z. D., Wang, S. Y. (2023). Macro-micro mechanical properties and reinforcement mechanism of alkali-resistant glass fiber-reinforced concrete under alkaline environments. Construction and Building Materials, 368, 130365. https://doi.org/10.1016/j.conbuildmat.2023.130365 [Google Scholar] [CrossRef]
4. Li, S. C., Liu, H. L., Li, L. P., Zhang, Q. Q., Wang, K. (2016). Large scale three-dimensional seepage analysis model test and numerical simulation research on undersea tunnel. Applied Ocean Research, 59, 510–520. https://doi.org/10.1016/j.apor.2016.07.013 [Google Scholar] [CrossRef]
5. Zhang, C., Zhu, Z. D., Wang, S. Y. (2023). Seismic response and deformation mechanism of fault-crossing deep tunnels in a strong earthquake area. Acta Geotechnica, 18, 4847–4869. https://doi.org/10.1007/s11440-023-01881-w [Google Scholar] [CrossRef]
6. Xiong, Z., Zhou, X., Zhao, J., Cui, H., Wang, B. (2023). Study on crack propagation parameters of tunnel lining structure based on peridynamics. Computer Modeling in Engineering & Sciences. https://doi.org/10.32604/cmes.2023.023353 [Google Scholar] [CrossRef]
7. Deng, S. J., He, Y., Gong, X. N., Zhou, J. J., Hu, X. D. (2022). A hybrid regional model for predicting ground deformation induced by large-section tunnel excavation. Computer Modeling in Engineering & Sciences, 134(1), 495–516. https://doi.org/10.32604/cmes.2022.020386 [Google Scholar] [CrossRef]
8. Sato, R. (2009). Crustal deformation due to dislocation in a multi-layered medium. Earth Planets and Space, 19(1), 31–46. https://doi.org/10.4294/jpe1952.19.31 [Google Scholar] [CrossRef]
9. Kumar, A., Singh, S. J., Singh, J. (2005). Deformation of two welded elastic half-spaces due to a long inclined tensile fault. Journal of Earth System Science, 114(1), 97–103. https://doi.org/10.1007/BF02702012 [Google Scholar] [CrossRef]
10. Zhou, B., Xiong, Y. X., Yang, Y. B., Jiang, C. J. (2012). A novel vibration-based structure health monitoring approach for the shallow buried tunnel. Computer Modeling in Engineering & Sciences, 86(4), 321–348. https://doi.org/10.1061/(ASCE)MT.1943-5533.0000478 [Google Scholar] [CrossRef]
11. Cui, G. Y., Ma, J. F., Wang, D. Y. (2021). A large 3D laboratory test on the deformation characteristic of shallow loess tunnel under different plastic states. Bulletin of Engineering Geology and the Environment, 80(10), 7577–7590. https://doi.org/10.1007/s10064-021-02375-3 [Google Scholar] [CrossRef]
12. Arora, K., Gutierrez, M., Hedayat, A. (2021). Time-dependent behavior of the tunnels in squeezing ground: An experimental study. Rock Mechanics and Rock Engineering, 54(4), 1755–1777. https://doi.org/10.1007/s00603-021-02370-w [Google Scholar] [CrossRef]
13. Liu, X. R., Suliman, L., Zhou, X. H., Wang, J. W., Wang, L. F. (2022). Settlement characteristic due to excavate parallel tunnels in a fill-rock slope: Model test and numerical analysis. Rock Mechanics and Rock Engineering, 55(11), 7125–7143. https://doi.org/10.1007/s00603-022-02961-1 [Google Scholar] [CrossRef]
14. Han, H., Liu, H., Chan, A., Mcmanus, T. (2019). Three-dimensional finite element modelling of excavation-induced tunnel wall movement and damage: A case study. Sadhana, 44(8). https://doi.org/10.1007/s12046-019-1167-0 [Google Scholar] [CrossRef]
15. Su, D., Kang, Y., Wang, X., Zheng, A., Yan, F. (2016). Analysis and numerical simulation for tunnelling through coal seam assisted by water jet. Computer Modeling in Engineering & Sciences, 111(5), 375–393. [Google Scholar]
16. Sun, W., Min, H., Chen, J., Ruan, C., Wang, L. (2021). Numerical analysis of three-layer deep tunnel composite structure. Computer Modeling in Engineering & Sciences, 127(1), 223–239. https://doi.org/10.32604/cmes.2021.015208 [Google Scholar] [CrossRef]
17. Kim, Y., Moon, J. S. (2020). Change of groundwater inflow by cutoff grouting thickness and permeability coefficient. Geomechanics and Engineering, 21(2), 165–170. https://doi.org/10.12989/gae.2020.21.2.165 [Google Scholar] [CrossRef]
18. Luo, W., Yuan, D., Jin, D., Ping, L., Jiang, C. (2021). Optimal control of slurry pressure during shield tunnelling based on random forest and particle swarm optimization. Computer Modeling in Engineering & Sciences, 128(1), 109–127. https://doi.org/10.32604/cmes.2021.015683 [Google Scholar] [CrossRef]
19. Zhang, C., Zhu, Z. D., Wang, S. Y. (2021). Stress wave propagation and incompatible deformation mechanisms in rock discontinuity interfaces in deep-buried tunnels. Deep Underground Science and Engineering, 1, 1–15. https://doi.org/10.1002/dug2.12016 [Google Scholar] [CrossRef]
20. Xu, X., Wu, Z., Sun, H., Wang, L., Li, Q. (2021). An extended numerical manifold method for simulation of grouting reinforcement in deep rock tunnels. Tunnelling and Underground Space Technology, 115(2), 104020. https://doi.org/10.1016/j.tust.2021.104020 [Google Scholar] [CrossRef]
21. Lee, J. S., Sagong, M., Park, J., Choi, I. (2020). Experimental analysis of penetration grouting in umbrella arch method for tunnel reinforcement. International Journal of Rock Mechanics and Mining Sciences, 130, 104346. https://doi.org/10.1016/j.ijrmms.2020.104346 [Google Scholar] [CrossRef]
22. Zhang, J. P., Liu, L. M., Li, Q. H., Peng, W., Zhan, F. T. et al. (2019). Development of cement-based self-stress composite grouting material for reinforcing rock mass and engineering application. Construction and Building Materials, 201(20), 314–327. https://doi.org/10.1016/j.conbuildmat.2018.12.143 [Google Scholar] [CrossRef]
23. Yang, J. S., Zhang, C., Fu, J. Y., Wang, S. Y., Ou, X. F. et al. (2020). Pre-grouting reinforcement of underwater karst area for shield tunneling passing through Xiangjiang river in Changsha, China. Tunnelling and Underground Space Technology, 100, 103380. https://doi.org/10.1016/j.tust.2020.103380 [Google Scholar] [CrossRef]
24. Huang, H. W., Hua, Y. S., Zhang, D. M., Wang, L. J., Yan, J. Y. (2016). Deformational responses of operated shield tunnel to extreme surcharge: A case study. Structure and Infrastructure Engineering, 13(3), 345–360. https://doi.org/10.1016/j.tust.2022.104929 [Google Scholar] [CrossRef]
25. Fan, L., Xu, Q., Lai, J. X., Liu, T., Zhu, Z. J. et al. (2023). Stability of the loess tunnel foundation reinforced by jet grouting piles and the influence of reinforcement parameter. Transportation Geotechnics, 40, 100965. https://doi.org/10.1016/j.trgeo.2023.100965 [Google Scholar] [CrossRef]
26. Lim, A., Ou, C. Y. (2017). Stress paths in deep excavations under undrained conditions and its influence on deformation analysis. Tunnelling and Underground Space Technology, 63, 118–132. https://doi.org/10.1016/j.tust.2016.12.013 [Google Scholar] [CrossRef]
27. Merifield, R. S., Goodall, S. A. (2021). Mcfarlane finite element modelling to predict the settlement of pile groups founded above compressible layers. Computers and Geotechnics, 134(3), 104139. https://doi.org/10.1016/j.compgeo.2021.104139 [Google Scholar] [CrossRef]
28. Mu, L., Huang, M. (2016). Small strain-based method for predicting three-dimensional soil displacements induced by braced excavation. Tunnelling and Underground Space Technology, 52(2), 12–22. https://doi.org/10.1016/j.tust.2015.11.001 [Google Scholar] [CrossRef]
29. Kawa, M., Pula, W., Truty, A. (2021). Probabilistic analysis of the diaphragm wall using the hardening soil-small (HSS) model. Engineering Structures, 232(1), 111869. https://doi.org/10.1016/j.engstruct.2021.111869 [Google Scholar] [CrossRef]
30. Xie, C. Y., Nguyen, H., Choi, Y., Armaghani, D. J. (2022). Optimized functional linked neural network for predicting diaphragm wall deflection induced by braced excavations in clays. Geoscience Frontiers, 13(2), 101313. https://doi.org/10.1016/j.gsf.2021.101313 [Google Scholar] [CrossRef]
31. Zhu, D., Zhu, Z. D., Zhang, C., Dai, L. (2023). Dynamic response and progressive damage modes of fault-crossing tunnels simulated using similar materials. Materials Express, 13(8), 1445–1458. https://doi.org/10.1166/mex.2023.2487 [Google Scholar] [CrossRef]
32. Zaheri, M., Ranjbarnia, M., Dias, D. (2020). 3D numerical investigation of segmental tunnels performance crossing a dip-slip fault. Geomechanics and Engineering, 23(4), 351–364. https://doi.org/10.12989/gae.2020.23.4.351 [Google Scholar] [CrossRef]
33. Bao, H., Liu, C. Q., Liang, N., Lan, H. X., Yan, C. G. et al. (2022). Analysis of large deformation of deep-buried brittle rock tunnel in strong tectonic active area based on macro and microcrack evolution. Engineering Failure Analysis, 138, 106351. https://doi.org/10.1016/j.engfailanal.2022.106351 [Google Scholar] [CrossRef]
34. Tian, N., Lan, H. (2023). The indispensable role of resilience in rational landslide risk management for social sustainability. Geography and Sustainability, 4(1), 70–83. https://doi.org/10.1016/j.geosus.2022.11.007 [Google Scholar] [CrossRef]
35. Wang, Y., Jing, H., Su, H., Xie, J. (2016). Effect of a fault fracture zone on the stability of tunnel-surrounding rock. American Society of Civil Engineers, 17(6), 1–20. https://doi.org/10.1061/(ASCE)GM.1943-5622.0000837 [Google Scholar] [CrossRef]
36. Jin, C., Kim, M. (2021). The effect of key design parameters on the global performance of submerged floating tunnel under target wave and earthquake excitations. Computer Modeling in Engineering & Sciences, 128(1), 315–337. https://doi.org/10.32604/cmes.2021.016494 [Google Scholar] [CrossRef]
37. Sharifzadeh, M., Kolivand, F., Ghorbani, M., Yasrobi, S. (2013). Design of sequential excavation method for large span urban tunnels in soft ground—Niayesh tunnel. Tunnelling and Underground Space Technology Incorporating Trenchless Technology Research, 35, 178–188. https://doi.org/10.1016/j.tust.2013.01.002 [Google Scholar] [CrossRef]
38. Li, P. (2015). Displacement characteristics of high-speed railway tunnel construction in loess ground by using multi-step excavation method. Tunnelling and Underground Space Technology, 51, 41–55. https://doi.org/10.1016/j.tust.2015.10.009 [Google Scholar] [CrossRef]
Cite This Article
 Copyright © 2024 The Author(s). Published by Tech Science Press.
This work is licensed under a Creative Commons Attribution 4.0 International License , which permits unrestricted use, distribution, and reproduction in any medium, provided the original work is properly cited.
 Downloads
 Citation Tools