
 Submit a Paper
 Propose a Special lssue
 Open Access
ARTICLE

Influences of the Fresh Air Volume on the Removal of Cough-Released Droplets in a Passenger Car of a High-Speed Train Using CFD
1 CRRC Changchun Railway Vehicles Co., Ltd., Changchun, 130062, China
2 Key Laboratory of Traffic Safety on Track, Ministry of Education, School of Traffic & Transportation Engineering, Central South University, Changsha, 410075, China
3 College of Mechanical and Vehicle Engineering, Hunan University, Changsha, 410082, China
* Corresponding Author: Yibin Lu. Email:
Computer Modeling in Engineering & Sciences 2024, 138(3), 2727-2748. https://doi.org/10.32604/cmes.2023.031341
Received 05 June 2023; Accepted 01 August 2023; Issue published 15 December 2023
 View Full Text
 Download PDF
Abstract
The spread and removal of pollution sources, namely, cough-released droplets in three different areas (front, middle, and rear areas) of a fully-loaded passenger car in a high-speed train under different fresh air flow volume were studied using computational fluid dynamics (CFD) method. In addition, the structure of indoor flow fields was also analysed. The results show that the large eddies are more stable and flow faster in the air supply under Mode 2 (fresh air volume: 2200 m3/h) compared to Mode 1 (fresh air volume: 1100 m3/h). By analysing the spreading process of droplets sprayed at different locations in the passenger car and with different particle sizes, the removal trends for droplets are found to be similar under the two air supply modes. However, when increasing the fresh air flow volume, the droplets in the middle and front areas of the passenger car are removed faster. When the droplets had dispersed for 60 s, Mode 2 exhibited a removal rate approximately 1%–3% higher than Mode 1 for small and medium-sized droplets with diameters of 10 and 50 μm. While those in the rear area, the situation is reversed, with Mode 1 slightly surpassing Mode 2 by 1%–3%. For large droplets with a diameter of 100 μm, both modes achieved a removal rate of over 96% in all three regions at the 60 s. The results can provide guidance for air supply modes of passenger cars of high-speed trains, thus suppressing the spread of virus-carrying droplets and reducing the risk of viral infection among passengers.Keywords
The coronavirus 2019 (COVID-19) pandemic has killed more than six million people across the world since its outbreak towards the end of 2019 and has severely impeded many aspects of socio-economic [1]. Furthermore, variants of the virus are still affecting many people and countries [2]. COVID-19 is in essence an infectious respiratory disease that is very likely to be transmitted through the air by attachment of the virus to respiratory droplets and aerosols [3]. The designed air-tightness and large number of passengers mean that high-speed trains have become places extremely likely to cause transmission and spread of such a virus [4]. In such a context, studying the flow distribution as well as the spread of droplets and particulates in passenger cars of high-speed trains is of significance when trying to reduce the infection risk of passengers, drivers, and crew and containing transmission of the coronavirus virus.
At present, existing research on droplet spread mainly focuses on interior buildings and cabins, while a few studies concentrate on the environment in passenger cars. Szekeres et al. [5] developed a new air-ventilation service element to modify the properties of the ceiling diffusers in the building, and found that the improved office layout of the island of four has the largest volume percentage of primary air, which is 21.41%. By measuring and analyzing the spread of cough-released droplets in rooms with different ventilation conditions, Somsen et al. [6] found that in the best ventilated room, after 30 s the number of droplets had halved, whereas, in a poorly ventilated room, it takes 1.4 min. Ren et al. [7] utilized the numerical method to study the performance of several typical ventilation strategies in an office and evaluated the infection risk, found that the stratum ventilation (SV) showed greater performance in mitigating infection disease spread, with an air distribution performance index (ADPI) of 90.5% and minimum infection risk of 13%. Kong et al. [8] proposed a new type of ventilation system based on the concept that the overall space is organized by annular airflow and the local area is direct airflow, which reduced the infection risk by 27% compared with a side wall mixing ventilation system. Talaat et al. [9] demonstrated that a relatively small fraction (21%–26%) of exhaled particles are directly removed by the ventilation system, while the majority of the particles deposit on surfaces in the cabin of a Boeing 737 aircraft. Yang et al. [10] studied the droplet dispersion carrying viruses/bacteria in enclosed/crowded buses. According to the research, regular cleaning is recommended since 85%–100% of droplets deposit on object surfaces. Lai et al. [11] presented a comprehensive modelling study on the indoor airflow characteristics of the cough-induced droplets by utilizing the multiphase large-eddy simulations based on the smoothed particle hydrodynamics (SPH) method, and found that the complex vortex structure of cough is capable of pushing the virus-laden droplets move further, of which spreading distance may be more than the rules of the traditional social distance.
As high-speed trains gradually become an important choice for people’s travel, scholars in China and abroad have conducted numerous investigations on droplet spread in passenger cars of high-speed trains. Armand et al. [12] studied a scenario where a seated passenger in a train infected with the SARS-CoV-2 virus releases droplets ranging from 1 to 1000 μm. They concluded that these droplets tend to fall near the infected passenger and are carried by airflow into various areas of the rail coach. Based on data about COVID-19 infections related to trains from 2019 to 2020, Zhao et al. [13] found a highly significant correlation between travel by trains and COVID-19 infected cases, accounting for 68.72% of the infections caused by transportation. Yang et al. [14] discovered that the CRH3-oriented and CRH5-oriented cabin diffusers exhibit relatively small average and variance values of particles’ averaged volume fraction. This finding suggests that these diffusers demonstrate a satisfactory particle distribution performance within the breathing zone. Xu et al. [15] found that for the typically separated seating design in a high-speed train’s passenger compartment, in the transverse direction, at least 69% of the released droplets will remain on the releasing side.
According to previous studies, increasing the fresh air volume in the indoor environment will contribute to the removal of droplet particles. Liu et al. [16] conducted simulations and calculations to analyze the PMV (predicted mean vote) distribution of the subway train under various passenger loads and air-supply-volume conditions. The results indicated that simply increasing the air-supply volume would not be enough to achieve a PMV value of 0. Niu et al. [17] calculated and compared the probability of infection among indoor personnel with the virus causing COVID-19 under two different existing fresh air system operation modes, and the results indicated that the probability was less than 5%.
However, there is a lack of research articles investigating the impact of fresh air volume on flow field structure and droplet removal efficiency in high-speed trains. The long and narrow structure of high-speed trains sets them apart from conventional buildings. As a vital mode of transportation, comprehending the influence of fresh air volume on droplet transmission characteristics has emerged as a challenge. In view of this, this paper took the model of a whole fully loaded passenger car of a high-speed train as the research object. On this basis, influences of the fresh air flow volume on flow distribution in the passenger car and the spread of respiratory droplets released at typical locations of pollution sources in the front, middle, and rear areas were studied using a simulation method that has been verified experimentally. The results can provide constructive suggestions for the design of an air supply system that aims to decrease the transmission risk associated with respiratory droplets in trains.
The simplified model of the full-size passenger car of the high-speed train measuring 24.8 m ×3.0 m × 2.5 m used in the research is illustrated in Fig. 1. The air supply inlets included 38 upper ones and 28 lower ones, which were uniformly distributed on two sides of the passenger car and were outlined in blue. Four and two air exhaust outlets were separately distributed in the front and rear ends of the passenger car and highlighted. A total of 16 air return inlets were located below luggage carriers on two sides and marked in green. The distances between the upper air supply inlets, the air return inlets, and the lower air supply inlets are shown in Fig. 1. Ninety simplified human body models that reserved main human characteristics were set in 18 rows (five models labelled a, b, c, d, and f in each row along the positive y-axis direction) in the passenger car. The distance between two adjacent human models in the same row is 0.05 m, and the distance between the front and back adjacent human models is 0.98 m.
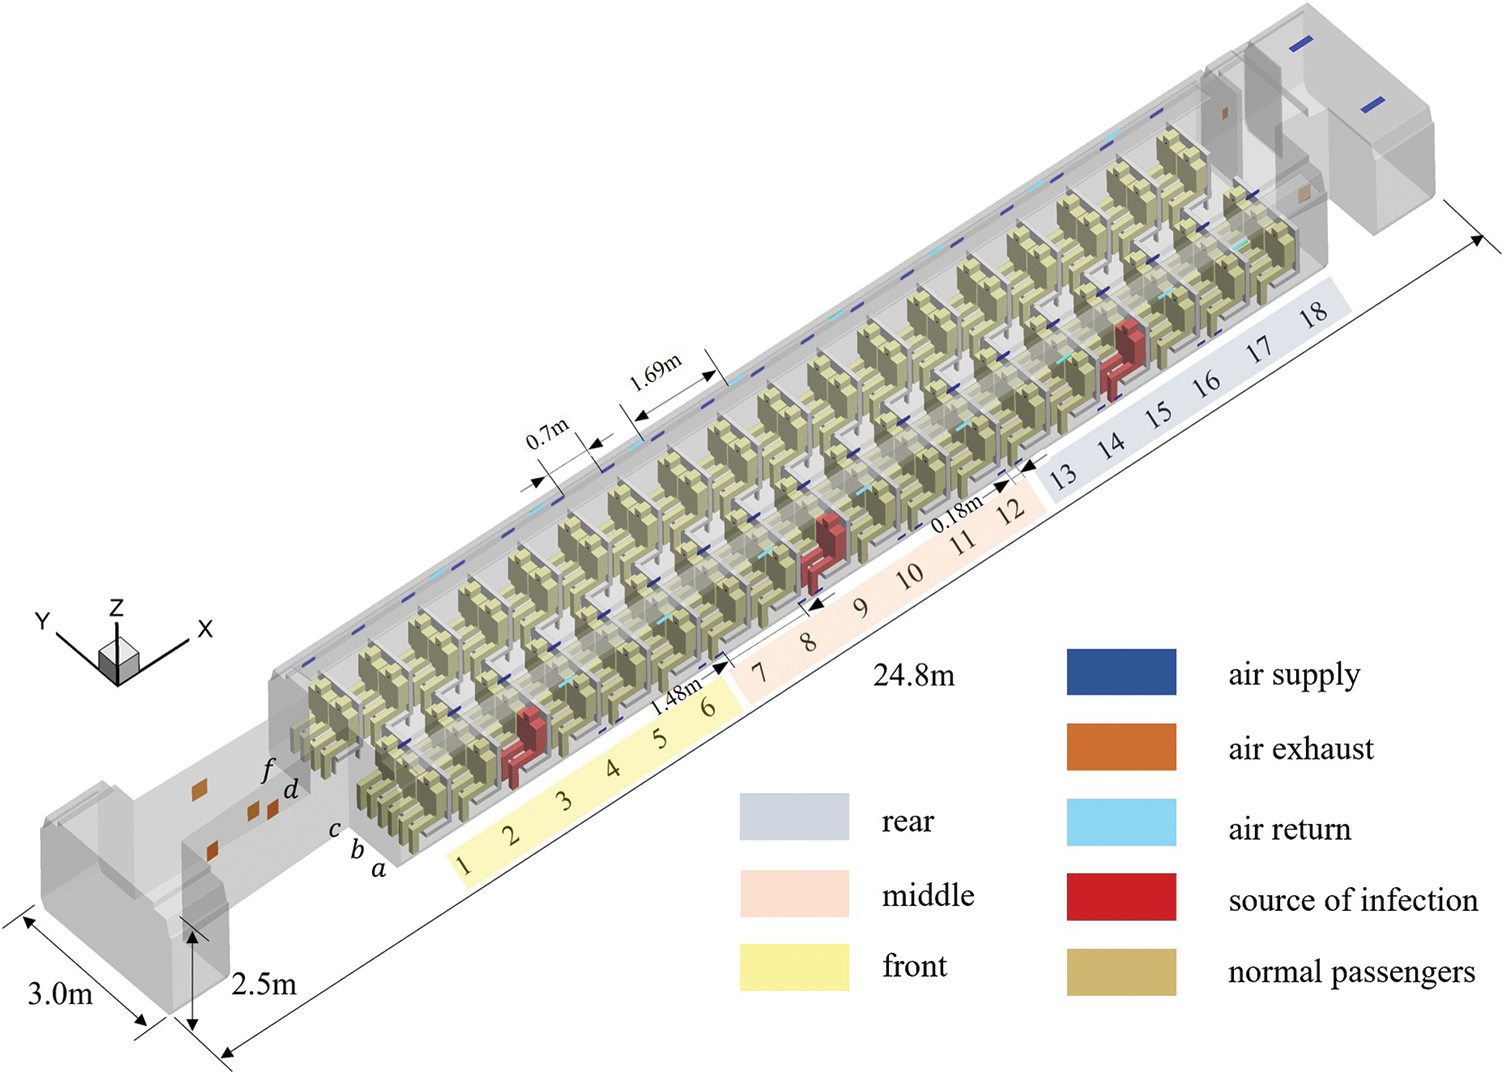
Figure 1: The model of a passenger car of a high-speed train
To study the influences of different locations of pollution sources in the passenger car on droplet spread, the passenger car was equally divided into three parts: rows 1 to 6, 7 to 12, and 13 to 18 were defined as the front, middle, and rear areas, respectively. The human body models selected as the infection sources were located at a position adjacent to the window in the middle of each area, as marked in red in Fig. 1.
It is supposed that air in the passenger car of the high-speed train is an incompressible ideal gas [18,19].
1) Air motion in the passenger car is supposed to be turbulent [20,21].
2) The cough-released droplets are supposed to be composed of water and crystalline sodium chloride in a certain ratio. After ejection from human bodies, water in the droplets begins to evaporate. The mass fractions of evaporated and unevaporated phases were 96.464% and 3.536%, respectively [22].
3) Only the influences of gravity, buoyancy, and drag on cough-released droplets are considered [23]. The drag force (FD) is expressed in Eqs. (1)–(3).
where
4) The cough-released droplets are regarded as having left the computational domain and are not involved in subsequent computation when they have settled on material surfaces or escaped from air outlets (including air return inlets).
Two different air supply modes were selected to conduct numerical simulations. The total air volume under air supply Mode 1 was 4800 m3/h, which is typical of current conditions [15]. Therein, the fresh air flow volume was 1100 m3/h and the return air volume in the passenger car of the high-speed train was 3700 m3/h. Considering that the air exchange volume increase under the epidemic environment, the fresh air volume will be increased compared with the normal Mode 1.
Currently, the air exchange capacity of the fresh air fan on high-speed trains is approximately twice that of normal conditions. Considering its air supply capacity and the energy consumption of air conditioning, Mode 2 adopts a double fresh air volume of 2200 m3/h, resulting in a total air supply volume of 5900 m3/h. The ratio of air supply volume from the upper air supply outlet to the lower air supply outlet of the air conditioning system is 3:1, which is a typical ratio for summer environments. In Mode 1, the air supply speed of the upper air supply inlets is 1.22 m/s, while the lower air supply inlets is 1.44 m/s. In Mode 2, the air supply speed of the upper air supply inlets increases to 1.50 m/s, and the lower air supply inlets increases to 1.77 m/s.
To control the air supply and return air volume, the air supply inlets and air return outlets are set as velocity inlets, wherein the direction of air return velocity is opposite to that of air supply velocity; and the air exhaust outlets were treated as pressure outlets. The air supply temperature and relative humidity are set as 18°C and 65%, respectively [15]. To simulate heat transfer from the external environment to the passenger car in summer, the two sidewalls and roof of the passenger car were deemed to be heat-transfer walls [24]. According to the national standard air conditioning design parameters for passenger cars (TB/T1951-1987), the outdoor air temperature in summer is 35°C [19] and the wall heat-transfer coefficient was 1.0 [25]. In the densely-populated small space of the passenger car, heat dissipation from human bodies may change the indoor temperature field and produce upwards thermal plumes, so anthropogenic thermal effects should also be considered. In the present research, human skin temperature was set to a constant value of 31.3°C [3,26].
After the indoor flow field reached a steady state, droplets and cough-released airflows were sprayed. Changes in the flow rates are shown in Fig. 2. Due to differences in the spread of droplets with different initial particle sizes, droplets with three different particle sizes were uniformly sprayed from the infection sources in the front, middle, and rear parts of the passenger cars [27]. The particle sizes of droplets were 10, 50, and 100 μm, which separately represented small, medium, and large cough-released droplets. For each particle size, a total of 3000 droplets were sprayed for 0.5 s. Changes in the number of droplets in the passenger car with time within 100 s were recorded since the beginning of the spraying process.

Figure 2: Changes in the flow rate of cough-released airflows with time
Three types of mesh discretization schemes are designed to verify the independence between the calculation results and the grid size. In the coarse grid scheme, the mesh size of the densified area is 0.12 mm, and the total amount is 13 million. In the medium grid scheme, the mesh size of the densified area is 0.03 mm, and the total amount is 24 million. In the fine grid scheme, the mesh size of the densified area is 0.004 mm, and the total amount is 37 million, the mesh diagram of a certain section is shown in Figs. 3a–3c, respectively. The position of the measuring line, set at the front of the chest of the ninth row of the human body, is utilized to contrast the difference in simulation results obtained by three types of grids, as shown in Fig. 4. Fig. 5 shows their calculated velocity magnitude and temperature data, the peak value and change trend of the velocity magnitude and temperature data of the medium grid scheme and the fine grid scheme is nearly consistent, while the results of the coarse grid scheme are somewhat different from those of the other two schemes. To ensure the calculation accuracy and save the calculation resources, the medium grid scheme is selected for subsequent calculation.

Figure 3: Schematic diagram of three grid schemes: (a) Coarse; (b) Medium; (c) Fine
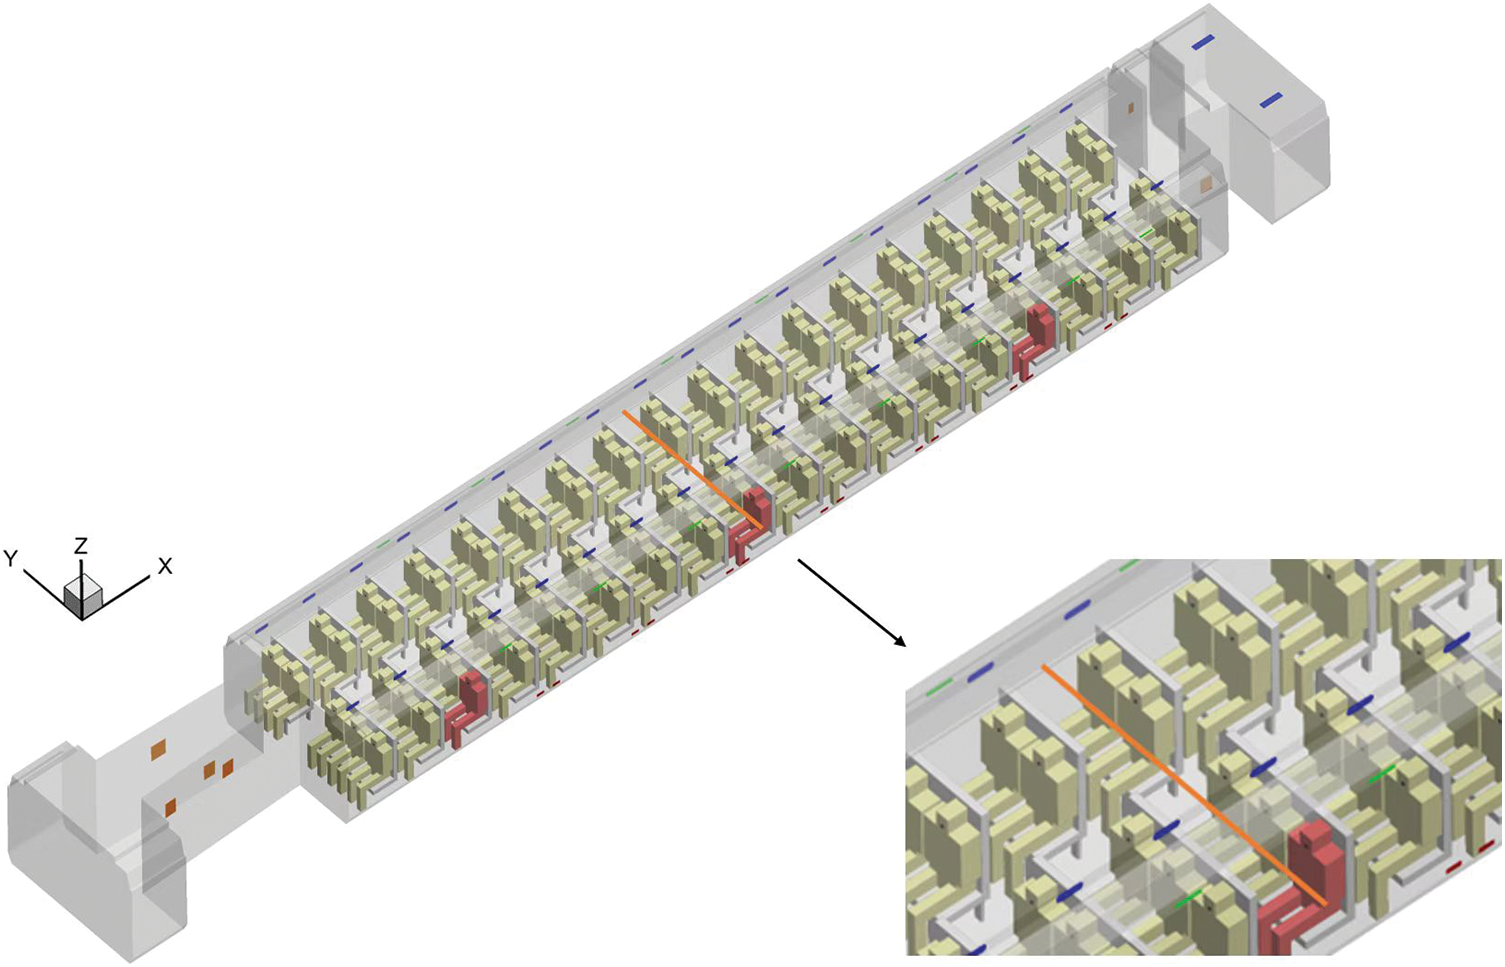
Figure 4: Display of monitoring line segment
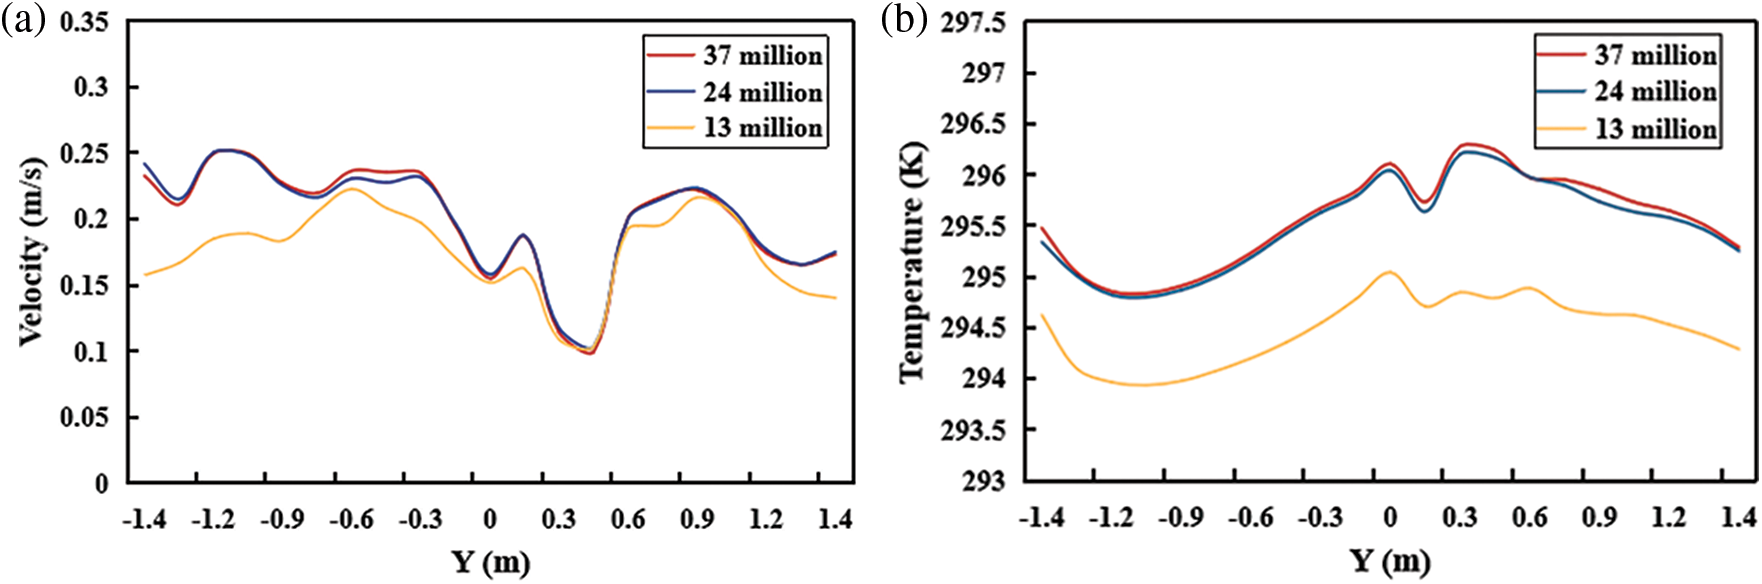
Figure 5: Velocity magnitude and temperature data curves of three grid schemes: (a) Velocity magnitude; (b) Temperature
ANSYS Fluent 2020 was adopted for numerical simulation. The discrete and continuous phases were coupled using the Eulerian-Lagrangian method. The flow distribution in the passenger car and the cough-ejection process were simulated using Euler’s method [28]. The parameters of the flow field were obtained by solving the three-dimensional N-S equation [29]. In the k-ε turbulence model, two major points make the realizable k-ε turbulence model different from the standard k-ε model: (1) A newer equation is used for the turbulent viscosity in this model; (2) The definite equation for the transport of the mean-square vorticity fluctuation is the origin of the newly determined transport formulation for the dissipation rate [30]. And excellent performance is very likely from this model for flows concerning rotation, boundary layer under strong adverse pressure gradients, separation, and recirculation [30]. Moreover, the realizable k-ε model can estimate the spreading rate of both planar and round jets more correctly [31]. Compared to the renormalization group (RNG) k-ε, the model computation time is lower [32,33]. Also, the realizable k-ε turbulence models have been widely used to simulate airflow in building interiors and train compartments in recent years [18,34]. Therefore, the realizable k-ε model was used in this study.
The Lagrangian method (discrete phase model (DPM)) was used to trace cough-released droplets in the passenger car. The multi-component model was selected as the particle model. When coupling the discrete and continuous phases, influences of mass and heat transfer caused by the evaporation of droplets as well as turbulent fluctuation in the motion of droplets were considered simultaneously. Pressure-velocity coupling of continuous phases was realized using the SIMPLE method. The convective term was spatially discretized adopting the second-order upwind scheme. The time step used in the simulation was 0.01 s, and motion information of droplets within 100 s from the onset of a given cough was summarized. Each simulation case used two CPUs with 60 cores and took approximately 80 h. The CPU type is AMD EPYC 7t83 with a basic frequency of 2.45 GHz.
The droplet spreading characteristics in the air were simulated by referring to the model proposed by Liu et al. [35], to verify the model numerically. The boundary conditions were established as follows: a nozzle with a hydraulic diameter of 0.02 m was set in a rectangular space measuring 4 m × 4 m × 3 m at the ambient temperature of 25°C and relative humidity of 0%, in which particles with the initial particle size of 20 μm were sprayed from the nozzle into the air at an initial speed of 10 m/s, as shown in Fig. 6. Fig. 6a displays the results of the model proposed by the previous study [35], while Fig. 6b displays simulation results of the current research, in which the solid lines represent the spraying boundary. The figures suggest effective verification of these results in comparison with the reference data, indicative of the rationality of the model.
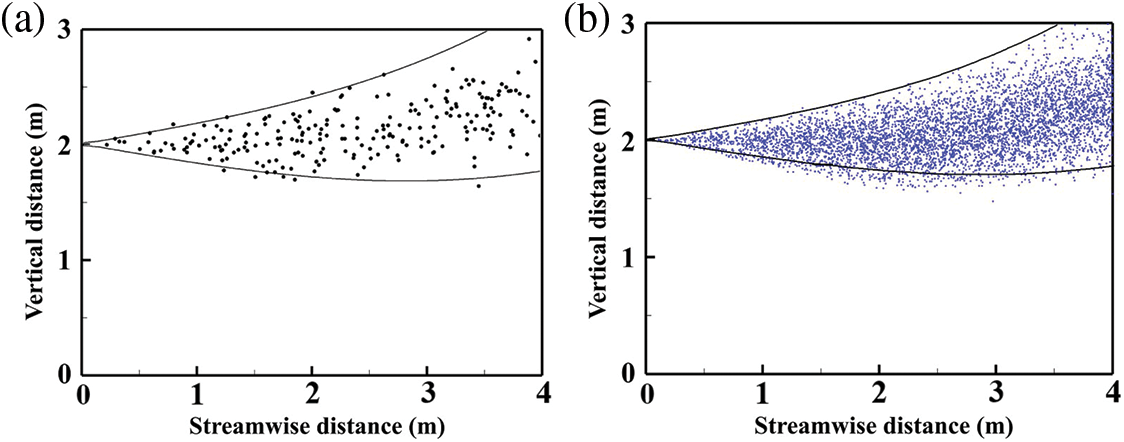
Figure 6: Numerical verification and comparison: (a) Results of previous research; (b) Results of the current research
In order to further verify the accuracy of the current numerical method for predicting the flow field in the HST, the on-site measurement data conducted on an actual train car platform of Central South University was used, and the relevant parameter settings and more details of this experiment can refer to our previous study [18]. As shown in Fig. 7a, 7 measuring points are selected on the same section to monitor the speed and temperature, which are marked as MP1-MP7. Fig. 7b shows the measuring equipment used in the experiment. Figs. 8a and 8b show the experimental data and CFD simulation results of air temperature and air velocity at monitoring points. It can be seen that for most monitoring points, the current numerical results show good consistency with the experimental data. Therefore, the numerical method in this paper has been verified and reliable and accurate results can be obtained.
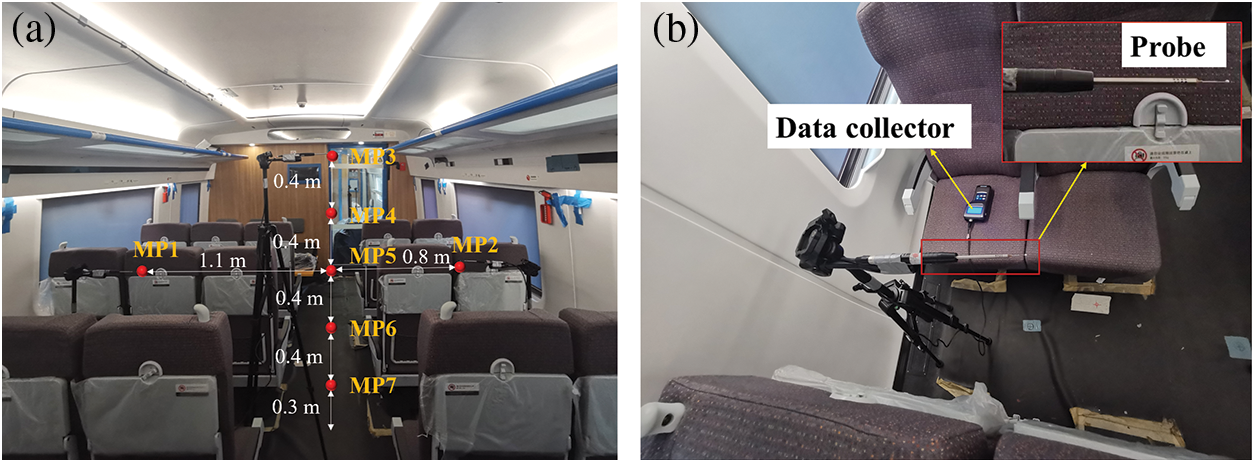
Figure 7: Airflow measurement experiments inside the compartment: (a) Layout of the monitoring points; (b) Measurement equipment

Figure 8: Air temperature and air velocity of experiment and simulation results: (a) Temperature monitoring points; (b) Velocity monitoring points
3.1 Flow Field in the Passenger Car
To reveal the flow field structure in the passenger car, three sections vertical (and normal) to the X-axis and one section vertical (and normal) to the Y-axis were selected in each air supply mode. Fig. 9 shows the locations of the sections. Therein, Section 1 was in the middle of the passenger car, while Sections 2, 3, and 4 were separately at locations 0.1 m ahead of the legs of passengers in Rows 3, 9, and 15. The contours of velocity magnitude and vector diagrams of corresponding sections in different air supply modes are illustrated in Fig. 10. Figs. 10a and 10b compare the contours of velocity magnitude in Section 1 along the x-direction in the two air supply modes. Compared with the air supply in Mode 1, the air in the front and middle areas of the passenger car in Mode 2 flows more significantly towards the front air exhaust outlets. As a result, a longitudinal airflow moving along the negative direction of the x-axis is formed in the middle of the passenger car under Mode 2. The airflow is attenuated from front to back, while the rear area of the passenger area is unaffected to any significant extent. Velocity vectors of transverse Sections 2, 3, and 4 in the two air supply modes are compared separately in Figs. 10c–10h. It can be seen from these figures that the flow distribution in the two air supply modes shows a similar structure. The upward airflows supplied in two sides of the roof encounter in the middle of the passenger car, flow downwards, and form two eddies under the influences of the walls on two sides of the passenger car and the lower wall of luggage carriers. The difference in different air supply modes lies in that Mode 2 air supply with a larger supply air volume forms more stable large eddies that flow faster. Whereas under Mode 1, the downward airflows formed after encountering upward airflows supplied in the two sides are not stable but shift and swing. In addition, the air velocity in the lower part is faster and the range of influence thereof is wider in Mode 2.
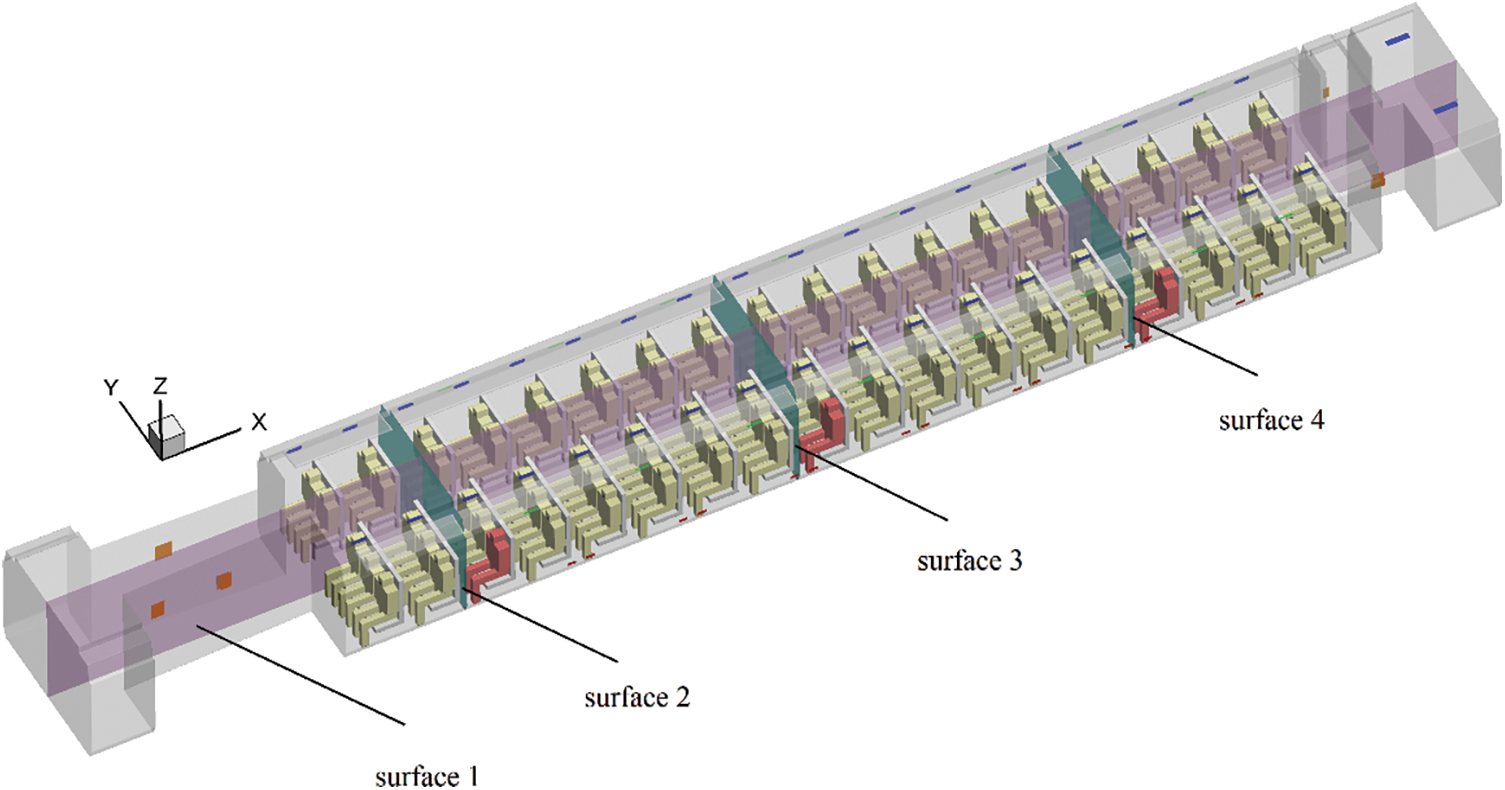
Figure 9: Locations of sections


Figure 10: Contours of velocity magnitude and vector diagrams at key sections: (a) X-direction velocity of cross-section 1 for Mode 1; (b) X-direction velocity of section 1 for Mode 2; (c) Velocity vector of cross-section 2 for Mode 1; (d) Velocity vector of cross-section 2 for Mode 2; (e) Velocity vector of cross-section 3 for Mode 1; (f) Velocity vector of cross-section 3 for Mode 2; (g) Velocity vector of cross-section 4 for Mode 1; (h) Velocity vector of cross-section 4 for Mode 2
3.2 Droplet Spreading Characteristics in the Passenger Car
3.2.1 An Infection Source at the Front of the Passenger Car
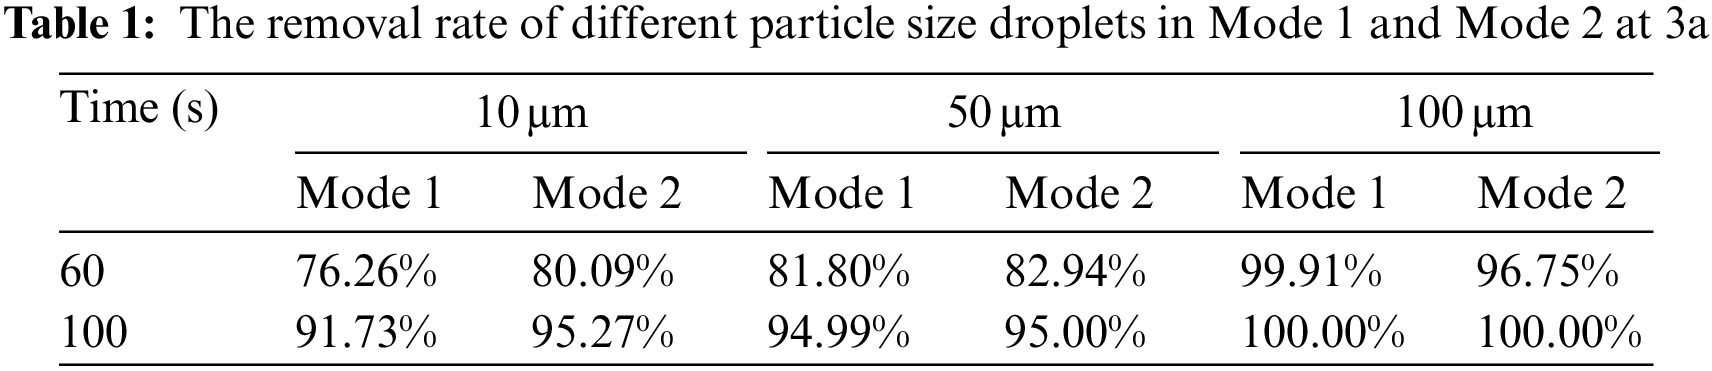
Fig. 11 shows change curves of the number of droplets released by the infection source in the front area of the passenger car (human body model 3a) with time in different air supply modes. Table 1 shows the droplet removal rates at t = 60 s and t = 100 s. In general, droplets with different particle sizes show similar removal trends in both air supply modes. Mode 2 exhibits slightly higher removal rates compared to Mode 1. Mode 2 creates a stronger longitudinal airflow in the front of the passenger car, resulting in more effective guidance for small and medium-sized droplets with particle sizes of 10 and 50 μm. This allows for their faster discharge through the front air exhaust outlets of the passenger car. At t = 60 s, Mode 2 achieved a removal rate of 80.09% and 82.94% for droplet particles of 10 and 50 μm, respectively, while Mode 1 achieved 76.26% and 81.80% for the same particle sizes. At t = 100 s, both Mode 1 and Mode 2 show consistent removal rate characteristics for 10 and 50 μm particles compared to t = 60 s. Mode 2 remains slightly faster than Mode 1. Overall, the removal rate of Mode 2 is about 1%–3% faster than Mode 1. For larger droplets with a diameter of 100 μm, their motion characteristics inside the train are primarily dominated by sedimentation. At t = 60 s, both Mode 1 and Mode 2 achieved high removal rates. Mode 2 exhibits a slightly slower removal rate compared to Mode 1. This is attributed to the presence of upward airflows near the sidewalls of the passenger car, which delay the sedimentation of larger droplets in Mode 2.
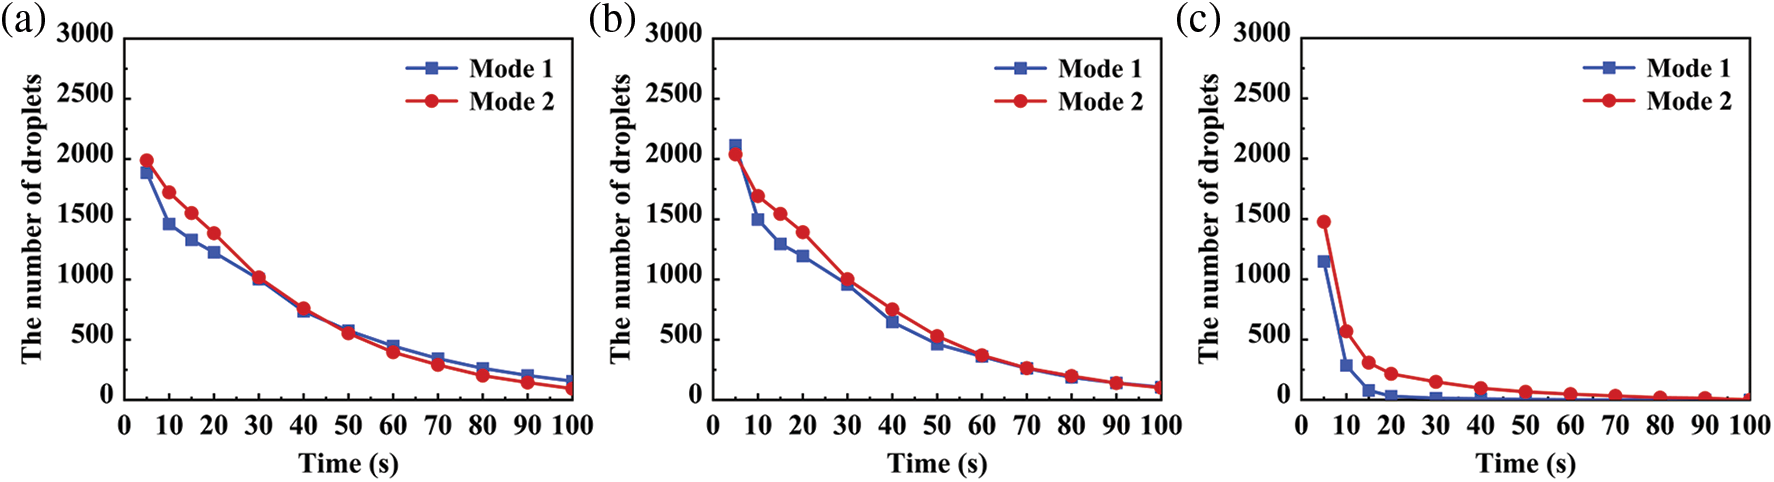
Figure 11: Changes in the number of droplets released by infection source 3a with time: (a) 10 μm; (b) 50 μm; (c) 100 μm
Figs. 12 to 14 show the diffusion of droplets of different sizes released by source 3a. In Figs. 12–14, (a) and (b) represent supply air Modes 1 and 2, respectively. Under the same supply air mode, droplets with diameters of 10 and 50 μm exhibited very similar diffusion characteristics in Figs. 12a, 13a, 12b, and 13b, respectively. However, the droplets with a diameter of 100 μm shown in Fig. 14 exhibited different diffusion characteristics compared to the first two cases. This is because larger droplets tend to settle due to the poorer flow organization of the indoor airflows. Under supply air Mode 1, at 5 s, droplets with diameters of 10 and 50 μm were found to accumulate at the 3a nozzle and spread to the front of the legs and the top of the head. This phenomenon may be due to the longitudinal airflows at the front of the train and the upward airflows near the side walls. As time passed, at 30 s, the diffusion trend became more obvious, with droplets mainly spreading laterally along the aisle. This was caused by the large eddies generated by the train’s cross-sectional flow. At 60 s, the droplets gradually spread to the front air exhaust outlets and were effectively removed. Droplets located at the top of the human body were likely to be captured and removed by the air return inlets. Under supply air Mode 2, at 5 s, the diffusion trend of droplets with diameters of 10 and 50 μm shown in Figs. 12b and 13b was similar to that under Mode 1. However, at 30 s, the droplets spread more to the front of the train compared to Mode 1, due to the increased fresh air volume in Mode 2, which affected the flow organization characteristics of the train compartment. At 60 s, the droplets continued to spread to the front of the train, and the air exhaust outlets were more effective in capturing the droplets than the air return inlets. For 100 μm droplets, as shown in Fig. 14, a few droplets under Mode 2 were captured by the longitudinal airflow and then spread to the front of the train due to the stronger longitudinal airflow compared to Mode 1.

Figure 12: Spread and distribution of droplets with a particle size of 10 μm released by the infection source 3a: (a) Mode 1; (b) Mode 2
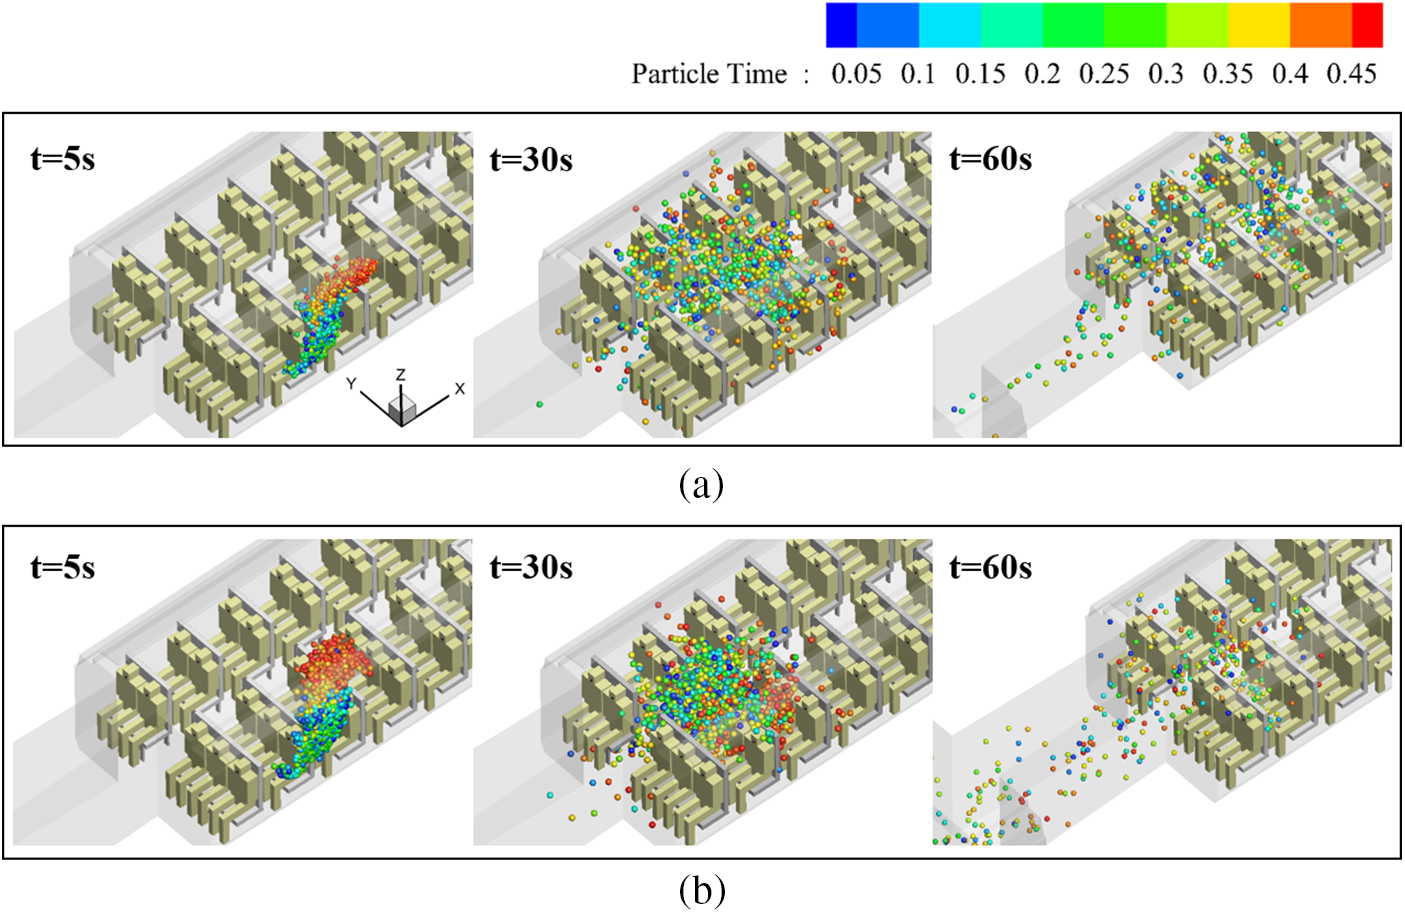
Figure 13: Spread and distribution of droplets with a particle size of 50 μm released by the infection source 3a: (a) Mode 1; (b) Mode 2
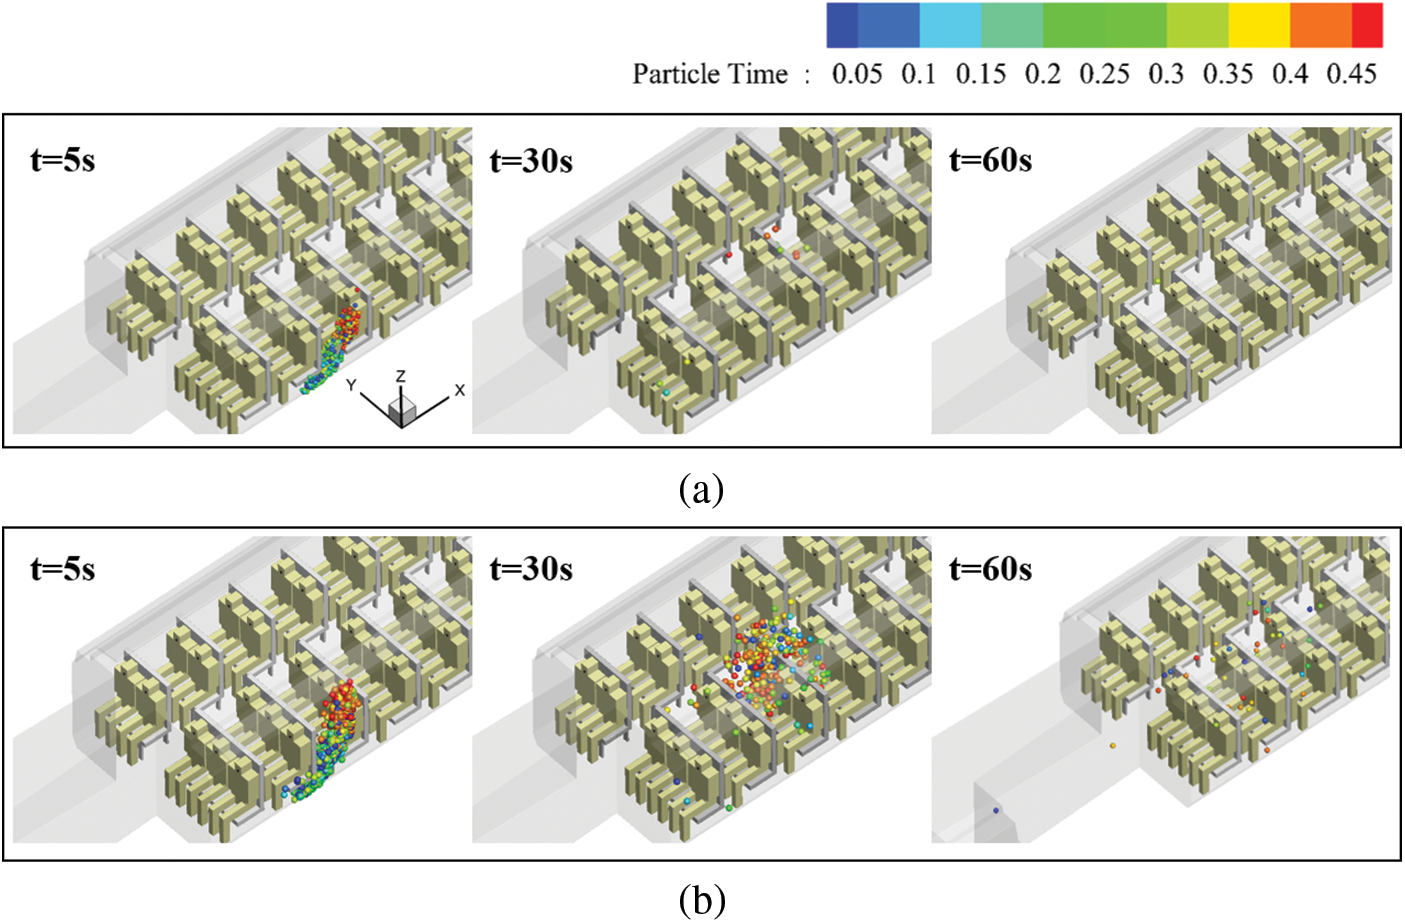
Figure 14: Spread and distribution of droplets with a particle size of 100 μm released by the infection source 3a: (a) Mode 1; (b) Mode 2
3.2.2 An Infection Source Located in the Middle of the Passenger Car
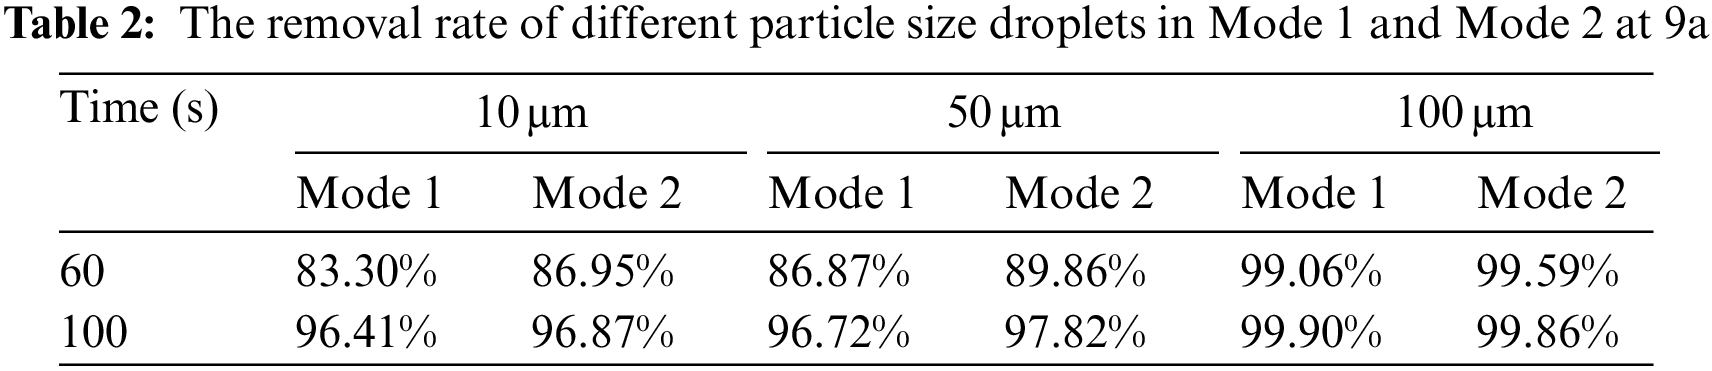
Fig. 15 illustrates changes in the number of droplets released by the infection source in the middle area of the passenger car (human body model 9a) with time under different modes of air supply. Table 2 shows the droplet removal rates at t = 60 s and t = 100 s. We can find that droplets with different particle sizes show similar removal trends in both air supply modes. The removal of droplets with particle sizes of 10 and 50 μm in air supply Mode 2 is higher than those under Mode 1. At t = 60 s, Mode 2 exhibited a removal rate for small and medium-sized droplets that was approximately 3% higher compared to Mode 1. This difference continued at t = 100 s, with Mode 2 still slightly surpassing Mode 1. The phenomenon is probably related to the guiding effect of the longitudinal airflow on the small and medium droplets. Figs. 10a and 10b indicate that the area influenced by the longitudinal airflow under air supply Mode 2 includes the front and middle areas of the passenger car, while there is only negligible longitudinal airflow in the middle area in Mode 1. The presence of the longitudinal airflow can drive small and medium droplets forward, so that they can be captured faster by the air return inlets ahead and removed. For larger droplets, both Mode 1 and Mode 2 achieved removal rates of over 99% at t = 100.
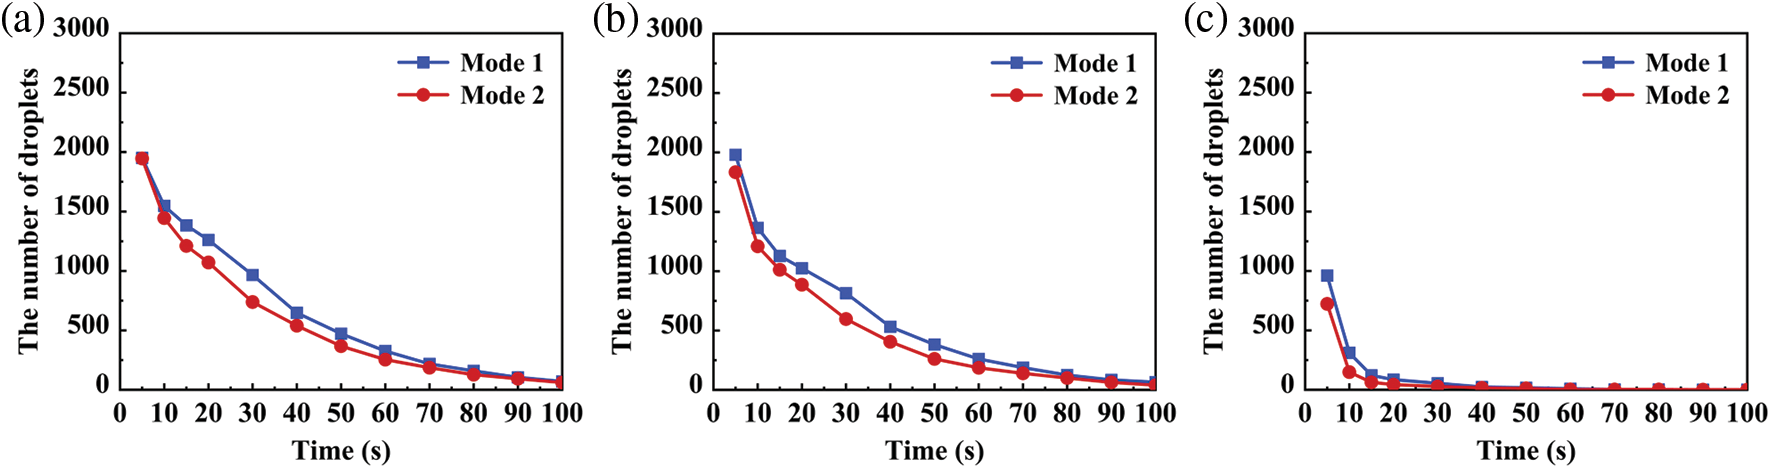
Figure 15: Changes in the number of droplets released by the infection source 9a with time: (a) 10 μm; (b) 50 μm; (c) 100 μm
Figs. 16 to 18 show the diffusion characteristics of droplets with different particle sizes released by infection source 9a (Figs. 16–18: (a) represents air supply Mode 1, (b) represents air supply Mode 2). The overall trend of droplet diffusion is similar to that at the 3a position. At the time of 30 s in both modes, the diffusion trend of 10 and 50 μm particles shown in Figs. 16 and 17 is obvious, and the droplets mainly diffuse along the transverse direction, which is still related to the large eddy flow on the cross-section of the train. At 60 s, the forward-end diffusion trend of droplets under supply air Mode 2 was stronger than that under Mode 1, because there was basically no longitudinal airflow in the central region under supply air Mode 1. The spray droplets at this location mainly rely on the air return inlets to remove them, while the 100 μm droplets as shown in Fig. 18 are still mainly settled.
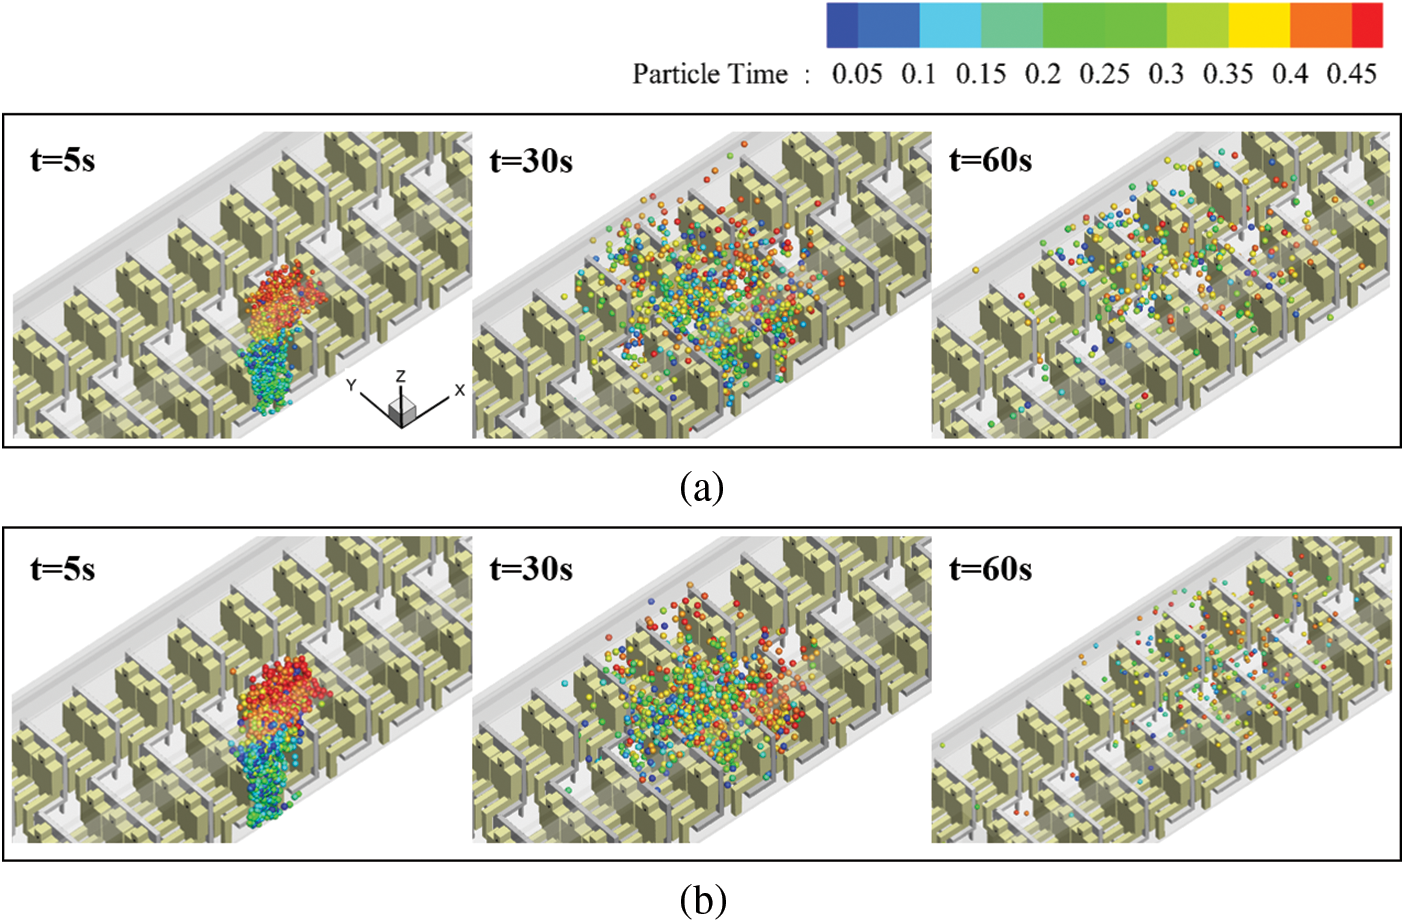
Figure 16: Spread and distribution of droplets with a particle size of 10 μm released by infection source 9a: (a) Mode 1; (b) Mode 2

Figure 17: Spread and distribution of droplets with a particle size of 50 μm released by infection source 9a: (a) Mode 1; (b) Mode 2

Figure 18: Spread and distribution of droplets with a particle size of 100 μm released by infection source 9a: (a) Mode 1; (b) Mode 2
3.2.3 An Infection Source at the Rear of the Passenger Car
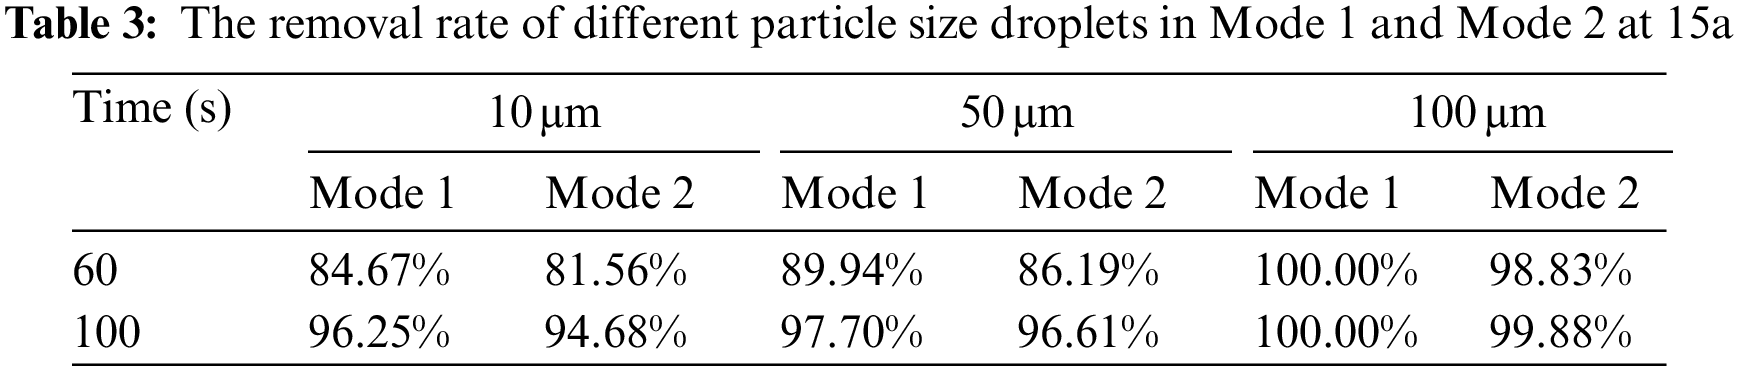
Changes in the number of droplets released by the infection source located in the rear area of the passenger car (human body model 15a) with time in different air supply modes are shown in Fig. 19. Table 3 shows the droplet removal rates at t = 60 s and t = 100 s. Because there is no significant longitudinal airflow in the area either in air supply Mode 1 or 2. Therefore, the removal of droplets with particle sizes of 10 and 50 μm sprayed at 15a under air supply Mode 2 is lower than those under Mode 1. As shown in Table 3, for small and medium-sized droplets, Mode 1 exhibited a removal rate approximately 3% higher than Mode 2 at t = 60 s. Similarly, at t = 100 s, Mode 1 demonstrated a removal rate approximately 1% higher than Mode 2. The lower removal under air supply Mode 2 is probably caused by the following fact: in the rear of the passenger car without longitudinal airflow, faster and more stable eddies formed under Mode 2 providing a larger air rate are more powerful in capturing and retaining small and medium droplets. As a result, more droplets with particle sizes of 10 and 50 μm cannot be timeously discharged from air return inlets around or settle on surrounding surfaces. Such a flow-field structure without longitudinal airflow and with stable large eddies may increase the risk of inhaling droplets in corresponding areas. Removal of droplets with a particle size of 100 μm also results in a similar trend. This indicates that, even for large droplets that are mainly characterized by a tendency to settle, they can also be captured and retained by large eddies.

Figure 19: Changes in the number of droplets released by infection source 15a with time: (a) 10 μm; (b) 50 μm; (c) 100 μm
As shown in Figs. 20 to 22, the diffusion characteristics of droplets with different diameters released from the infection source 15a are presented. In Figs. 20–22, (a) represents air supply Mode 1, and (b) represents air supply Mode 2. Under both air supply modes, the diffusion characteristics of 10 and 50 μm droplets shown in Figs. 20 and 21 are almost the same. At 5 s, the droplets are in the early stage of diffusion, and particles of all three sizes are relatively concentrated. At 30 and 60 s, the diffusion trend of 10 and 50 μm particles is more obvious, and the droplets mainly spread horizontally. However, the particles under air supply Mode 2 shown in Figs. 20b and 21b are more concentrated in the aisle. This is still because there is no longitudinal airflow in both modes in the rear area of the train, and the large vortex in Mode 2 is more stable, which has a stronger retention effect on the droplets. The injection of droplets in this position is still mainly removed by the air return inlets. As shown in Fig. 22, there is a significant difference in the diffusion characteristics of 100 μm droplets in the front-middle part of the train (Figs. 14 and 18). The reason for this phenomenon may be that the more stable large vortex can also capture large droplets and have a retention effect on them.
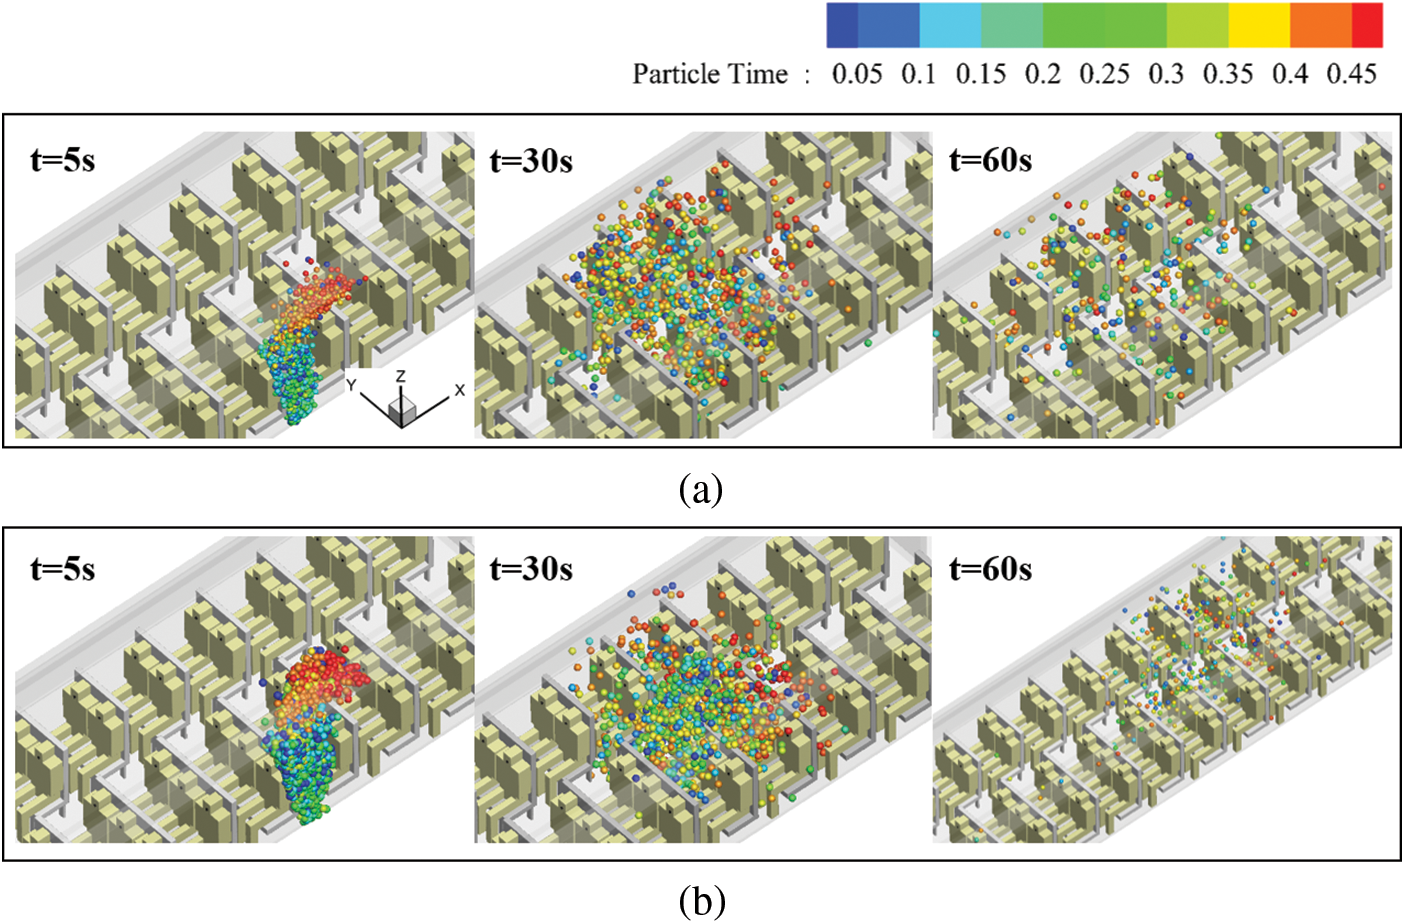
Figure 20: Spread and distribution of droplets with a particle size of 10 μm released by the infection source 15a: (a) Mode 1; (b) Mode 2
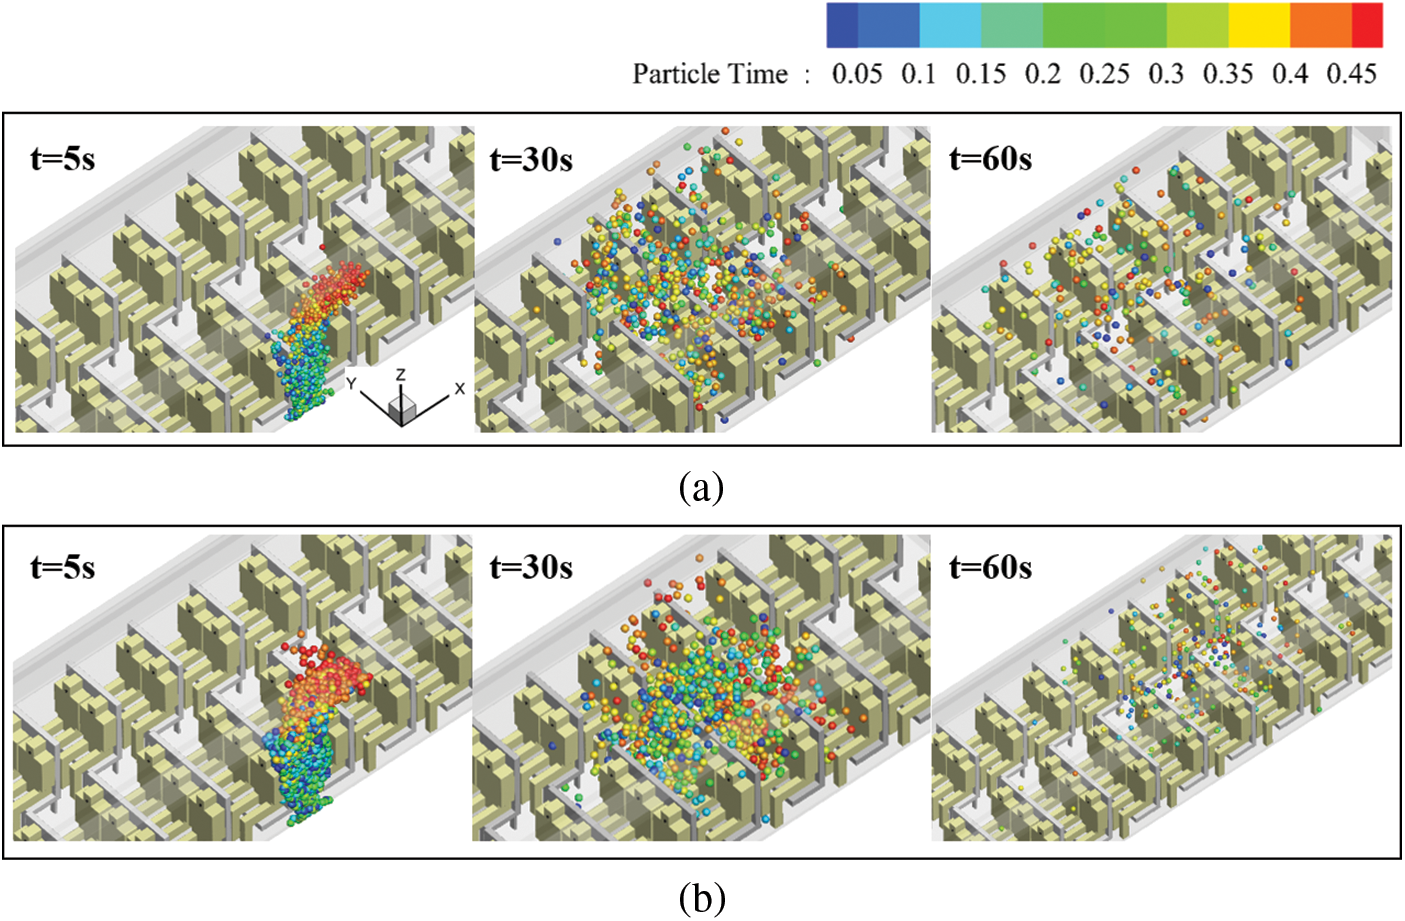
Figure 21: Spread and distribution of droplets with a particle size of 50 μm released by the infection source 15a: (a) Mode 1; (b) Mode 2
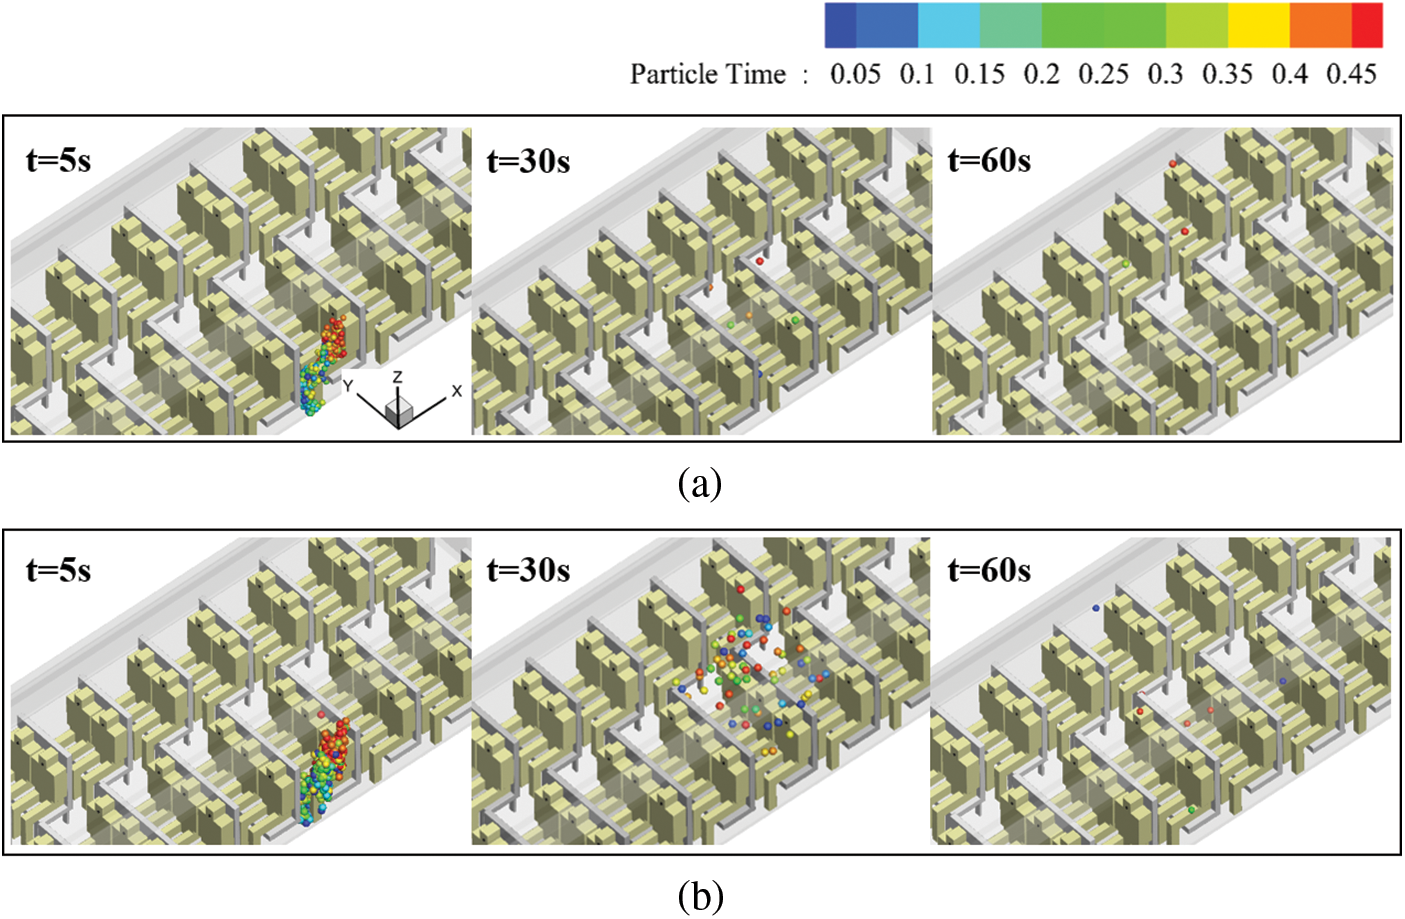
Figure 22: Spread and distribution of droplets with a particle size of 100 μm released by the infection source 15a: (a) Mode 1; (b) Mode 2
Due to limitations in experimental and numerical simulation conditions, our work still has many imperfections, mainly in the following two aspects:
(1) This study, akin to several prior investigations, conducted experimental measurements of parameters such as velocity and temperature within train compartments. However, the primary research focus was on elucidating the diffusion characteristics of cough droplets released from infection sources within the train compartments [15,28]. Although the accuracy of numerical methods about droplets has been corroborated through previous numerical studies, it is noteworthy to propose that future endeavors encompass dedicated experiments to investigate cough droplet diffusion. This will facilitate experimental validation of the numerical methods of droplets, thereby further enhancing their reliability and fidelity. (2) Different train types have variations in the ventilation systems within compartments [14,36]. This study primarily focuses on numerically investigating the characteristics of cough droplet diffusion in a specific type of train. Therefore, the guidance and results obtained may not directly apply to other train types. In the future, research on cough droplet diffusion in compartments of different train types will be conducted to further enhance and refine the guidance provided.
By changing the fresh air volume in the compartment and the compartment area where the pollution source is located, this study discussed the influence of the fresh air volume on the diffusion and removal of different particle sizes of cough droplets released in different areas (front, middle and rear), thereby providing guidance for the air supply mode in the compartment of high-speed train and reducing the risk of infection of passengers. The main conclusions of the study are as follows:
(a) Influences of the fresh air flow volume on the removal of droplets are related to the flow field structures in the passenger car. For the model of the passenger car used in the present research, the droplets are removed at similar trends under the two air supply modes. However, when increasing the fresh air flow volume, the droplets in the middle and front areas of the passenger car are removed faster. When the droplets had dispersed for the 60 s, Mode 2 exhibited a removal rate approximately 1%–3% higher than Mode 1 for small and medium-sized droplets with diameters of 10 and 50 μm. While those in the rear area, the situation is reversed, with Mode 1 slightly surpassing Mode 2 by 1%–3%. For large droplets with a diameter of 100 μm, both modes achieved a removal rate of over 96% in all three regions at the 60 s.
(b) The larger volume of fresh air will result in a more stable vortex formed by the airflow supplied on both sides of the roof, which will flow faster, capture and retain droplets more strongly. The presence of the longitudinal airflow can guide the droplets detained in the large eddies to move longitudinally, preventing their capture by large eddies and improving the removal.
(c) When increasing the fresh air flow volume, droplets with particle sizes of 10 and 50 μm released by the infection source in the front area of the passenger car mainly spread to the front air exhaust outlets with the strengthened longitudinal airflow in the passenger car. The front air exhaust outlets perform better in capturing droplets compared with air return inlets, so the infection risk of passengers in the front area is lower. Because the detention effect is stronger on the droplets released by the infection source in the rear area of the passenger car, the infection risk in the area may increase.
Acknowledgement: None.
Funding Statement: The authors are very grateful for the financial support from the National Natural Science Foundation of China (Grant Number 52078199), the China National Railway Group Limited (Grant Number P2021J036), the Hunan Young Talents Program (Grant Number 2020RC3019), and the Young Elite Scientists Sponsorship Program by CAST (2020QNRC001).
Author Contributions: Jun Xu: Methodology, Investigation, Formal analysis, Writing–original draft. Kai Bi: Conceptualization, Methodology, Writing–review & editing. Yibin Lu: Formal analysis, Visualization, Validation, Writing–review & editing. Tiantian Wang: Resources, Supervision, Validation. Hang Zhang: Data curation, Formal analysis. Zeyuan Zheng: Data curation, Validation. Fushan Shi: Data curation, Software. Yaxin Zheng: Visualization, Writing–review & editing. Xiaoying Li: Formal analysis, Writing–review & editing. Jingping Yang: Data curation, Writing–review & editing.
Availability of Data and Materials: Data will be made available on request.
Conflicts of Interest: The authors declare that they have no conflicts of interest to report regarding the present study.
References
1. Asteris, P. G., Douvika, M. G., Karamani, C. A., Skentou, A. D., Chlichlia, K. et al. (2020). A novel heuristic algorithm for the modeling and risk assessment of the COVID-19 pandemic phenomenon. Computer Modeling in Engineering & Sciences, 125(2), 815–828. https://doi.org/10.32604/cmes.2020.013280 [Google Scholar] [CrossRef]
2. World Health Organization. Weekly epidemiological update on COVID-19-28 September 2022. https://www.who.int/publications/m/item/weekly-epidemiological-update-on-covid-19—28-september-2022 [Google Scholar]
3. Liu, L., Li, Y., Nielsen, P. V., Wei, J., Jensen, R. L. (2017). Short-range airborne transmission of expiratory droplets between two people. Indoor Air, 27(2), 452–462. [Google Scholar] [PubMed]
4. Xia, Y., Chen, X., Liu, T., Zhou, M., Gao, H. (2022). A study on the airtightness of a high-speed train using a reduced-scale method. Measurement, 188, 110610. [Google Scholar]
5. Szekeres, S., Kostyák, A., Szodrai, F., Csáky, I. (2022). Investigation of ventilation systems to improve air quality in the occupied zone in office buildings. Buildings, 12(4), 493. [Google Scholar]
6. Somsen, G. A., van Rijn, C., Kooij, S., Bem, R. A., Bonn, D. (2020). Small droplet aerosols in poorly ventilated spaces and SARS-CoV-2 transmission. The Lancet Respiratory Medicine, 8(7), 658–659. [Google Scholar] [PubMed]
7. Ren, C., Zhu, H. C., Cao, S. J. (2022). Ventilation strategies for mitigation of infection disease transmission in an indoor environment: A case study in office. Buildings, 12(2), 180. [Google Scholar]
8. Kong, B., Zou, Y., Cheng, M., Shi, H., Jiang, Y. (2022). Droplets transmission mechanism in a commercial wide-body aircraft cabin. Applied Sciences, 12(10), 4889. [Google Scholar]
9. Talaat, K., Abuhegazy, M., Mahfoze, O. A., Anderoglu, O., Poroseva, S. V. (2021). Simulation of aerosol transmission on a Boeing 737 airplane with intervention measures for COVID-19 mitigation. Physics of Fluids, 33(3), 033312. [Google Scholar] [PubMed]
10. Yang, X., Ou, C., Yang, H., Liu, L., Song, T. et al. (2020). Transmission of pathogen-laden expiratory droplets in a coach bus. Journal of Hazardous Materials, 397, 122609. [Google Scholar] [PubMed]
11. Lai, X., Li, S., Yan, J., Liu, L., Zhang, A. M. (2022). Multiphase large-eddy simulations of human cough jet development and expiratory droplet dispersion. Journal of Fluid Mechanics, 942, A12. [Google Scholar]
12. Armand, P., Tâche, J. (2022). 3D modelling and simulation of the dispersion of droplets and drops carrying the SARS-CoV-2 virus in a railway transport coach. Scientific Reports, 12(1), 4025. [Google Scholar] [PubMed]
13. Zhao, S., Zhuang, Z., Ran, J., Lin, J., Yang, G. et al. (2020). The association between domestic train transportation and novel coronavirus (2019-nCoV) outbreak in China from 2019 to 2020: A data-driven correlational report. Travel Medicine and Infectious Disease, 33, 101568. [Google Scholar] [PubMed]
14. Yang, L., Li, M., Li, X., Tu, J. (2018). The effects of diffuser type on thermal flow and contaminant transport in high-speed train (HST) cabins–a numerical study. International Journal of Ventilation, 17(1), 48–62. [Google Scholar]
15. Xu, R., Qian, B., Wu, F., Li, X., Zhang, G. et al. (2022). Dispersion of evaporating droplets in the passenger compartment of high-speed train. Journal of Building Engineering, 48, 104001. [Google Scholar]
16. Liu, Z., Long, Y., Yang, T., Zhu, Y., Liu, M. et al. (2023). Research on air supply volume and temperature control of subway trains based on passenger capacity. Atmosphere, 14(2), 258. [Google Scholar]
17. Niu, R. P., Chen, X., Liu, H. (2022). Analysis of the impact of a fresh air system on the indoor environment in office buildings. Sustainable Cities and Society, 83, 103934. [Google Scholar] [PubMed]
18. Lu, Y., Wang, T., Zhao, C., Zhu, Y., Jia, X. et al. (2023). An efficient design method of indoor ventilation parameters for high-speed trains using improved proper orthogonal decomposition reconstruction. Journal of Building Engineering, 71, 106600. [Google Scholar]
19. Tao, Y., Yang, M., Qian, B., Wu, F., Wang, T. (2019). Numerical and experimental study on ventilation panel models in a subway passenger compartment. Engineering, 5(2), 329–336. [Google Scholar]
20. Liu, Z., Wu, J., Yang, G., Zhang, X., Dai, Z. (2023). A numerical study of COVID-19-laden droplets dispersion in aircraft cabin ventilation system. Heliyon, 9(3), e13920. [Google Scholar] [PubMed]
21. Borro, L., Mazzei, L., Raponi, M., Piscitelli, P., Miani, A. et al. (2021). The role of air conditioning in the diffusion of Sars-CoV-2 in indoor environments: A first computational fluid dynamic model, based on investigations performed at the Vatican State Children’s hospital. Environmental Research, 193, 110343. [Google Scholar] [PubMed]
22. Chen, C., Qian, C., Luo, Z. (2021). Study on diffusion Law of aerosol particles in indoor human droplets. 2021 4th International Conference on Digital Medicine and Image Processing, vol. 2021, pp. 83–87. Kyoto, Japan. [Google Scholar]
23. Ji, Y., Qian, H., Ye, J., Zheng, X. (2018). The impact of ambient humidity on the evaporation and dispersion of exhaled breathing droplets: A numerical investigation. Journal of Aerosol Science, 115, 164–172. [Google Scholar]
24. Yang, A., Li, Y., Xing, H., Zhang, L., Feng, L. et al. (2017). Numerical study on aerodynamic characteristics of high-speed trains with considering thermal-flow coupling effects. Journal of Vibroengineering, 19(7), 5606–5626. [Google Scholar]
25. Gan, X., Sheng, S., Sun, B. (2012). The calculation of method of heat insulation wall heat transfer coefficient and its improvement. Refrigeration & Air Conditioning, 26(6), 597–599. [Google Scholar]
26. Khambadkone, N., Madhumati, P., Ranganath, M. (2022). Thermal comfort evaluation in architectural studio classrooms–A summer study in a warm to moderate Indian climate. Indoor and Built Environment, 31(9), 31–2365. [Google Scholar]
27. Lieber, C., Melekidis, S., Koch, R., Bauer, H. J. (2021). Insights into the evaporation characteristics of saliva droplets and aerosols: Levitation experiments and numerical modeling. Journal of Aerosol Science, 154, 105760. [Google Scholar] [PubMed]
28. Xu, R., Wu, F., Li, X., Yu, C., Li, H. et al. (2022). Numerical comparison of ventilation modes on the transmission of coughing droplets in a train compartment. Journal of Wind Engineering and Industrial Aerodynamics, 231, 105240. [Google Scholar]
29. Srivastava, S., Zhao, X., Manay, A., Chen, Q. (2021). Effective ventilation and air disinfection system for reducing coronavirus disease 2019 (COVID-19) infection risk in office buildings. Sustainable Cities and Society, 75, 103408. [Google Scholar] [PubMed]
30. Hassan, S., Molla, M. M., Nag, P., Akhter, N., Khan, A. (2022). Unsteady RANS simulation of wind flow around a building shape obstacle. Building Simulation, 15(2), 291–312. [Google Scholar]
31. ANSYS, Inc., (2013). ANSYS fluent theory guide 15.0. Canonsburg: ANSYS, Inc. [Google Scholar]
32. Liu, Z., Yin, D., Niu, Y., Cao, G., Liu, H. et al. (2022). Effect of human thermal plume and ventilation interaction on bacteria-carrying particles diffusion in operating room microenvironment. Energy and Buildings, 254, 111573. [Google Scholar]
33. Sadrizadeh, S., Afshari, A., Karimipanah, T., Håkansson, U., Nielsen, P. V. (2016). Numerical simulation of the impact of surgeon posture on airborne particle distribution in a turbulent mixing operating theatre. Building and Environment, 110, 140–147. [Google Scholar]
34. Zhao, Y., Feng, Y., Ma, L. (2022). Impacts of human movement and ventilation mode on the indoor environment, droplet evaporation, and aerosol transmission risk at airport terminals. Building and Environment, 224, 109527. [Google Scholar] [PubMed]
35. Liu, L., Wei, J., Li, Y., Ooi, A. (2017). Evaporation and dispersion of respiratory droplets from coughing. Indoor Air, 27(1), 179–190. [Google Scholar] [PubMed]
36. Wang, H., Lin, M., Chen, Y. (2014). Performance evaluation of air distribution systems in three different China railway high-speed train cabins using numerical simulation. Building Simulation, 7, 629–638. [Google Scholar]
Cite This Article
 Copyright © 2024 The Author(s). Published by Tech Science Press.
This work is licensed under a Creative Commons Attribution 4.0 International License , which permits unrestricted use, distribution, and reproduction in any medium, provided the original work is properly cited.
 Downloads
 Citation Tools