
 Submit a Paper
 Propose a Special lssue
 Open Access
ARTICLE

Early Detection of Colletotrichum Kahawae Disease in Coffee Cherry Based on Computer Vision Techniques
1 Department of Computer Science and Engineering, Saveetha School of Engineering, Saveetha Institute of Medical and Technical Science, Chennai, 602105, India
2 Department of Computer Science, College of Computer and Information Systems, Umm Al-Qura University, Makkah, 21955, Saudi Arabia
* Corresponding Author: Surendran Rajendran. Email:
(This article belongs to the Special Issue: Intelligent Biomedical Image Processing and Computer Vision)
Computer Modeling in Engineering & Sciences 2024, 139(1), 759-782. https://doi.org/10.32604/cmes.2023.044084
Received 20 July 2023; Accepted 28 September 2023; Issue published 30 December 2023
 View Full Text
 Download PDF
Abstract
Colletotrichum kahawae (Coffee Berry Disease) spreads through spores that can be carried by wind, rain, and insects affecting coffee plantations, and causes 80% yield losses and poor-quality coffee beans. The deadly disease is hard to control because wind, rain, and insects carry spores. Colombian researchers utilized a deep learning system to identify CBD in coffee cherries at three growth stages and classify photographs of infected and uninfected cherries with 93% accuracy using a random forest method. If the dataset is too small and noisy, the algorithm may not learn data patterns and generate accurate predictions. To overcome the existing challenge, early detection of Colletotrichum Kahawae disease in coffee cherries requires automated processes, prompt recognition, and accurate classifications. The proposed methodology selects CBD image datasets through four different stages for training and testing. XGBoost to train a model on datasets of coffee berries, with each image labeled as healthy or diseased. Once the model is trained, SHAP algorithm to figure out which features were essential for making predictions with the proposed model. Some of these characteristics were the cherry’s colour, whether it had spots or other damage, and how big the Lesions were. Virtual inception is important for classification to virtualize the relationship between the colour of the berry is correlated with the presence of disease. To evaluate the model’s performance and mitigate excess fitting, a 10-fold cross-validation approach is employed. This involves partitioning the dataset into ten subsets, training the model on each subset, and evaluating its performance. In comparison to other contemporary methodologies, the model put forth achieved an accuracy of 98.56%.Keywords
Coffee is a very significant and profitable crop. It is farmed on a big scale (42,000 hectares between 2015 and 2022) as well as a small one (128,000 hectares), with a total annual yield of around 70,000 tons. Arabica coffee is the most extensively consumed type worldwide. In early 90’s Kenya, 75% of coffee crop loss was due to CBD (1920), in Ethiopia, CBD caused an estimated 30% crop loss in (1990), In Brazil, CBD caused an estimated 10% crop loss in the 2000 s. CBD is a serious threat to the coffee industry because it leads to a decrease in coffee quality and flavour, and it is important to take steps to control it else, coffee production has to be cut in half [1]. Coffee berry disease, also known as Colletotrichum kahawae is a parasite that affects all stages of coffee cherry growth, but it is most visible as microscopic, dark, sunken, brown patches on the green berry that start small and later enlarge in area, eating the entire fruit and rendering it black. CBD first emerges on coffee berries as tiny, water-soaked sores. These lesions might grow and become buried with time. The berries may also dry out and shrivel. These spots can spread throughout the fruit, resulting in a flavourless, dry product [2]. Coffee berry disease (CBD) is a devastating fungal disease that can cause significant yield losses in coffee crops. The disease is caused by the fungus Colletotrichum kahawae, which can infect coffee cherries at any stage of development. However, the susceptibility of coffee cherries to CBD varies depending on the stage of development as Greene cherry, yellow cherry, chartreuse cherry, yellow-red cherry, red cherry, and overripe cherry are all varieties of cherries [3]. In the proposed work to identify the Colletotrichum kahawae accurately stages are classified into three categories namely Early stages of development (pinhead to pea stage) In the early stages of development, coffee cherries are more resistant to CBD infection as shown in Fig. 1. However, if the infection does occur, it can lead to the formation of small, dark spots on the surface of the cherry. These spots can eventually enlarge and coalesce, causing the cherry to rot and fall off the tree, in middle stages of development (pea to cherry stage). In the middle stages of development, coffee cherries are more susceptible to CBD infection. Infection at this stage can cause the formation of large, dark spots on the surface of the cherry. These spots can eventually spread to the entire cherry, causing it to rot and fall off the tree, and in the late stages of development (cherry to the ripe stage), coffee cherries are less susceptible to CBD infection [4]. However, if infection does occur, it can cause the formation of dark, sunken lesions on the surface of the cherry. These lesions can eventually lead to the mummification of the cherry, but the beans inside the cherry are usually not affected. CBD is a parasite affecting all phases of coffee cherry development, but most obviously shows as microscopic, dark, sunken, brown patches on the green berry that begin small and then enlarge in area, eating the entire berry to turn black. These spots can spread throughout the fruit, producing a tasteless and dry product [5]. Even though this disease does not kill trees, crop losses may surpass 80%. Water, insects, or movement through the coffee crop often distribute the spores during harvest. Colletotrichum kahawae is a more dangerous fungal disease that damages the fruit from the fourth to the twelfth week after blossoming. Producing cherries with black spots that may or may not mature properly, drying, and remaining connected to the branch covers the cherry, decreasing growth and quality.
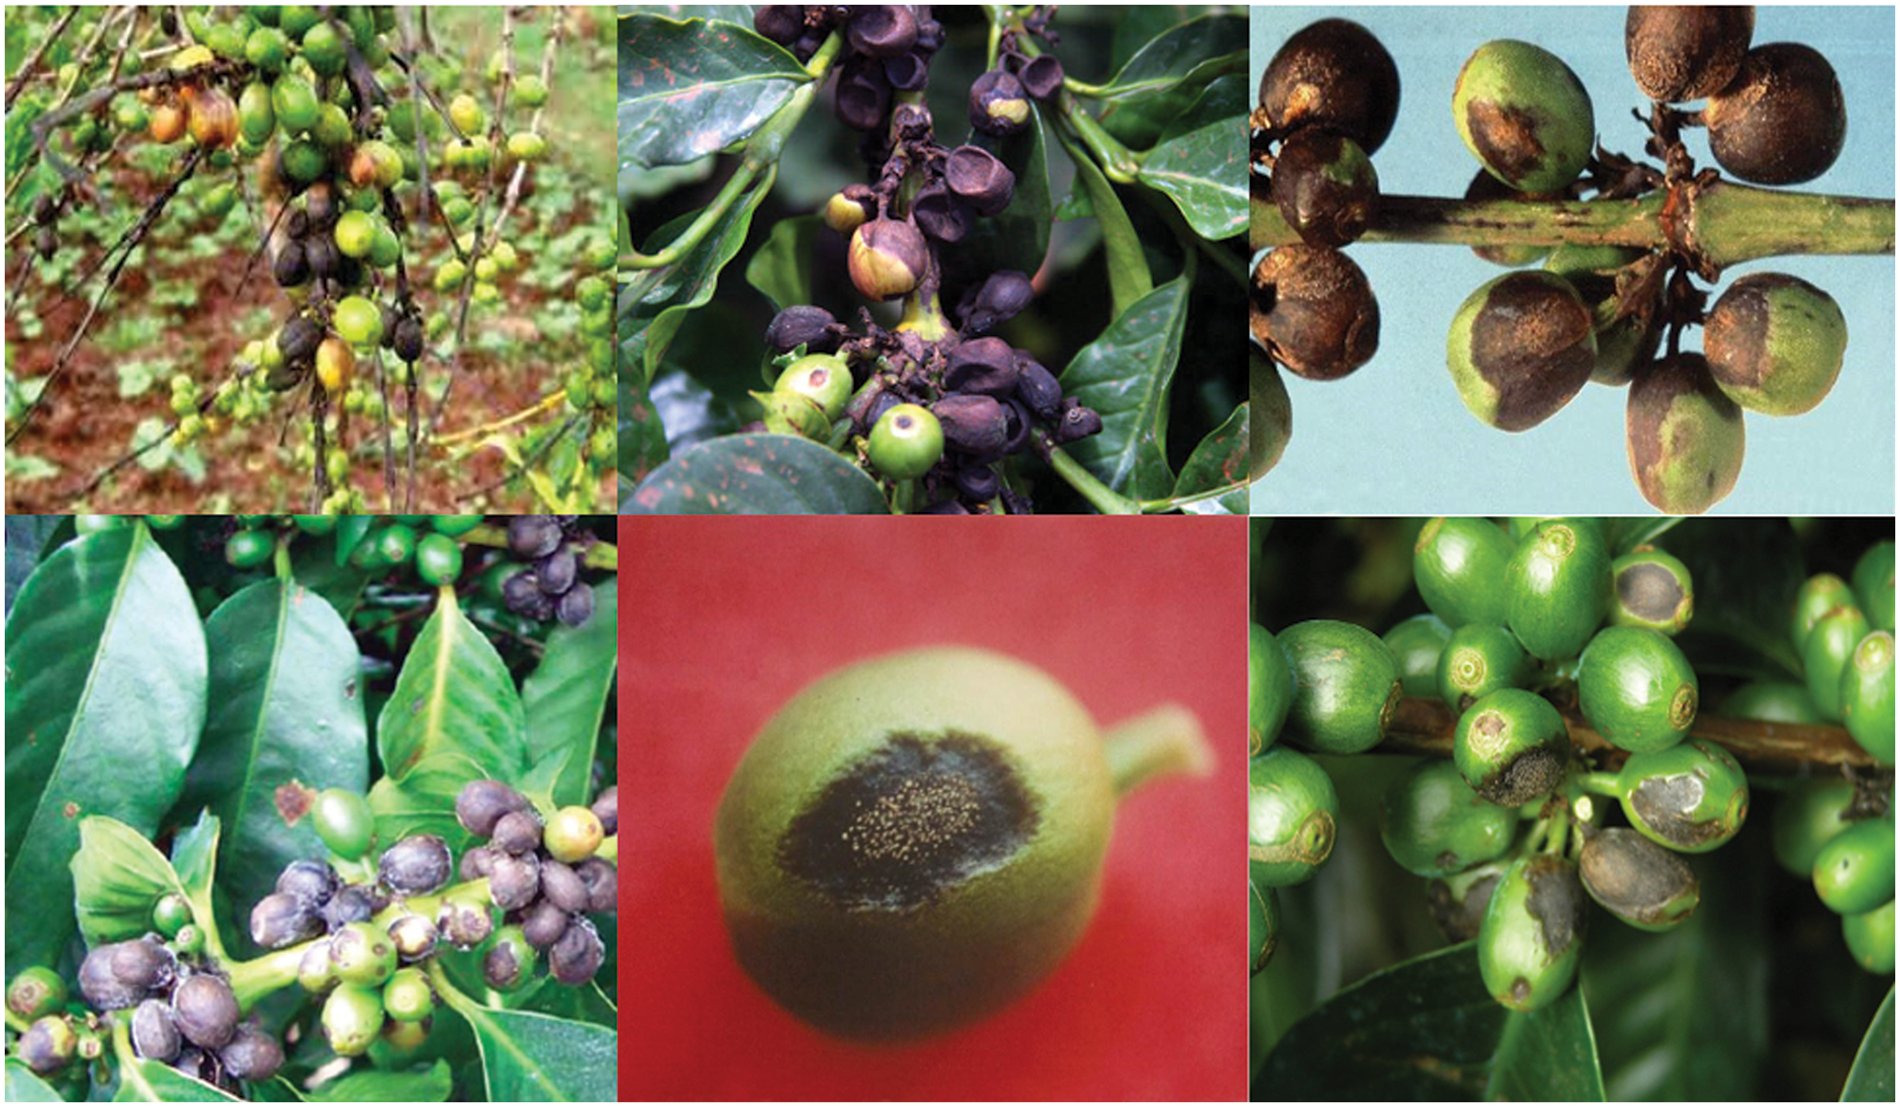
Figure 1: Coffee berry diseases
The popular machine-learning algorithm XG Boost combines the decision trees to identify the features and improve the accuracy of quick predictions. XGBoost is trained for classifying coffee berries infected with CBD [6]. Image segmentation is done using the XGBoost model trained using CBD-infected and non-CBD-infected coffee cherry pictures. The model identified CBD-infected cherries 80.18% accurately. SHAP (Shapley Additive explanations) can be used to interpret machine learning model predictions and extract features from the segmented images. SHAP can identify and explain how each prediction attribute affects a model’s forecast. SHAP identifies the most important elements by explaining how each factor influences model prediction. SHAP could identify key CBD features early in development. The data may improve CBD detection systems. SHAP reasons for the model’s CBD-infected cherry prediction. SHAP listed predictions and their effects. Cherry colour may matter more than size early on. Cherry size may matter more than colour late in development [7]. XGBoost and SHAP are used together can help to improve the accuracy of CBD classification and to gain insights into the importance of different features for classification. Virtual inspection is the computer vision technique used to inspect the agricultural environment. It is used to detect defects or abnormalities in CBD. Virtual inception detects diseases in coffee cherries via deep learning and virtual inspection. The virtual inspection system measures coffee cherry foliage colour, texture, and Shape. This data trains a deep-learning network to identify disease patterns. After training the deep learning model with coffee cherry illnesses in new and processed images from XGBoost and SHAP analysis. Feed the model additional photos and ask it to predict the disease. At different phases of coffee cherry development, a virtual examination can identify CBD. CBD symptoms are mild early on, making it hard to detect using typical methods. However, a virtual examination can discover CBD early on, preventing disease propagation and yield losses. CBD symptoms are more apparent in late development, making it easier to identify using traditional methods. Virtual inspections can validate the diagnosis and severity of the infection [8]. Virtual inspection will compare the real-time images and processed images to identify cherry is infected or not.
Detecting coffee berry disease (CBD) is still limited by a lack of high-quality data for training, the difficulty of accurately identifying CBD in coffee plants, and the presence of other diseases with similar symptoms. Detection is also not very robust to environmental changes or disease appearance. This can make real-world usage of these models problematic [9]. Researchers, data scientists, coffee growers, and other stakeholders must collaborate to close these research gaps. Together, can create more accurate, robust, interpretable, and economical machine learning and computer vision models to lessen CBD’s influence on coffee harvests. Section 2 covers the existing works from various crop and leaf classification and segmentation using deep learning models.
Numerous studies have employed coffee cherries as a means of identifying various disorders. Below, we present a comprehensive elucidation of the literature review, as depicted in Table 1. A novel deep learning approach has been developed for the detection of potato blight in Solanum tuberosum L. and tomato plants [10]. CNN and ResNet-9 process 3990 photos to identify diseased tomato and potato leaf regions. With excellent accuracy and the ability to detect diverse blight illnesses, it is robust to noise and imagines oscillations. Weakness is the lack of computational resources needed to train and deploy the method. Sanida et al. proposed an efficient hybrid CNN classification model for tomato crop disease. The model is based on a combination of convolutional neural networks (CNNs) and inception modules [11]. CNN used in the model is a 13-layer CNN with 3 × 3 convolution kernels. The inception module is a building block that combines multiple convolutional layers with different filter sizes. Strength can achieve high accuracy in tomato crop disease classification, and weakness is requiring a large dataset of labelled images for training. Raghavendran et al. proposed a bibliometric analysis of the research on plant crop disease identification using machine learning (ML) and deep learning (DL) [12]. The bibliometric analysis aims to identify the trends, gaps, and challenges in this research area. Strength is used to identify the research topics that have been investigated, and weakness does not provide insights into the quality of the research.

Merga et al. proposed to examine the genetic variability of biennial-bearing coffee (Coffea arabica L.) germplasm and its effect on selection efficiency [13]. Coffee trees produce high and low yields biennially. This feature can limit coffee output by causing growers to lose income and yields. The coffee germplasm was evaluated for biennial bearing over, for three years and data on biennial bearing was analyzed using variance component analysis. The strength identifies the most important genetic factors that contribute to biennial bearing, and the weakness is results may not be generalizable to all coffee germplasm. Sudha et al. proposed an early cashew leaf anthracnose detection using image processing and machine learning [14]. The fungal disease anthracnose can severely harm cashew crops. Preventing crop losses requires early disease diagnosis and control. Convolutional neural network (CNN) to develop the early detection system, and train on a dataset of images of healthy and diseased cashew leaves. Strength is non-destructive, which means that the leaves do not need to be damaged to be tested, and weakness may not be able to detect all cases of anthracnose disease. Sadiq et al. developed deep learning for potato leaf disease identification and classification [15]. A convolutional neural network (CNN) is used to extract features from potato leaf photos and classify them by illness. Deep learning-based potato leaf disease diagnosis and categorization. The research suggests using a CNN to extract features from potato leaf photos and categorize them by disease. The preprocessed images fine-tuned the VGG16 model to categorize new potato leaf images. Strength is a non-destructive which means that the leaves do not need to be damaged to be tested and weakness may not be able to detect all cases of potato leaf diseases.
Melese established a mathematical model for the coffee berry borer (CBB) that accounts for temperature and rainfall fluctuation [16]. The model then optimizes CBB regulation to minimize coffee production impact. The optimal control strategy is found by minimizing a cost function that represents the economic loss due to the CBB. Strength can be used to develop optimal control strategies for minimizing the impact of the CBB on coffee production, and weakness is optimal control strategy may not be feasible to implement in practice. Milkisa et al. proposed a method for visualizing and classifying coffee diseases using machine learning and image processing techniques [17]. CNN to classify coffee leaf images by disease. The CNN is a good image classification algorithm. Strength can be used to visualize coffee diseases and identify the affected areas, and the weakness is it may not be able to detect all cases of coffee diseases. Miranda proposed a random forest technique to categorize Landsat 8 OLI images as CBN-infected or healthy [18]. Random forest is a tree-based ensemble technique with high accuracy and robustness. Preprocessed Landsat 8 OLI pictures improved contrast and reduced noise. Random forest algorithm was trained on Landsat 8 OLI pictures tagged CBN-infected or healthy. The trained random forest algorithm classified new Landsat 8 OLI pictures. Strength is a remote sensing method, which means that it can be used to monitor large areas of coffee crops, and weakness is may not be able to detect CBN in the early stages of infection.
Abuhayi et al. developed a CNN-based coffee disease classification method that concatenates features from different CNN layers [19]. VGG16, a CNN model pre-trained on a huge dataset of natural images. Coffee leaf photos tagged with disease categories were used to fine-tune the VGG16 model. The paper concatenates CNN layer characteristics and combines CNN layers to improve classification accuracy. Strength is a relatively inexpensive method to implement, and weakness may not be able to detect all cases of coffee diseases. Zenebe et al. characterized and determine the virulence of a Colletotrichum kahawae isolate from Gidami, Western Ethiopia. The isolate was characterized using morphological, cultural, and molecular approaches. Leaf disc inoculation assays were utilized to assess and isolate pathogenicity. The virulence of the isolate was determined by the percentage of leaves that developed symptoms. Strength provides information about the characteristics and virulence of a Colletotrichum kahawae isolate from Gidami, Western Ethiopia, and weakness did not investigate the factors that influence the virulence of the isolate [20]. Section 3 discusses the methodology and algorithm.
The proposed model developed a method for analyzing CBD and outlined how the phases of coffee cherry are categorized into two classes (CBD and non-CBD). The novelty of the research work feature selection and feature extraction. XGBoost is a tree-based and extraction-based classification technique used for ranking the feature. It selects the important features and remove less important ones. SHAP analysis for feature selection to calculate the SHAP values for each feature. Select the features with the highest SHAP values. Evaluate the performance of the model using the selected features. XGBoost and SHAP analysis for coffee berry disease early detection will be a set of features that are most relevant to the prediction of the disease and help to prevent significant damage to coffee crops.
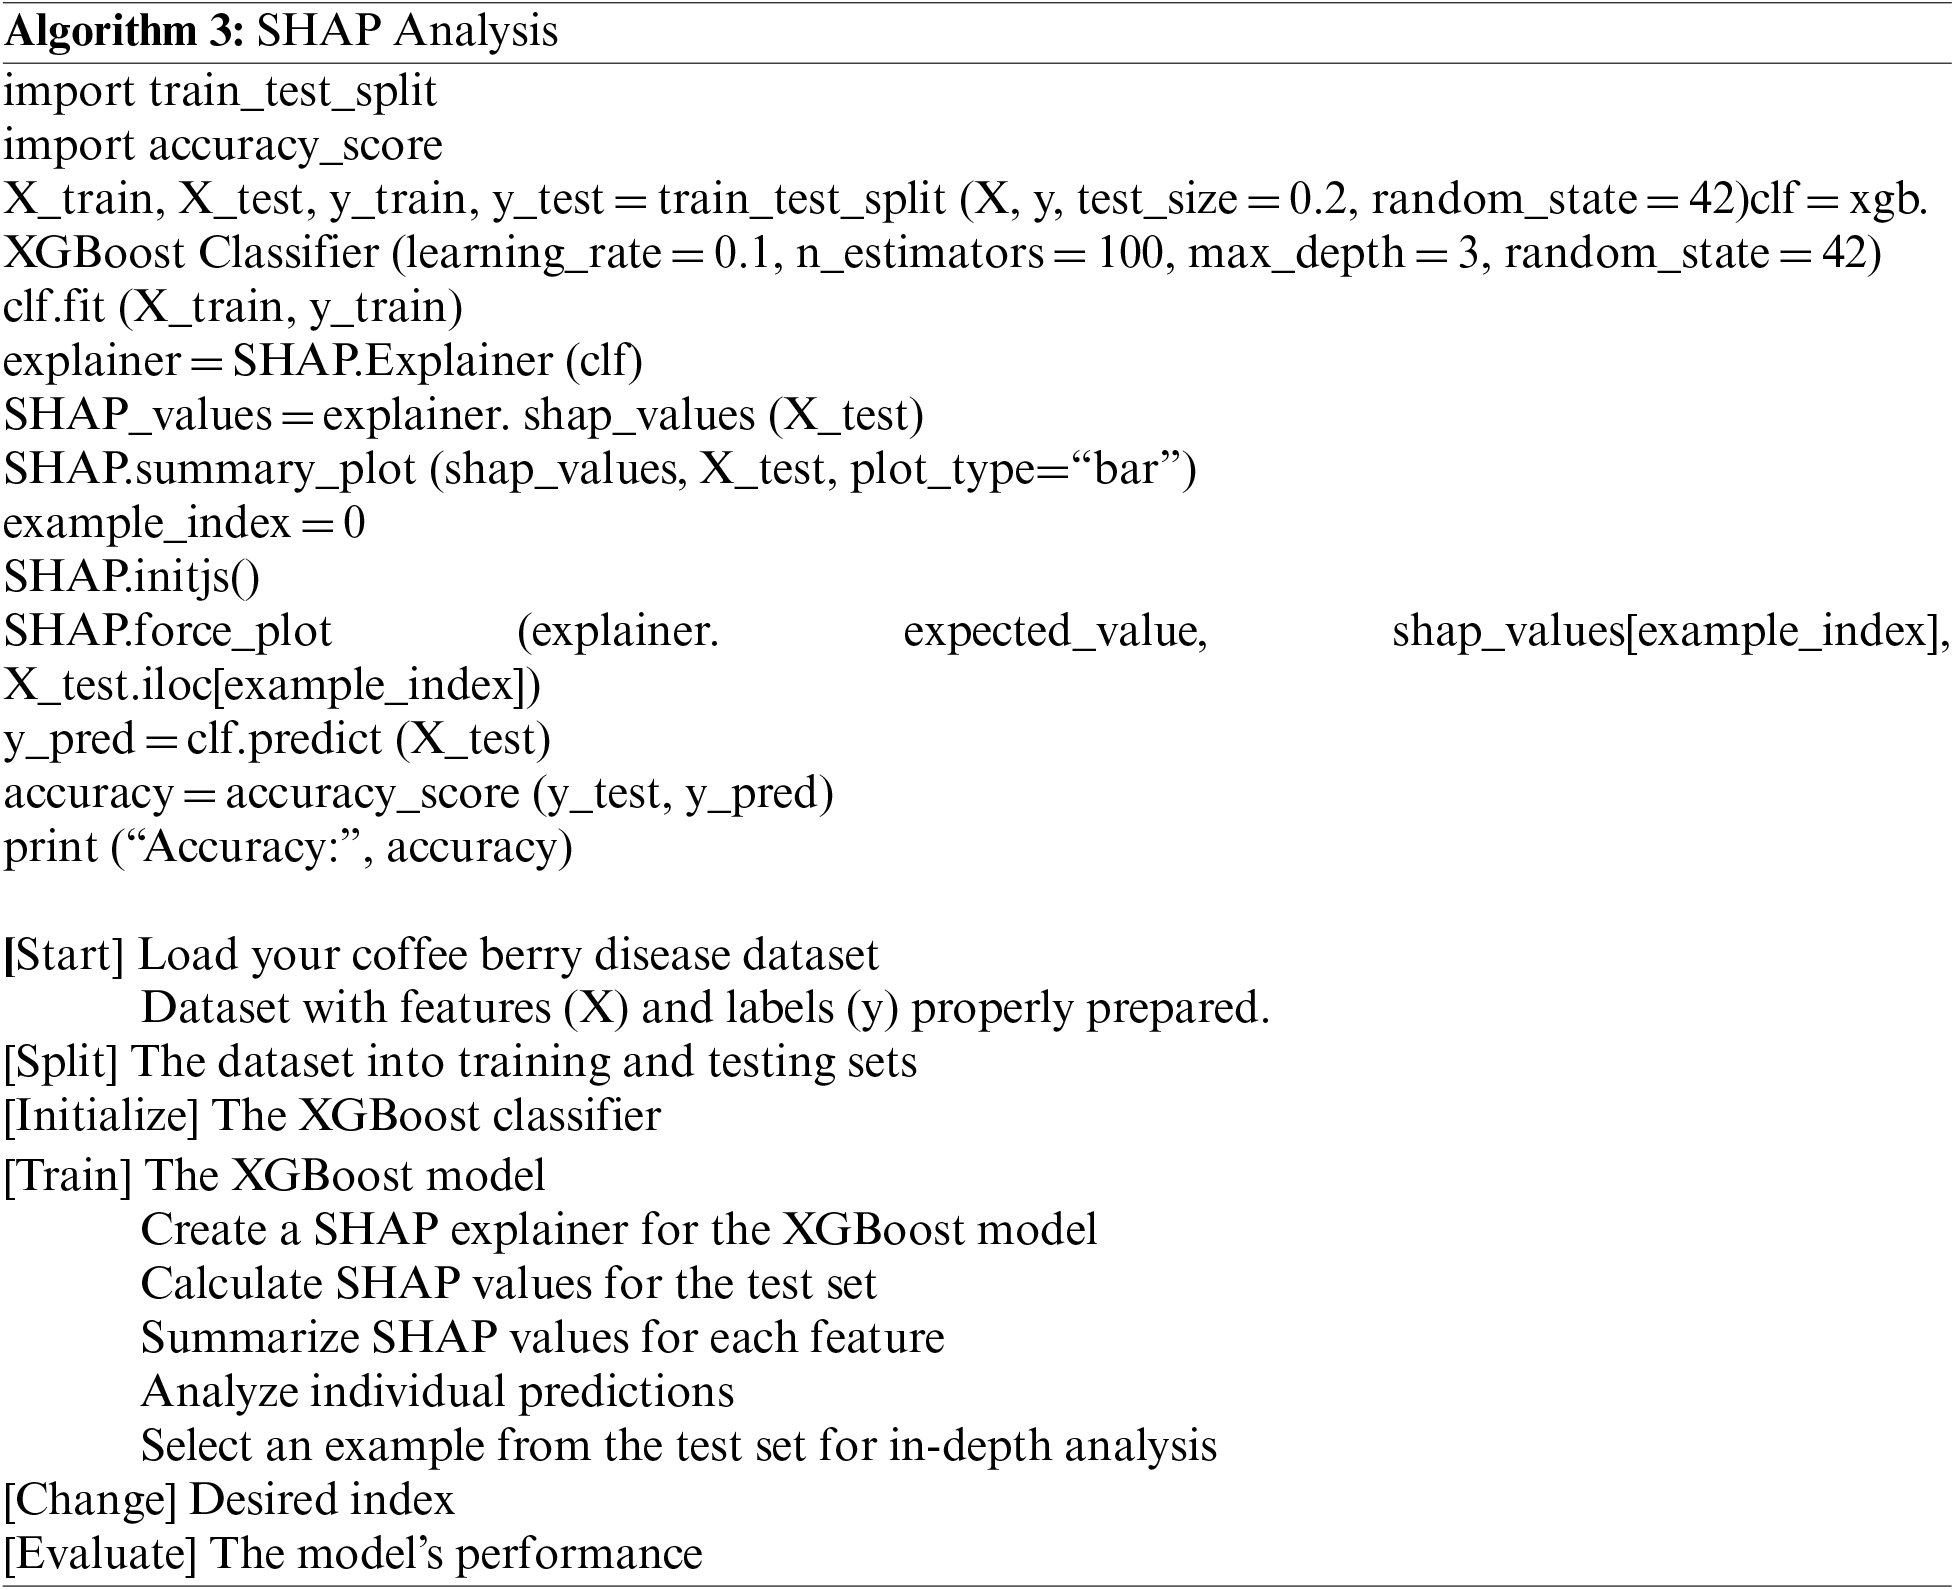
Research work was implemented based on the untrained SHAP model to identify and categories coffee berry diseases from the image’s dataset. The primary characteristics of the dataset are visible as microscopic, dark, sunken, brown blotches on the green berry that begin small and expand in size, devouring the fruit and turning it black. These features are extracted and targeted to detect the proposed SHAP model for classification and detection. If the trained model does not help, then the untrained model is ideal because it can take advantage of all the unique characteristics of the dataset. Image is captured, preprocessed and trained using the SHAP model to analyze whether the coffee cherry is infected or healthy. This initiative highlights and acknowledges the need for creating a quick, cost-effective, and trustworthy system that enables advancement in agriculture. Using machine learning and deep neural networks, this research will create a SHAP-based XGBoost system for disease detection in coffee berries. This approach was created to help farmers who do not wish to journey far in search of plant diseases and their treatments. Therefore, this model may be used by farmers, scientists, and botanists to quickly and accurately diagnose coffee berry illnesses. As shown in Fig. 2, compared the importance of the SHAP feature to the XGBoost feature in the “Discussions” section to understand how each of them analyses each segment.
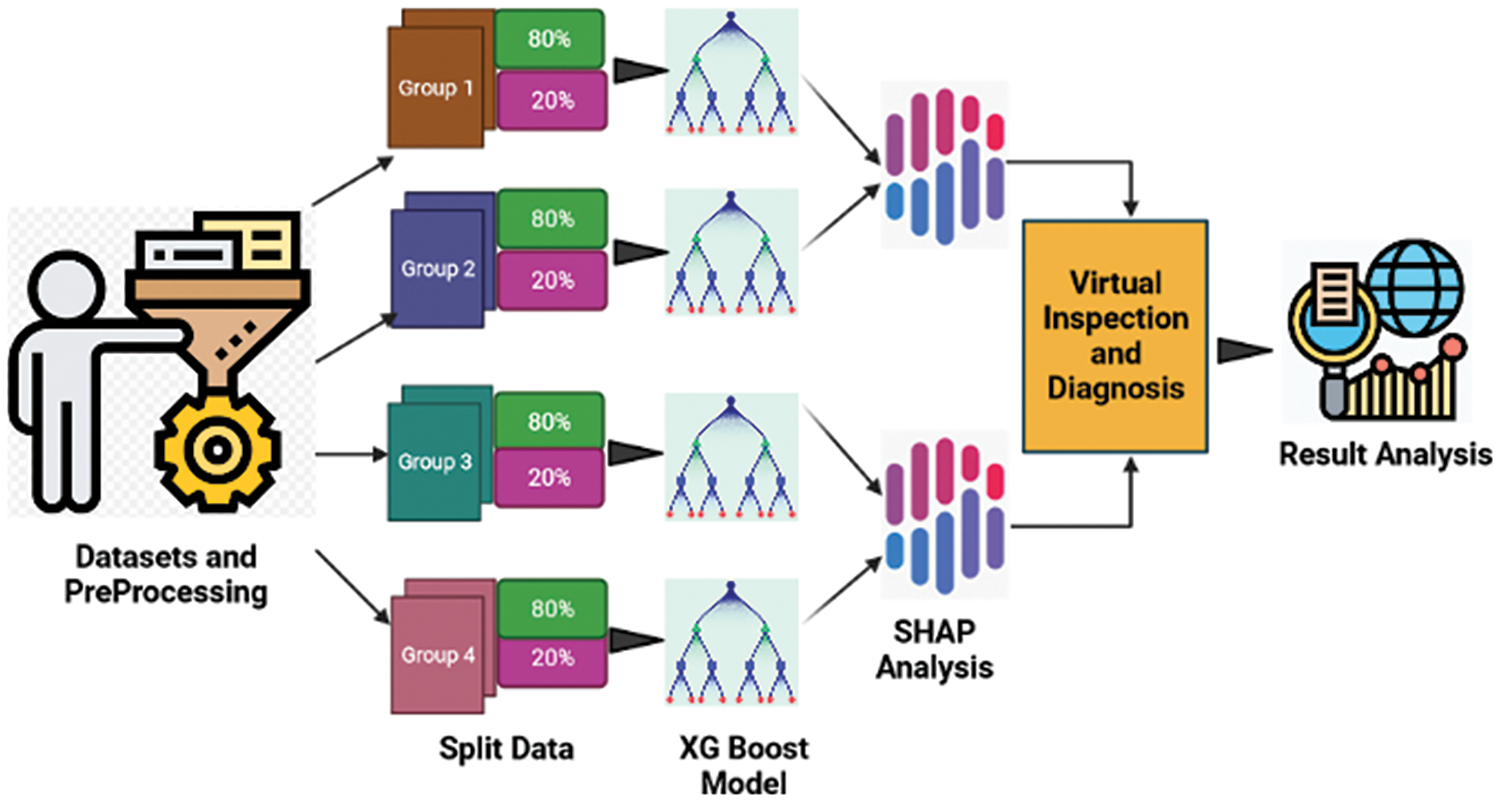
Figure 2: Working model for coffee berry disease prediction
The research conducted by gathering CBD data from the Zenodo community’s public cherry coffee fruits at various stages. The datasets comprise 640 photos of cherry coffee fruits in various stages of ripening with a 256 × 256 resolution. Sample 1 is 130, Sample 2 is 160, Sample 3 is 160, Sample 4 is 78, and Healthy cherry is 112, In the proposed work, the coffee berry disease identification stage is split into four groups based on attributes of size, colour, taste, variety, nutritional value, the coffee beans’ position inside the pulp, skin of the coffee cherry, and uses. Growth and Variety stages are Greene cherry and yellow cherry (Early Development Stage), chartreuse cherry, and yellow-red cherry (Middle Development Stage), red cherry, and overripe cherry Immature (Early Development Stage) as shown in Table 2. The specimen portraits are from coffee farms in Karnataka-coorg’s Nilgiris District, Yercaud, and Kodaikanal. It is estimated that there are approximately 250 coffee plants on the farms, and the data acquired shows 475 coffee cherries, 270 of which are healthy and 205 of which are unhealthy. These cherry samples were collected at random from 15 Coffee plants. On the same day, coffee cherry samples are gathered and photographs are shot with a camera of 2688 × 1520, or 4 Megapixels. 640 coffee cherry photos have been collected from Zenodo communities and nature. All experiments were conducted in a Jupyter Notebook and Python Libraries utilizing the Windows 11 operating system. Feature selection is achieved using the Recursive Feature Elimination technique which can be used to select features by recursively eliminating features that are not important. Hardware components for GPUs (graphics processing units) and TPUs (tensor processing units) are used in cloud computing platform AWS [30].

Preprocessing is implemented in Python Libraries for image preprocessing based computer vision tool, sample coffee berry disease and healthy images are loaded. Images are resized using the default size of 256 × 256 pixels. Noise is removed by applying a Gaussian filter. They are effective in reducing noise in an image by preserving the edge smoothness, adjusting the scale space, and bell-shaped smoothening without overshooting. Contrast enhancement which converts to grayscale and applies histogram equalization. Linear normalization is a very important stage it changes the input image into a range of pixel values represented from 0 to 255, images are too dark or shaded in the normalization process it becomes clearer.
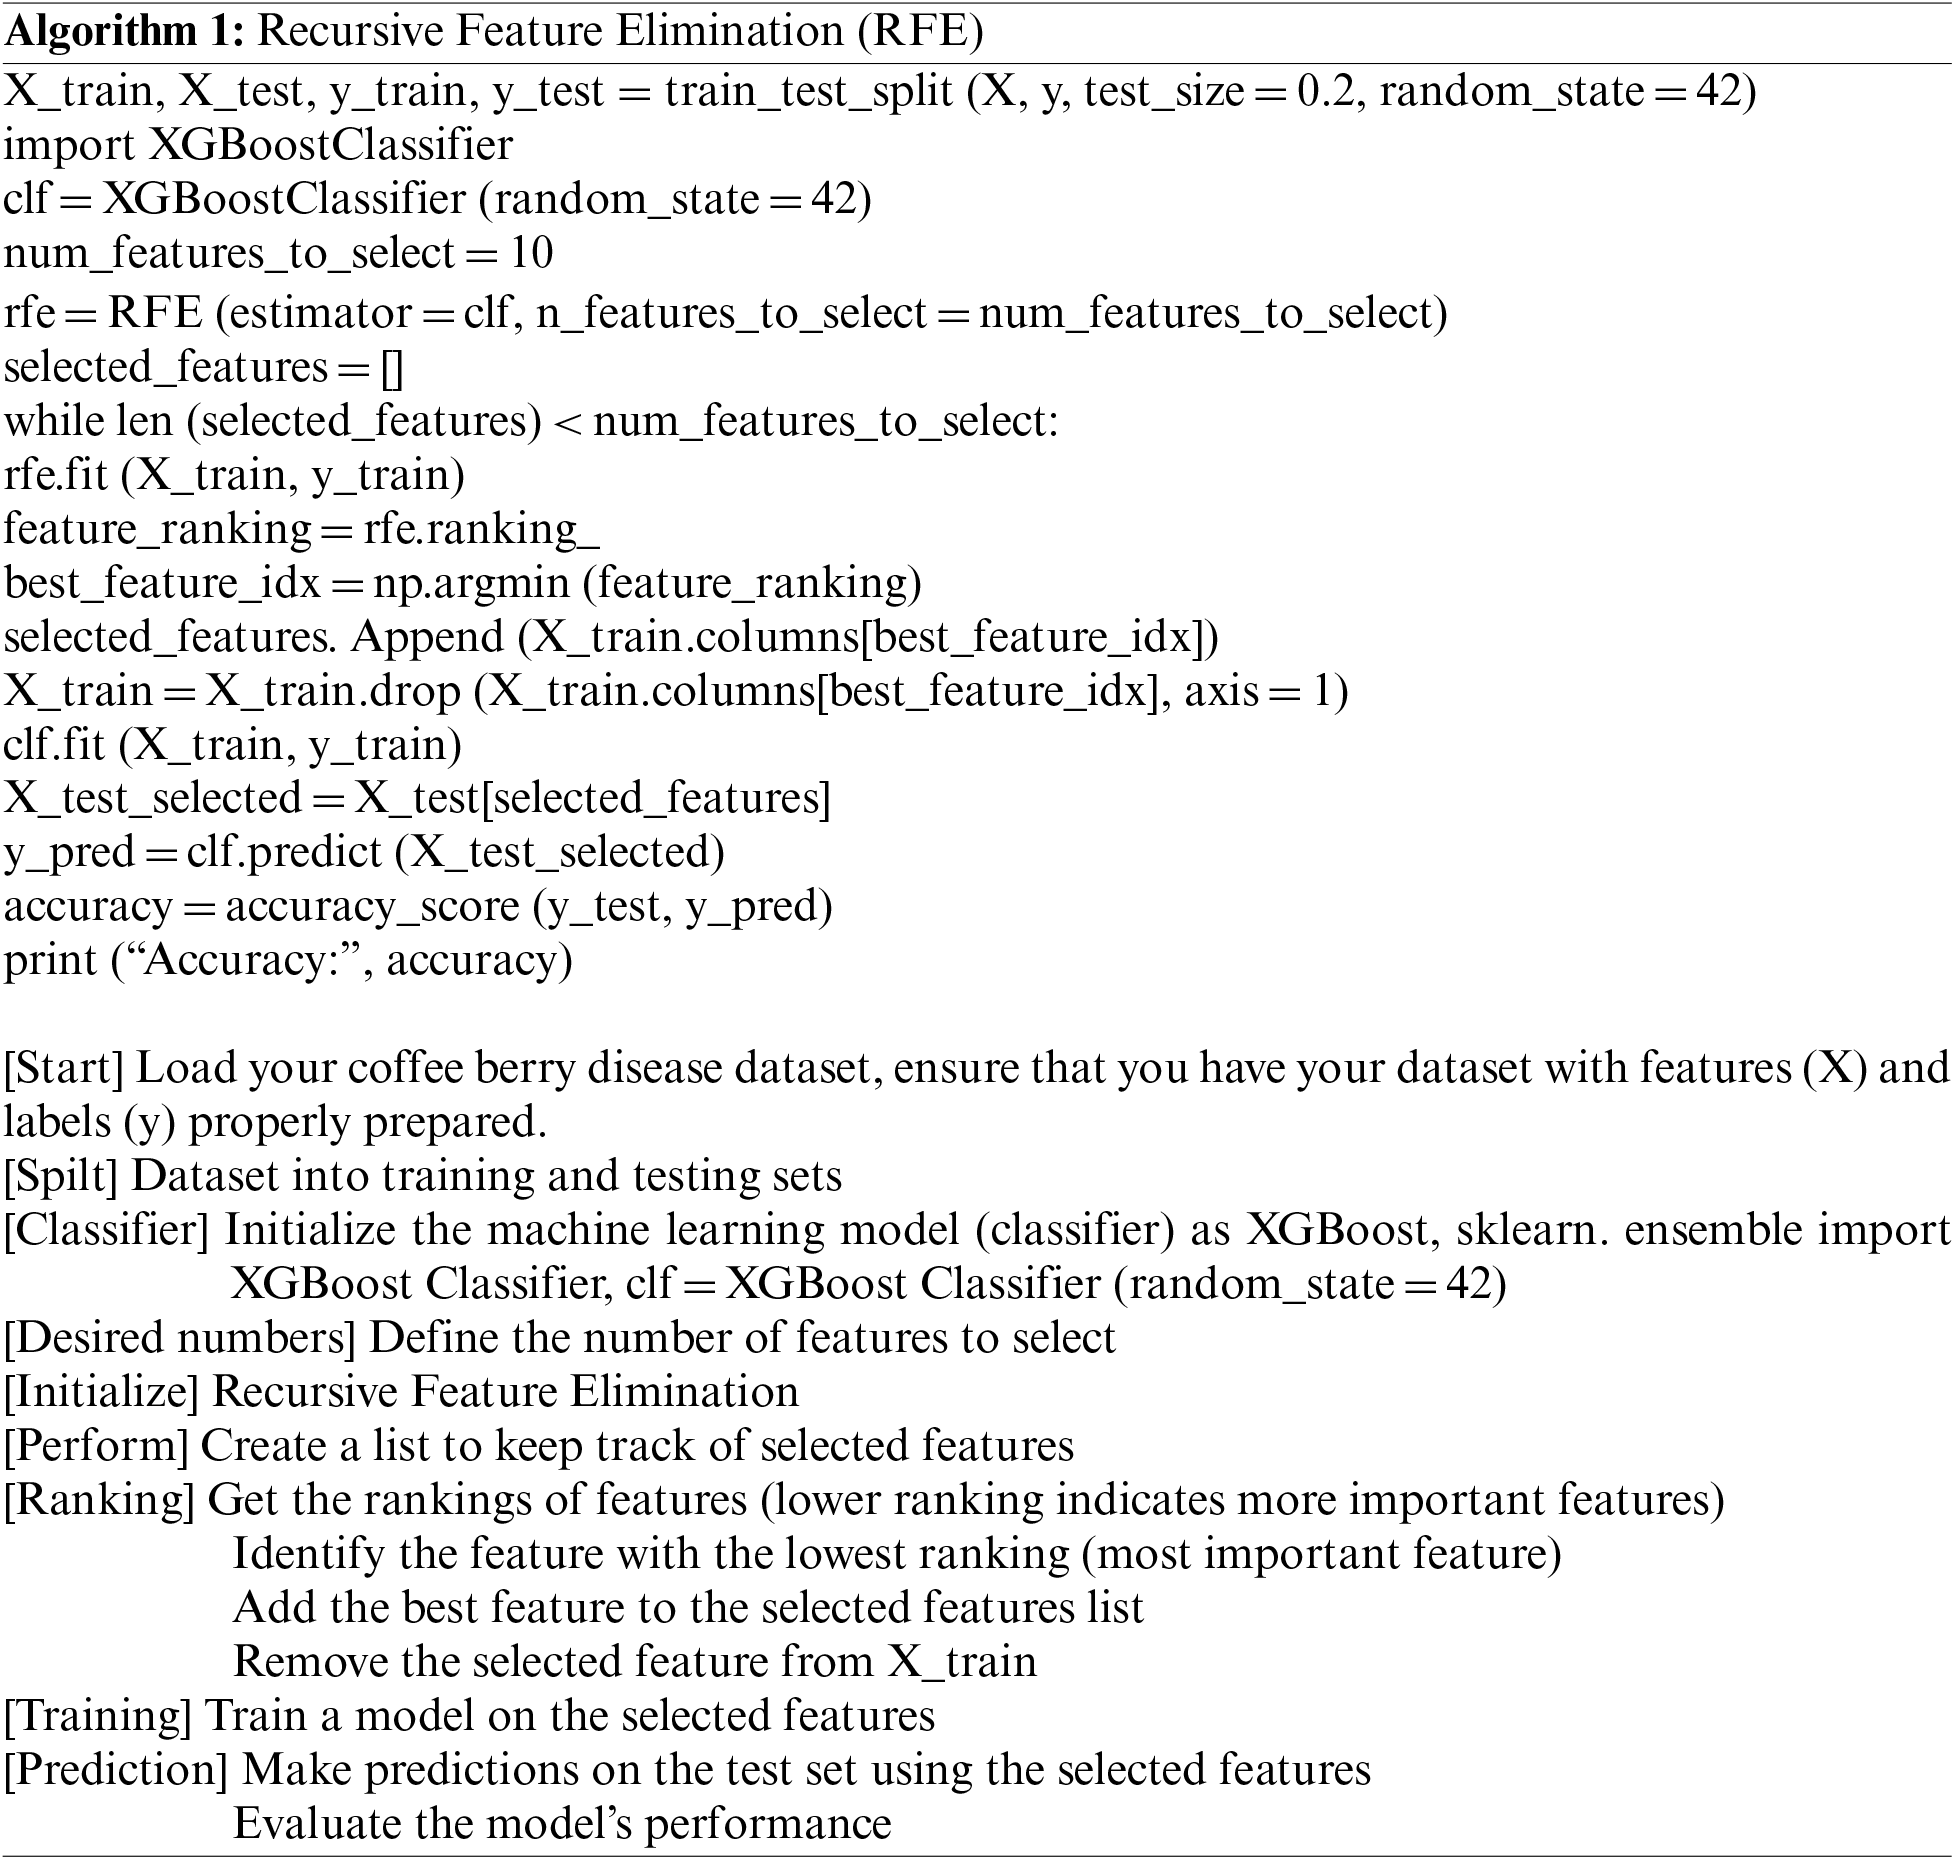
where the input image is the value of the input channel, min is the minimum value of the input channel in the dataset, max is the minimum value of the input channel in the dataset, and the output channel is the normalized value of the input channel. if the Input image is 100, the min is 0 and the max is 255, then the result will be 127.5. This is because (100–0)/(255–0) = 127.5. Data argumentation is achieved using Random cropping: which involves randomly cropping the images of diseased and healthy coffee cherries, image flipping: which involves flipping the images of diseased and healthy coffee cherries horizontally or vertically, and image rotation: which involves rotating the images of diseased and healthy coffee cherries by a random angle all the following techniques helps to improve the performance by reducing overfitting, make more robust by changing the orientation of the images. The recursive Feature Elimination Algorithm is a feature selection method that works by removing the least important features from the dataset. The procedure begins by determining the relevance of each feature by fitting a model to the entire dataset. The model is re-fit once the least essential feature has been eliminated from the data set. This is done until an adequate number of features has been selected are stored in the selected_features list and returned as the output of the algorithm.
In research, datasets are collected from Immature Cherry 130, Half-ripe Cherry 320, Overripe Cherry 112, and Dry Cherry 78. Training, Testing, Validating, and Holding out progress are involved in all four groups. The training data set is used to train the model and change the weights, while the validation set is used to fine-tune the model’s hyperparameters and prevent over fitting. A testing set is used to evaluate the trained model’s final performance and can assist in determining whether the model is ready for deployment or requires any tweaks. Holdout is often used to evaluate the model’s performance after all necessary adjustments based on the training, validation, and testing sets. Following that, processing and model development will handle missing values and normalization. The proportion is based on dataset availability and the nature of the coffee berry disease problem [31]. Group 1 has a dataset for immature cherries, Group 2 has a dataset for Half-rip cherries consisting of Half-ripe and mature cherries, Group 3 has a dataset for ripe cherries, and Group 4 has a dataset for dry cherries as shown in Table 2. In all the four groups are split into training 60%, Testing 20%, Validation 10%, and Holdout 10%. The purpose of splitting the dataset into four groups is to ensure that the model is not over fitting when training the data, set to select the features, and perform 10 cross folds validation.
An XG Boost is a tree-based model that is used to train and classify coffee berries as either infected or healthy. The algorithm will start by building a simple decision tree. This tree will split the data into four groups, based on the value of one of the features. For illustration, the tree might split the data based on the size of the berry. Most visible as microscopic and dark, sunken with brown patches on the green berry that start small and later enlarge in the area, eating the entire fruit and rendering it black. The algorithm will subsequently evaluate tree performance. If the decision of the tree is inaccurate, the algorithm will build a new tree that fixes the deficiencies. This will be performed until the algorithm converges or a maximum number of trees is achieved. “Sample 1” consists of the immature Cherry 160 dataset split into training 60%, Testing 20%, Validation 10%, and Holdout 10%. Trained using XGBoost parameters, such as maximum depth, learning rate, and the number of estimators as shown in Fig. 3. The maximum depth of each tree is a hyperparameter that controls the complexity of the model. A higher depth limit allows the model to learn more complicated patterns in the data but can also result in overfitting. A reduced maximum depth will keep the algorithm from overfitting.
where max_depth is the maximum depth of each tree in the XGBoost model, n_features are the number of features in the dataset, and d_max is the maximum depth specified by the user as shown in Eq. (2). The maximum depth of a tree is its total amount of levels. A tree with a maximum depth of 1 has one level, and 2 has two levels, etc. A deeper tree can learn more intricate feature-target variable relationships [32,33].
where learning_rate is the learning rate of the XGBoost model and t is the number of trees in the XGBoost model as shown in Eq. (3). The learning rate regulates model updates per iteration. A faster learning rate will speed up model learning. A number of estimators is a number of trees built in the XGBoost. A higher level of estimators results in high accuracy. The XGBoost technique can train a model to categorize new coffee berries as infected or healthy. Start by setting the maximum depth to 3, learning rate to 0.1, and estimators to 100. This will yield a complicated, accurate model [34]. Additionally, evaluated model performance.
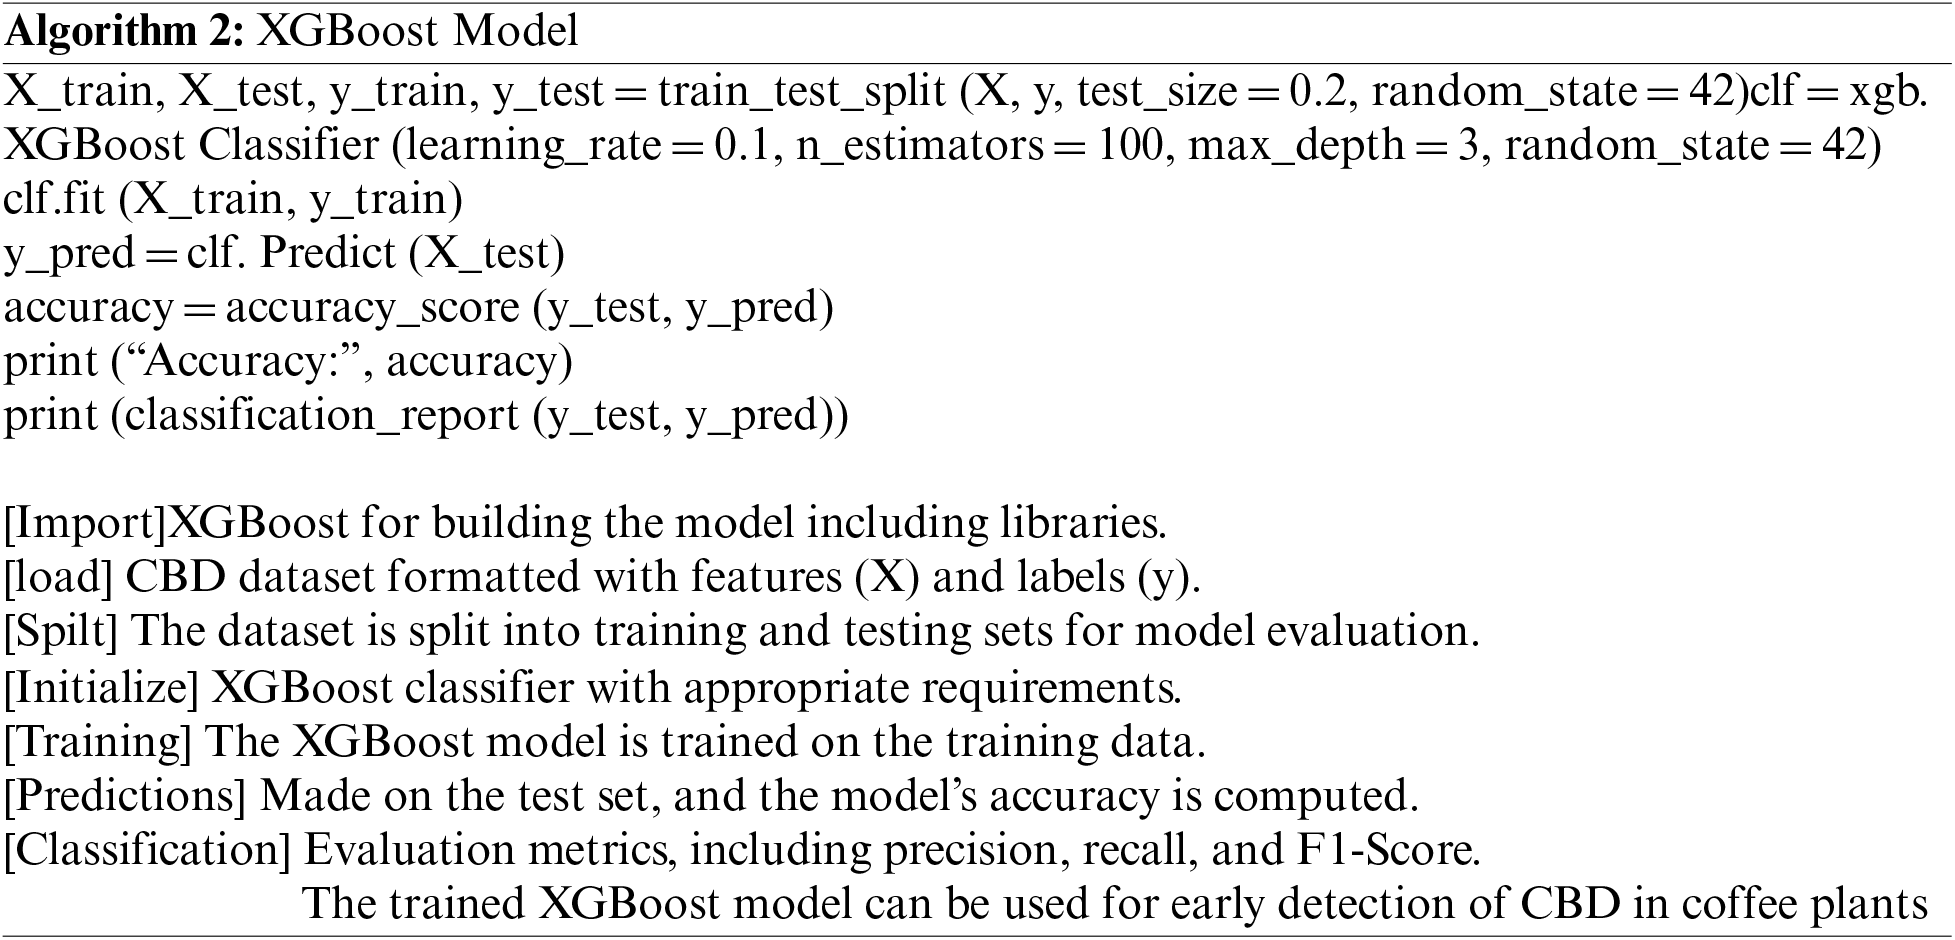
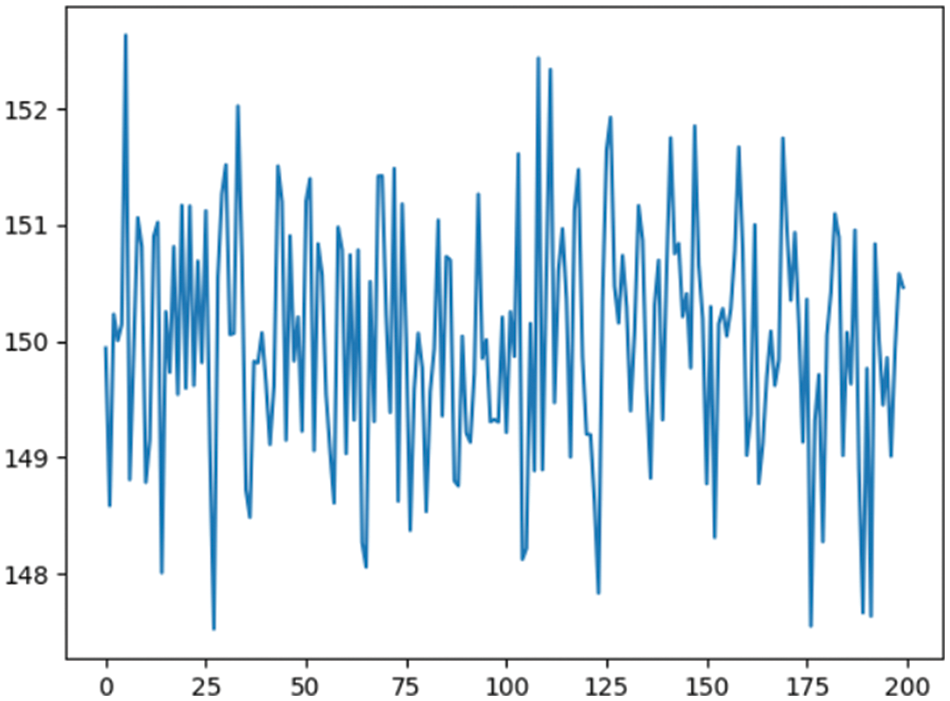
Figure 3: Training and iterations for XGBoost model
XGBoost model takes as input two arguments (data, target) imported into XGBoost Library then, creates an XGBoost classifier model. It defines the XGBoost model parameters by training the model on the data and target arguments to make predictions on the data argument and returns the predictions. “Sample 2” consists of Half-Ripe Cherry 320 dataset split into training 60%, Testing 20%, Validation 10%, and Holdout 10%. Trained using XGBoost parameters, such as maximum depth, learning rate, and the number of estimators. “Sample 3” consists of Ripe Cherry 112 dataset split into training 60%, Testing 20%, Validation 10%, and Holdout 10%. Trained using XGBoost parameters, such as maximum depth, learning rate, and the number of estimators. “Sample 4” consists of Overripe Cherry 78 dataset split into training 60%, Testing 20%, Validation 10%, and Holdout 10%. Trained using XGBoost parameters, such as maximum depth, learning rate, and the number of estimators [35,36]. If the model is inaccurate, increase the maximum depth or estimators. Decrease the learning rate slightly. The algorithm will then evaluate the tree’s performance. If the tree is not accurate enough, the algorithm will construct a new tree that attempts to repair the prior tree’s flaws. This method will be repeated until the algorithm converges or a certain number of trees are attained. The final model will be a composite of all of the trees that were constructed. The model will decide which tree to employ based on the characteristics of the new coffee berry. The tree that is employed will then predict if the berry is diseased or healthy.
SHAP (Shapley Additive explanations) analysis is used for coffee berry disease analysis to gain interpretability and insights into the predictions made by machine learning models providing a quantitative measure of feature importance [37] is maintained by calculating each feature’s contribution to the prediction of a specific instance. if the SHAP analysis shows that the size of the coffee berry is the most important feature, this means that the model is more likely to classify a berry as infected if it is larger than average. SHAP analysis can also be used to identify outliers.
An outlier is a case in which the model predicts wrong. SHAP analysis can assist in identifying the features that are most different for the outlier, which can aid in understanding why the model made the incorrect prediction and improve the model by removing outliers by focusing on important features as shown in Eq. (4). The SHAP value for a CBD-specific feature and instance is calculated as the difference between the average prediction when the feature is included and the average prediction when the feature is excluded, considering all possible combinations of features.
where Φ (p, x) represents the SHAP value of feature j for instance x, m (S) is the average prediction for a subset of features S, m (S ∪ {p}) is the average prediction for the subset S with the feature j included and v is the total number of features. The formula calculates the difference in predictions between subsets that include the feature p and subsets that do not include the feature p. It sums up the differences over all possible combinations of features, considering all possible subsets S that exclude the feature p. The first line of code includes the SHAP library. The Explainer object is created using the second line. The SHAP values will be computed using this object. The SHAP values are computed in the third line. The SHAP values are returned by the fourth line. The fifth line is responsible for data loading. The target variable is loaded on the sixth line. The Explainer object is created using the model, data, and target in the seventh line. The eighth line employs the Shap.plots.bar () function to plot the SHAP values [38].
3.5 Virtual Inspection and Diagnosis
The trained XGBoost model is deployed in a virtual inspection system. Processed SHAP analysis images of coffee cherries from four different samples are captured using Colour based segmentation. Colour-based segmentation is a procedure for dividing the image into different colour subsections. Region-Growing is a technique for restoring together pixels of similar colour. This can be done by thresholding the image to identify pixels that are a certain colour, such as brown or black. Threshold value can be adjusted depending of the dataset. However, starting point is to use a threshold value is greater than or equal to 0.5 The region growing technique can then be used to group these pixels to form regions that represent the infected cherries [39,40]. The result can be accomplished by beginning with a cherry pixel and then repeatedly expanding the zone to include all nearby pixels with comparable colours which identifies and predicts whether the cherries are healthy or affected by the disease as illustrated in Fig. 4. This technique can be used to detect coffee berry disease in coffee cherries by identifying the characteristic colours of infected cherries. The initial stage in colour-based segmentation is to extract the image’s colour information using a variety of approaches, including RGB, HSV, and YCbCr colour schemes. Region-Growing can be effective in detecting coffee berry disease if the disease symptoms exhibit a cohesive region within the coffee berry. It can handle variations in lighting conditions and image quality and is capable of capturing local dependencies within the region [41]. The contribution of these techniques to virtual inspection is that they can be used to develop more accurate and efficient methods for identifying and classifying objects in images. This can be used to improve the quality of inspection and to reduce the cost of inspection.
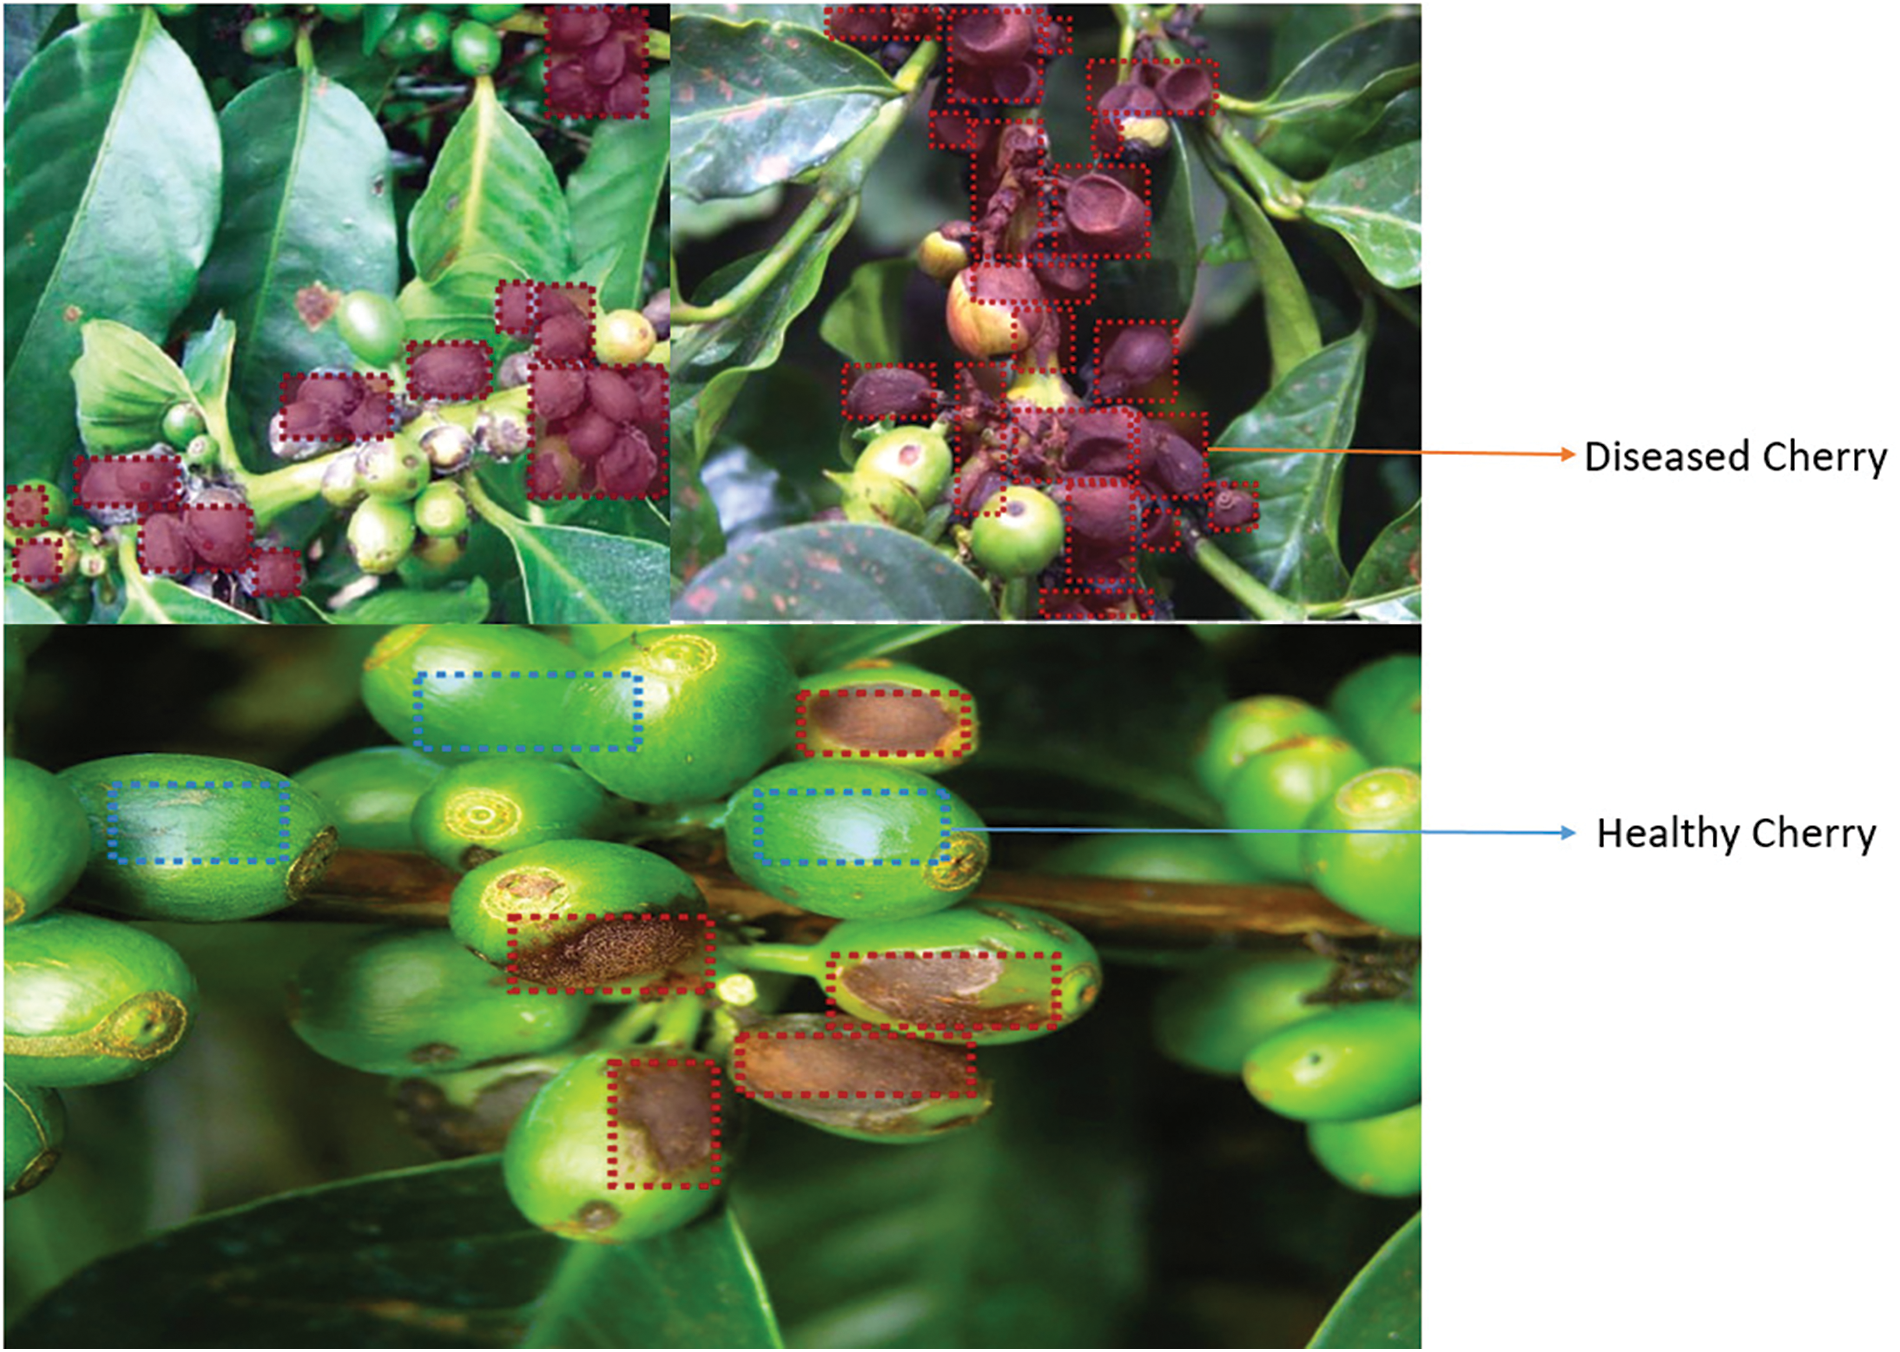
Figure 4: Colour-based segmentation with region growing technique
The coffee berry disease prediction results using XGBoost-based SHAP and virtual inspection were promising. The model was able to achieve an accuracy of 98.56%, as shown in Table 3, which is a significant improvement over previous methods. The model also identified the most important features for predicting coffee berry disease, which can be used to develop targeted interventions. The SHAP values, which are a measure of the importance of each feature in the model, showed that the most important features for predicting coffee berry disease were the cherry colour, the cherry Shape, and the presence of lesions. These features are all visible through virtual inspection, which means that the model can be used to predict coffee berry disease without the need for physical sampling and identify coffee plants at risk of infection, which can help reduce the spread of the disease and protect coffee production. Section 4 deals with the tenfold cross-validation with the existing algorithm. Section 4 shows the evaluation setup using XGBoost and SHAP by comparing the performance evaluation.

Implementing XGBoost and SHAP analysis to compare the proposed model’s performance about, concerning its accuracy and losses, respectively.
Python 3.6.5 simulates the suggested model on PC i5-8600k, GeForce 1050Ti 4 GB, 16 GB RAM, 250 GB SSD, and 1 TB HDD. The parameter settings are learning rate: 0.01, dropout: 0.5, batch size: 5, epochs: 45. The suggested model was created using Keres Python framework and library version 2.7. The tests used input image sizes from 32 × 32 by 3 to 256 × 256 by 3. The proposed strategy appeared to outperform others for a 224 × 224 × 3 image size. The suggested model is evaluated using True Positive, True Negative, False Negative, and False Positive metrics using the XGBoost model and SHAP analysis.
4.2 Performance Evaluation of the XGBoost
True Positive (TP): the percentage of cases that were both diseased and accurately expected to be diseased as indicated in Eqs. (5)–(9). False Positive (FP): the percentage of cases that were truly healthy but were misdiagnosed as ill. False Negative (FN): the percentage of cases that were genuinely ill but were misdiagnosed as healthy. True Negative (TN): the percentage of cases that were both healthy and accurately anticipated to be healthy.
As a consequence, Table 3 demonstrates that the proposed method classified the coffee cherry photos into five categories—Healthy, Sample 1, Sample 2, Sample 3, and Sample 4 with an overall accuracy of 80.18%. The suggested method has a precision rate of 83.03%, a recall rate of 87.29%, a specificity rate of 88.62%, and an F1-Score of 89.42%.
4.3 Performance Evaluation of the SHAP Analysis over XGBoost
Samples generated from performance evaluation for the XGBoost are processed to achieve accuracy. Additionally, utilizing the XAI tool, the developers employed the SHAP method to thoroughly describe the algorithm. The SHAP calculates the value of characteristics based on their residual effect 60 using Shapley values [42]. The SHAP assessment can be performed on all specimens to discover which qualities provide the most value. Furthermore, the SHAP can be utilized as just one component to explain what factors contributed to the model’s ability to predict a particular category and how much they impacted the model’s accuracy as illustrated in Table 4.

The proposed approach properly identified 489 images out of 640, i.e., 85, 170, 62, 44, and 112 for Sample 1, Sample 2, Sample 3, Sample 4, and Healthy samples, respectively. In Sample 1, 0 photos were classed as FN (Healthy), whereas only 4 photos in Sample 2 were classified as FP. This is because, since that Sample 1 coffee cherry has features with Healthy images (Sample 3). Furthermore, Sample 3 and Sample 4 had the lowest gaps between coffee cherry photos, with Sample 3 having three FN (Healthy) coffee cherry images and Sample 4 having only one FP (Sample 3) image. 5 photographs of healthy coffee cherries round up the Sample 1 classifications. Suggested method exhibits accuracy rates of 85.412%, 90.564%, 92.646%, 92.426%, and 90.862% for Sample 1, Sample 2, Sample 3, Sample 4, and Healthy samples, respectively.
4.4 Performance Evaluation for 10-Fold Cross-Validation
Performance evaluation involves partitioning the dataset into ten distinct folds. The model is subsequently trained on nine folds and evaluated on the remaining fold. The aforementioned procedure is iterated in a total of ten cross folds, and subsequently, the outcomes are computed as an average [43]. The model would be trained on 90% of the dataset and tested on the remaining 10%. This process would be repeated 10 times, and the results would be averaged from the Fig. 5.
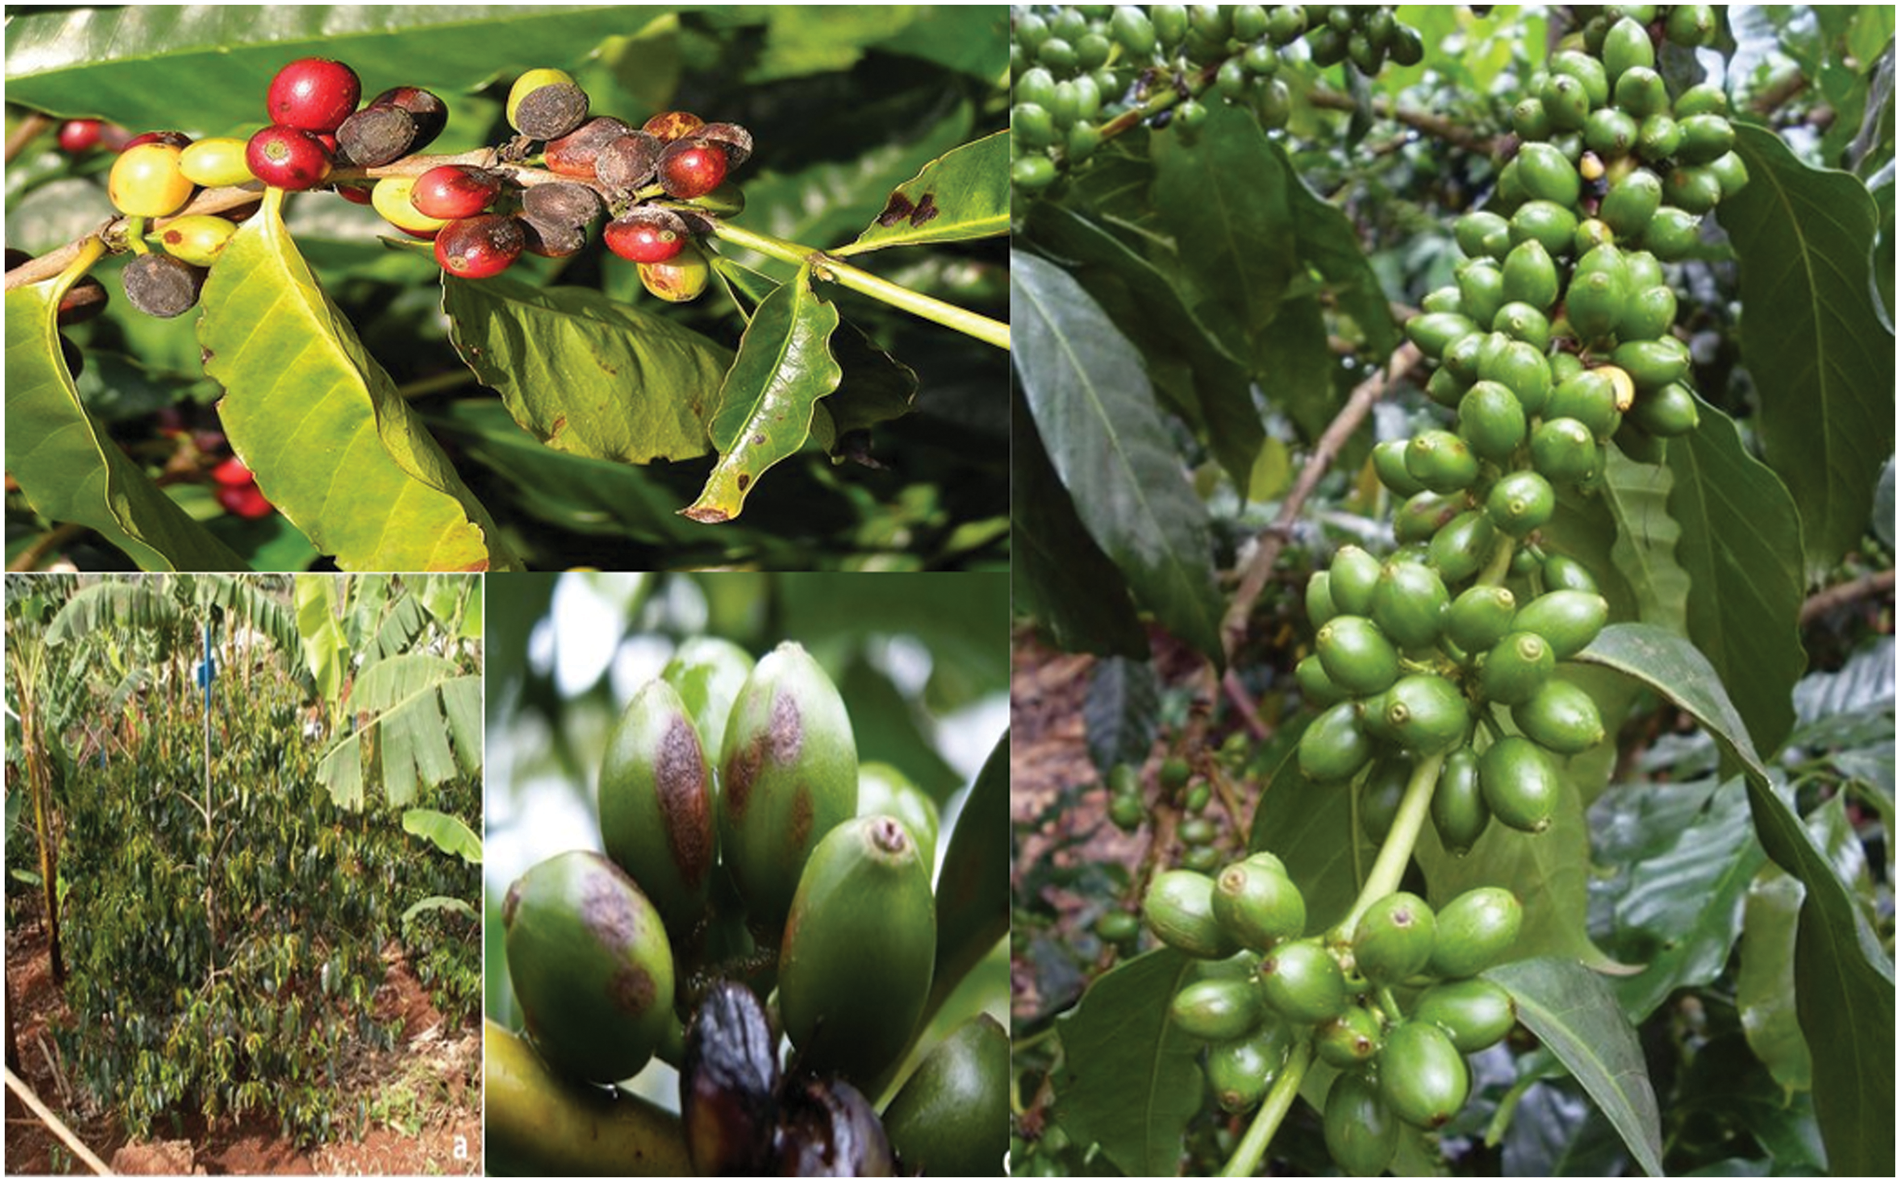
Figure 5: Coffee berry disease prediction
50 healthy coffee cherry images out of 448, 48 of which were Sample 1, were misclassified. 10 photographs were mislabeled as dry cherry due to minute variations between Sample 1 and Healthy shots. Similar to this, 445, 420, and 430 of 500 coffee cherry Samples 2, 3, and 4 were correctly identified. Thus, the suggested method separates cherry images into five categories. The grade-wise accuracy ratings are 91.89%, 92.23%, 94.57%, 95.97%, and 97.23%. The suggested model outperforms than existing model with an accuracy of 98.56% in Table 5.

4.5 Comparison with the Existing Methodologies
Early on the Keras library is employed to conduct a comparative analysis of the performance of various Machine Learning algorithms, namely SVM Linear Kernel, Random Forest, Naive Bayes, DenseNet 121, and ResNet-50. These algorithms are executed, guided, and evaluated using the gathered dataset. The evaluation of the accuracy of several procedures was conducted. The graph presented for SVM Linear Kernel in Fig. 6, Random Forest in Fig. 7, Naive Bayes in Fig. 8, DenseNet 121 in Fig. 9 and ResNet-50 in Fig. 10. Figures illustrates the relationship between accuracy and the number of epochs for the individual model. The performance of various machine learning models in classifying coffee berries as infected or healthy was evaluated. Specifically, a Support Vector Machine (SVM) with a linear kernel achieved an accuracy of 85.12%. Similarly, a Random Forest model achieved an accuracy of 84.02%, while a Naive Bayes model achieved an accuracy of 81.21%. Additionally, the DenseNet 121 model achieved an accuracy of 85.12%, and the ResNet-50 model achieved an accuracy of 85.12%. These results are depicted in Fig. 11.
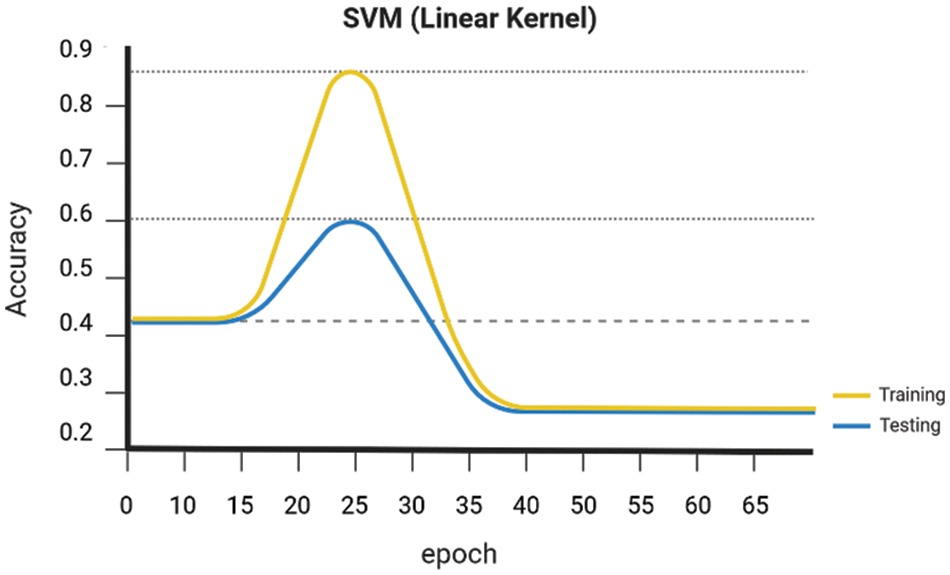
Figure 6: SVM linear kernel
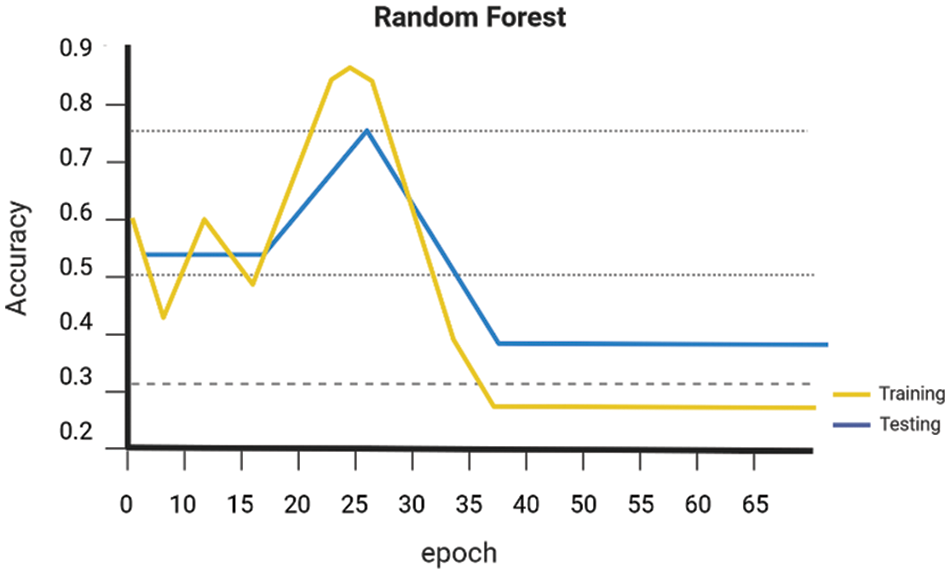
Figure 7: Random forest
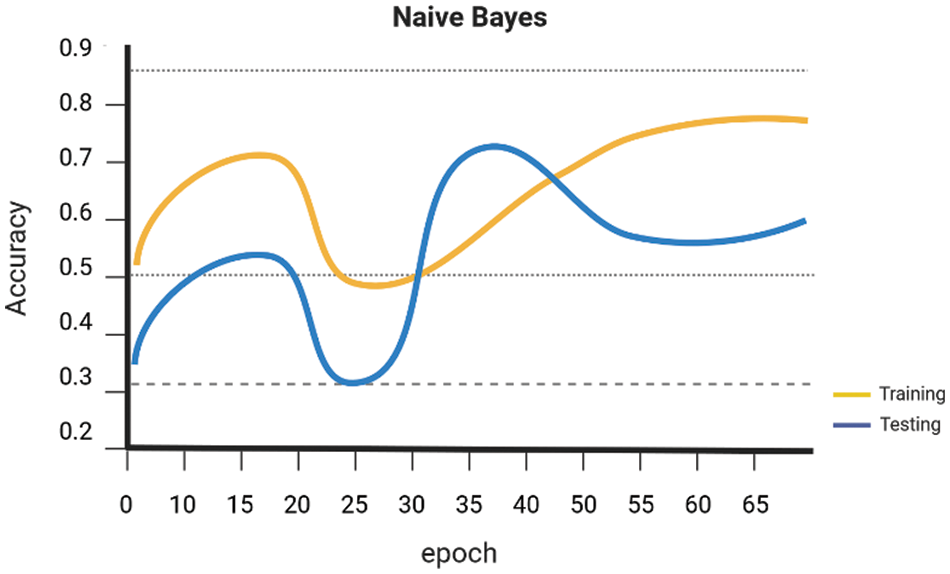
Figure 8: Naïve bayes
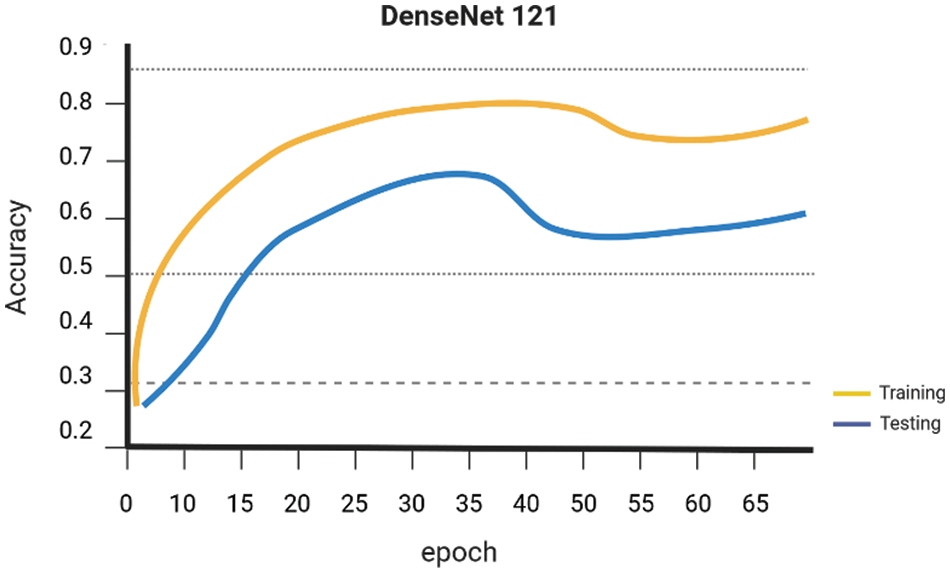
Figure 9: DenseNet 121
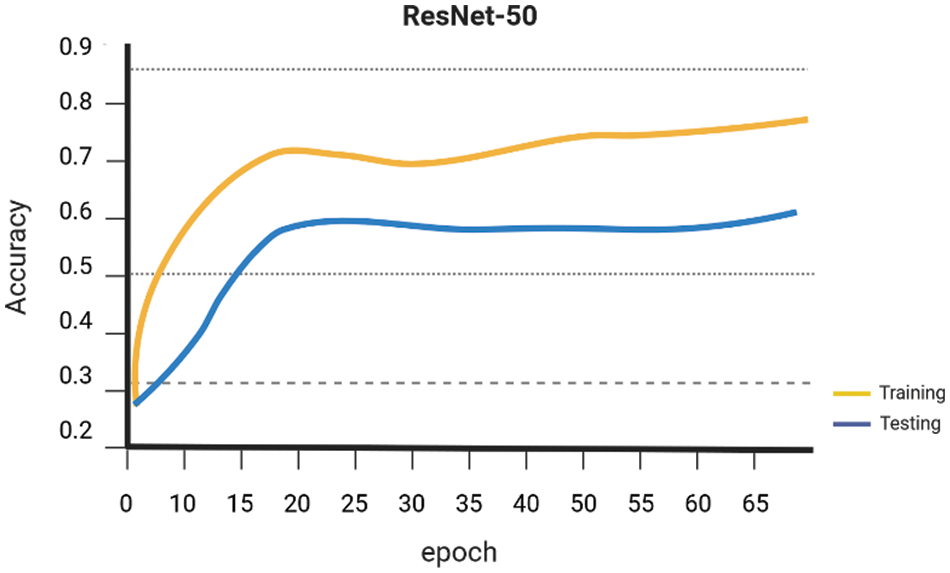
Figure 10: ResNet-50
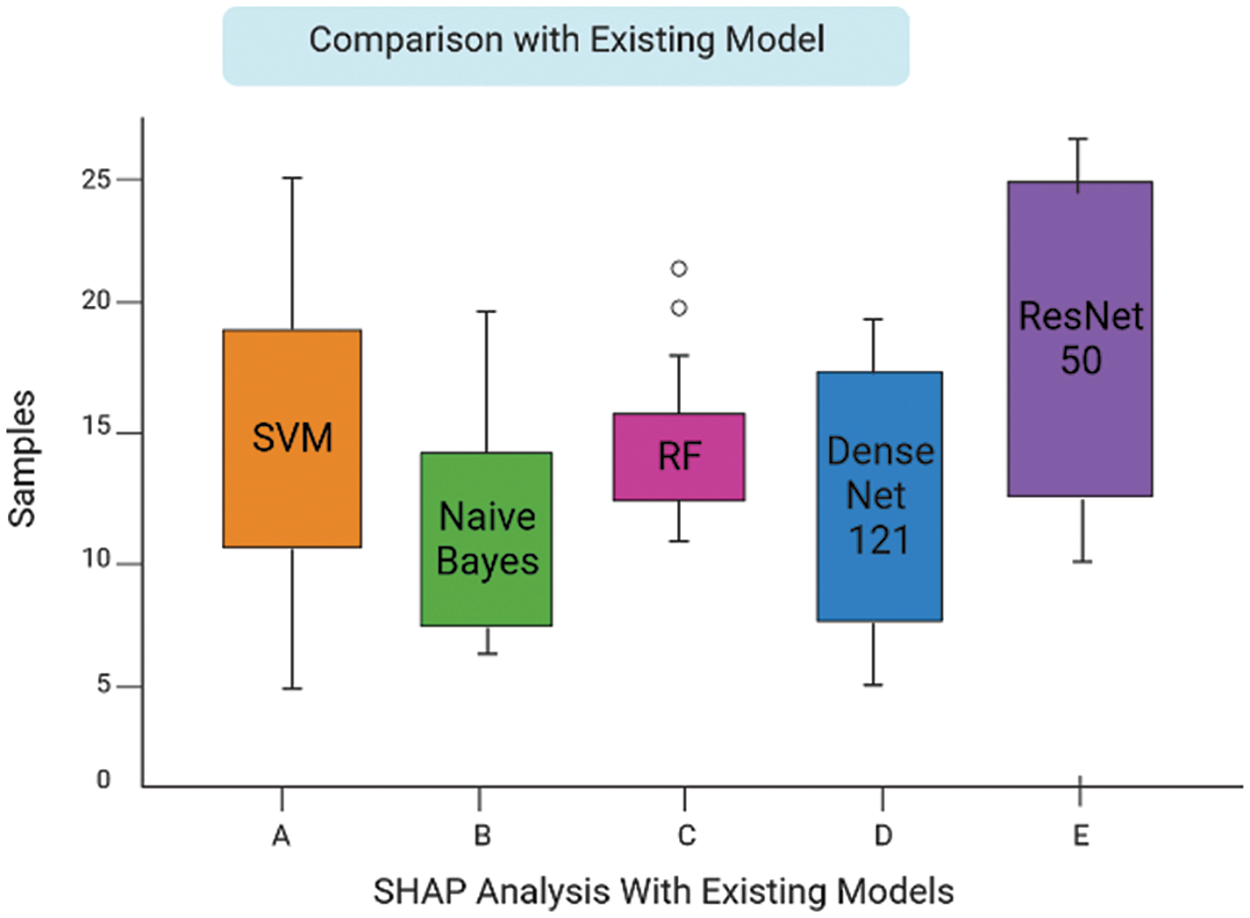
Figure 11: Comparison between other models
Fig. 12 specifies the loss throughout training and testing; as the number of iterations grows, the losses decrease. In the process of model training, it is expected that the training loss will exhibit a decreasing trend. Additionally, in the absence of overfitting, the testing loss should demonstrate a level of similarity to the training loss. In epoch 1 training loss is 1.8 and the testing loss is 1.9, in epoch 2 training loss is 1.7 and testing loss is 1.8, in epoch 3 training loss is 1.6 and testing loss is 1.7, in epoch 4 training loss is 1.5 and testing loss is 1.6, The loss is greater at first and decreases as the number of repeats grows. When 18 iterations were completed, the loss was 0.9%, and when 26 iterations were completed, the loss was less than 0.3%.
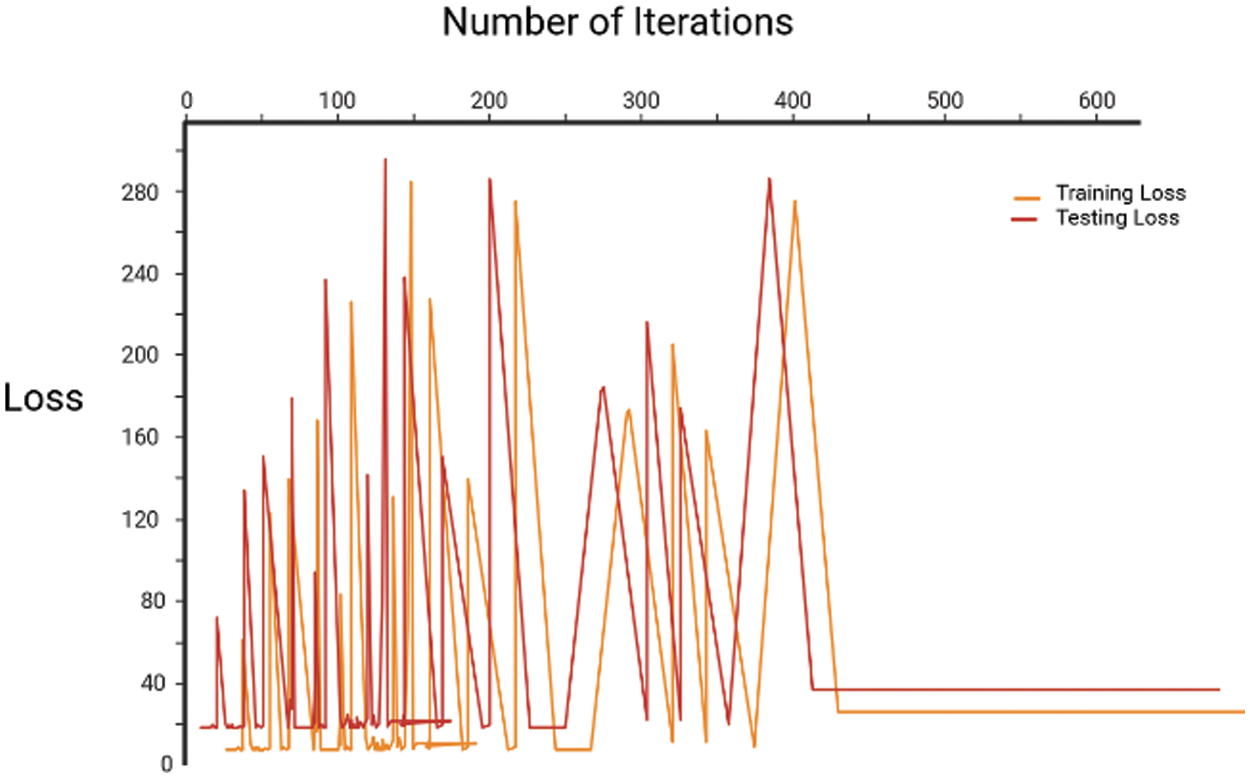
Figure 12: Training and testing loss
Fig. 13 also depicts a full confusion matrix for the classification task performed by the proposed model, the Boosted SHAP Analysis.
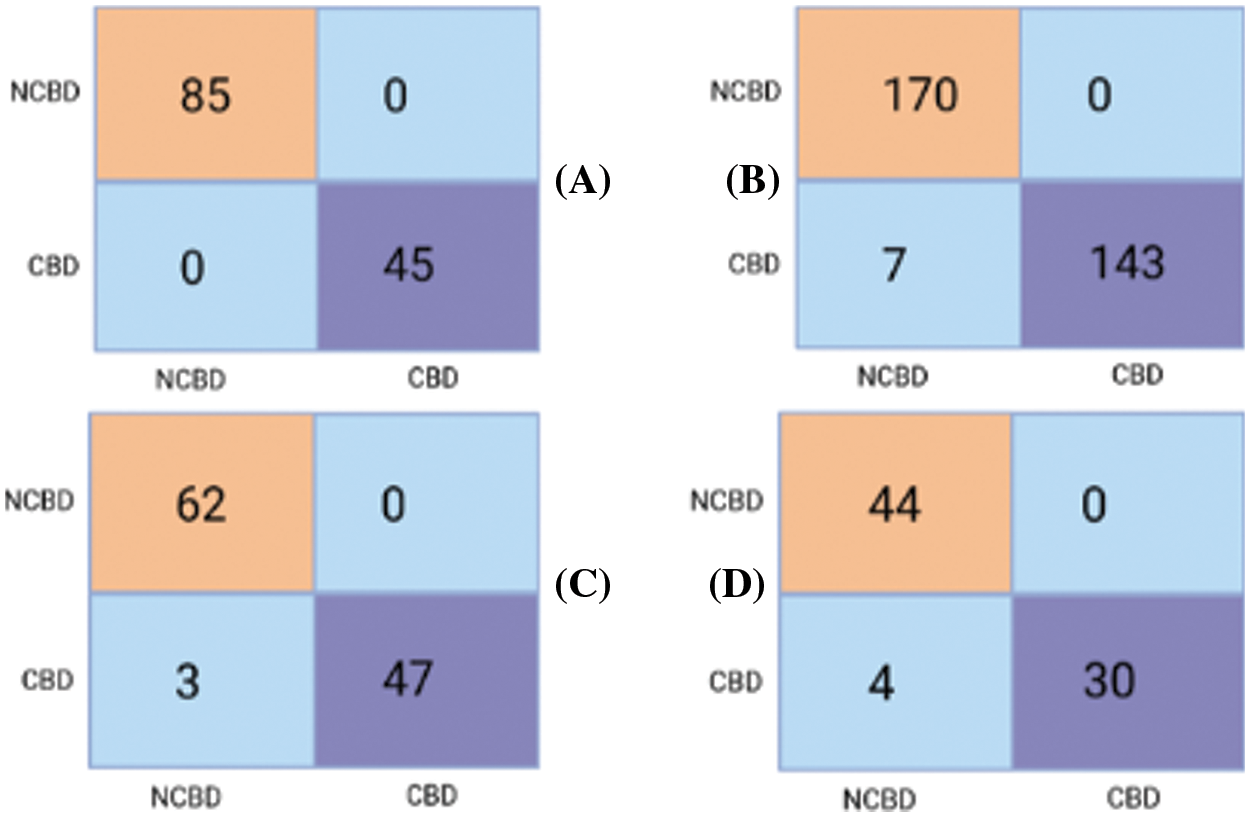
Figure 13: Sample (A), Sample (B), Sample (C), Sample, (D) Confusion matrix for testing set
Fig. 14 shows that the proposed method exceeds its competitors in many parameters. In comparison to other contemporary methodologies, the model put forth achieved an accuracy of 98.56%.
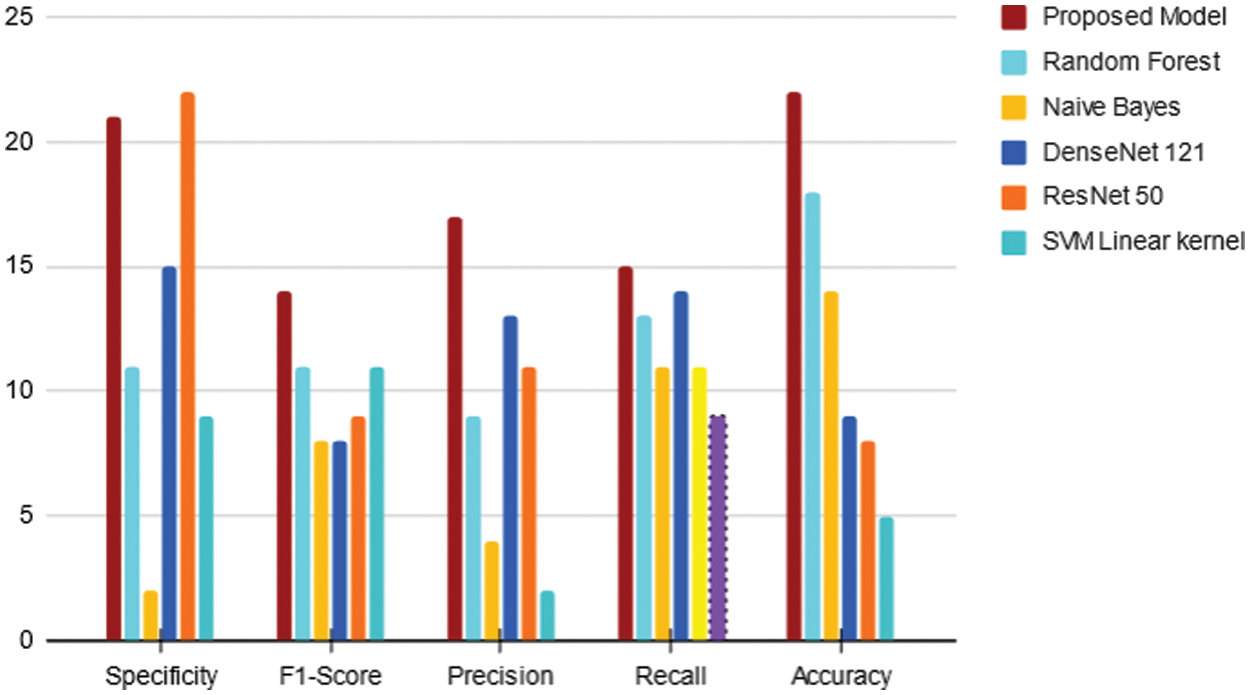
Figure 14: Performance evaluation
This research paper presents a unique and quality machine learning-based model for classifying and identifying coffee cherry disease based on the stages of cherry development. Coffee berry disease (CBD) is a devastating disease that can destroy coffee crops and reduce the quality and quantity of coffee production. In the proposed work, cherry datasets are divided into three stages and 6 varieties (healthy, Sample 1, Sample 2, Sample 3, and Sample 4) coffee cherry dataset. XGBoost Model is utilized for image segmentation and classification based on the colour of the cherry, presence of spots on the cherry, size of the spots, shape of the spots, and location of the spots on the cherry. SHAP model is utilized to highlight the important features and extract features from the segmented images. These images are processed using the trained model, which predicts whether the cherries are healthy or affected by the disease. The model is trained by combining XGBoost and SHAP analysis to improve the quality and accuracy of the performance. Virtual inspection will compare the real-time images and processed images to identify cherry is infected or not. The performance of the current approaches and the suggested strategy is evaluated using the three Stages of Coffee Cherry data set, with an accuracy of 98.56%. The proposed method exceeds its competitors. Future research will concentrate on prescribing fertilizers for plant disease control in early diagnosis and prevention of spread. Excessive fertilizer use will damage plants and destroy soil quality.
Acknowledgement: The authors would like to express their gratitude to the Deanship for Research & Innovation, Ministry of Education in Saudi Arabia for providing financial support for this research study.
Funding Statement: The current research study has received financial support from the Deanship for Research & Innovation, Ministry of Education in Saudi Arabia, under the Auspices of Project Number: IFP22UQU4281768DSR122.
Author Contributions: Conceptualization, Y.A., and R.S.; methodology, S.R.; software, R.S.; validation, Y.A., S.R., and R.S.; formal analysis, Y.A.; investigation, S.R.; resources, Y.A.; data curation, R.S.; writing—original draft preparation, S.R.; writing—review and editing, Y.A.; visualization, Y.A.; supervision, R.S.; project administration, S.R.; funding acquisition, Y.A. All authors have read and agreed to the published version of the manuscript.
Availability of Data and Materials: The dataset utilized and analyzed in our research is publicly accessible to the public cherry coffee beans from different stages in the Zenodo communities (https://zenodo.org/record/4914786), (https://www.nature.com/articles/s41598-019-38775-5/figures/1). The coding system along with additional data are accessible upon adequate request from the initial and coauthor authors.
Conflicts of Interest: The authors declare that they have no conflicts of interest to report regarding the present study.
References
1. Kaya, Y., Gursoy, E. (2023). A novel multi-head CNN design to identify plant diseases using the fusion of RGB images. Ecological Informatics, 75, 101998. [Google Scholar]
2. Natacha, M., Ribeyre, F., Poggi, S. (2019). Coffee tree architecture and its interactions with microclimates drive the dynamics of coffee berry disease in coffee trees. Scientific Reports, 9(1), 2544. [Google Scholar]
3. Kumlachew, A., Adugna, G., Lemessa, F. (2023). Biocontrol potentials of native bacterial strains for the management of coffee berry disease (Colletotrichum kahawae) in Ethiopia. Biocontrol Science and Technology, 33(1), 98–114. [Google Scholar]
4. Ngouegni, Y. Y., Tsopmbeng, N. G. R., Keuete, K. E. (2023). Morphocultural and aggressiveness variability of Colletotrichum kahawae isolates from different altitudes of the western highlight zone of Cameroon. Acta Ecologica Sinica, 47(13), 777–780. [Google Scholar]
5. Tamilvizhi, T., Alotaibi, Y., Rajendran, S. (2023). Improved wolf swarm optimization with deep-learning-based movement analysis and self-regulated human activity recognition. AIMS Mathematics, 8(5), 12520–12539. [Google Scholar]
6. Meshal, A., Rajagopal, S. K., Rajendran, S. (2023). Plant disease classification based on ConvLSTM U-Net with fully connected convolutional layers. Traitement du Signal, 40(1), 157–168. [Google Scholar]
7. Subahi, A. F., Khalaf, O. I., Alotaibi, Y. (2022). Modified self-adaptive Bayesian algorithm for smart heart disease prediction in IoT system. Sustainability, 14(21), 14208–14218. [Google Scholar]
8. Kumar, R. S., Thanarajan, T., Alotaibi, Y. (2023). Brain tumor: Hybrid feature extraction based on UNet and 3DCNN. Computer Systems Science and Engineering, 45(2), 2093–2109. https://doi.org/10.32604/csse.2023.032488 [Google Scholar] [CrossRef]
9. Raveena, S., Surendran, R. (2023). ResNet50-based classification of coffee cherry maturity using deep-CNN. 5th International Conference on Smart Systems and Inventive Technology (ICSSIT), pp. 1275–1281. Tirunelveli, India. [Google Scholar]
10. Anim-A, A. O., Schillaci, C., Lipani, A. (2023). Automatic blight disease detection in potato (Solanum tuberosum L.) and tomato (Solanum lycopersicum, L. 1753) plants using deep learning. Smart Agricultural Technology, 4(1), 100178–100189. [Google Scholar]
11. Sanida, M. V., Sanida, T. (2023). An efficient hybrid CNN classification model for tomato crop disease. Technologies, 11(1), 1–10. [Google Scholar]
12. Raghavendran, C. V., Bheema Rao, R. V. (2023). Bibliometric analysis on identifying plant crop diseases using machine learning and deep learning. In: Recent developments in electronics and communication systems, vol. 2, pp. 113–118. IOS Press. [Google Scholar]
13. Merga, D., Beksisa, L., Merga, W. (2023). Genetic variability of coffee (Coffea arabica L.) germplasm in biennial bearing and its influence on selection efficiency. International Journal of Agronomy, 2, 1–11. [Google Scholar]
14. Sudha, P., Kumaran, P. (2023). Early detection and control of anthracnose disease in cashew leaves to improve crop yield using image processing and machine learning techniques. signal, image, and video processing. Signal, Image and Video Processing, 1, 1–8. [Google Scholar]
15. Sadiq, S., Malik, K. R., Ali, W. (2023). Deep learning-based disease identification and classification in potato leaves. Journal of Computing & Biomedical Informatics, 5(1), 13–25. [Google Scholar]
16. Melese, A. S. (2023). Mathematical model and optimal control analysis of coffee berry borer with temperature and rainfall variability. International Journal of Biomathematics, 7, 1–10. [Google Scholar]
17. Milkisa, Y., Shimelis, B. (2021). Coffee disease visualization, and classification. Plants, 10 (6), 1257–1267. [Google Scholar]
18. Miranda, J. R. (2022). Detection of coffee berry necrosis by digital image processing of landsat 8 oli satellite imagery. International Journal of Applied Earth Observation and Geoinformation, 85(1), 101983–101995. [Google Scholar]
19. Abuhayi, B. M., Mossa, A. A. (2023). Coffee disease classification using convolutional neural network based on feature concatenation. Informatics in Medicine Unlocked, 39 (1), 101245–101256. [Google Scholar]
20. Zenebe, W., Daniel, T., Weyessa, G. (2021). Characterization and virulence determination of Colletotrichum kahawae isolate from Gidami, Western Ethiopia. Journal of Plant Science and Phytopathology, 5(1), 4–13. [Google Scholar]
21. Nurihun, B. A., Hylander, K., Adugna, G. (2023). Impact of climate and management on coffee berry disease and yield in Arabica coffee’s native range. Ecology and Evolution, 47(1), 777–780. [Google Scholar]
22. Hall, R. D., Trevisan, F., de Vos, R. C. (2022). Coffee berry and green bean chemistry–Opportunities for improving cup quality and crop circularity. Food Research International, 151(1), 110825–110836. [Google Scholar]
23. Eron, F., Noman, M., de Oliveira, R. R. (2023). Computer vision-aided intelligent monitoring of coffee: Towards sustainable coffee production. arXiv:2304.04966. [Google Scholar]
24. Doma, K. M., Lewis, E. D. (2023). Randomized, double-blind, placebo-controlled, parallel study investigating the efficacy of a whole coffee cherry extract and phosphatidylserine formulation on cognitive performance of healthy adults with self-perceived memory problems. Neurology and Therapy, 12(3), 777–94. [Google Scholar]
25. Muhari, E. H., Sihombing, R. P. (2023). Effect of fruit ripening level and roasting temperature on robusta coffee bean quality. International Journal Applied Technology Research, 1(4), 41–52. [Google Scholar]
26. Vasavi, P., Punitha, A., Rao, T. V. N. (2022). Crop leaf disease detection and classification using machine learning and deep learning algorithms by visual symptoms: A review. International Journal of Electrical and Computer Engineering, 1(12), 2079–2086. [Google Scholar]
27. Malik, A., Vaidya, G. V. (2022). Design and evaluation of a hybrid technique for detecting sunflower leaf disease using deep learning approach. Journal of Food Quality, 8(1), 1–2. [Google Scholar]
28. Paulos, E. B., Woldeyohannis, M. M. (2022). Detection and classification of coffee leaf disease using deep learning. International Conference on Information and Communication Technology for Development for Africa (ICT4DA), pp. 1–6. Bahir Dar, Ethiopia. [Google Scholar]
29. Mengistu, A. D., Mengistu, S. G., Melesew, D. (2018). An automatic coffee plant diseases identification using hybrid approaches of image processing and decision tree. Indonesian Journal of Electrical Engineering and Computer Science, 9(3), 806–811. [Google Scholar]
30. Zhou, H. X., Fang, Z. Y., Wang, Y. L., Tong, M. J. (2023). Image generation of tomato leaf disease identification based on small-ACGAN. Computers, Materials & Continua, 76(1), 175–194. https://doi.org/10.32604/cmc.2023.037342 [Google Scholar] [CrossRef]
31. Mariselvam, J., Rajendran, S., Alotaibi, Y. (2023). Reinforcement learning-based AI assistant and VR play therapy game for children with down syndrome bound to wheelchairs. AIMS Mathematics, 8(7), 16989–17011. [Google Scholar]
32. Nelson, M., Rajendran, S., Alotaibi, Y. (2023). Vision graph neural network-based neonatal identification to avoid swapping and abduction. AIMS Mathematics, 8(9), 21554–21571. [Google Scholar]
33. Vinay, G., Trivedi, N. K., Anand, A. (2023). Early skin disease identification using deep neural network. Computer Systems Science & Engineering, 44(3), 2259–2275. https://doi.org/10.32604/csse.2023.026358 [Google Scholar] [CrossRef]
34. ElShafee, A., El-Shafai, W. (2022). Real-time multi-class infection classification for respiratory diseases. Computers, Materials & Continua, 73(2), 4157–4177. https://doi.org/10.32604/cmc.2022.028847 [Google Scholar] [CrossRef]
35. Tamilvizhi, T., Surendran, R., Anbazhagan, K., Rajkumar, K. (2022). Quantum behaved particle swarm optimization-based deep transfer learning model for sugarcane leaf disease detection and classification. Mathematical Problems in Engineering, 2022(1), 1–12. [Google Scholar]
36. Khan, S. D., Basalamah, S. (2023). Multi-branch deep learning framework for land scene classification in satellite imagery. Remote Sensing, 15, 3408. [Google Scholar]
37. Osman, H. E., Fadhlallah, R. S. (2023). Impact of lead on seed germination, seedling growth, chemical composition, and forage quality of different varieties of sorghum. Journal of Umm Al-Qura University for Applied Sciences, 9, 77–86. [Google Scholar]
38. Alotaibi, S. S. (2023). Germination quality prognosis: Classifying spectroscopic images of the seed samples. Intelligent Automation & Soft Computing, 35(2), 1815–1829. https://doi.org/10.32604/iasc.2023.029446 [Google Scholar] [CrossRef]
39. Yu, H., Cheng, X., Li, Z., Cai, Q., Bi, C. (2022). Disease recognition of apple leaf using lightweight multi-scale network with ECANet. Computer Modeling in Engineering & Sciences, 132(3), 711–738. https://doi.org/10.32604/cmes.2022.020263 [Google Scholar] [CrossRef]
40. Shah, F. A., Akbar, H., Ali, A., Amna, P., Aljohani, M. et al. (2023). Towards intelligent detection and classification of rice plant diseases based on leaf image dataset. Computer Systems Science & Engineering, 47(2), 1385–1413. https://doi.org/10.32604/csse.2023.036144 [Google Scholar] [CrossRef]
41. Murthy, T. S., Kumar, K. V., Alenezi, F., Lydia, E. L., Park, G. C. et al. (2023). Artificial humming bird optimization with siamese convolutional neural network based fruit classification model. Computer Systems Science & Engineering, 47(2), 1633–1650. https://doi.org/10.32604/csse.2023.034769 [Google Scholar] [CrossRef]
42. Qadir, A., Mahum, R., Aladhadh, S. (2023). A robust approach for detection and classification of KOA based on BILSTM network. Computer Systems Science & Engineering, 47(2), 1365–1384. https://doi.org/10.32604/csse.2023.037033 [Google Scholar] [CrossRef]
43. Raveena, S., Surendran, R. (2023). Clustering-based hemileia vastatrix disease prediction in coffee leaf using deep belief network. 2023 8th International Conference on Communication and Electronics Systems (ICCES), pp. 1094–1100. Coimbatore, India. [Google Scholar]
Cite This Article
 Copyright © 2024 The Author(s). Published by Tech Science Press.
This work is licensed under a Creative Commons Attribution 4.0 International License , which permits unrestricted use, distribution, and reproduction in any medium, provided the original work is properly cited.
 Downloads
 Citation Tools