
 Submit a Paper
 Propose a Special lssue
 Open Access
ARTICLE

Influences of Co-Flow and Counter-Flow Modes of Reactant Flow Arrangement on a PEMFC at Start-Up
1 School of Petroleum Engineering, Guangdong University of Petrochemical Technology, Maoming, 525000, China
2 Mechanics Division, Beijing Computational Science Research Center, Beijing, 100193, China
* Corresponding Author: Min Wang. Email:
Computer Modeling in Engineering & Sciences 2024, 139(2), 1337-1356. https://doi.org/10.32604/cmes.2023.044313
Received 27 July 2023; Accepted 07 November 2023; Issue published 29 January 2024
 View Full Text
 Download PDF
Abstract
To investigate the influences of co-flow and counter-flow modes of reactant flow arrangement on a proton exchange membrane fuel cell (PEMFC) during start-up, unsteady physical and mathematical models fully coupling the flow, heat, and electrochemical reactions in a PEMFC are established. The continuity equation and momentum equation are solved by handling pressure-velocity coupling using the SIMPLE algorithm. The electrochemical reaction rates in the catalyst layers (CLs) of the cathode and anode are calculated using the Butler-Volmer equation. The multiphase mixture model describes the multiphase transport process of gas mixtures and liquid water in the fuel cell. After validation, the influences of co-flow and counter-flow modes on the PEMFC performance are investigated, including the evolution of the current density, flow field, temperature field, and reactant concentration field during start-up, as well as the steady distribution of the current density, reactant concentration, and membrane water content when the start-up stabilizes. Co-flow and counter-flow modes influence the current density distribution and temperature distribution. On the one hand, the co-flow mode accelerates the start-up process of the PEMFC and leads to a more evenly distributed current density than the counter-flow mode. On the other hand, the temperature difference between the inlet and outlet sections of the cell is up to 10.1°C under the co-flow mode, much larger than the 5.0°C observed in the counter-flow mode. Accordingly, the counter-flow mode results in a more evenly distributed temperature and a lower maximum temperature than the co-flow case. Therefore, in the flow field design of a PEMFC, the reactant flow arrangements can be considered to weigh between better heat management and higher current density distribution of the cell.Keywords
The continuing depletion of fossil fuels and ongoing greenhouse gas emissions have generated an urgent demand for clean energy alternatives. As a clean energy carrier, hydrogen has attracted significant interest due to its zero emissions and abundant sources. Hydrogen-fueled application devices, such as proton exchange membrane fuel cells (PEMFCs), promise to meet various power requirements. A PEMFC works by directly converting the chemical energy stored in hydrogen fuel into electric energy through electrochemical reactions [1,2]. The advantages of PEMFCs include zero emissions, low noise, high power density, high energy efficiency, and low operating temperature [3,4].
To broaden the applications of PEMFCs in various fields, improving cell performance has been a concern for many researchers. It is well recognized that PEMFC performance is closely correlated with the flow field design in the cell, as the flow field directly affects the pressure drop, flow velocity, water management, reactant distribution, and consumption [5,6]. Commonly employed flow field configurations include parallel, serpentine, and interdigitated designs [7,8]. Serpentine and interdigitated flow fields are superior to the parallel design in terms of water management and mass transfer due to the enhanced convective effect; however, both may experience a severe pressure drop. Parallel flow fields have relatively poor transport abilities, but the pressure drop is smaller. In order to improve PEMFC performance, modifications of the flow field have been extensively investigated. Adding baffles has proven to be effective [9–11]. For example, Chien et al. [9] improved PEMFC performance by placing obstacles in a serpentine channel. The vertical velocity component of the flow was enhanced by obstacles, and recirculation regions formed immediately downstream of each obstacle, which were found to intensify reactant gas flow into the gas diffusion layer and promote water removal from the cathode channel. Ebrahimzadeh et al. [10] investigated the effect of flow field configurations with baffles of different geometries and arrangements. PEMFCs with triangular baffles were found to have the lowest pressure drop, the highest reactant consumption, and the highest current density. Additionally, converging or diverging [12–14], stepped [15,16], and trapezoidal [17] flow field designs with flow area variations along the channel were demonstrated to be efficient in improving PEMFC performance. Other alternatives arise from the channel cross-section, which also influences PEMFC performance. Relevant attempts include using various cross-section shapes such as rectangular, triangular, semicircular, square, stepped, and trapezoidal [18,19] and modifying the cross-sectional area of the channels involving channel width and height and rib width [20,21]. For example, Wang et al. [18] examined the influence of triangular, trapezoidal, semicircular, and rectangular channels on the performance of PEMFCs. The effect of the cathode channel shape was apparent at low operating voltages, and the channel with a triangular cross-section produced the best cell performance with significantly enhanced reactant velocity, water removal ability, and oxygen utilization. Kerkoub et al. [20] investigated channel-to-rib width ratios' influence on PEMFCs with serpentine channels, parallel, and interdigitated designs. Both the flow field design and channel-to-rib width ratio showed their effects at low operating voltages. Decreasing the channel-to-rib width ratio can improve cell performance, as enhanced convection under the rib facilitates reactant distribution over the cell's active area. Additionally, various novel flow field designs have been proposed [22–27]. Rahimi-Esbo et al. [22] investigated seven flow field designs of serpentine flow channels. The 2-1-serpentine type, i.e., two channels at the beginning converged to one at the end, obtained the best performance. Li et al. [23] designed waved serpentine flow channels based on the conventional serpentine flow channel, revealing that waved channels caused a lower pressure drop and better cell performance than the conventional one. Liao et al. [24] examined zigzag flow field designs, which showed more uniform distributions of oxygen, water content, temperature, and current density compared to the straight design. Shen et al. [25] developed a 3D flow field based on a straight parallel flow field consisting of main channels, hydrophilic coated sub-channels, and transition areas. Cell performance was effectively improved by the 3D flow field with enhanced water removal and mass transfer. Wang et al. [26] designed an auxiliary fishbone-shaped flow field in the cathode flow field plate of PEMFCs, by which reactant uniformity, water removal ability, and cell stability were significantly improved compared with the conventional parallel flow field. Pashaki et al. [27] converted a planar (straight) PEMFC to a bent (arc-shaped) one and investigated its influence on cell performance. As a velocity component perpendicular to the gas diffusion layer (GDL) was created, it increased the centrifugal force imposed on the gas flow within the channel. This enhancement led to better oxygen transfer, thereby improving the cell's performance.
The reactant flow arrangement plays a vital role in improving PEMFC performance. Both the co-flow configuration, where hydrogen and airflow are in identical directions, and the counter-flow configuration, where the gas flows in opposite directions, have been extensively studied. Their influence on PEMFC performance is complex [24,28–31]. For instance, a comparison between zigzag flow field designs in counter-flow and co-flow modes revealed that the former exhibited more uniform distributions of oxygen, water content, and current density [24]. Fan et al. [28] numerically studied the effects of these flow modes on fuel cell performance and water transport at low anode inlet relative humidity. The counter-flow configuration resulted in stronger net water exchange between the cathode and anode through the membrane, leading to a more uniform membrane water distribution and higher cell performance than the co-flow mode. Scholta et al. [29] found that the counter-flow mode outperformed the co-flow mode when the anode gas was dry and the cathode gas was humidified. Yang et al. [30] studied the influence of flow direction on the dynamic response of non-humidified PEMFCs. During a stepwise increase in current density from 1.0 to 1.4 A/cm2, the counter-flow mode was preferred for its better performance and stability. In contrast, the co-flow mode experienced a brief period of zero power density due to low cell voltage. The effect of reactant flow arrangement on water management and cell performance was investigated in PEMFCs with 4-Serpentine and 1-Serpentine flow channels [31]. A cell with a 4-Serpentine channel under co-flow mode displayed better performance than counter-flow at low voltage; a cell with a 1-Serpentine channel under co-flow mode showed better performance than counter-flow at high voltage.
However, there are few reports regarding the influence of reactant flow arrangements on the start-up process of PEMFCs. The transients during the start-up process influence the performance and lifetime of a PEMFC. Compared with experimental studies, numerical simulation of a PEMFC can minimize cost and time for various complex configurations. Transient modeling of a PEMFC start-up process in terms of species concentration, flow velocity, water content, and the evolution of current density under different reactant flow arrangements provides important references for the operation and control of the PEMFC. The main focus of this research is to investigate the start-up process under both co-flow and counter-flow modes of hydrogen and air flow for a single PEMFC. The normal start-up process is considered, which is the first step for more challenging cold start-up problems. This study is conducted based on a previously developed model [32]. The evolution of the flow field, reactant concentration field, temperature field, and current density during the start-up are studied for both co-flow and counter-flow modes. When the start-up stabilizes, the current density distribution, reactant concentration, and membrane water content are further studied. Based on this, the influences of the reactant flow arrangement on the characteristics of a PEMFC are analyzed.
Considering that a single PEMFC is symmetrical in structure, the three-dimensional PEMFC is simplified into two-dimensional. Fig. 1 presents a two-dimensional single-channel PEMFC under different reactant flow arrangements, consisting of an anode, a polymer electrolyte membrane (PEM), and a cathode from top to bottom. The cathode and anode have identical structures, each consisting of a gas channel, a gas diffusion layer (GDL), and a catalyst layer (CL) [33]. As the fuel cell operates, hydrogen and oxygen flowing in the gas channels enter the anode catalyst layer (ACL) and cathode catalyst layer (CCL) through the pores of the GDLs, respectively. In the ACL, the oxidation reaction of hydrogen occurs, splitting hydrogen into hydrogen ions and electrons. The hydrogen ions pass through the membrane, reach the CCL, and react with oxygen, generating liquid water and simultaneously releasing reaction heat. Fig. 1a shows the co-flow configuration of gas flow, where hydrogen and airflow are in the same direction from the inlet to the outlet, whereas Fig. 1b represents the counter-flow mode, where hydrogen and airflow are in opposite directions.
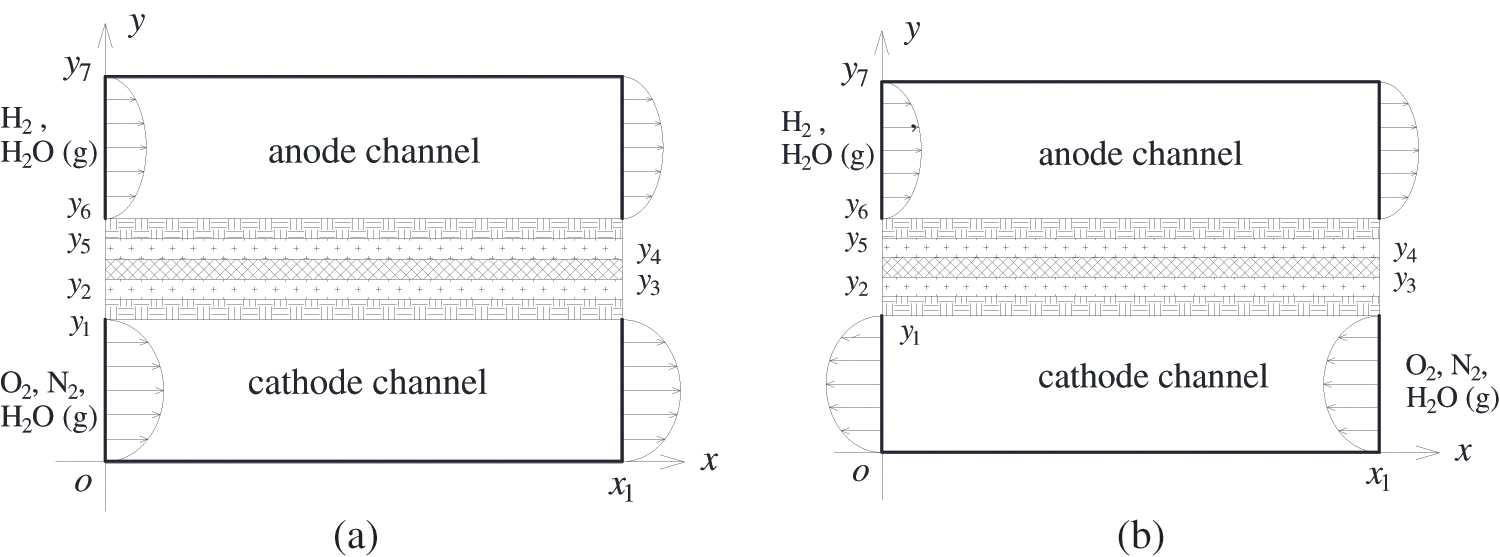
Figure 1: Physical model for a single PEMFC, (a) co-flow mode of hydrogen and air; (b) counter-flow mode of hydrogen and air
Based on the physical model presented in Fig. 1, the start-up of a single PEMFC is simulated numerically. A mathematical model that integrates the flow, heat transfer, and electrochemical reaction in the PEMFC is established. The developed model follows the assumptions below:
a) The gas in the fuel cell exhibits ideal gas behavior, with constant property parameters such as density, specific heat capacity, and heat conductivity coefficient.
b) The gas mixtures are incompressible, and the involved flow is laminar.
c) The PEM is impermeable to reaction gas mixtures.
d) The GDLs, CLs, and the PEM are isotropic. The electrochemical reaction rate in the CLs is calculated by the Butler-Volmer equation.
Based on the above assumptions, the governing equations for the unsteady process describing the flow, heat transfer, and electrochemical reaction in the PEMFC are given as follows [32,34]:
Liquid water generated in the CCL flows into the gas channel through the CL and GDL and finally leaves the PEMFC. In this study, the transport of liquid water in the cell is calculated by the multiphase mixture model. Considering that the CL and GDL are porous media, the governing equation is expressed as Eq. (5) [32,34–36].
Under electro-osmotic drag, concentration gradient, and pressure gradient, liquid water generated in the CL is transported in the CL and PEM. Additionally, a phase change exists between water vapor and membrane water. The governing equation is given as Eq. (6) [32,34].
In the PEMFC, a hydrogen oxidation reaction occurs in ACL to produce hydrogen ions and electrons. In contrast, an oxygen reduction reaction occurs in CCL to generate water and release heat. The Bulter-Volmer equation calculates the electrochemical reaction rate in the anode and cathode as Eqs. (7) and (8) present [32,34].
The electrons produced during the electrochemical reaction flow from the anode to the cathode through the CL, GDL, and BP. While the ions produced in the anode flow to the CCL through ACL and PEM. In this process, the electron potential in the BP, GDL, and CL is described by Eq. (9), while the ion potential in the CL and PEM is expressed by Eq. (10) [32,34–36],
In Eqs. (1) to (10), the variables include u, Yi, sw, T, t, λ,
The calculation of the source terms and key parameters for the above equations can refer to the literature [32,34].
2.3 Boundary Condition and Initial Condition
Taking a 2D PEMFC shown in Figs. 1a and 1b as an example, this research focuses on the unsteady simulation of flow, heat transfer, and electrochemical reaction in the cell during the start-up of the PEMFC. The influences of co-flow and counter-flow modes of hydrogen and airflow on the cell performance, both at transient states during the start-up and at a steady state after start-up, are investigated. The boundary conditions and initial conditions are defined as follows.
The mass flowrate at the inlets of the anode gas channel and cathode gas channel is given as follows:
where
The outlet of the gas channel is defined as the outlet boundary as follows:
The top and bottom walls of the fuel cell are solid and cooled by flowing coolant with
where Tc is the temperature of the coolant; h is the convective heat-transfer coefficient.
Before starting the PEMFC, the cell was fully flushed with nitrogen. During the start-up, with the feed of hydrogen and air into the cell, the flow field, temperature field, concentration field, potential field, and current density were developed and finally stabilized. In the unsteady simulation, the membrane water content in the CLs and PEM of the cell was initially set to 5.0. The transient time step size was set to 1.0 × 10⁻³ s.
As mentioned above, this study employs the numerical computation method to investigate the flow, heat transfer, and species transport inside a PEMFC. The geometric and operation parameters are given in Table 1.
The convective, diffusion, and unsteady terms are discretized by the MUSCL, central difference, and fully implicit schemes. Pressure and velocity are coupled by the SIMPLE algorithm. The discrete equation set is solved iteratively by the SIP method. The criteria for iterative convergence of the continuity and momentum equations are below 1.0 × 10⁻⁸ and 1.0 × 10⁻¹², respectively.
First, the proposed model was validated, and then the validated model was used to investigate the transient-state flow field, temperature field, concentration field, and current density evolution in the fuel cell during start-up. Finally, the steady-state distributions of current density, reactant concentration, and membrane water content were analyzed. The influences of co-flow mode and counter-flow mode on the behavior of the PEMFC are discussed in this section.
The present model was used to calculate the polarization curve of the PEMFC under co-flow mode, the results of which were compared with those in the literature [42,43]. The pressure at the cell outlet is 1.0 atm, and the operating temperature is 80°C. The gas humidity at the inlets of the anode and the cathode is 0.59 and 0.84, respectively, while the stoichiometric ratio is 1.5 and 2.0, respectively. The ionomer volume fraction in ACL and CCL is 0.25. The other parameters can be found in [42,43]. A comparison of the results from the present model with those in the literature is shown in Fig. 2. It is observed that the results are in good consistency with those in [42,43], with the maximum deviation being 8.87%.
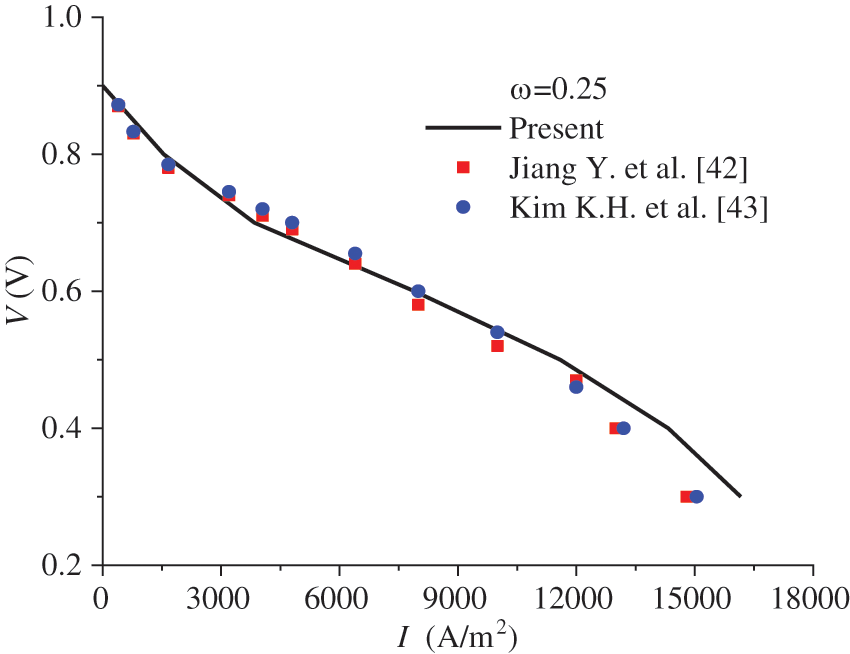
Figure 2: Polarization curve of the PEMFC by the present model and that in [42,43]
4.2 Evolution of Flow, Temperature, and Concentration Fields
In Fig. 3, the left figure shows the polarization curves under co-flow and counter-flow modes, respectively. The right figure presents the varying current density and start-up time under different output voltages for both co-flow and counter-flow modes. During start-up, the increase in current density is initially rapid and then slows down. From Figs. 3a and 3b, it is observed that different gas flow modes of hydrogen and air have little effect on the polarization curves of the cell but some on the current density evolution. On the one hand, the current density under co-flow mode is larger than that under counter-flow mode, particularly under a low output voltage. For example, when the output voltages are 0.5, 0.6, and 0.7 V, the difference in the stable current density under co-flow and counter-flow modes is 182.5, 91.7, and 21.6 A/m2, respectively. On the other hand, the current density takes less time to increase from 0 under co-flow mode than under counter-flow mode. It is analyzed that the earlier contact of reactants in the CLs under co-flow mode accelerates the formation of current density. Compared to the counter-flow, the co-flow mode produces a faster current density evolution.
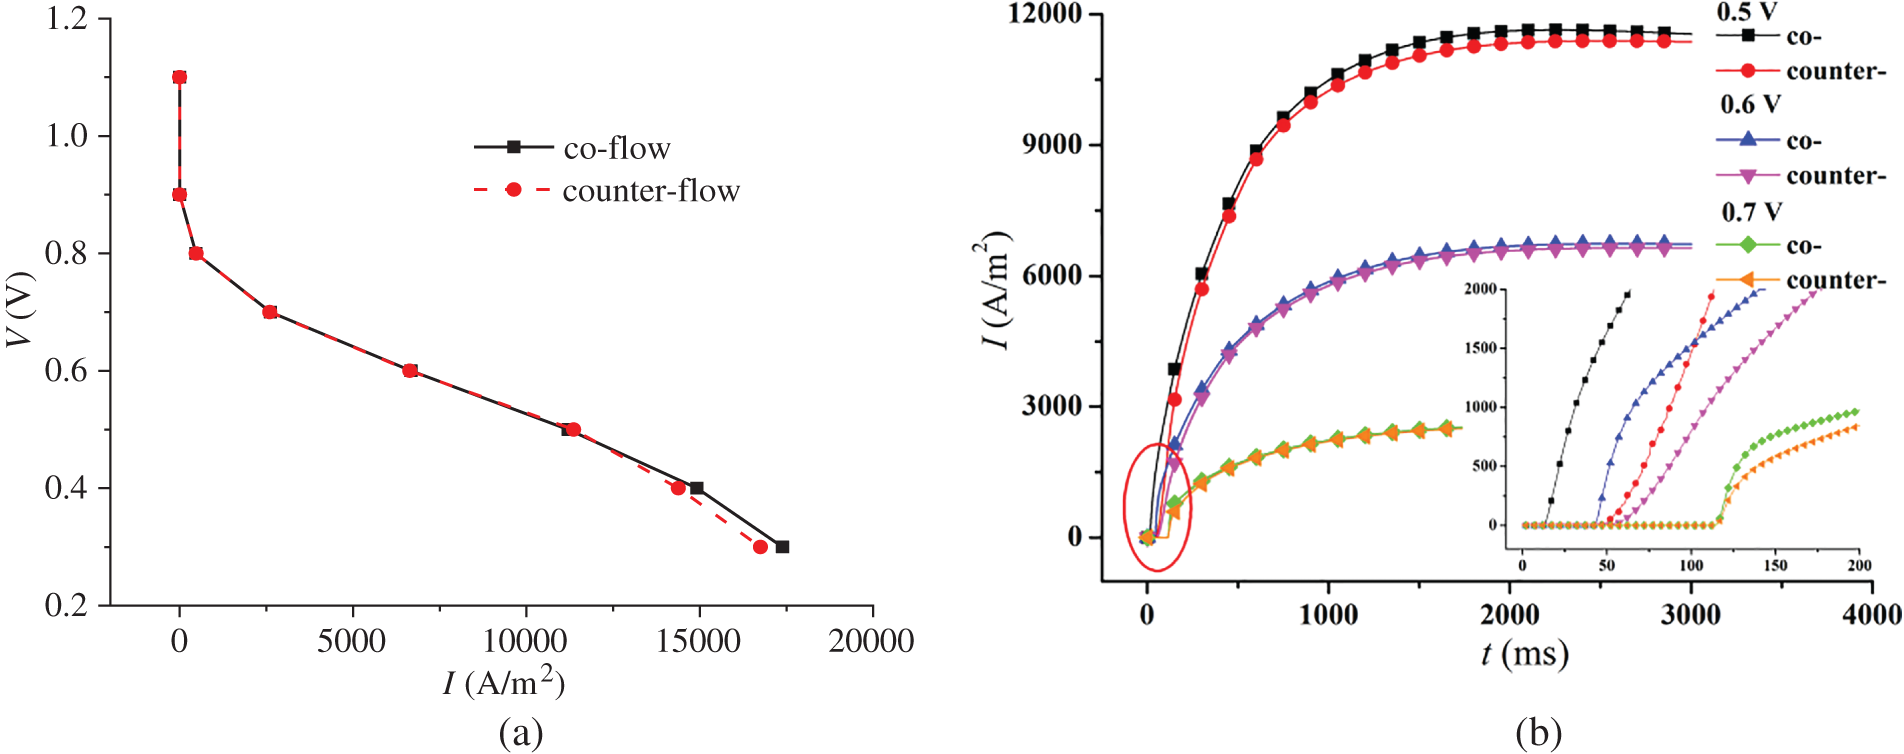
Figure 3: Influence of co-flow and counter-flow modes on PEMFC performance, (a) polarization curve; (b) current density evolution over time under different output voltages
Mass and heat transfer during cell start-up under co-flow and counter-flow modes of hydrogen and air are investigated in this section. As the PEMFC proceeds, the flow, temperature, and substance concentration fields develop over time. Three-time instants were selected to investigate the evolution process of these fields at start-up: 0.1, 0.5, and 1.0 s. Figs. 4 and 5 show the cell’s flow field variations under co-flow and counter-flow modes. For the co-flow mode, at 0.1 s, the airflow rate and hydrogen flow rate reach maximum values of 0.302 and 0.127 m/s, respectively, indicating that the flow field in the cathode develops more rapidly than the anode. Moreover, it is observed that the cathode has a smaller velocity difference between the inlet and outlet than the anode. In the cathode, the oxygen consumption rate is relatively low, and the airflow rate is relatively high. Thus, the airflow rate at the inlet and outlet of the cathode is similar. In the anode, due to the high compressibility and hydrogen consumption, the flow field develops slowly, and there is a significant velocity difference between the inlet and outlet. For example, at 1.0 s of start-up, the hydrogen velocity at the inlet and outlet of the anode is 0.127 and 0.091 m/s, respectively. For the counter-flow mode, the velocity distribution and variation are the same as those of the co-flow mode, except that the velocity in the anode and cathode have opposite directions. This is because the co-flow mode and counter-flow mode have identical flow rates, flow channels, and almost identical electrochemical reactions. Accordingly, the influence of flow arrangement on the flow field is not obvious.
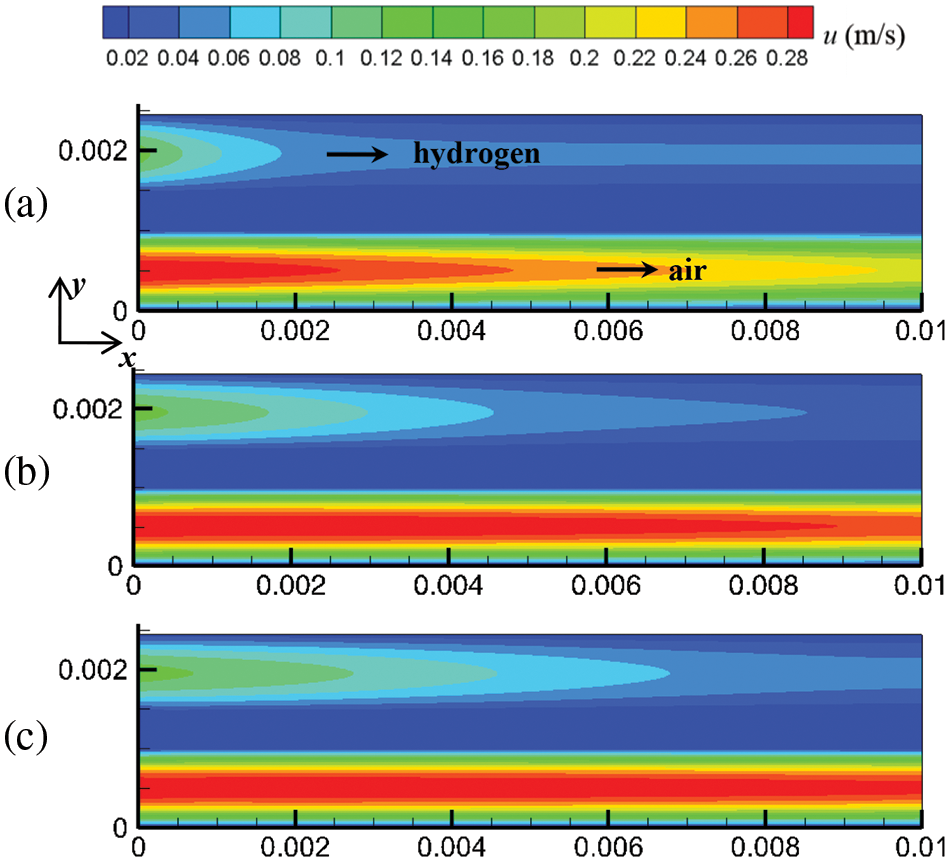
Figure 4: At output voltage of 0.6 V, flow field distribution in the cell under co-flow mode at different start-up times, (a) 0.1 s; (b) 0.5 s; (c) 1.0 s
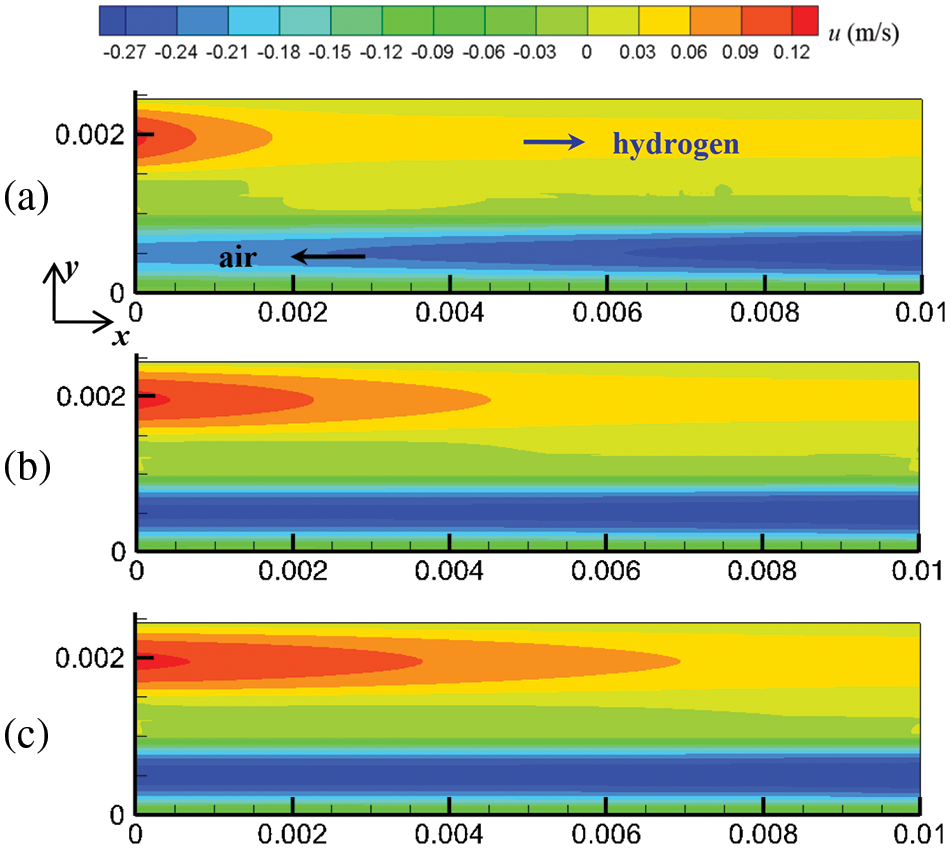
Figure 5: At output voltage of 0.6 V, flow field distribution in the cell under counter-flow mode at different start-up times, (a) 0.1 s; (b) 0.5 s; (c) 1.0 s
Figs. 6 and 7 show the temperature field in the cell under co-flow and counter-flow modes. The temperature field is largely affected by the temperature of hydrogen and air, as well as the electrochemical reaction rate. The electrochemical reaction rate was determined by the concentration of hydrogen and oxygen and the membrane water content. At 0.1 s, high-temperature regions are only located at the inlets of the cathode and anode due to the high temperature of hydrogen and air at the inlet. As time passes, the electrochemical reaction in the fuel cell proceeds toward the downstream, and the high-temperature regions extend. For the co-flow mode, at 1.0 s of the start-up, the temperature difference between the inlet and the outlet is up to 21.1°C, forming a large temperature gradient inside the cell. Comparatively, the counter-flow mode has a more evenly distributed temperature, with the maximum temperature not exceeding 80°C. It is inferred that the counter-flow mode is beneficial to the heat management of the PEMFC. The reasons for the differences in the temperature distributions between the co-flow mode and the counter-flow mode are explained as follows. The co-flow mode has an extremely high temperature at the left side due to the high hydrogen and oxygen temperatures at the inlets and a high electrochemical reaction rate caused by high reactant concentration and high membrane water content. The temperature drops gradually towards the right side due to decreasing hydrogen and oxygen temperatures and a slower electrochemical reaction. The counter-flow mode has high temperatures on both sides due to high reactant temperatures at each inlet. The middle region also has a relatively high temperature caused by the relatively high electrochemical reaction rate due to the small reactant concentration difference. Therefore, the co-flow mode has a larger temperature difference than the counter-flow mode under the same output voltage; the counter-flow mode has a more evenly distributed temperature.
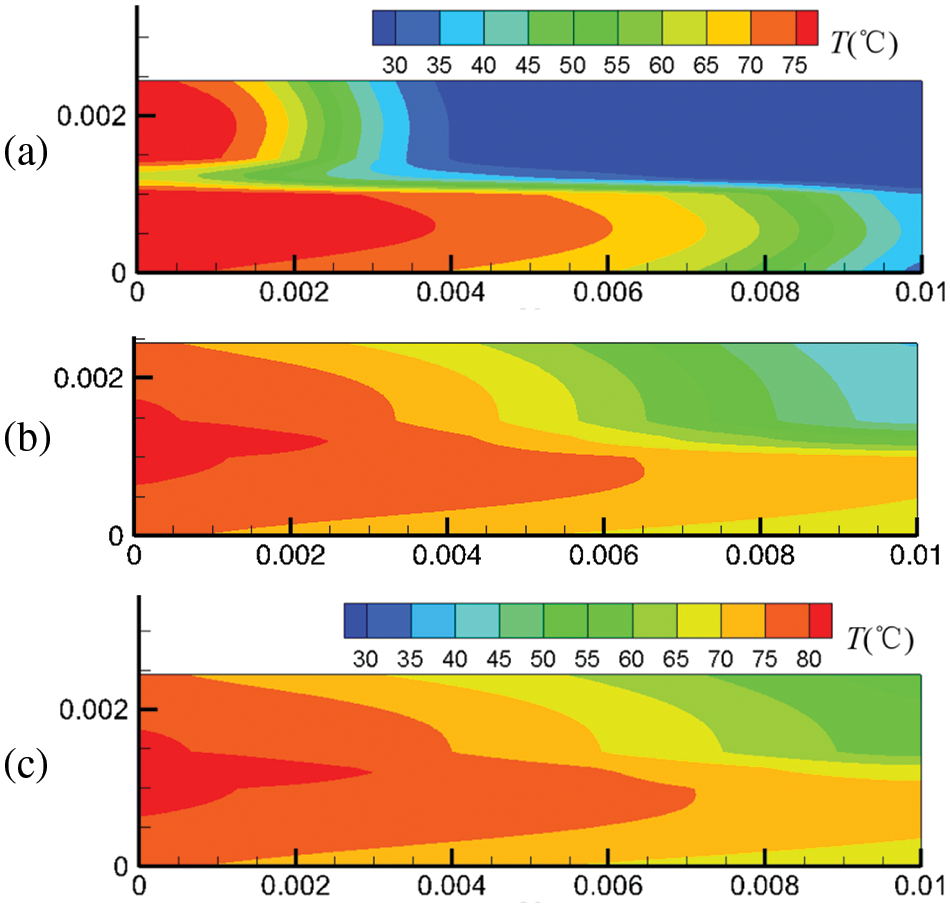
Figure 6: At output voltage of 0.6 V, temperature field distribution in the cell under co-flow mode at different start-up times, (a) 0.1 s; (b) 0.5 s; (c) 1.0 s
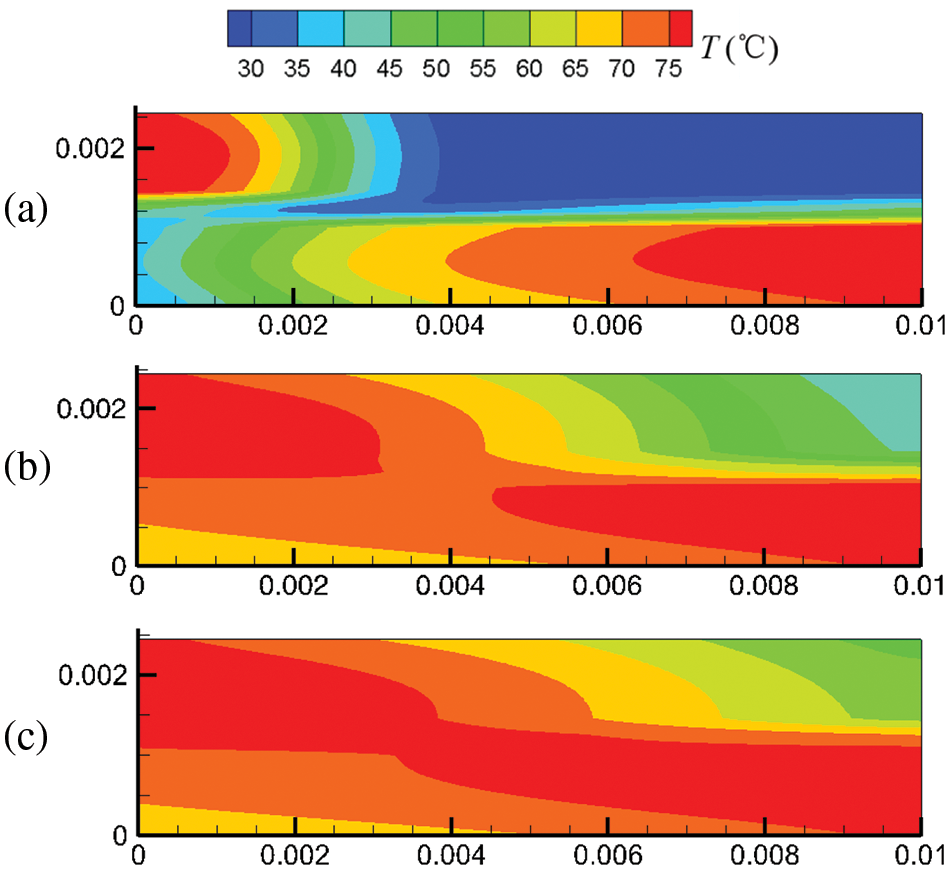
Figure 7: At output voltage of 0.6 V, temperature field distribution in the cell under counter-flow mode at different start-up times, (a) 0.1 s; (b) 0.5 s; (c) 1.0 s
Figs. 8 and 9 present the reactant concentration evolution in the cell under co-flow mode and counter-flow mode, respectively. The evolution of hydrogen and oxygen concentrations is determined jointly by species transport and electrochemical reaction rate. Comparing Figs. 8 and 9 shows that under the output voltage of 0.6 V, the flow modes of reactants have little effect on the reactant concentration evolution in the cell. However, the evolution of oxygen and hydrogen concentrations differ significantly due to the different flow velocities (see Figs. 4 and 5) and gas diffusion capacities in the anode and cathode. The gas velocity in the anode is smaller, while hydrogen has a stronger diffusion capacity, determining that hydrogen is mainly transported by diffusion in the anode. Comparatively, the flow is faster in the cathode, and oxygen has a weaker diffusion capacity, meaning oxygen is transported mainly by convection. Also, it is noticed that oxygen concentration first increases overall and then decreases, which is different from hydrogen concentration. This phenomenon is related to reactant transport and consumption. Initially, in the cathode, oxygen is transported at a high rate. While the current density is low, oxygen concentration develops rapidly, and the whole cathode becomes occupied by oxygen. As the current density gradually increases, the oxygen consumption rate increases, and oxygen concentration decreases. Along with the start-up process, hydrogen concentration in the anode rises simultaneously, while oxygen concentration in the cathode first increases rapidly and then decreases slowly.
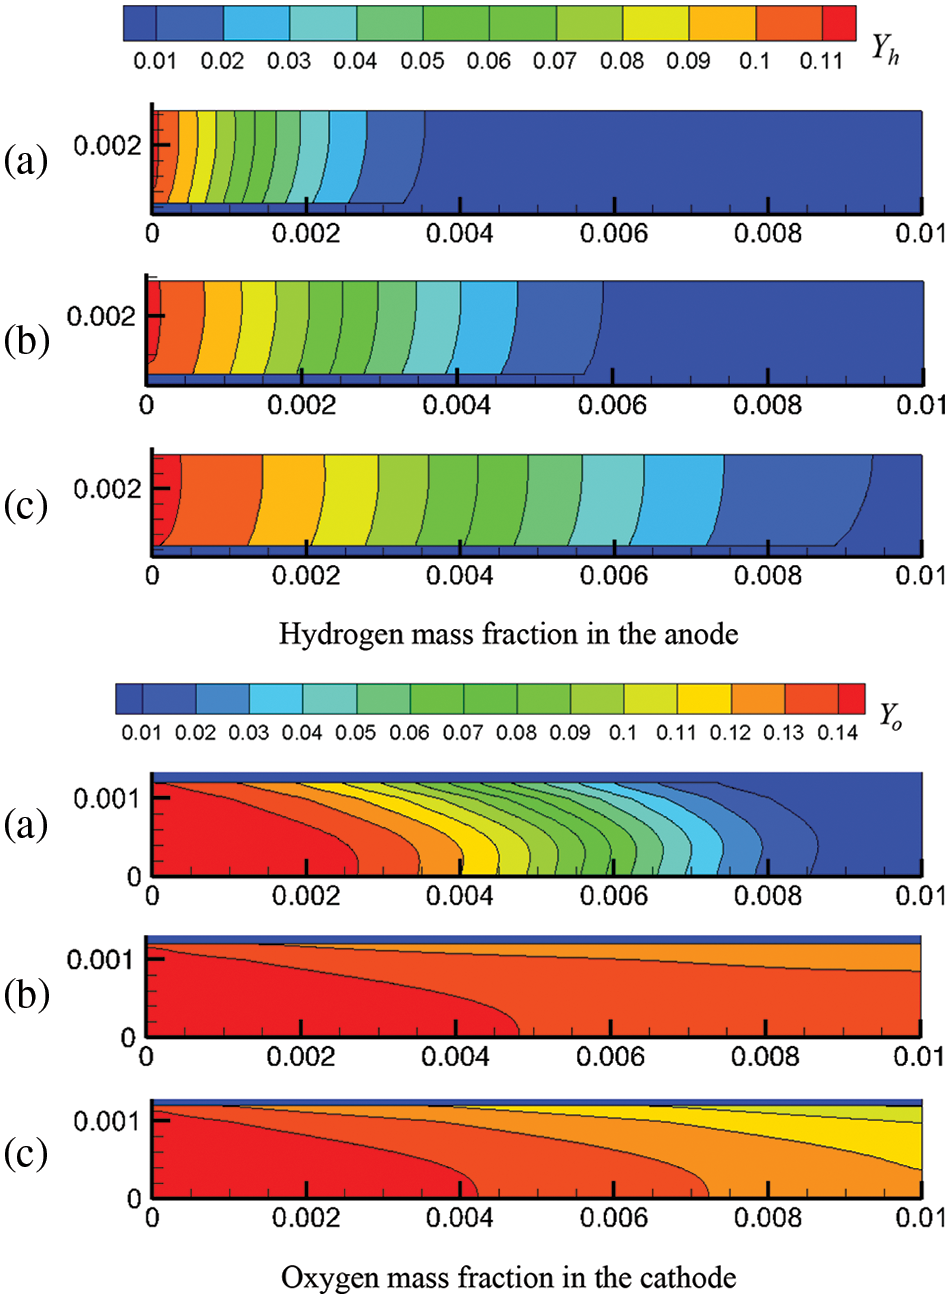
Figure 8: At output voltage of 0.6 V, reactant concentration distribution under co-flow mode at different start-up times, (a) 0.1 s; (b) 0.5 s; (c) 1.0 s
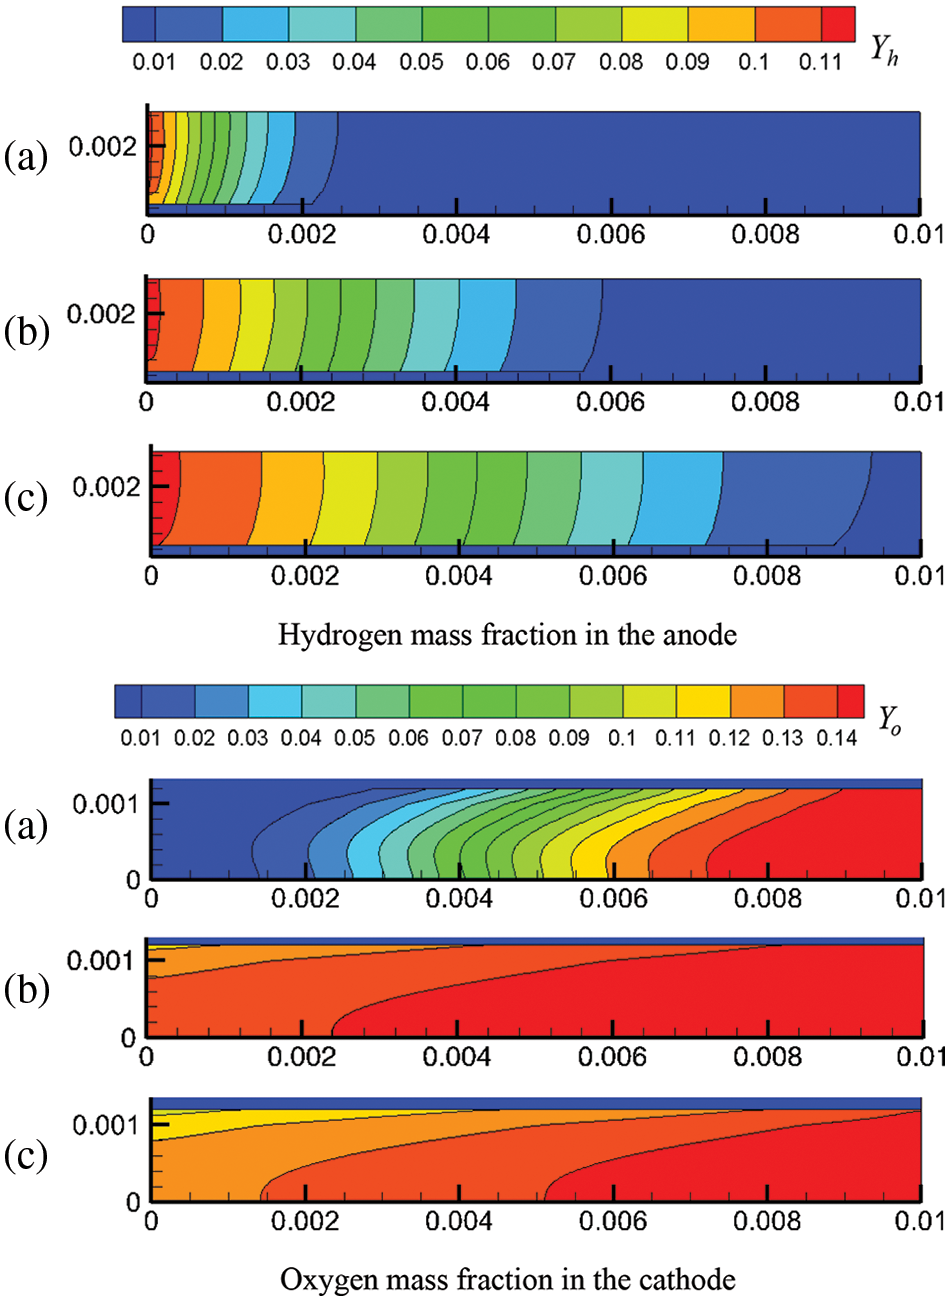
Figure 9: At output voltage of 0.6 V, reactants concentration distribution under counter-flow mode at different start-up times, (a) 0.1 s; (b) 0.5 s; (c) 1.0 s
4.3 Influence of Reactant Flow Arrangements on Current Density
Figs. 4–9 show the spatial distribution of velocity, temperature, and reactant concentration in the PEMFC at different time instants during the start-up process. The results at the 3.0 s instant, when the start-up process has stabilized, are provided below, based on which the influence of co-flow and counter-flow modes on the PEMFC performance were analyzed.
Fig. 10 presents the current density distribution in the cell under co-flow mode and counter-flow mode when the PEMFC start-up process has stabilized. For both modes, the current density first decreases and then increases along the flow direction, and the variation profiles are similar in tendency. However, there is some difference, mainly because the variation ranges are different. Under co-flow mode, the difference between the maximal current density and the minimal current density is 116.9, 379.2, and 930.7 A/m2 for output voltages of 0.7, 0.6, and 0.5 V, respectively. Under counter-flow mode, the difference is 180.4, 632.0, and 1598.6 A/m2, respectively. It is demonstrated that under the same output voltage, the difference between the maximal and minimal current density under co-flow mode is smaller than that under counter-flow mode. Thus, the co-flow mode results in a more evenly distributed current density in the cell. Therefore, the flow arrangement of hydrogen and oxygen affects the current density distribution in the cell to some extent. To explain this finding, the influences of the reactant concentration in the CLs, the liquid water content in the CLs, and the PEM on the current density were further investigated.
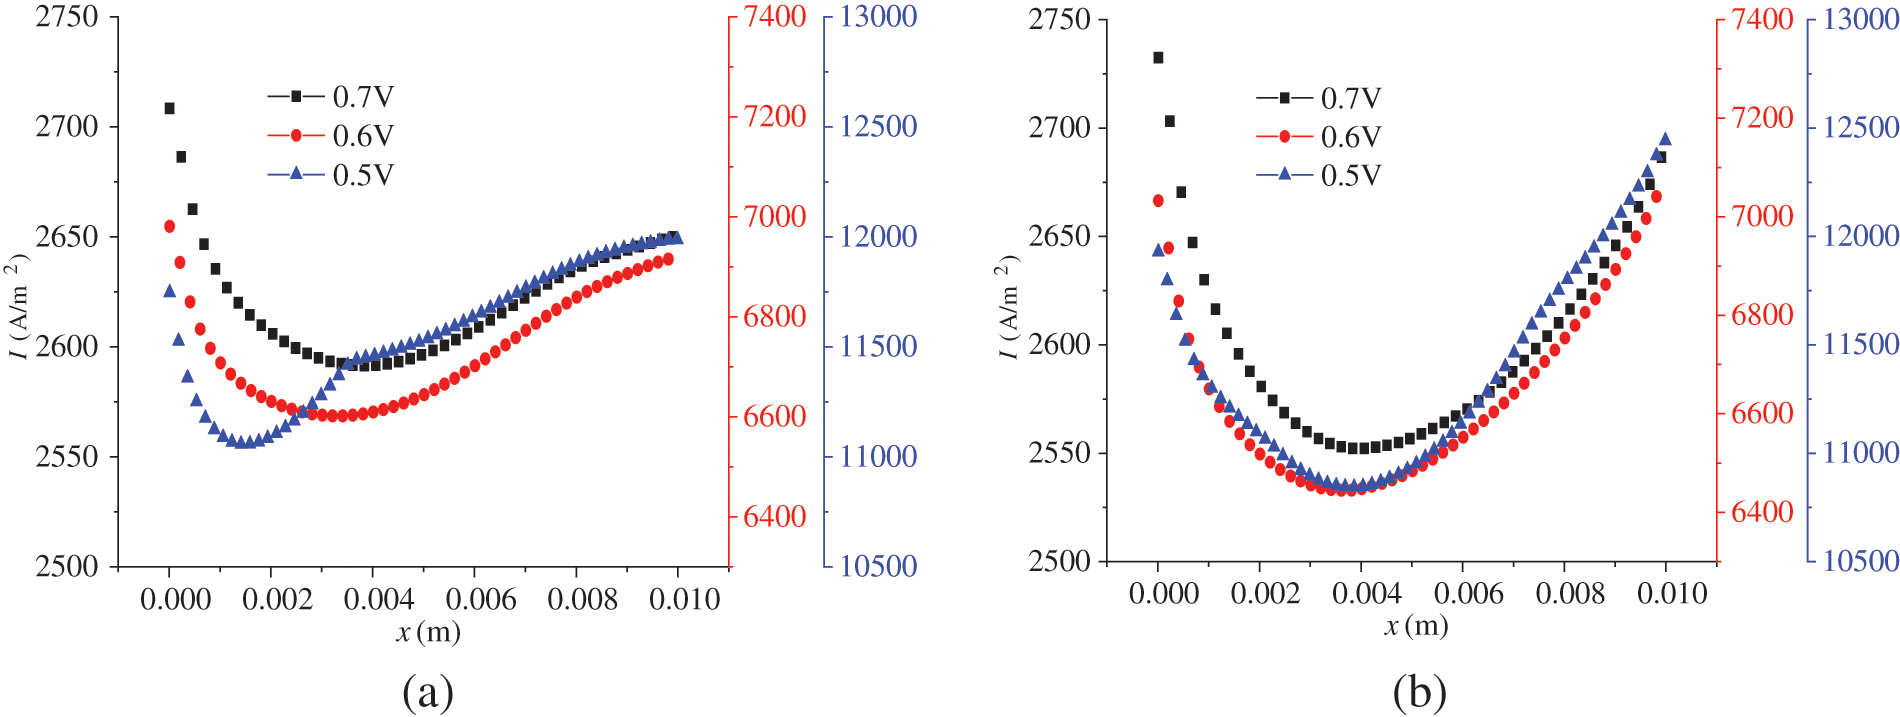
Figure 10: Current density distribution in the cell: (a) under co-flow mode; (b) under counter-flow mode
Fig. 11 shows the relationship between the reactant concentration and the flow mode, location, and output voltage. Under the counter-flow mode, oxygen flows from the right to the left. For easier comparison, the transverse coordinate of Fig. 11b was adjusted; hence, x is actually (0.01 − x). From Fig. 11, the following observations can be made. Firstly, due to the continuous consumption of reactants, the reactant concentration decreases along the flow direction. Secondly, under a lower output voltage, the reactant concentration is lower; that is, the reactant concentration drops more rapidly along the flow direction. As shown in Fig. 3b, a lower output voltage leads to a higher current density, causing accelerated consumption and, thus, a lower concentration of hydrogen and oxygen. For instance, at the outlets, the mass fractions of hydrogen and oxygen under 0.6 V are 0.02 and 0.04, respectively, higher than those under 0.5 V. Thirdly, a comparison of Figs. 11a and 11b reveals that the arrangements of reactant flow have a small impact on the concentration distribution of hydrogen and oxygen, which is consistent with Fig. 10, where the influence of reactant flow modes on current density is also small. For example, at 0.5 V, the maximum current density is 12,000 and 12,500 A/m2 under the co-flow and counter-flow modes, respectively, while the minimum is around 11,000 A/m2 in both cases. The difference is quite small compared to the mean current density. Therefore, whether in co-flow mode or counter-flow mode, the variation in reactant consumption is not very pronounced.
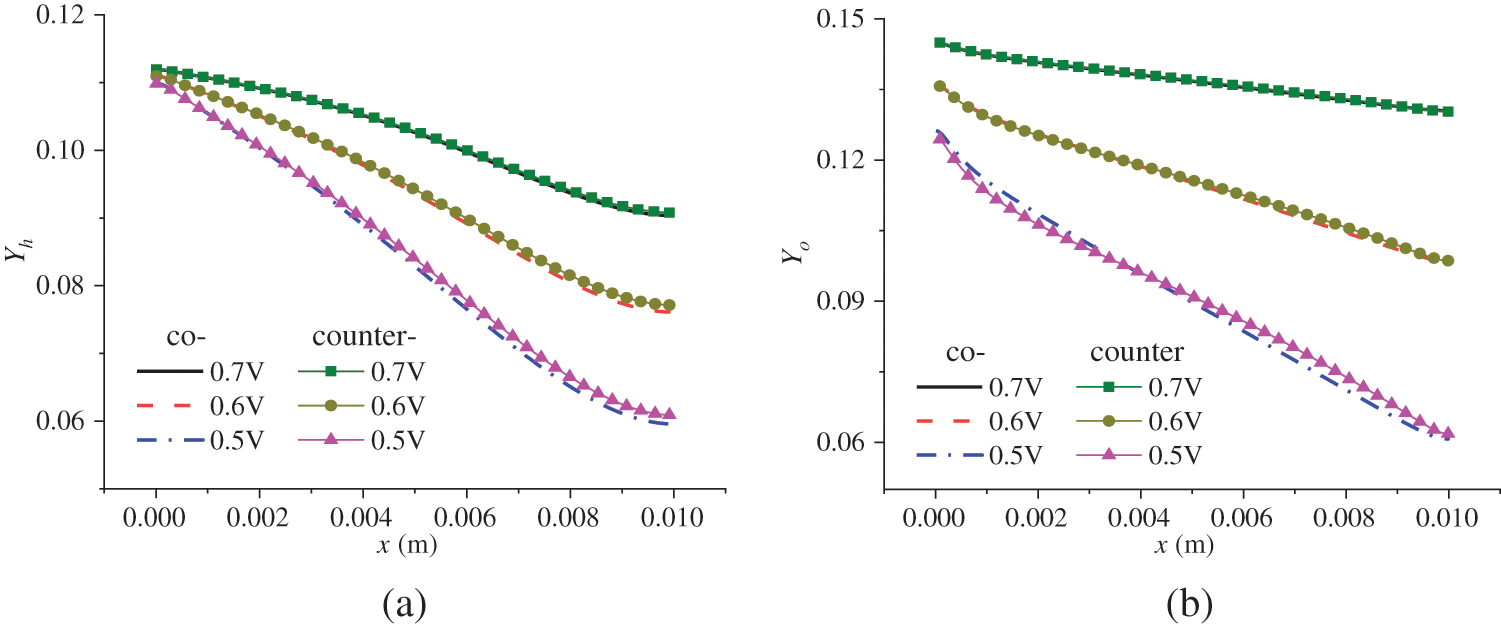
Figure 11: Reactant concentration distribution in the CLs under co-flow and counter-flow modes: (a) mass fraction of hydrogen in ACL; (b) mass fraction of oxygen in CCL
The electrochemical reaction in the PEMFC is affected by two factors: substance content, that is, the hydrogen and oxygen concentration, and membrane water content. The membrane water content determines the transport capacity of protons, which ultimately affects the current density distribution in the cell. The membrane water content is related to a series of factors with complex variation processes. Therefore, this part focuses on the distribution of membrane water content in the PEMFC. Fig. 12 shows the membrane water content in the ACL and CCL at 3.0 s of the start-up, with a denoting ACL and b denoting CCL. Both co-flow and counter-flow modes of hydrogen and air were considered. All the figures in Fig. 12 demonstrate a first decreasing and then increasing variation profile along the x direction. The membrane water content in the CCL is higher than that in the ACL. Additionally, the counter-flow mode has a larger membrane water content at the left side than the co-flow mode. The reasons are analyzed as follows. Membrane water comes from the phase change between water vapor and membrane water, with the phase change rate depending on temperature, partial vapor pressure, and liquid water saturation. During the start-up, the volume fraction of liquid water in the CLs is small, so its influence on vapor-membrane water transfer can be neglected. The influence of temperature on the phase change rate is significant and is inversely related to the rate. Comparatively, vapor concentration has a smaller impact and affects the phase change rate positively. Under the co-flow mode, both temperature and vapor concentration are at a high level at the left section of the cell, resulting in a low phase change rate and low membrane water content in the ACL and CCL. Towards larger x, both temperature and vapor concentration decline, leading to a gradually increasing phase change rate and membrane water content. Under the counter-flow situation, the left section of the cell has a high vapor concentration but a lower temperature than the co-flow mode, producing a more intensive phase change between vapor and membrane water and, thus, a higher membrane water content. On the right side of the cell, both the vapor concentration and temperature are higher than those under the co-flow mode, so the membrane water content is lower.
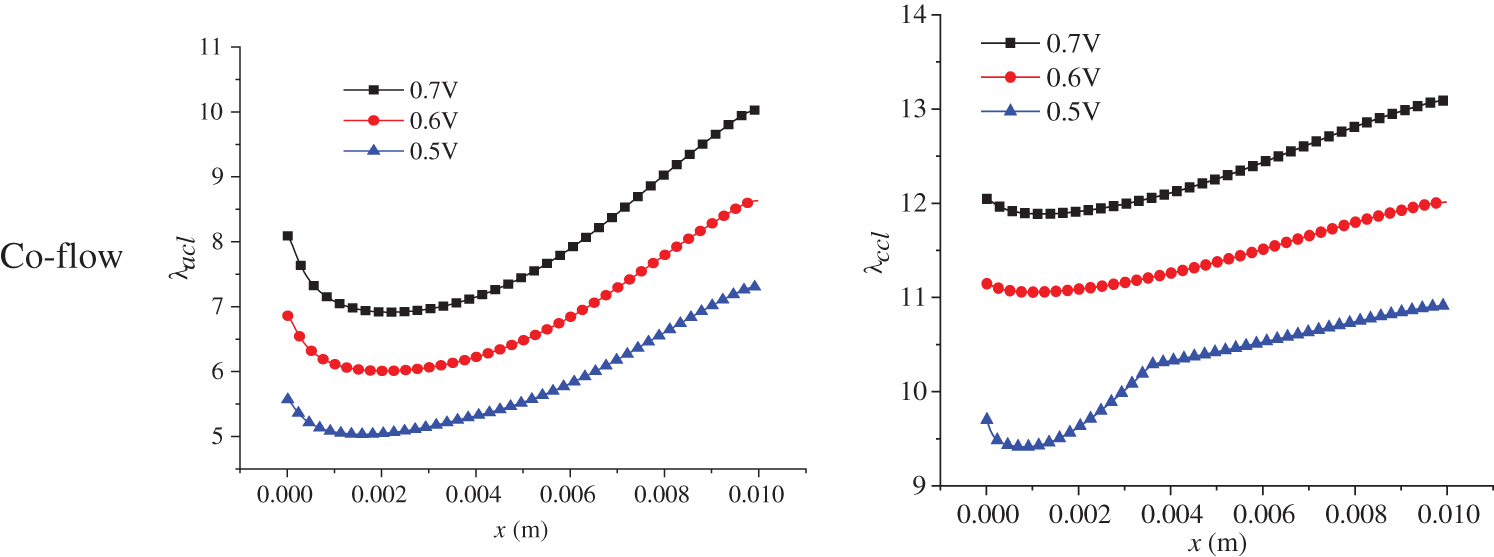
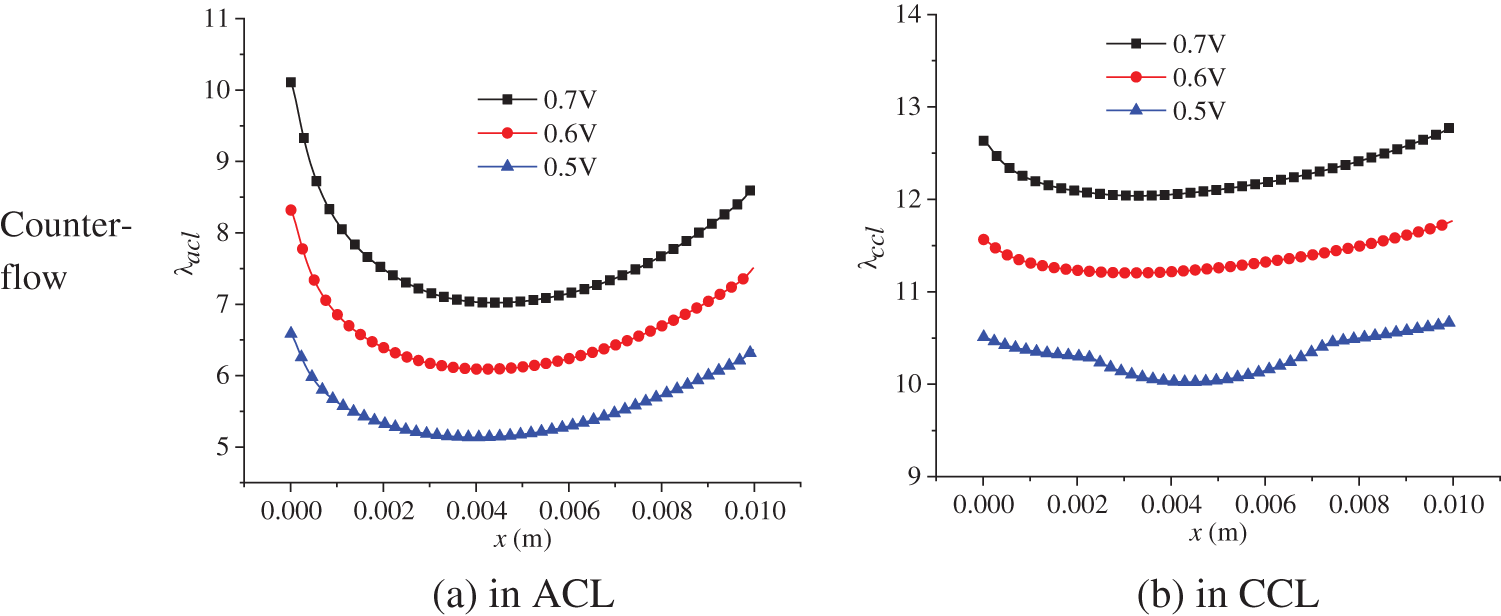
Figure 12: At 3.0 s of the start-up, membrane water content in the ACL and CCL under co-flow mode and counter-flow mode
This study focuses on the influence of the flow arrangement of hydrogen and air on the performance of a single PEMFC. Considering both co-flow and counter-flow modes, an unsteady numerical simulation is performed to investigate the evolution of the flow field, temperature field, concentration field, and current density over time during the start-up. Additionally, the results are presented at the instant when the start-up process has stabilized. The key conclusions for the present conditions are summarized as follows:
1. The polarization curve and the transient variation of current density are slightly affected by the gas flow modes of hydrogen and air, the co-flow or counter-flow mode. Comparatively, the temperature distribution is more sensitive to the reactant flow arrangement. Under the co-flow mode of hydrogen and air, there is a large temperature difference between the inlet and outlet sections of the cell, with a locally high-temperature region occurring in the inlet section. The temperature is evenly distributed throughout the cell for the counter-flow mode, and the maximum temperature does not exceed the gas feed temperature. Therefore, the counter-flow configuration is preferred for better heat management.
2. Due to the various velocities and gas diffusion capacities of hydrogen and oxygen, their transport mechanisms differ. Hydrogen is transported mainly by diffusion, while oxygen is transported in the cathode mainly by convection. The evolution of hydrogen concentration and oxygen concentration interacts with the evolution of current density. The hydrogen concentration in the anode grows continuously during the start-up, while the oxygen concentration in the cathode first increases and then decreases.
3. Along the x direction, the current density first decreases and then increases. The co-flow mode produces a more evenly distributed current density than the counter-flow mode. In designing a PEMFC, the temperature field, and current density distribution should be considered to scientifically balance better heat management and more evenly distributed current density.
Acknowledgement: The authors would like to acknowledge Prof. Xiaofan Yang of Beijing Normal University for guidance in establishing the model. The authors also extend their sincere appreciation to the editor and reviewers for their valuable comments, which significantly improved this paper.
Funding Statement: The study is supported by the Projects of Talents Recruitment of Guangdong University of Petrochemical Technology (No. 2018rc14); Maoming City Science and Technology Plan Project (Nos. 210427094551264 and 220415004552411).
Author Contributions: The authors confirm contribution to the paper as follows: literature review: Qianqian Shao; study conception and design: Qianqian Shao and Min Wang; programming and calculating: Min Wang; analysis and interpretation of results: Min Wang; draft manuscript preparation: Qianqian Shao and Nuo Xu. All authors reviewed the results and approved the final version of the manuscript.
Availability of Data and Materials: The data supporting this study’s findings are available from the corresponding author upon reasonable request.
Conflicts of Interest: The authors declare that they have no conflicts of interest to report regarding the present study.
References
1. Tabbi Wilberforce, A., Alaswad, A., Palumbo, A. G. O. (2016). Advances in stationary and portable fuel cell applications. International Journal of Hydrogen Energy, 41(37), 16509–16522. [Google Scholar]
2. Ijaodola, O. S., El-Hassan, Z., Ogungbemi, E., Khatib, F. N., Wilberforce, T. et al. (2019). Energy efficiency improvements by investigating the water flooding management on proton exchange membrane fuel cell (PEMFC). Energy, 179(15), 246–267. [Google Scholar]
3. Wang, G., Yu, Y., Liu, H., Gong, C., Wen, S. et al. (2018). Progress on design and development of polymer electrolyte membrane fuel cell systems for vehicle applications: A review. Fuel Processing Technology, 179, 203–228. [Google Scholar]
4. Wu, D., Peng, C., Yin, C., Tang, H. (2020). Review of system integration and control of proton exchange membrane fuel cells. Electrochemical Energy Reviews, 3(3), 466–505. [Google Scholar]
5. Dhahad, H. A., Alawee, W. H., Hassan, A. K. (2019). Experimental study of the effect of flow field design to PEM fuel cells performance. Renewable Energy Focus, 30, 71–77. [Google Scholar]
6. Hazar, H., Yilmaz, M., Sevinc, H. (2021). The effects of different flow field patterns on polymer electrolyte membrane fuel cell performance. Energy Conversion and Management, 248, 114818. [Google Scholar]
7. Wang, Y., Guan, C., Li, H., Zhao, Y., Wang, C. et al. (2023). Flow field configuration design for a large-scale hydrogen polymer electrolyte membrane fuel cell. Applied Energy, 351, 121852. [Google Scholar]
8. Manso, A. P., Marzo, F. F., Barranco, J., Garikano, X., Garmendia Mujika, M. (2012). Influence of geometric parameters of the flow fields on the performance of a PEM fuel cell. A review. International Journal of Hydrogen Energy, 37(20), 15256–15287. [Google Scholar]
9. Chien, S. K., Yen, T. H., Yang, Y. T., Chen, C. K. (2008). Lattice Boltzmann method simulation of 3D fluid flow in serpentine channel. Computer Modeling in Engineering & Sciences, 29(3), 163–174. [Google Scholar]
10. Ebrahimzadeh, A. A., Khazaee, I., Fasihfar, A. (2019). Experimental and numerical investigation of obstacle effect on the performance of PEM fuel cell. International Journal of Heat and Mass Transfer, 141, 891–904. [Google Scholar]
11. Heidary, H., Kermani, M. J., Prasad, A. K., Advani, S. G., Dabir, B. (2017). Numerical modelling of in-line and staggered blockages in parallel flowfield channels of PEM fuel cells. International Journal of Hydrogen Energy, 42(4), 2265–2277. [Google Scholar]
12. Kumar, R. R., Suresh, S., Suthakar, T., Singh, V. K. (2020). Experimental investigation on PEM fuel cell using serpentine with tapered flow channels. International Journal of Hydrogen Energy, 45(31), 15642–15649. [Google Scholar]
13. Wang, Y., Wang, X., Fan, Y., He, W., Guan, J. et al. (2022). Numerical investigation of tapered flow field configurations for enhanced polymer electrolyte membrane fuel cell performance. Applied Energy, 306, 118021. [Google Scholar]
14. Xia, Z., Chen, H., Zhang, R., Chu, L., Zhang, T. et al. (2022). Multiple effects of non-uniform channel width along the cathode flow direction based on a single PEM fuel cell: An experimental investigation. Journal of Power Sources, 549, 232080. [Google Scholar]
15. Min, C. H. (2009). Performance of a proton exchange membrane fuel cell with a stepped flow field design. Journal of Power Sources, 186, 370–376. [Google Scholar]
16. Chen, X., Chen, Y., Liu, Q., Xu, J., Liu, Q. et al. (2021). Performance study on a stepped flow field design for bipolar plate in PEMFC. Energy Reports, 7, 336–347. [Google Scholar]
17. Ramin, F., Sadeghifar, H., Torkavannejad, A. (2019). Flow field plates with trap-shape channels to enhance power density of polymer electrolyte membrane fuel cells. International Journal of Heat and Mass Transfer, 129, 1151–1160. [Google Scholar]
18. Wang, X. D., Lu, G., Duan, Y. Y., Lee, D. J. (2012). Numerical analysis on performances of polymer electrolyte membrane fuel cells with various cathode flow channel geometries. International Journal of Hydrogen Energy, 37(20), 15778–15786. [Google Scholar]
19. Paulino, A. L. R., Cunha, E. F., Robalinho, E., Linardi, M., Korkischko, I. et al. (2017). CFD analysis of PEMFC flow channel cross sections. Fuel Cells, 17(1), 27–36. [Google Scholar]
20. Kerkoub, Y., Benzaoui, A., Haddad, F., Ziari, Y. K. (2018). Channel to rib width ratio influence with various flow field designs on performance of PEM fuel cell. Energy Conversion and Management, 174, 260–275. [Google Scholar]
21. Lakshminarayanan, V., Karthikeyan, P. (2019). Investigation of PEMFC performance with various configurations of serpentine and interdigitated flow channel. Progress in Computational Fluid Dynamic, 19(5), 328–336. [Google Scholar]
22. Rahimi-Esbo, M., Ranjbar, A. A., Ramiar, A., Alizadeh, E., Aghaee, M. (2016). Improving PEM fuel cell performance and effective water removal by using a novel gas flow field. International Journal of Hydrogen Energy, 41(4), 3023–3037. [Google Scholar]
23. Li, W., Zhang, Q., Wang, C., Yan, X., Shen, S. et al. (2017). Experimental and numerical analysis of a three-dimensional flow field for PEMFCs. Applied Energy, 195, 278–288. [Google Scholar]
24. Liao, Z., Wei, L., Dafalla, A. M., Guo, J., Jiang, F. (2021). Analysis of the impact of flow field arrangement on the performance of PEMFC with zigzag-shaped channels. International Journal of Heat and Mass Transfer, 181, 121900. [Google Scholar]
25. Shen, J., Tu, Z., Chan, S. H. (2020). Performance enhancement in a proton exchange membrane fuel cell with a novel 3D flow field. Applied Thermal Engineering, 164, 114464. [Google Scholar]
26. Wang, Y., Si, C., Qin, Y., Wang, X., Fan, Y. et al. (2021). Bio-inspired design of an auxiliary fishbone-shaped cathode flow field pattern for polymer electrolyte membrane fuel cells. Energy Conversion and Management, 227, 113588. [Google Scholar]
27. Pashaki, M. K., Mahmoudimehr, J. (2023). Performance superiority of an arc-shaped polymer electrolyte membrane fuel cell over a straight one. International Journal of Hydrogen Energy, 48(36), 13633–13649. [Google Scholar]
28. Fan, L. H., Zhang, G. B., Jiao, K. (2017). Characteristics of PEMFC operating at high current density with low external humidification. Energy Conversion and Management, 150(2017), 763–774. [Google Scholar]
29. Scholta, J., Haussler, F., Zhang, W., Kuppers, L., Jorissen, L. et al. (2006). Development of a stack having an optimized flow field structure with low cross transport effects. Journal of Power Sources, 155, 60–65. [Google Scholar]
30. Yang, W., Cha, D., Kim, Y. (2019). Effects of flow direction on dynamic response and stability of nonhumidification PEM fuel cell. Energy, 185(2019), 386–395. [Google Scholar]
31. Khazaee, I., Sabadbafan, H. (2016). Effect of humidity content and direction of the flow of reactant gases on water management in the 4-serpentine and 1-serpentine flow channel in a PEM (proton exchange membrane) fuel cell. Energy, 101, 252–265. [Google Scholar]
32. Wang, M., Xu, L. F., Yang, X. F. (2022). A coupled CFD model for an accurate and fast prediction of the unsteady operation process of a proton exchange membrane fuel cell. Energy Conversion and Management, 272, 116317. [Google Scholar]
33. Jiao, K., Li, X. G. (2011). Water transport in polymer electrolyte membrane fuel cells. Progress in Energy and Combustion Science, 37(3), 221–291. [Google Scholar]
34. Jiao, K., Li, X. G. (2009). Three-dimensional multiphase modeling of cold start processes in polymer electrolyte membrane fuel cells. Electrochimica Acta, 54(27), 6876–6891. [Google Scholar]
35. He, P., Mu, Y. T., Park, J. W., Tao, W. Q. (2020). Modeling of the effects of cathode catalyst layer design parameters on performance of polymer electrolyte membrane fuel cell. Applied Energy, 277, 115555. [Google Scholar]
36. Zhang, G. B., Jiao, K. (2018). Three-dimensional multi-phase simulation of PEMFC at high current density utilizing Eulerian-Eulerian model and two-fluid model. Energy Conversion and Management, 176, 409–421. [Google Scholar]
37. Siegel, N. P., Ellis, N. W., Nelson, D. J., von Spakovsky, M. R., (2004). A two-dimensional computational model of a PEMFC with liquid water transport. Journal of Power Sources, 128, 173–184. [Google Scholar]
38. Ozen, D. N., Timurkutluk, B., Altinisik, K. (2016). Effects of operation temperature and reactant gas humidity levels on performance of PEM fuel cells. Renewable and Sustainable Energy Reviews, 59, 1298–1306. [Google Scholar]
39. Wang, B. W., Wu, K. C., Yang, Z. R., Jiao, K. (2018). A quasi-2D transient model of proton exchange membrane fuel cell with anode recirculation. Energy Conversion and Management, 171, 1463–1475. [Google Scholar]
40. Xu, Y. M., Fan, R. J., Chang, G. F., Xu, S. C., Cai, T. (2021). Investigating temperature-driven water transport in cathode gas diffusion media of PEMFC with a non-isothermal, two-phase model. Energy Conversion and Management, 248, 114791. [Google Scholar]
41. Sankar, K., Aguan, K., Jana, A. K. (2019). A proton exchange membrane fuel cell with an airflow cooling system: Dynamics, validation and nonlinear control. Energy Conversion and Management, 183, 230–240. [Google Scholar]
42. Jiang, Y., Yang, Z. R., Jiao, K., Du, Q. (2018). Sensitivity analysis of uncertain parameters based on an improved proton exchange membrane fuel cell analytical model. Energy Conversion and Management, 164, 639–654. [Google Scholar]
43. Kim, K. H., Lee, K. Y., Lee, S. Y., Cho, E. A., Lim, T. H. et al. (2010). The effects of relative humidity on the performances of PEMFC MEAs with various Nafion ionomer contents. International Journal of Hydrogen Energy, 35(23), 13104–13110. [Google Scholar]
Cite This Article
 Copyright © 2024 The Author(s). Published by Tech Science Press.
This work is licensed under a Creative Commons Attribution 4.0 International License , which permits unrestricted use, distribution, and reproduction in any medium, provided the original work is properly cited.
 Downloads
 Citation Tools