
 Submit a Paper
 Propose a Special lssue
 Open Access
ARTICLE

Digital Twin Modeling and Simulation Optimization of Transmission Front and Middle Case Assembly Line
1 Process Research Institution, China National Heavy Duty Truck Group Co., Ltd., Jinan, 250100, China
2 Transmission Factory, China National Heavy Duty Truck Group Co., Ltd., Jinan, 250100, China
3 5G Intelligent Manufacturing Research Center, Institute of Marine Equipment, Shanghai Jiao Tong University, Shanghai, 200240, China
4 Institute of Intelligent Manufacturing and Information Engineering, School of Mechanical Engineering, Shanghai Jiao Tong University, Shanghai, 200240, China
* Corresponding Author: Yahui Zhang. Email:
(This article belongs to the Special Issue: Computing Methods for Industrial Artificial Intelligence)
Computer Modeling in Engineering & Sciences 2024, 139(3), 3233-3253. https://doi.org/10.32604/cmes.2023.030773
Received 21 April 2023; Accepted 14 June 2023; Issue published 11 March 2024
 View Full Text
 Download PDF
Abstract
As the take-off of China’s macro economy, as well as the rapid development of infrastructure construction, real estate industry, and highway logistics transportation industry, the demand for heavy vehicles is increasing rapidly, the competition is becoming increasingly fierce, and the digital transformation of the production line is imminent. As one of the most important components of heavy vehicles, the transmission front and middle case assembly lines have a high degree of automation, which can be used as a pilot for the digital transformation of production. To ensure the visualization of digital twins (DT), consistent control logic, and real-time data interaction, this paper proposes an experimental digital twin modeling method for the transmission front and middle case assembly line. Firstly, the DT-based system architecture is designed, and the DT model is created by constructing the visualization model, logic model, and data model of the assembly line. Then, a simulation experiment is carried out in a virtual space to analyze the existing problems in the current assembly line. Eventually, some improvement strategies are proposed and the effectiveness is verified by a new simulation experiment.Graphic Abstract
Keywords
The assembly line is an important production mode of large-scale production in the automobile manufacturing industry. The stations are arranged according to the process sequence of the product, and the workpiece passes through each station in turn. At each station, workers complete the corresponding assembly tasks to form a complete product [1,2]. Since its first design by the Ford Motor Company in 1913, the assembly line has been rapidly adopted by automobile manufacturers because of its advantages, such as shortening the product production cycle, optimizing transportation routes, and improving production efficiency. However, the planning of the assembly line mainly relies on the traditional simple analysis methods and personal experience. The generality and expansibility of the developed scheme are poor, and it is difficult to adapt to the complex and changeable manufacturing environment. Besides, because of the lack of comparison of various schemes, there is no guarantee that the planning scheme is optimal or better, and it is difficult to achieve the expected effect. The data show that about 80% of the complex production lines in operation at home and abroad cannot fully meet the design requirements. Therefore, before production, it is necessary to repeatedly plan and improve. In addition, after the assembly line is put into operation, the original balance parameters, such as cycle time, operation content, operation time, and assembly process, may change with the improvement of assembly workers’ technology, product upgrades, customer demand change, etc. Then, the original assembly line balance may be disrupted, resulting in the assembly line not being stable, efficient, and high-quality operation, greatly reducing the economic benefits of enterprises. Therefore, it is necessary to optimize and improve the original balancing scheme.
However, the construction cost of assembly lines is huge, usually ranging from tens of millions to hundreds of millions of yuan. In addition, for the assembly line already in operation, the task assignment location is determined, which means that the equipment, workers, tools, and other production resources for assembling the task have been configured. As soon as the task assignment changes, the assembly line needs to be rebuilt accordingly. Because the allocation position of the assembly task changes, the equipment and tools of the assembly task need to be disassembled and assembled again, and workers need to be retrained or even reassigned. The material rack needs to be rearranged, and even the logistics plan and the path of the distribution car also need to be replanned, which requires a large amount of additional capital investment [3].
Through computer simulation, the static and dynamic performance of the assembly line can be fully predicted before the assembly line is put into operation or reconstruction, and the problems of system layout, configuration, and scheduling control strategy can be found early to put forward the improvement plan faster and better [4]. Therefore, simulation technology is very important and widely applied in the field of production and manufacturing [5]. However, the traditional simulation method is divorced from the actual production, and more used for algorithm verification and analysis [6–10].
In recent years, the manufacturing industry has accelerated its transformation and upgrading to digitalization and intelligence along with the unprecedented development of information technology [11–13]. Digital twin (DT), which is in concept to cyber physical system (CPS) [14], is an important means to implement intelligent manufacturing by building a virtual system with high-fidelity for physical entities through digital space and establishing an interaction channel between the physical world and the virtual world to realize the virtual-real interaction and control optimization of the system [15,16]. It supports intelligent manufacturing from the design stage to the implementation stage [17]. The simulation in the virtual world can directly act on the assembly line in the real physical world, and the actual operational data in the physical world can be fed back to the virtual world, so that the simulation model in the virtual world can be more suitable for the actual assembly line, and the improvement scheme proposed is more feasible [18]. In addition, the high simulation operation interface is provided which is more visual and easier to understand and master by the assembly workers, as well as monitor the assembly process in real-time.
Therefore, this article constructs the DT model of the transmission front and middle case assembly system, using it to simulate and debug the current operation scheme of the production line and verify its rationality. Then, the improved adjustment and optimization strategies and schemes are provided to optimize the cycle time of production. The rest part of this article is as follows. Section 2 provides the related work. In Section 3, the DT-based framework of the transmission front and middle case assembly system is designed. The DT model is constructed and analyzed in Section 4. Section 5 proposes improvement strategies and the performance is verified based on the simulation of the DT model. The conclusions are provided in Section 6.
The concept of DT was first formally proposed in 2010 [19] and originated from Product Lifecycle Management [20,21], which developed from digital product definition and modeling [22,23]. After that, some scholars in different fields of the industry summarized some guidelines for the DT application around the entire product lifecycle. Based on such criteria, the preliminary concepts of 14 types of DT-based applications were explored and proposed, which comprehensively covered the product layer, workshop layer, and enterprise layer [24]. It has assisted and laid the foundation for the in-depth exploration of digital twins. For the workshop layer, Tao et al. [25] put forward a conceptual DT model for the workshop and the deeper implementing methods. Characteristics, components, operational mechanisms, and crucial technologies of the system were analyzed theoretically. Then, this paper discussed and summarized the interaction and fusion pattern of physical workshops and virtual workshops with the support of DT data. The realization of four parts of the workshop entity, virtual, service, and data was theoretically explored. It put forward a theoretical and methodological reference for the realization of the DT technology in intelligent manufacturing workshops.
In 2015, the application of DT began to expand through its use in industrial manufacturing. General Electric tried its best to build a digital twin of engines supported by big data, the Internet of Things (IoT), and a cloud platform to monitor the engine manufacturing process in real time and then developed a timely inspection plan to ensure that failure prevention can be achieved before it occurred [26]. Liu et al. [27] proposed a DT-based design method for automated pipeline manufacturing to quickly generate design schemes in the product trial-production stage. At first, the DT model of the manufacturing system was constructed, and then the design schemes were tested and optimized through simulation. Wang et al. [28] adopted an integrated framework named “Five-dimensional system design of DT” based on knowledge and proved the constructed product design DT model made sure system service can be effectively evaluated, and the complexity of the design process could be effectively predicted and managed.
Furthermore, many scholars Many researchers focused on the application of DT for production system optimization. Most of them focused on intelligent decision-making based on the DT model. Zhuang et al. [29] focused on complex product assembly and constructed a DT model for the workshop to realize the workshop’s digital management and control. This paper provided the workflow of timely data collection, the DT modeling process, and a prediction method driven by DT to manage and control the assembly process. Ding et al. [30] defined an intelligent shop system based on digital twinning by referring to CPS theory, studied the composition and configuration mechanism of physical shops and virtual shops, respectively, and proposed an operation mechanism based on virtual and real shop information interaction, realizing a data-driven operation management and control method. Gehrmann et al. [31] actively explored and discussed a digital control method of key processes based on DT modeling and security architecture. Zhang et al. [32] put forward a DT model of the machines during the dynamic scheduling process in the job shop to predict the availability of machines, detect interference between machines, and evaluate their performance. Finally, they in turn supported dynamic optimization decisions. Yang et al. [33] constructed a DT model of a spacecraft assembly system and simulated the assembly scenarios under various real-time data to verify and analyze the operation status of the assembly system, and help select a practical and feasible operation scheme of the assembly system. Zhang et al. [34] proposed a consistency evaluation method between DT shop-floor models and the related physical entities to ensure the validity of the models. Zhang et al. [35] considered the dynamic and changeful market environment of equipment manufacturing, and developed a reconstruction framework based on digital twin (DT) for a semi-automatic electronic assembly line and an optimal reconfiguration algorithm. The aim was to optimize the production scheduling scheme and balance task and buffer assignments. Zhu et al. [36] focused on the problem of inefficient collaborative work between humans and robots in manufacturing systems and proposed an intelligent manufacturing method based on DT and a multi-objective intelligent optimization algorithm. The DT model was used for the presentation of operational optimization objectives and constraints, and performance verification of the proposed algorithm. A DT online calibration method based on Kalman filtering and feedback signal was addressed by Sjöberg et al. [37] to handle the issue of online geometric assurance during sheet metal assembly.
Some scholars focused on exploring the extension function of the DT model, and carried out simulation research based on the DT model, in which the improvement strategies were proposed directly based on simulation results. Luo et al. [38] proposed a method of preventive maintenance of CNC machine tools based on DT to ensure the working efficiency and safety of NC machine tools in machining. Through the construction of the DT model and DT-based simulation, the remaining life of the machine tool and the probability of possible failure were predicted, and timely preventive decisions could be made to avoid significant economic losses or artificial damage. Leng et al. [39] studied a flexible product manufacturing system based on DT modeling and simulation technology considering increasingly diversified customer needs. The main objective was to the rapid reconstruction and optimization of product assembly systems through the optimal configuration of assembly tasks based on DT simulation, to better meet the personalized requirements of customers, eventually. In response to the current problem of spacecraft assembly quality being limited by real-time and variable process data. Li et al. [40] established the DT model of an auto body in the white welding shop, and the DT-based simulation model was improved through repeated simulation experiments to supplement the lack of data in the system. Then, combined with a real-time detection method of reconstruction, real-time detection and analysis of the welding process was realized to improve the welding quality of the auto body in white and reduce the number of reworks.
All the above-proposed research shows that the actual application of DT technology in product and production systems is still in the theoretical and exploratory stages. The support of modeling and analysis software is often one-sided, that is, the data flow between the virtual system and physical system is not smooth, and the virtual system cannot support the performance evaluation of the physical system, let alone performance optimization.
3 DT-Based Framework of Transmission Front and Middle Case Assembly System
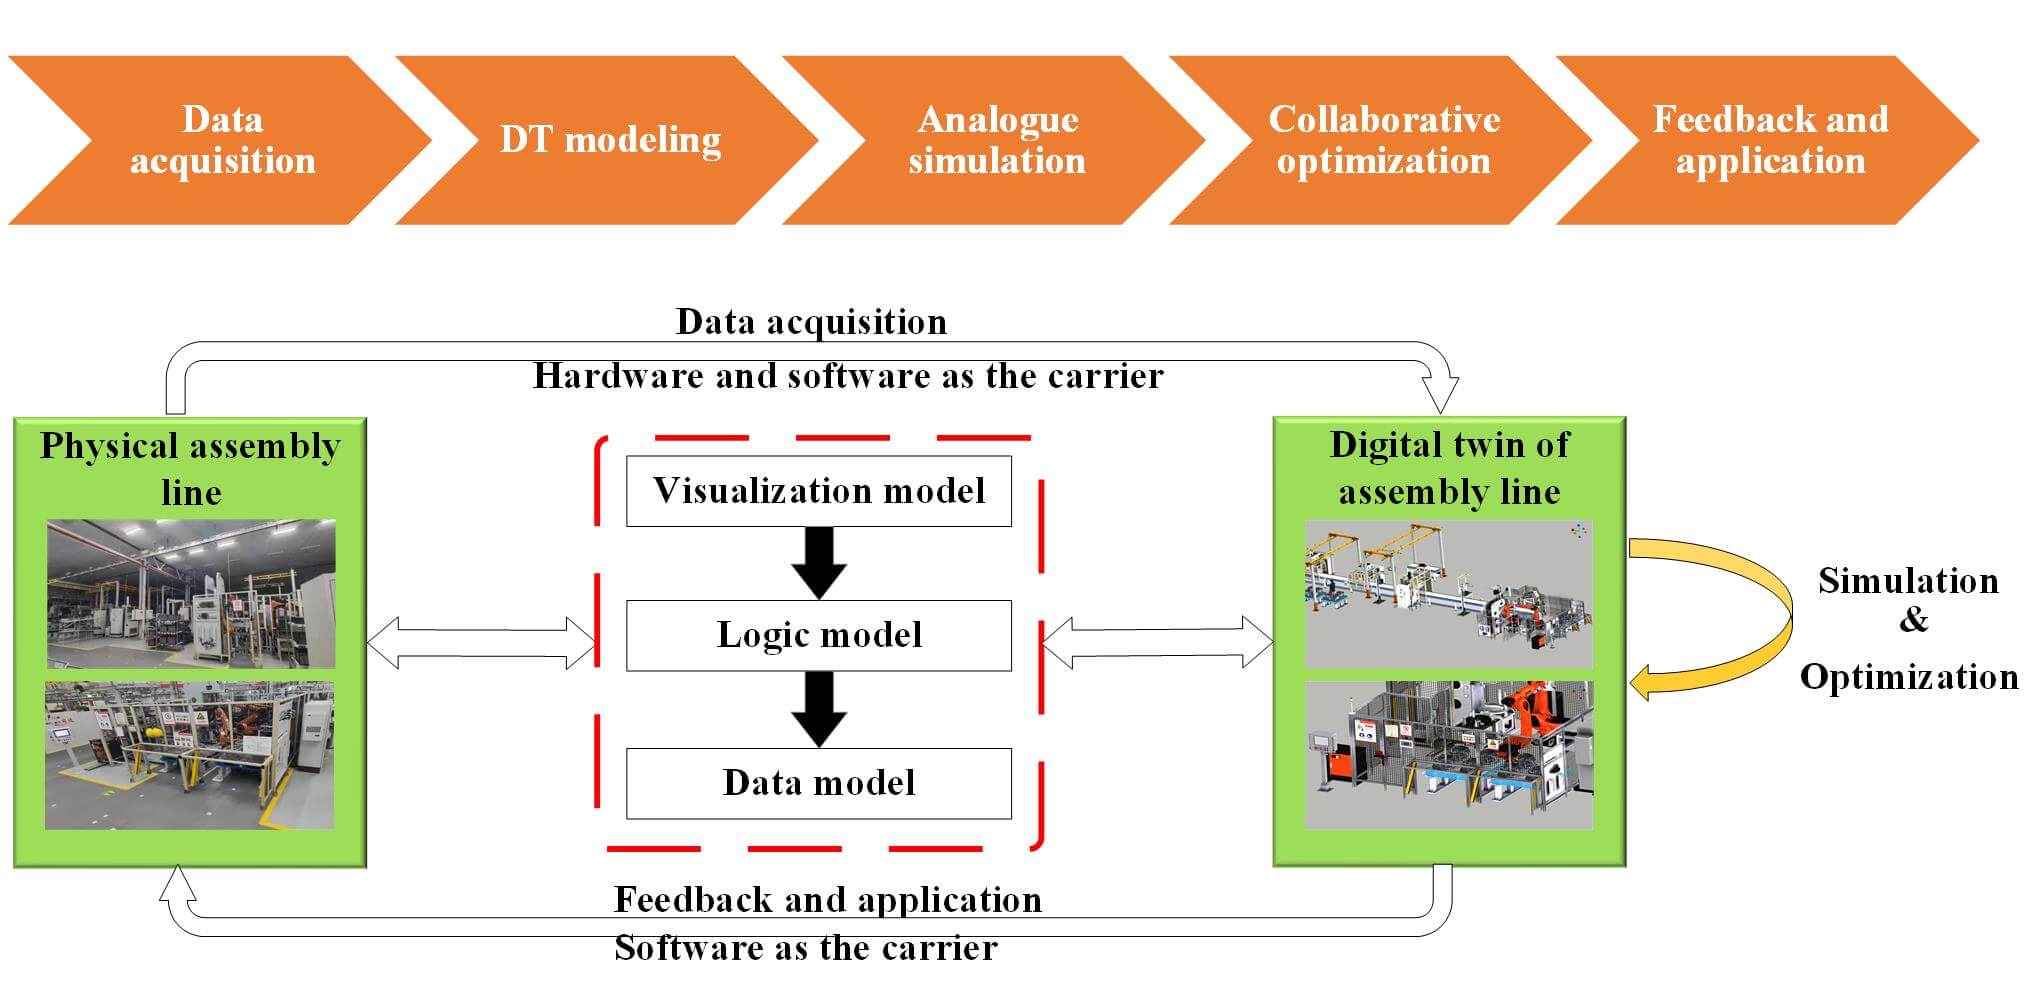
The DT-based framework of the transmission front and middle case assembly system is shown in Fig. 1. It mainly consists of five parts: (1) Physical assembly line, which describes the physical elements involved in the process of transmission front and middle case assembly, including assembly workers, equipment and tooling, parts, stations, and other assembly resource entities on the site. (2) Virtual assembly line, which is constructed on the simulation modeling software. The function is to realize the analysis, planning, and optimization of the actual physical assembly line. (3) Visualization model: With the help of three-dimensional (3D) modeling software, a 3D model corresponding to each production factor on the actual physical assembly line is constructed to obtain a visual 3D simulation assembly line, which is identical to the actual assembly line in static appearance and highly similar to the actual assembly line in dynamic operation. (4) Logic model, mainly refers to the back-end programmable logic controller (PLC) logic control program embedded in the inner layer of the 3D visual model, which supports the operation of the virtual assembly line. Through repeated debugging and optimization, the virtual assembly line can achieve a highly similar operating environment to the actual assembly line. After that, the PLC logic control code program is embedded into the actual assembly line to ensure the virtual assembly line has the same internal control logic and then the virtual assembly line can simulate the real assembly line running process in real time. (5) Data model, which helps sort out the composition and logical relationship of system data, guiding data collection, and subsequent assembly line performance and operation analysis.
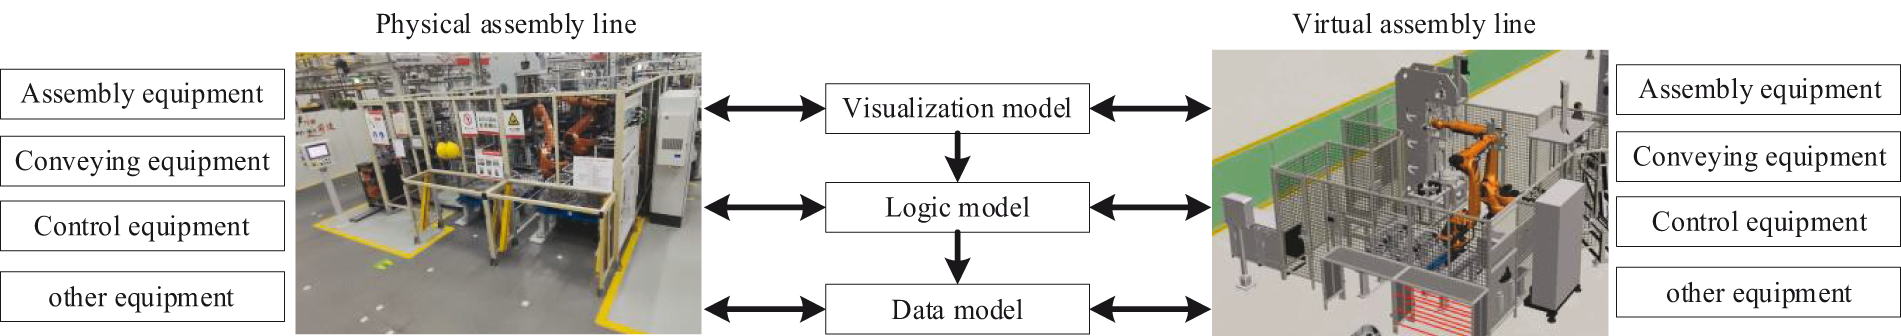
Figure 1: Overall framework
(1) Performance evaluation of the assembly system
Through the DT model and the timely monitoring of workpieces in place, workers in place, tools in place, workpiece percent of the pass, completion rate on schedule, and other information supporting the system simulation operation, the warning or alarm can be given when the parameters are out of range. The performance of the assembly line can be evaluated through some indexes, such as operation efficiency, balance rate, production shutdown rate, etc.
(2) Formulate and optimize the assembly line operation strategy
Tow-way alternate communication between the digital entities and physical entities can provide effective information support for the formulation of the operation strategy of the transmission front middle case assembly line. That is, information such as participating equipment, operation constraints, and action timing of physical entities is applied to the digital twin, and the optimal operation strategy is formulated through continuous iterative and debugging carried out on the digital twin.
3.3 Digital Twin Modeling Process
The digital twin modeling flow for the assembly line of transmission front and middle case is shown in Fig. 2. Firstly, a 3D model of assembly entities is established and imported into a self-defined simulation software. The scene model is rendered, the kinematic relationships are defined, and the visualization model is established. Then, the logic model and data model for the transmission front and middle case assembly line are established. Based on the interaction of those models, the virtual assembly line which is similar in appearance to the physical assembly line is established. Eventually, the simulation model that nested control logic and real-time data is verified once and once to obtain the working data and critical information of the virtual assembly line to shorten the time of assembly line construction and debugging, and then save the cost.
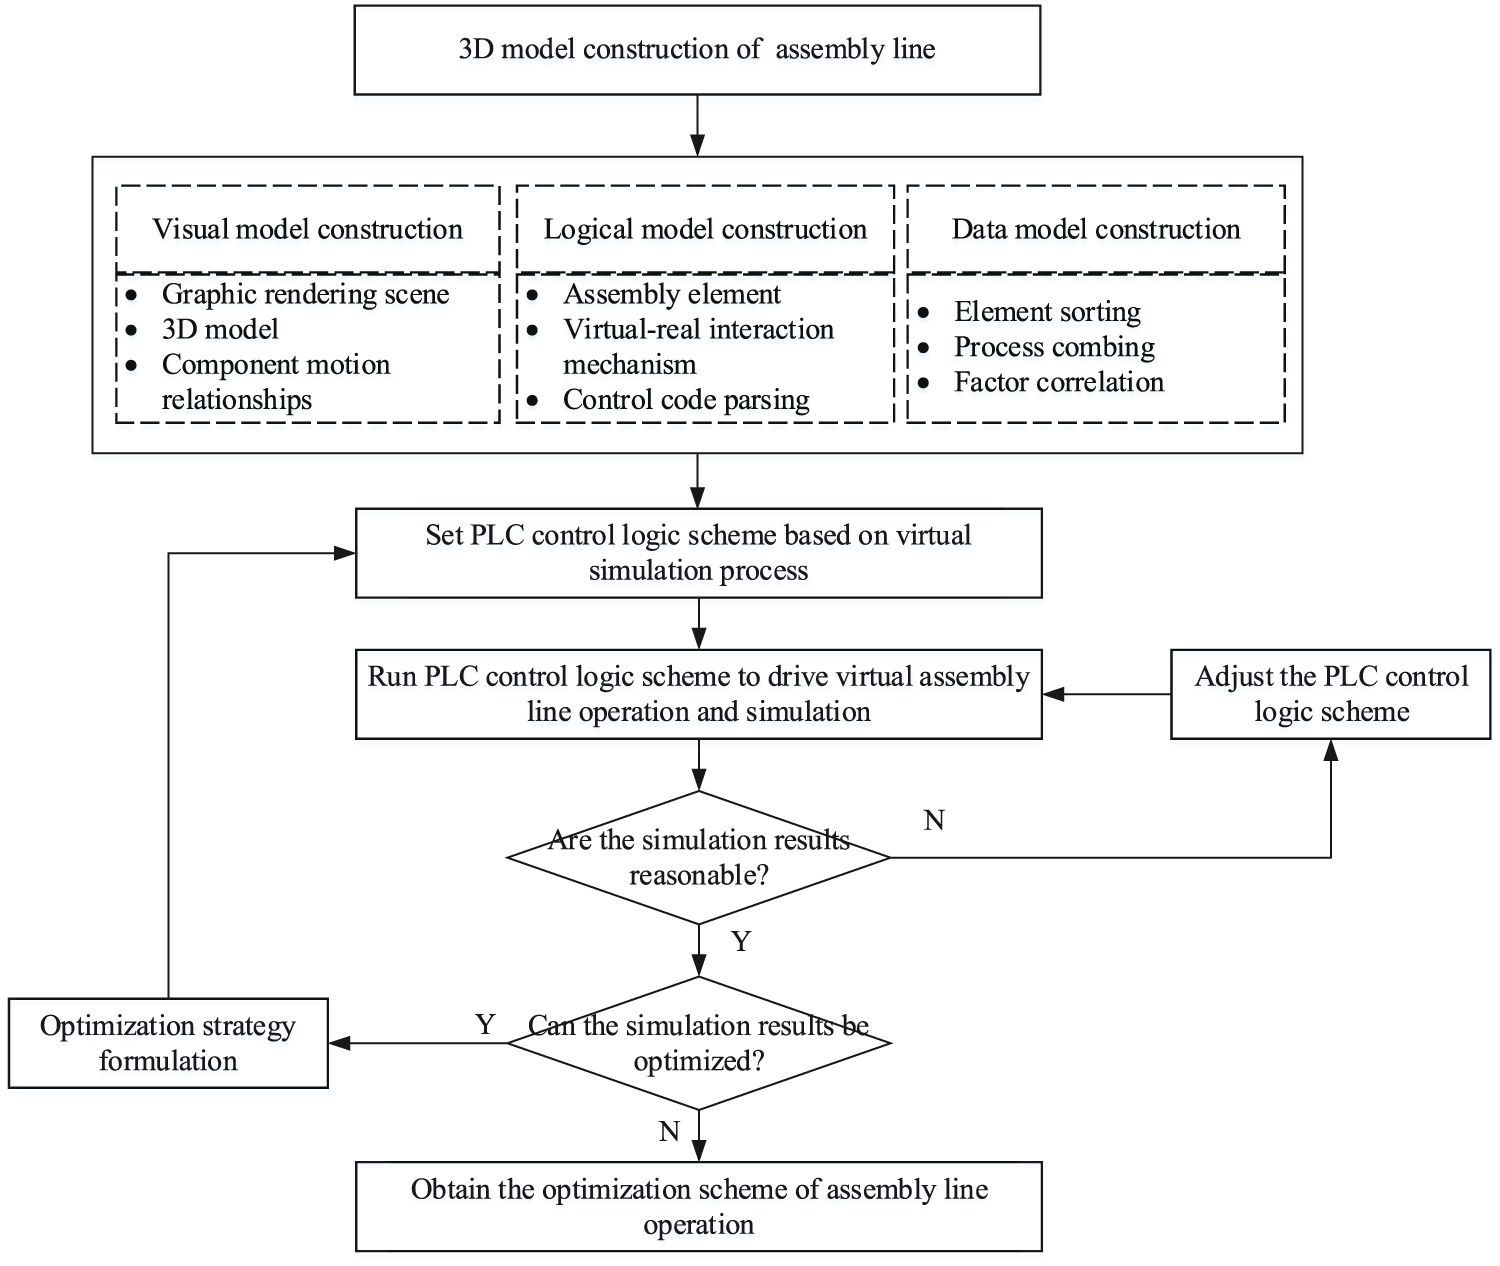
Figure 2: Digital twin modeling and simulation flow
The assembly line of the transmission front middle case is composed of the environment, materials, resources, and so on. To achieve the assembly line visualization, a 3D model of the assembly line must be established first. Through 3D modeling, the visualization model forms a virtual assembly line, which 100% corresponds to the physical one and provides a platform for data simulation. The establishment of a visualization model is divided into the following steps:
(1) Construction of the 3D model
The 3D model contains an environment model, a material model, and a resource model. It is necessary to create a specific dimensional appearance and give corresponding material through 3D modeling software. The environment refers to the plant, the ground, lighting, etc. The material model contains two layers, parts/blanks, and product level composed of parts/blanks. The final products are assembled from various parts. The resource model describes all the assembly resources from four levels of the component-equipment-station-assembly line. The component is the final moving parts, the equipment is composed of components, and each station is arranged according to the physical assembly line to complete the construction of the assembly line.
(2) Definition of kinematic pair and animation
Firstly, the established model is completely imported into the assembly line simulation software, which uses the customized “Intelligent Manufacturing Platform” software, as shown in Fig. 3. It is necessary to define kinematic pairs for different motion equipment, including translational motion and rotational motion. The translational motion needs to determine the direction of motion, origin, and distance of motion. Rotation motion needs to determine the rotation axis, rotation direction, rotation origin, and rotation angle range. Fig. 4 shows the definition of the rotating kinematic pair of one of the robotic arms, and its rotation range is −120° to 155°.
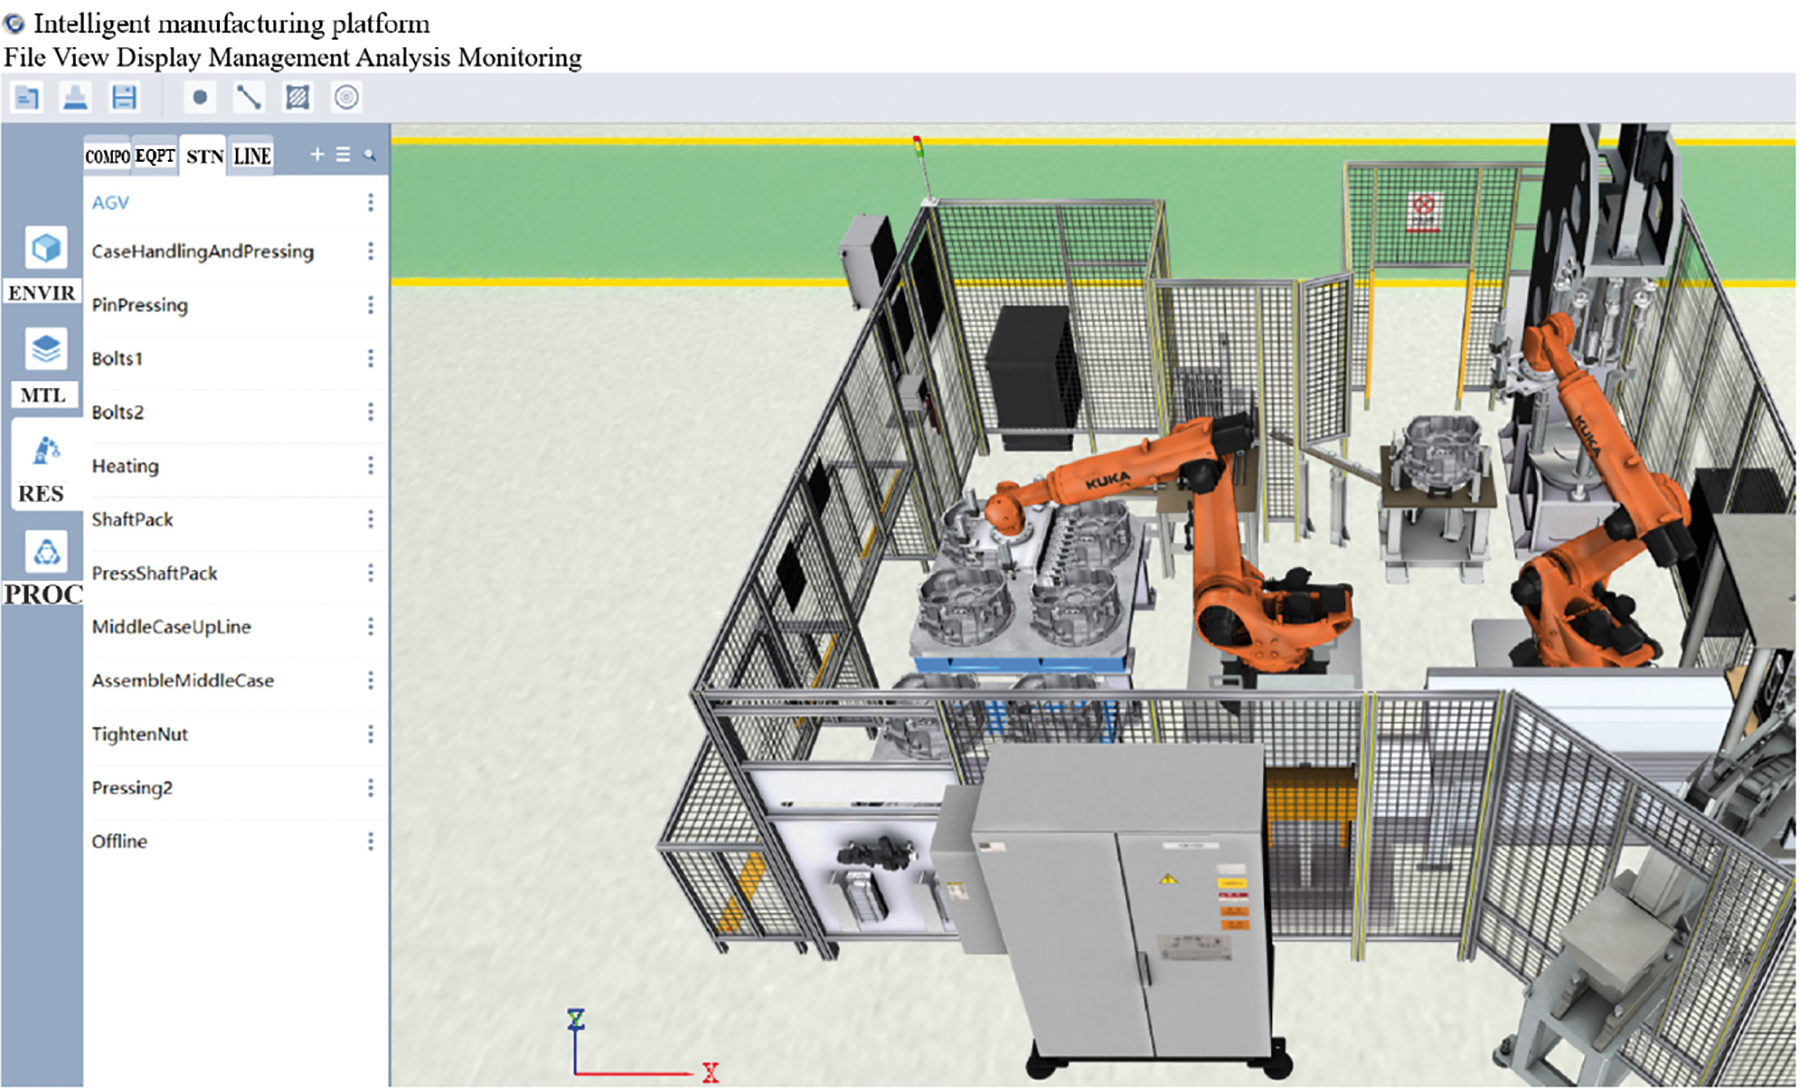
Figure 3: Intelligent manufacturing platform software
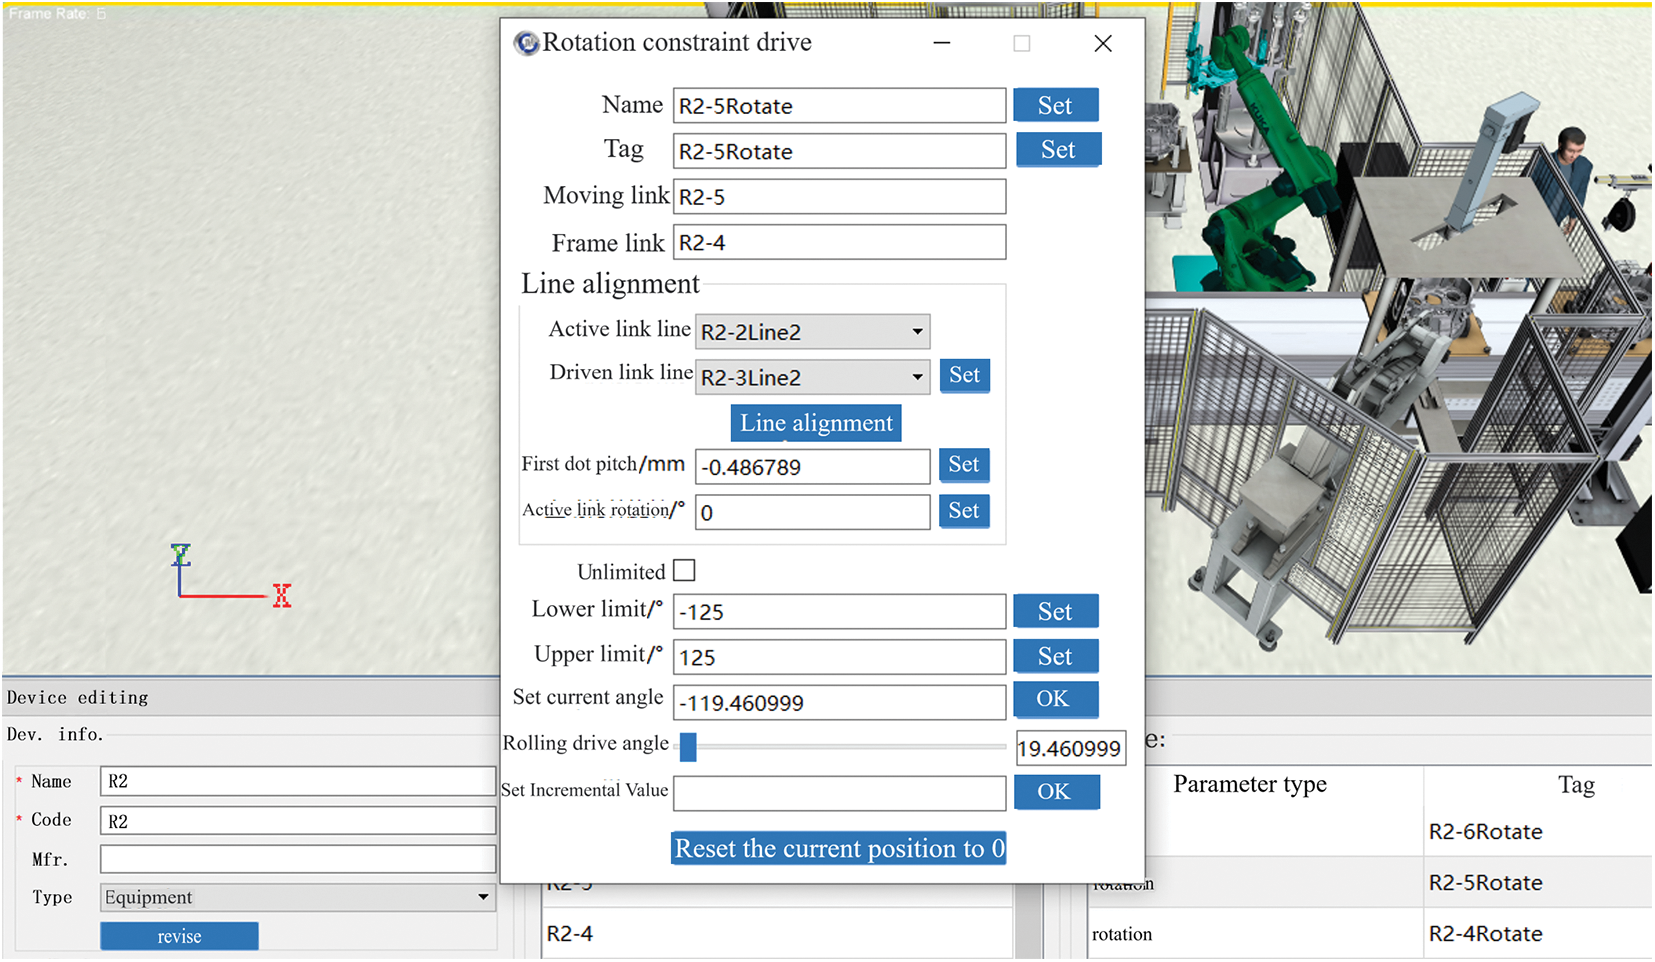
Figure 4: Definition of the rotating kinematic pair of one of the robotic arms
After the kinematic pair is established, it is necessary to complete the path planning of the assembly process to display the complete process actions (how parts are assembled, how equipment is moved to fit, roller table movement, manipulator trajectory, etc.), which are composed of different parameters and time axes of each kinematic pair. Meanwhile, collision detection can be started to determine whether physical interference collision will occur, as shown in Fig. 5. When the definition of the process animation of all stations has been completed, the definition of a set of processes is completed (the definition of the assembly process is completed through the series of working procedure).
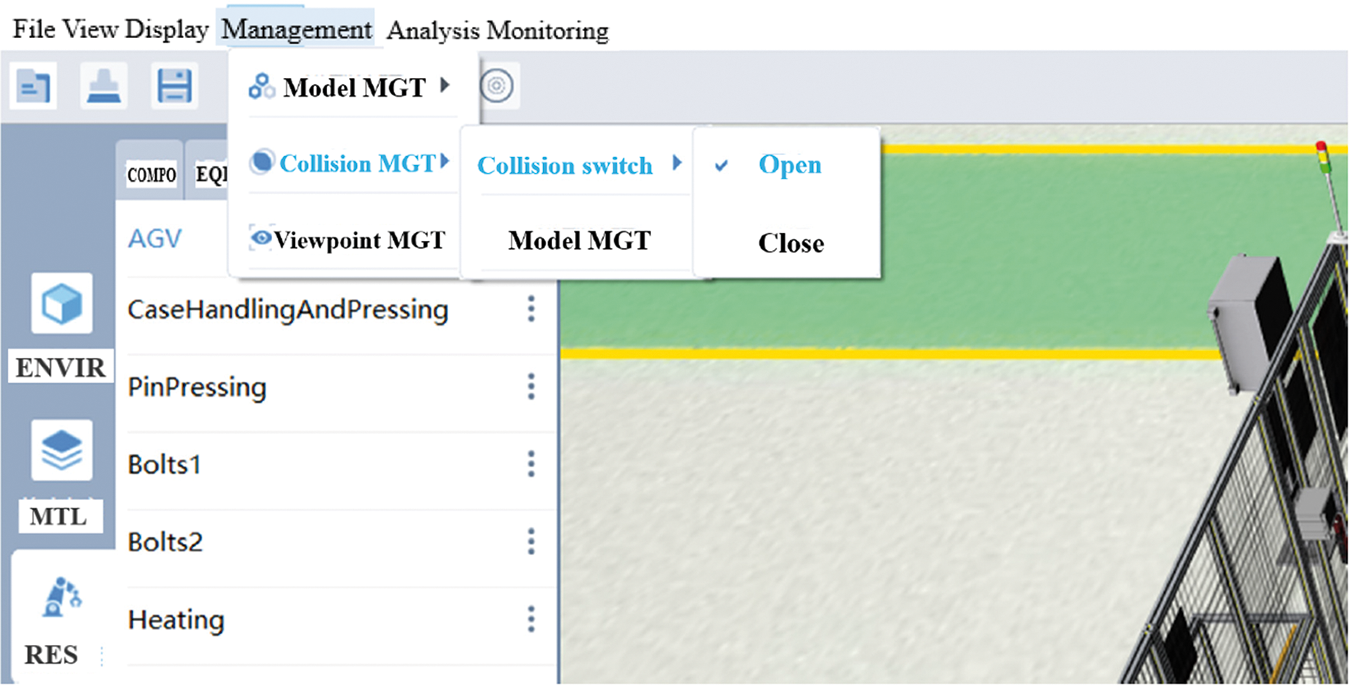
Figure 5: Process animation and collision detection
The logic model gives the flow sequence of the workpiece and time axis to drive the visualization model to display the predefined process animation (rendering the workpiece and displaying the corresponding assembly animation within a planned time range). Relevant inputs include product scheduling plan (there may be multiple models of products), assembly line configuration (station sequence and the number of buffers, worker allocation, etc.), exception configuration (types of exceptions and occurrence probability, etc.), team arrangement and working time configuration, etc.
The assembly process is relatively simple compared with the processing process, that is, through each working procedure in series. The whole assembly logic can be decomposed into the assembly logic of a single working procedure. Fig. 6 shows the logic model of a single working procedure. The workpiece at the corresponding station of the current working procedure comes from the previous station or the buffer in front (the first station is automatically fed), and the work starts when the start conditions are met. The start conditions include:
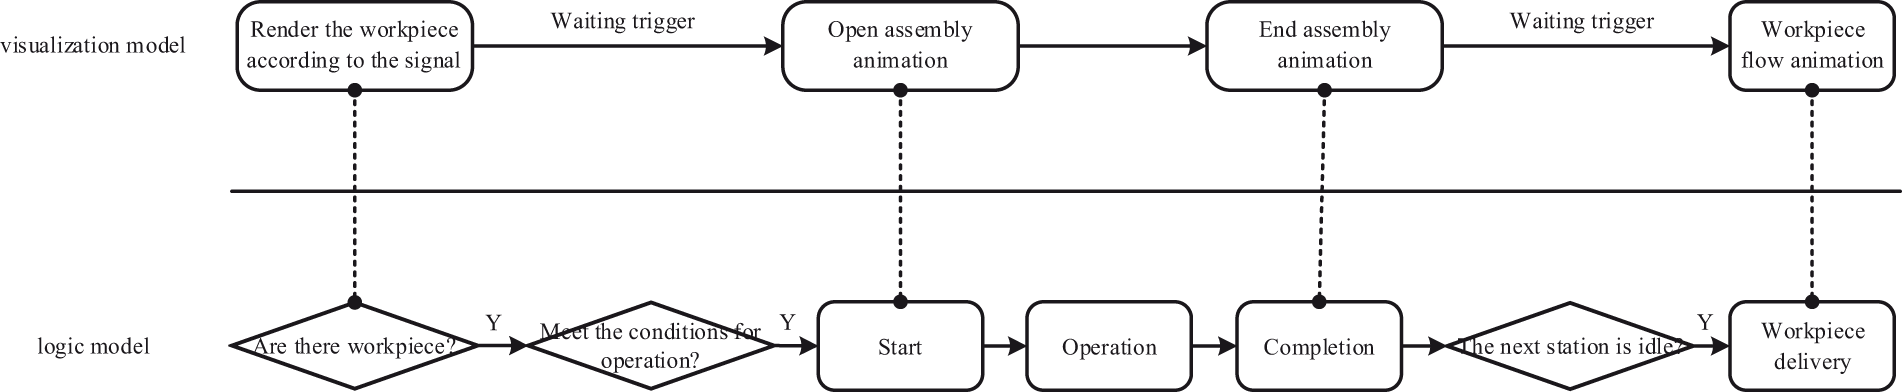
Figure 6: Logic model of a process for a station
(1) Complete materials
Each station has a corresponding material storage area, and the distribution of materials is not included in the scope of the simulation. However, there may be delayed distribution of materials, failing to start on time. Different stations have different requirements for materials, and the impact of materials is also different. According to the historical data statistics of different stations of the transmission front and middle case assembly line, the binomial distribution is used to simulate whether the material delay occurs, and the probability of material delay is given. When material shortage causes delay, the delay time should be given according to Poisson distribution, and the average time of actual material distribution is used as the mean of Poisson distribution.
(2) Equipment available
Equipment may break down, causing varying degrees of delay. The operation failure data of actual equipment is collected by PLC, and the probability and duration of failure of different equipment are calculated. Binomial distribution and Poisson distribution are used to simulate the occurrence of equipment exceptions and the processing time of exceptions.
(3) Worker available
Worker allocation under the simulation condition is given, so this condition is satisfied. In the actual production simulation, each manual station is equipped with an integrated terminal, workers swipe their cards to record commuting. The number of online workers can be used to determine whether to start working.
The assembly time of the workpiece is uncertain, various numbers of workers and stations will affect the assembly time. The operation time of each workpiece in the simulation model is according to the positive distribution, in which the mean and variance depend on different stations and the number of workers.
The rest (production scheduling plan, assembly line configuration, etc.) are given in advance before the simulation begins. Through the system simulation, the production time sequence diagram of different workpieces is given, the line performance index is calculated, and the line efficiency is judged. Based on this, the assembly line can be adjusted to meet the production demand and improve production efficiency.
A variety of unstructured data of “person, machine, material, method, environment and measurement” are involved in the assembly of transmission front and middle case. A structured process data model in Fig. 7 is developed to establish the association of these data, realize the structured and unified application of multiple types of data, and guide the subsequent data collection. It includes the version information involved in the assembly planning stage and the assembly execution stage, as well as the process element information of “person, machine, material, method, environment and measurement” and shows the topological correlation between each process element. Worker information, equipment information, tooling information, material information, and assembly quality information are all bound with the assembly process, which determines the “person, machine, material, method, environment and measurement” related to the on-site assembly operation. Assembly workers are the main body to execute assembly operations, which would operate equipment, handle parts and materials, implement assembly processes, and conduct quality inspection operations. Each process element is not independent, but it is bound and associated with each other through production orders and assembly workers.
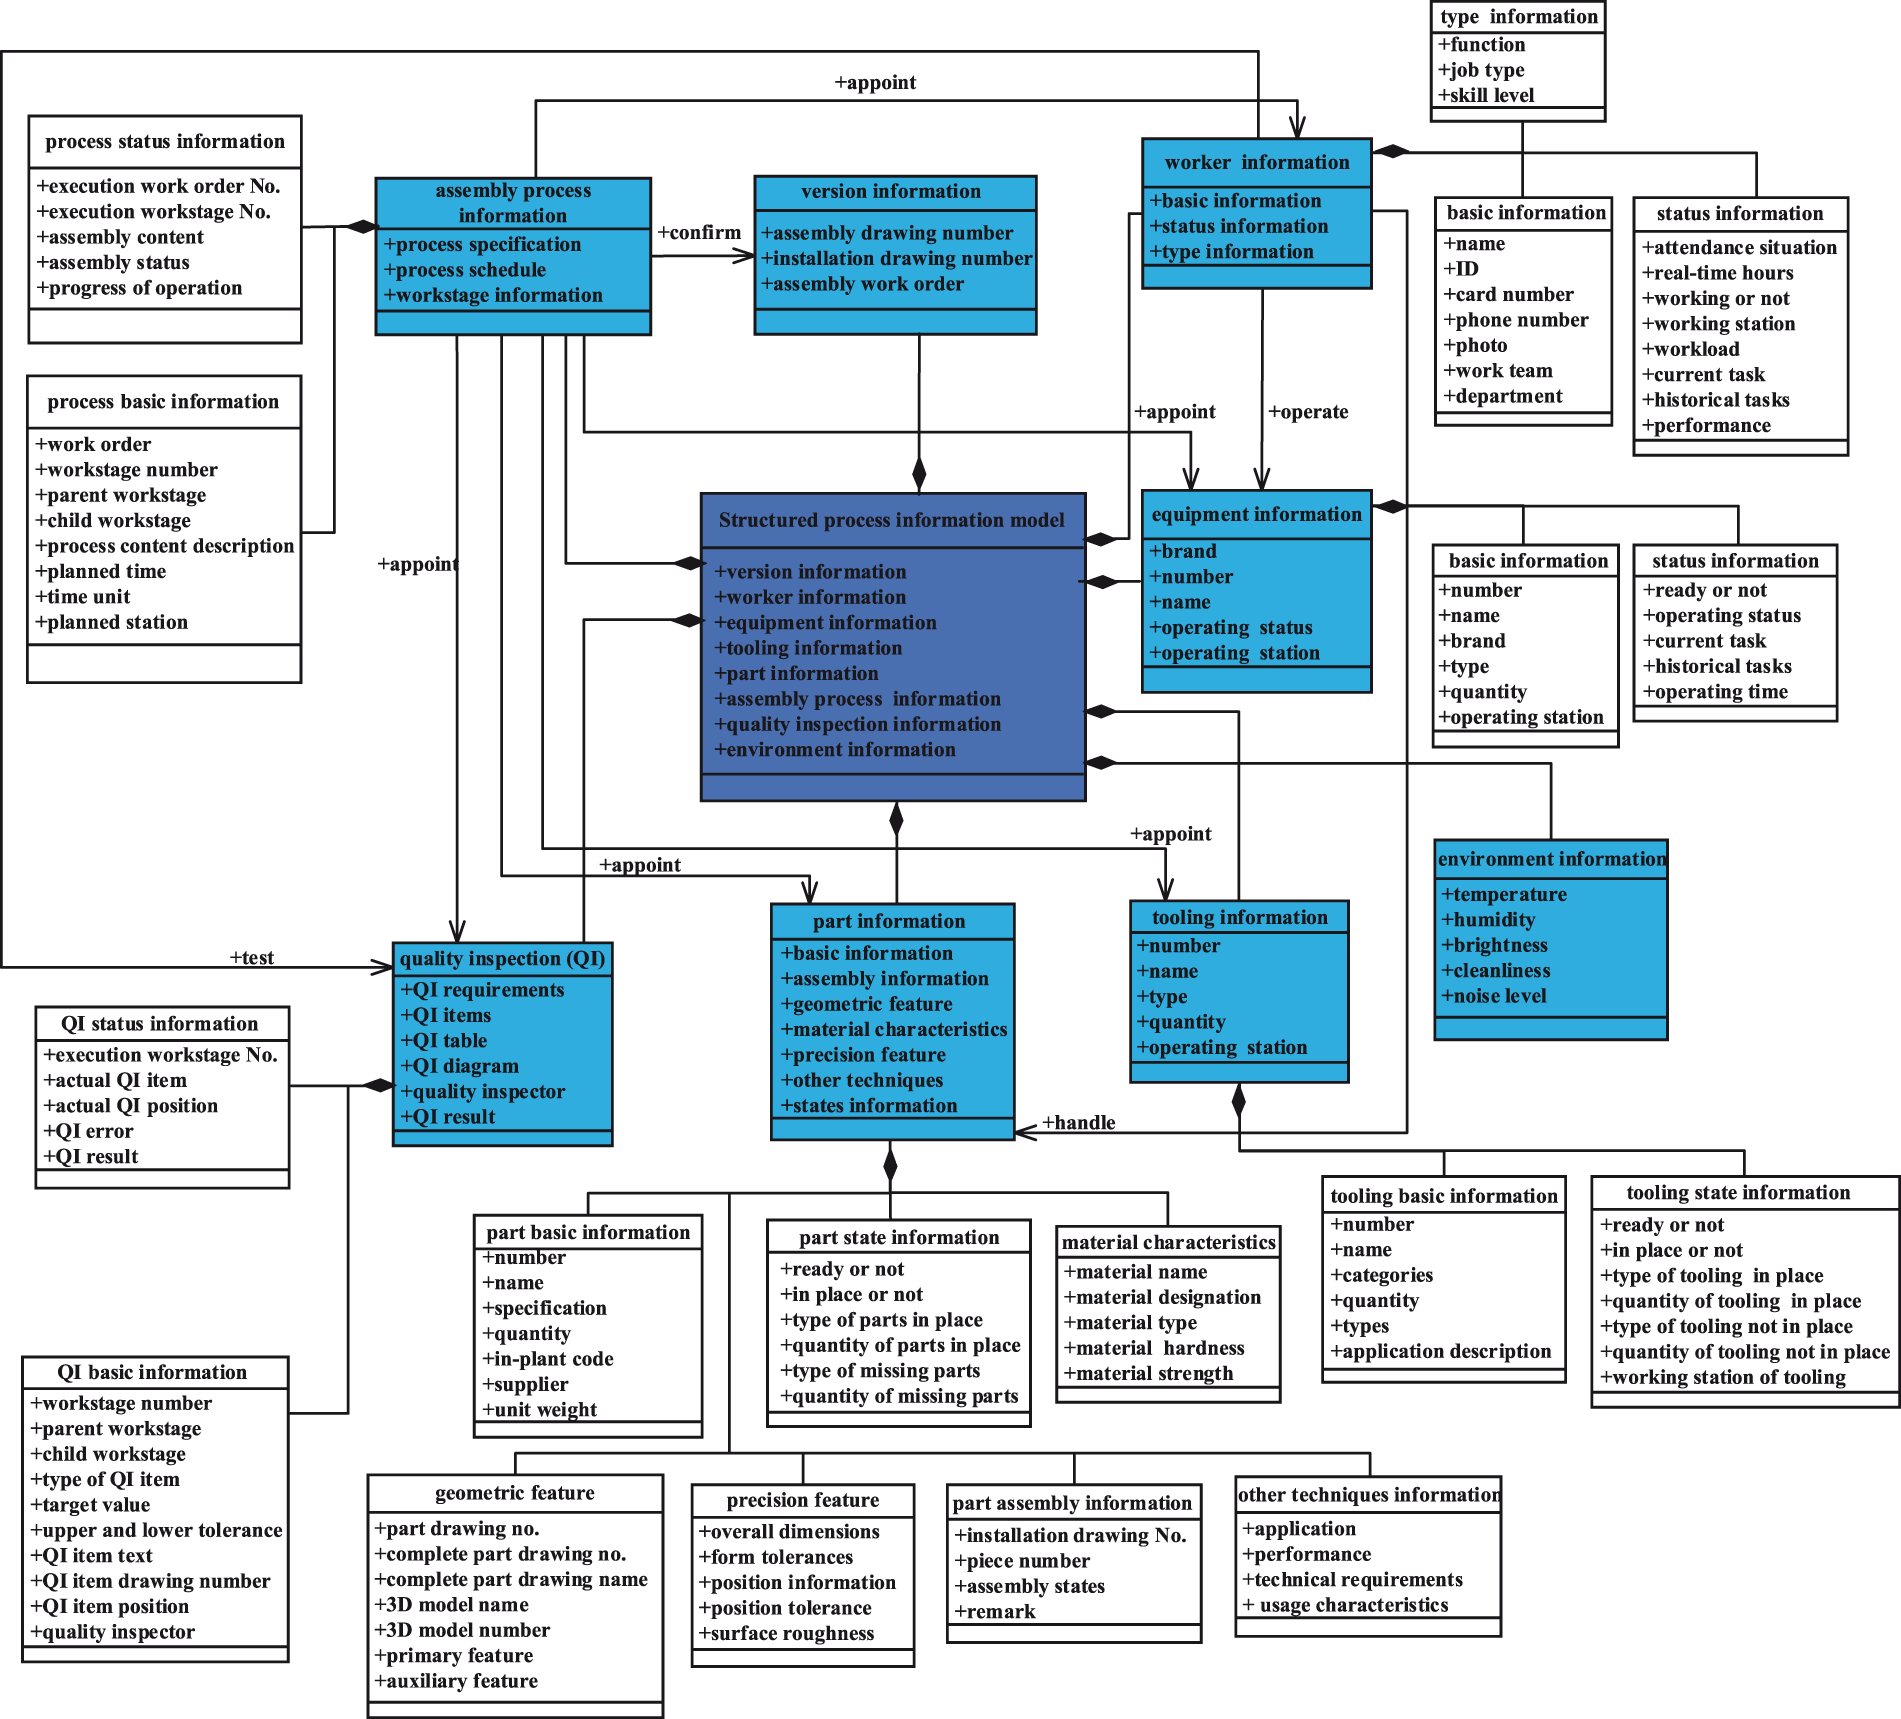
Figure 7: Data model
4 Construction of Data Twin Model and Analysis of Simulation Operation
4.1 Transmission Front and Middle Case Assembly Line
The assembly line of the transmission front and middle case contains 11 stations, and the expected cycle time is 120 s. Details of the operation contents of each station are shown in Table 1.
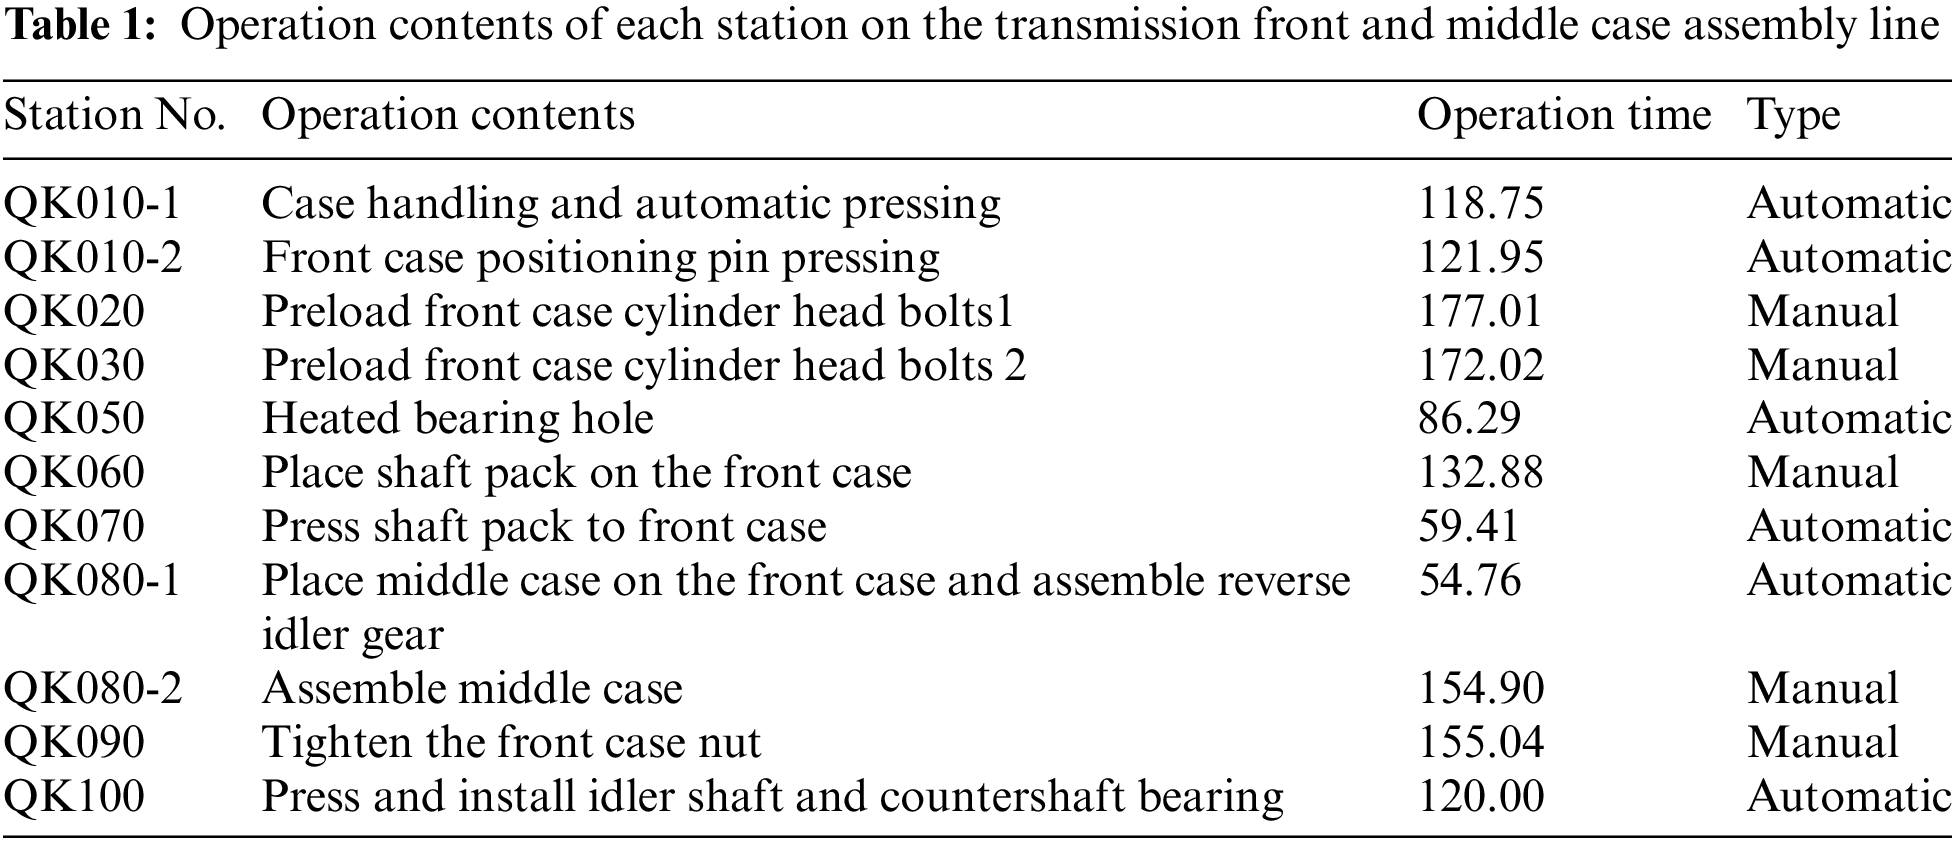
Stations QK010-1, QK010-2, QK050, QK070, QK080-1 and QK100 are automatic, while stations QK020, QK030, QK040, QK060, QK080-2 and QK090 are manual. Stations QK060 and QK080-2 can be operated by one person only, and stations QK020, QK030, and QK090 can be operated by more than one person, with a maximum of 2, 1 and 4, respectively. The operation time of stations QK020, QK030, and QK090 in Table 1 is obtained when it is being operated by 1, 1, and 2 workers, respectively.
As shown in Table 1, the existing problem of the assembly line is that the operation time of some manual stations is far more than the cycle time, while the operation time of automatic stations is far less than the cycle time, which leads to the generation of bottleneck, reduces the balance rate of the assembly line and the production efficiency. In addition, anomalies such as material delay, operation time variation, and equipment failure occur frequently, which result in a low one-time pass rate.
4.2 Operation and Analysis of Simulation Model
To facilitate display and analysis, the operation and analysis of the simulation are displayed in a two-dimensional interface. Fig. 8 shows the “Parameter setting” interface of a simulation model for the transmission front and middle case assembly lines. Before the execution of the simulation, the assembly line and the simulation period should be selected first. Then, the parameters, such as the number of workers at each station, should be filled in. If an anomaly occurs at the station, the estimated duration of the anomaly should be filled in too. Finally, click the “Submit” button and wait for the execution of the simulation until the title of “Result Display” changes into solid words. Click to view the simulation results, as shown in Figs. 9–13.
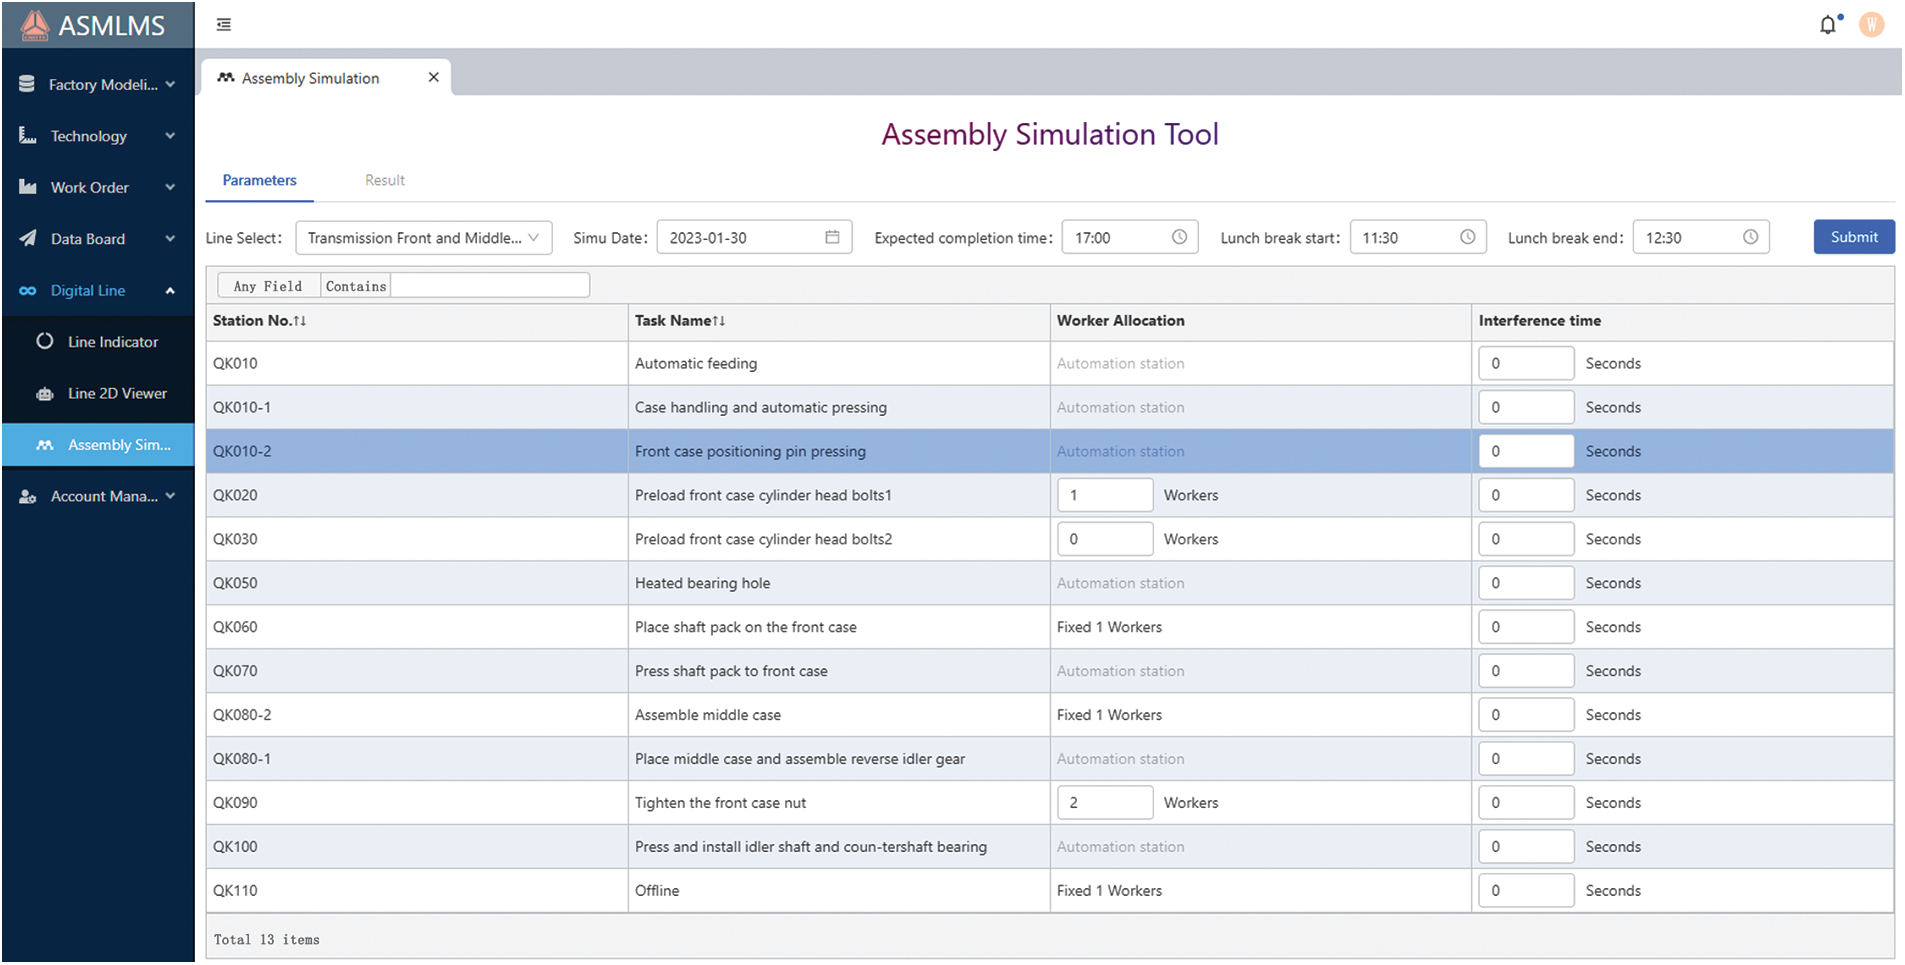
Figure 8: Operation parameter setting interface of the simulation model
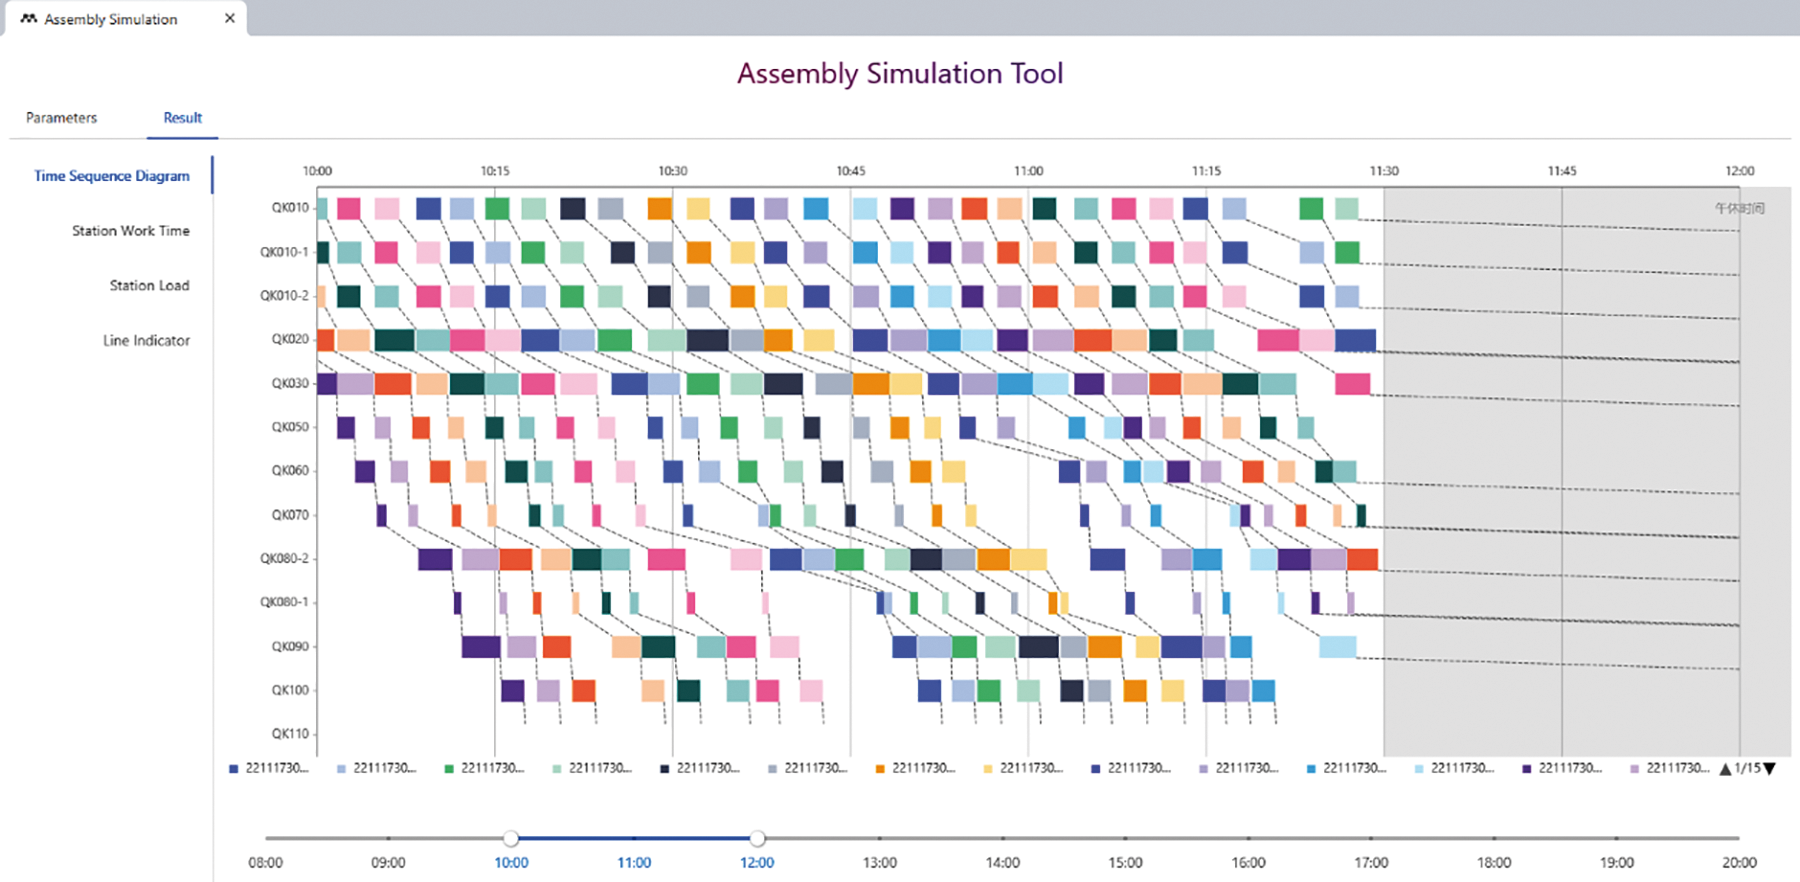
Figure 9: Simulation result—time sequence diagram
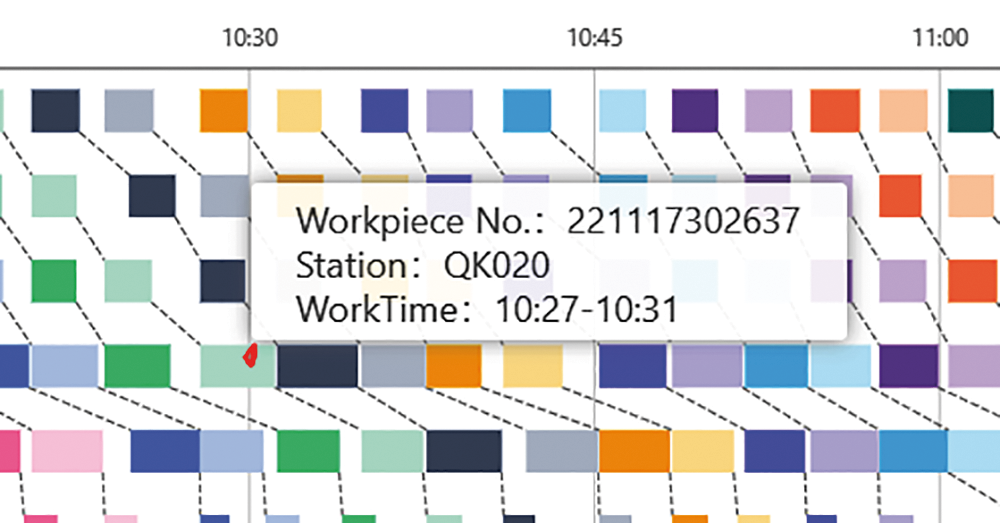
Figure 10: Task prompt of a time sequence diagram
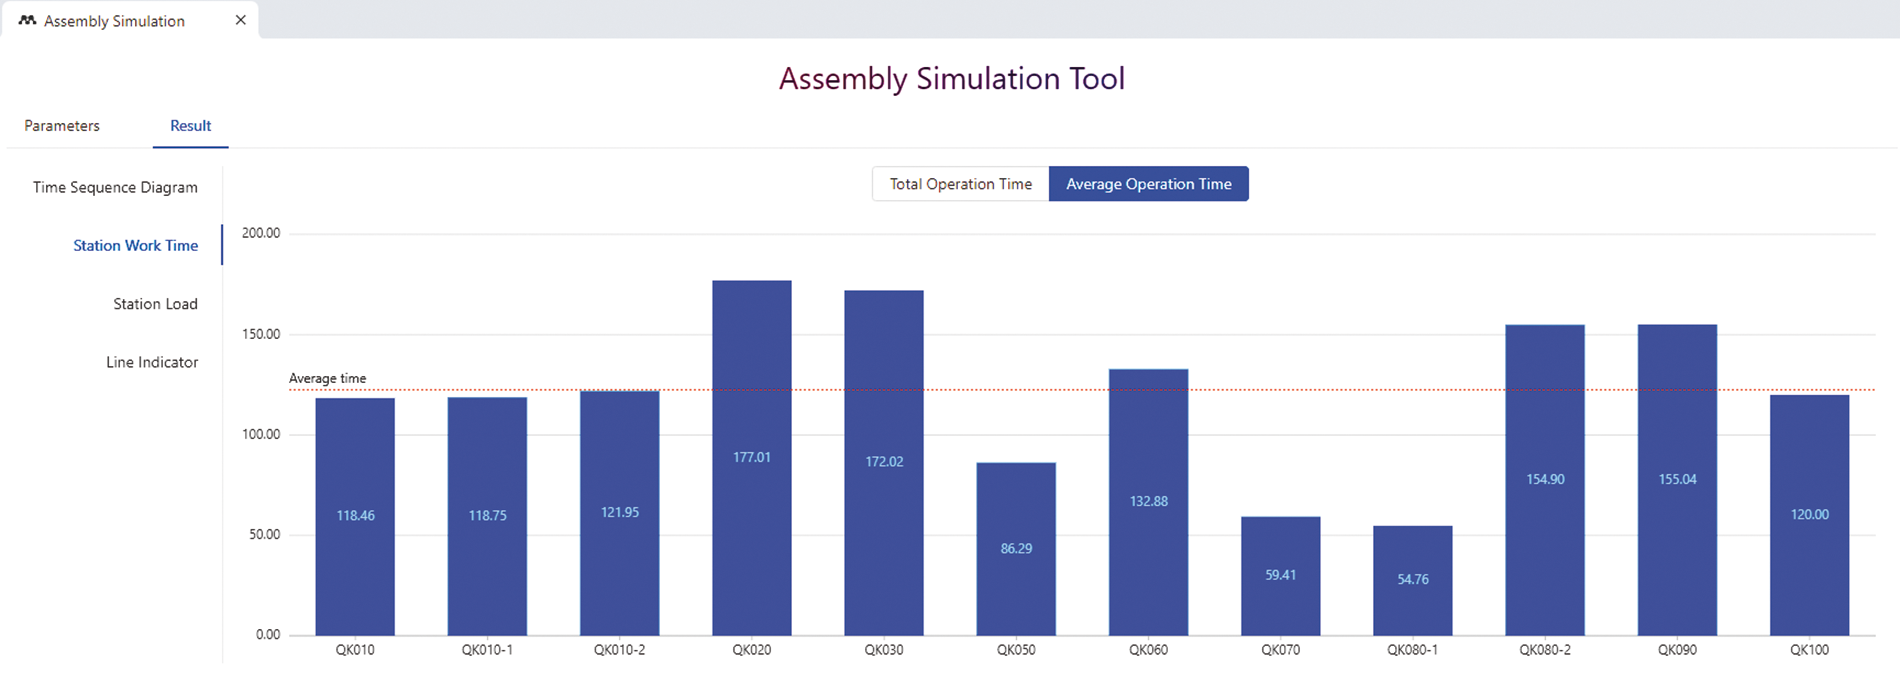
Figure 11: Simulation result—average operation time of stations
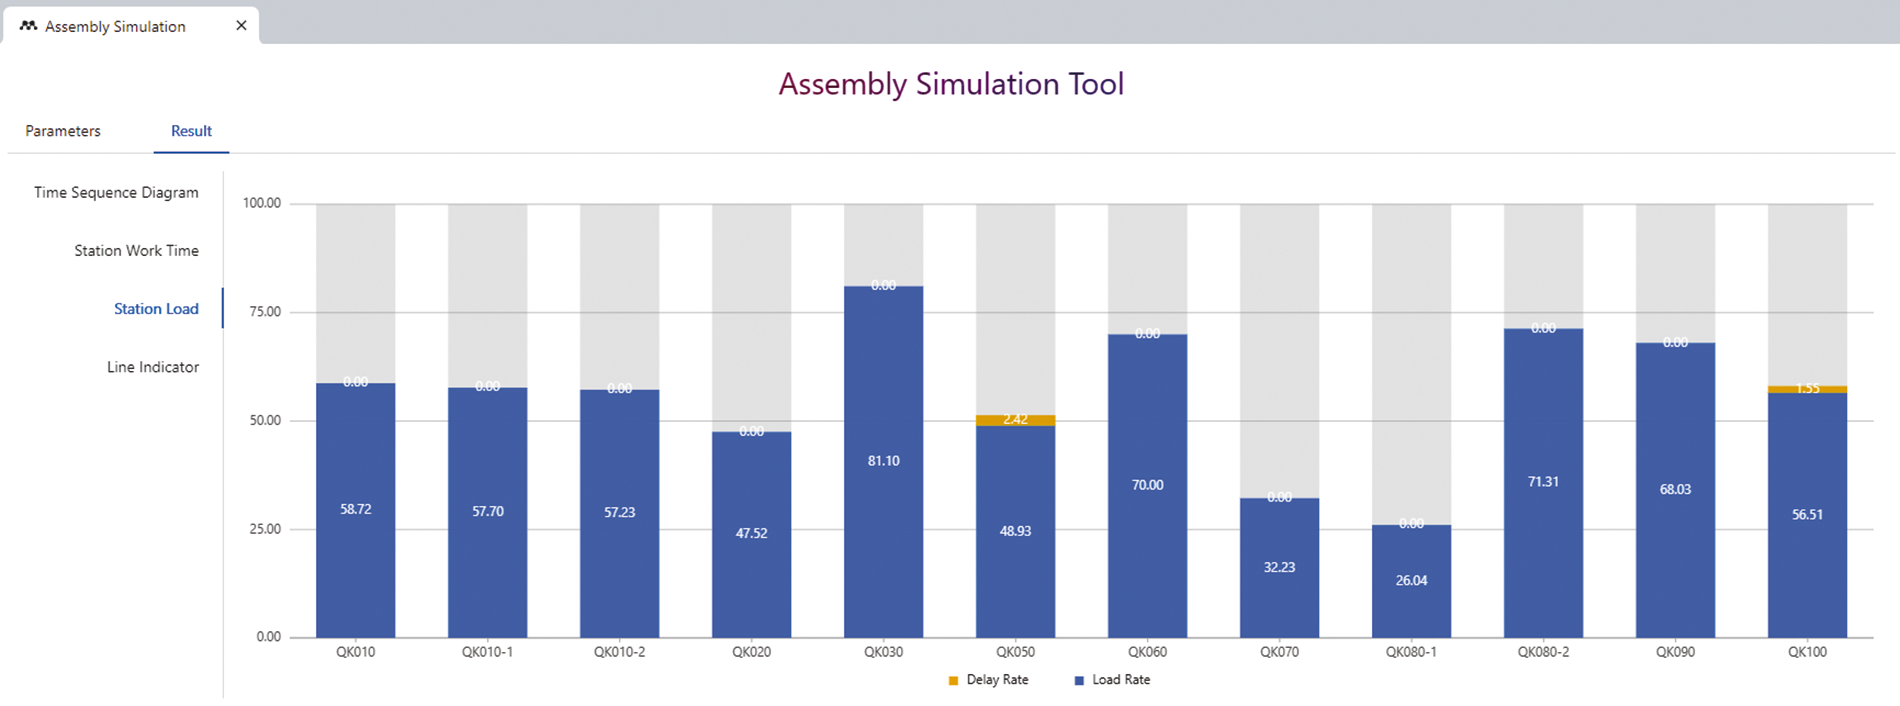
Figure 12: Simulation result—load of stations
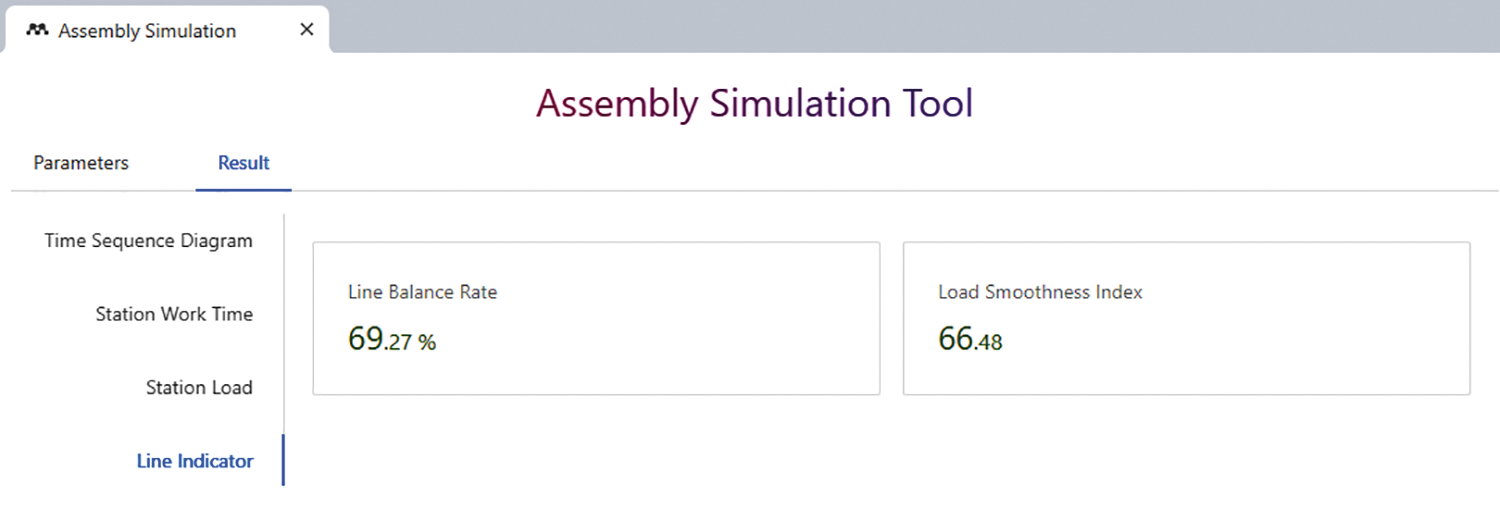
Figure 13: Simulation result—line balance rate
The left side of the time sequence diagram is the station and the horizontal axis is time. If the mouse hovers over the block, the work content will be displayed, as shown in Fig. 10. The number of current workpieces, estimated work start time, and completion time can be seen from the hover prompt. The workload of each station can be seen from the overall timeline. The completion time of the last workpiece shows whether the order could be completed within the appointed time.
As shown in Fig. 11, the bar chart of the total operation time and average operation time of each station can be viewed on the operation time interface. In view of the average operation time, the completion time of each station is far apart, with a minimum of 54.76 s (Station QK080-1) and a maximum of 177.01 s (Station QK020). That is, the average operation time of stations in the current assembly line is very unbalanced. The efficiency of the assembly line needs to be improved. In addition, there are six stations, whose average operation time is longer than the expected cycle time (120 s). It indicates that the division of the current station or process needs to be optimized.
Fig. 12 shows the station load information in the simulation results, including load rate and delay rate, which are calculated according to Eqs. (1) and (2), respectively. As shown in Fig. 12, the load of stations in the current assembly line is also unbalanced, the minimum is 26.04%, while the maximum is 81.10%. It also shows that the current division of the station or the division of the process is not reasonable.
where i represents the subscript of the station and WT, DT, IT represent the actual operation time, the delay time due to material delay or equipment failure and idle time (waiting time due to blocking) respectively. WP represents the set of all workpieces.
Line balance rate (BR) and load smoothness index (SI) can also be seen from the proposed system, as shown in Fig. 13. They are calculated according to Eqs. (3) and (4), respectively. SI is used to measure whether the workload of each station is balanced on an assembly line. A smaller SI means that the production would be more stable and the workload among stations would be more balanced. Currently, the balance rate of the assembly line is only 69.27%, and the smoothness index of the load is 66.48, which shows that there are extremely unreasonable problems in the division or resource allocation of the assembly line.
Eventually, from the results of the simulation model, the main reasons for the bottleneck on the assembly line are summarized as follows:
(1) Worker allocation is unreasonable
The completion time of stations QK020, QK080-1, and QK090 is longer than the cycle time. If only one worker is allocated to these stations, it is bound to become a bottleneck. In addition, the skilled worker should be arranged to the process requiring a high degree of proficiency and long execution time.
(2) The division of working procedure is unreasonable
The divisible working procedure with a long operation time should be split, and part of the task should be assigned to workers with less load. It could avoid unnecessary bottlenecks and balance the load of workers. For example, the working procedure of tightening the front case nut on QK090 includes 24 fine nuts and 1 coarse nut, which takes much longer time than the cycle time.
(3) The division of workstations is unreasonable
The completion time of stations QK050, QK070, and QK080-2 is far below the cycle time, and QK050 and QK070 are automatic stations, which cannot be adjusted directly. It would inevitably become low-load stations, seriously reducing the balance rate of the assembly line.
5 Simulation Model Operation and Analysis with Improvement Strategies
(1) Adjustment of workstation division
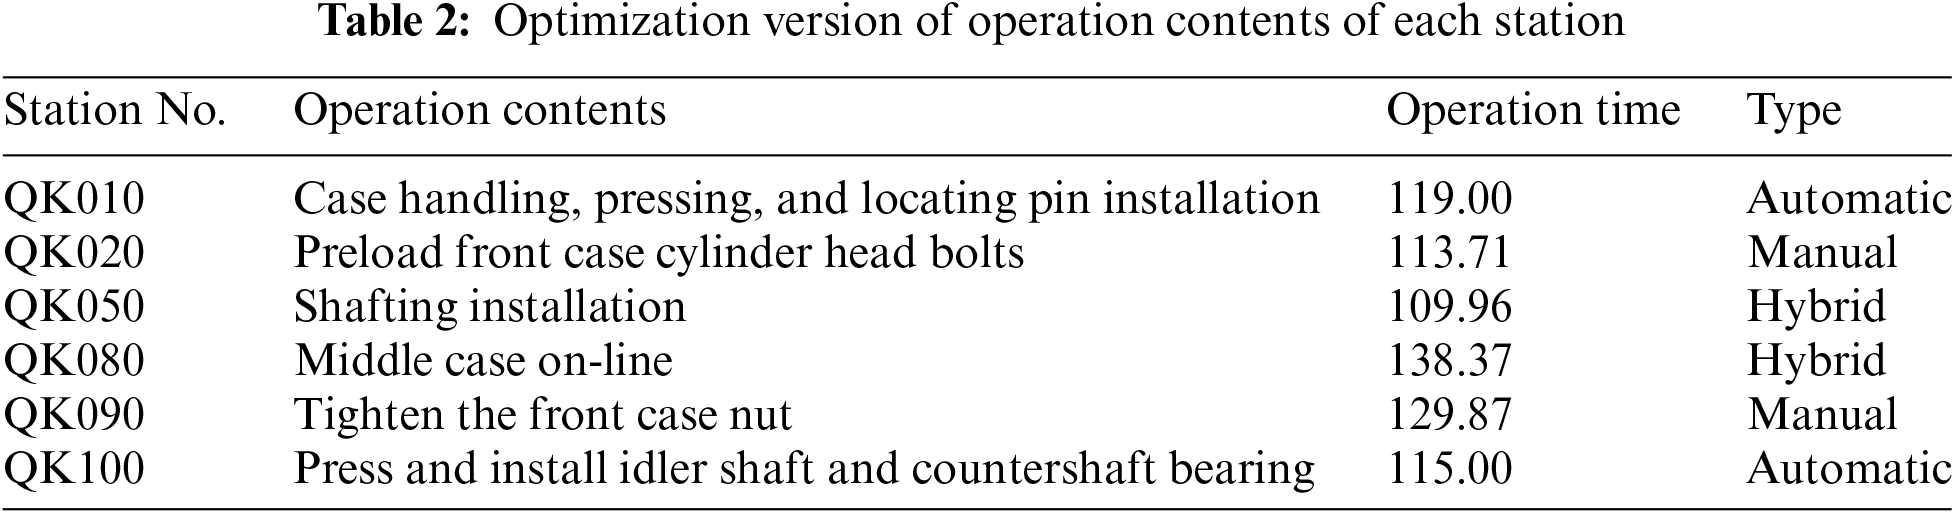
Stations are divided according to the investigation and analysis of the process. Automatic stations Qk010-1 and QK010-2 could work in parallel so that they could be combined into QK010. The operation tasks of QK020 and QK030 stations are the same and they can work in parallel, therefore, combine them as station QK020. The operation tasks of QK050, QK060, and QK070 all belong to the shafting installation; therefore, they are combined into one station QK050. The work tasks of stations QK080-1 and QK080-2 are to complete the middle case online, which could be combined into station QK080. After the above operations, the operation contents of each station are exhibited in Table 2.
(2) Adjustment of worker allocation
As can be seen from Table 2, stations QK020 and QK090 are still bottleneck stations after adjustment of work station division, whose operation time exceeds cycle time. Considering those two stations can be operated by multiple workers, the number of workers in stations QK020 and QK090 is adjusted to 2 and 4, respectively. The new data is updated in the simulation model, and the new simulation cycle time is 155 s.
(3) Working procedure optimization
The work tasks of station QK080 include four main working steps, the first is the pre-installation of the idler component, the second is the lifting of the middle case, the third is the twisting of nuts on the side, the fourth is the pressing of the middle case. Pre-installation of the idler component is closely related to the idler assembly in the part assembly line; therefore, it can be moved to the part assembly line to ensure it can be pre-installed in advance. The lifting and pressing of the middle case are operated by automatic equipment, therefore their operation time cannot be changed. The nuts on the side are not easy to operate and the time fluctuates greatly. Its operation time is effectively reduced by improving the design of the tooling, eventually. In addition, logistics optimization can also be carried out to ensure the timely replenishment of case materials. Finally, after the above optimization, the average operation time of station QK080 can be reduced from about 155 to about 140 s.
5.2 Simulation Result and Analysis
The new simulation results of the time sequence diagram, completion time of stations, station load, and line balance rate under the new data are shown in Figs. 14–17. Comparison of results between the operation schemes of the assembly line before and after the improvement in terms of key assembly line performance evaluation indicators (cycle time (CT), line balancing rate (BR), smoothness index (SI)) is shown in Table 3.
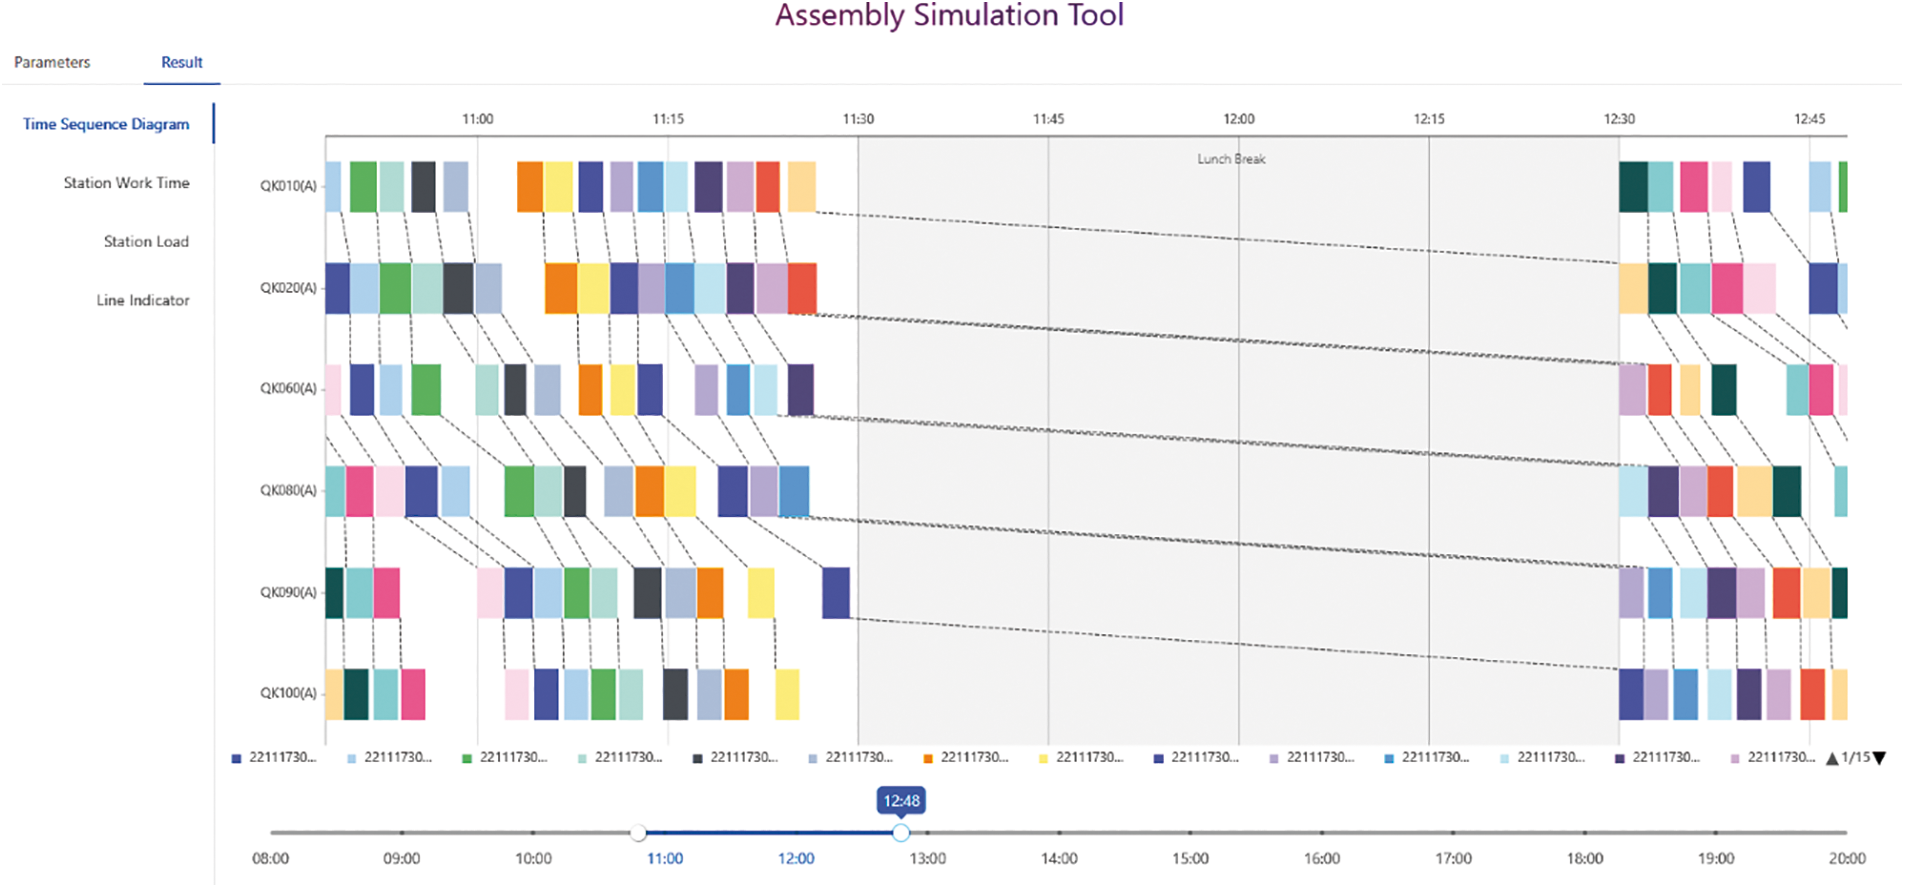
Figure 14: Simulation result under improvement strategies—time sequence diagram
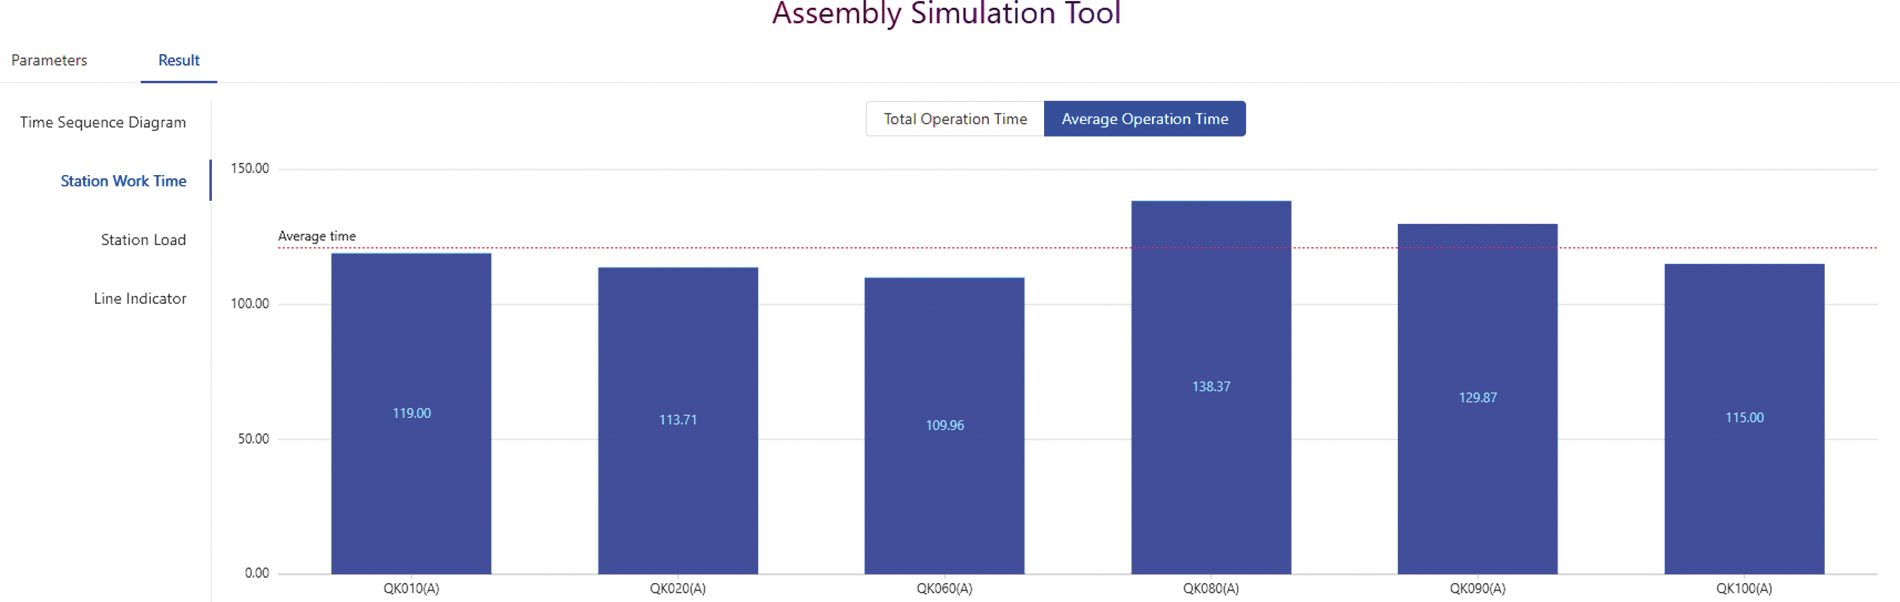
Figure 15: Simulation result under improvement strategies—average operation time of stations
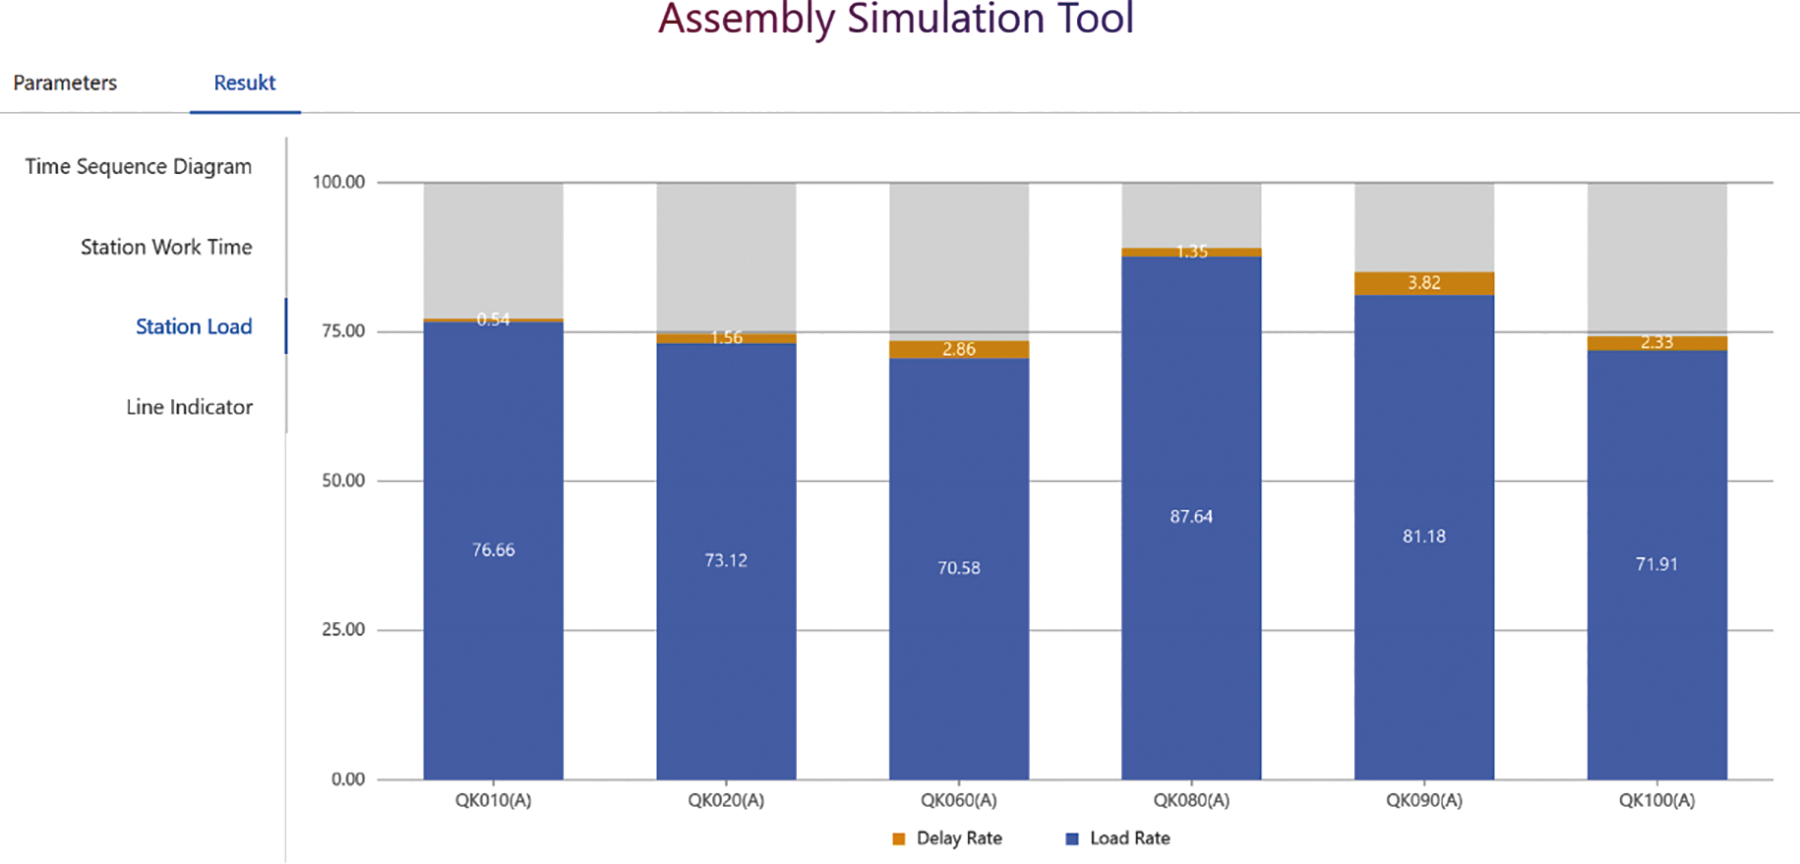
Figure 16: Simulation result under improvement strategies—load of stations
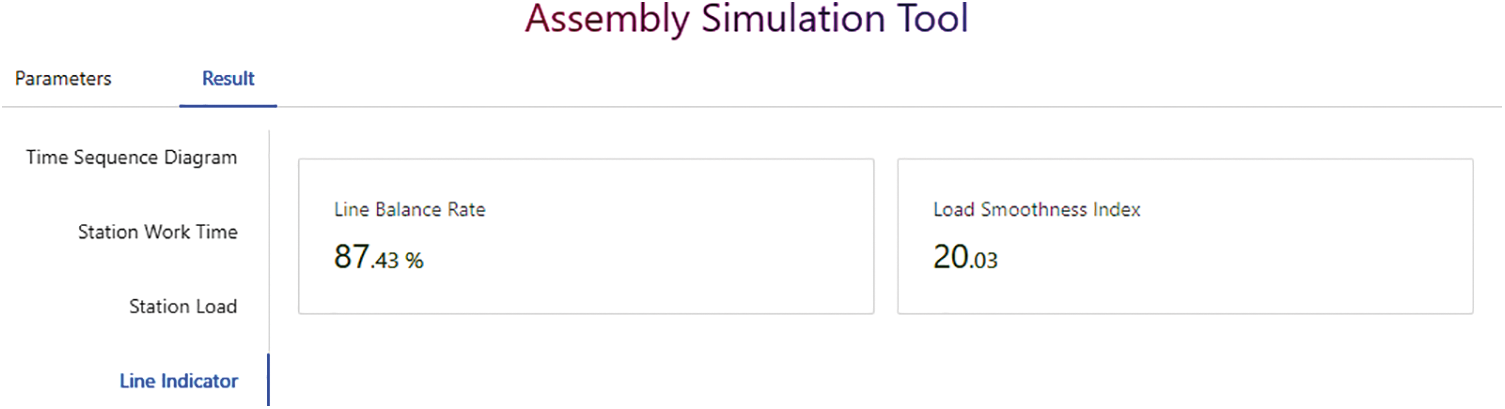
Figure 17: Simulation result under improvement strategies—line balance rate
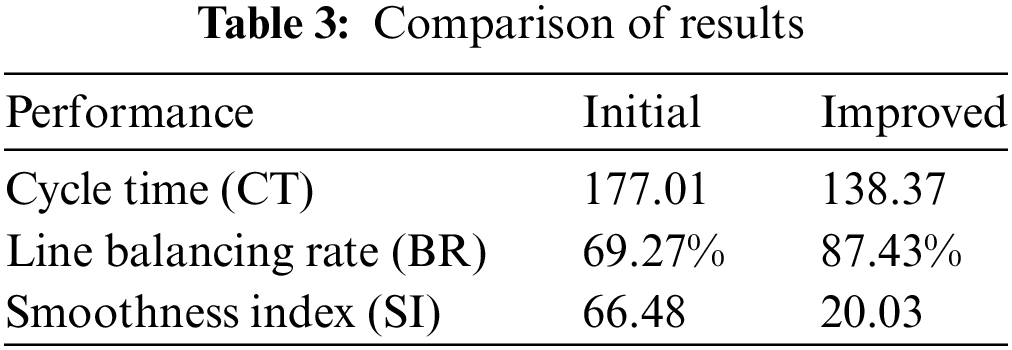
As can be seen, (1) The completion time of stations and station load is much more balanced than before, which verified the effectiveness of the improvement strategies proposed through long-term simulation based on the DT model. (2) Balance rate of the assembly line is increased by 26.21% (from 69.27% to 87.43%), while the smoothness index of the load is decreased by 69.87% (from 66.48 to 20.03). It not only meets the preset target of 85%, but also verifies that the current station layout of the assembly line is relatively reasonable than before. (3) Cycle time is decreased by 21.83% (from 177.01 to 138.37 s), which demonstrates the effectiveness of the improvement strategies again. However, the cycle time did not meet its expectations under the existing conditions. It shows that further optimization of the cycle time requires the assembly line reconstruction and/or the upgrading of the equipment and/or tooling. In addition, the QK090 station is relatively crowded when arranging 4 workers at the same time, so it is suggested to split into two workstations on the premise of space permitting in the future.
In this article, an experimental digital twin modeling method for the transmission front and middle case assembly line was provided and the related digital twin model was established to realize the virtual mapping of the physical assembly line and the whole cycle data management of assembly. In addition, the operation of the assembly line was analyzed and the bottleneck stations of the assembly line were captured through simulation. Then, the improvement strategies were proposed and verified based on re-simulation. The results indicate that improvement strategies can effectively optimize the cycle time, and balance rate of the assembly line and improve productivity to some extent. However, further optimization of the cycle time requires much more improvement measures, such as the reconstruction of the assembly line, the upgrading of the equipment and/or tooling, and so on. These will be the focus of our future work.
Acknowledgement: The authors are grateful to the anonymous reviewers whose valuable comments and suggestions helped a lot to improve this paper and to the editors for their kind and sincere support.
Funding Statement: This research is supported by China National Heavy Duty Truck Group Co., Ltd. (Grant No. YF03221048P), the Shanghai Municipal Bureau of Market Supervision and Administration (Grant No. 2022-35), New Young Teachers Research Start-Up Foundation of Shanghai Jiao Tong University (Grant No. 22X010503668).
Author Contributions: The authors confirm contribution to the paper as follows: study conception and design: X. Cao, M. Yao; data collection: Y. Zhang, X. Hu, C. Wu; analysis and interpretation of results: C. Wu, X. Hu; draft manuscript preparation: X. Cao, M. Yao, Y. Zhang. All authors reviewed the results and approved the final version of the manuscript.
Availability of Data and Materials: The data presented in this study are available on request from the corresponding author.
Ethics Approval: Not applicable.
Conflicts of Interest: The authors declare that they have no conflicts of interest to report regarding the present study.
References
1. Zhang, Y., Hu, X., Wu, C. (2020). Improved imperialist competitive algorithms for rebalancing multi objective two-sided assembly lines with space and resource constraints. International Journal of Production Research, 58(12), 3589–3617. https://doi.org/10.1080/00207543.2019.1633023 [Google Scholar] [CrossRef]
2. Zhang, Y., Hu, X., Wu, C. (2018). A modified multi-objective genetic algorithm for two-sided assembly line re-balancing problem of a shovel loader. International Journal of Production Research, 56(9), 3043–3063. https://doi.org/10.1080/00207543.2017.1402136 [Google Scholar] [CrossRef]
3. Zhang, Y. (2020). Research on multi-objective double-sided assembly line rebalancing under multi-constraint conditions (Ph.D. Thesis). Shanghai Jiao Tong University, China. [Google Scholar]
4. Bongomin, O., Mwasiagi, J. I., Nganyi, E. O., Nibikora, I. (2020). A complex garment assembly line balancing using simulation-based optimization. Engineering Reports, 2(11), e12258. https://doi.org/10.1002/eng2.12258 [Google Scholar] [CrossRef]
5. Trigueiro de Sousa Junior, W., Barra Montevechi, J. A., de Carvalho Miranda, R., Teberga Campos, A. (2019). Discrete simulation-based optimization methods for industrial engineering problems: A systematic literature review. Computers and Industrial Engineering, 128, 526–540. https://doi.org/10.1016/j.cie.2018.12.073 [Google Scholar] [CrossRef]
6. Dang, Q. V., Pham, K. (2016). Design of a footwear assembly line using simulation-based ALNS. Procedia CIRP, 40, 596–601. https://doi.org/10.1016/j.procir.2016.01.140 [Google Scholar] [CrossRef]
7. Alvandi, S., Li, W., Kara, S. (2017). An integrated simulation optimisation decision support tool for multi-product production systems. Modern Applied Science, 11(6), 56–71. https://doi.org/10.5539/mas.v11n6p56 [Google Scholar] [CrossRef]
8. Cao, J., Zhao, P., Liu, G. (2022). Optimizing the production process of modular construction using an assembly line-integrated supermarket. Automation in Construction, 142, 104495. https://doi.org/10.1016/j.autcon.2022.104495 [Google Scholar] [CrossRef]
9. Wen, L., Li, X., Gao, L. (2021). A new reinforcement learning based learning rate scheduler for convolutional neural network in fault classification. IEEE Transactions on Industrial Electronics, 68(12), 12890–12900. https://doi.org/10.1109/TIE.2020.3044808 [Google Scholar] [CrossRef]
10. Wang, B., Wen, L., Li, X., Gao, L. (2023). Adaptive class center generalization network: A sparse domain-regressive framework for bearing fault diagnosis under unknown working conditions. IEEE Transactions on Instrumentation and Measurement, 72, 1–11. https://doi.org/10.1109/TIM.2023.3273659 [Google Scholar] [CrossRef]
11. Zhang, J., Liu, J., Zhuang, C., Guo, H., Ma, H. (2023). A data-driven smart management and control framework for a digital twin shop floor with multi-variety multi-batch production. International Journal of Advanced Manufacturing Technology. https://doi.org/10.1007/s00170-023-10815-5 [Google Scholar] [CrossRef]
12. Dallaora, N., Alamin, K., Fraccaroli, E., Poncino, M., Quaglia, D. et al. (2022). Digital transformation of a production line: Network design, online data collection and energy monitoring. IEEE Transactions on Emerging Topics in Computing, 10(1), 46–59. https://doi.org/10.1109/TETC.2021.3132432 [Google Scholar] [CrossRef]
13. Gokalp, E., Martinez, V. (2022). Digital transformation maturity assessment: Development of the digital transformation capability maturity model. International Journal of Production Research, 60(20), 6282–6302. https://doi.org/10.1080/00207543.2021.1991020 [Google Scholar] [CrossRef]
14. Tao, F., Qi, Q., Wang, L., Nee, A. (2019). Digital twins and cyber-physical systems toward smart manufacturing and Industry 4.0: Correlation and comparison. Engineering, 5(4), 653–661. https://doi.org/10.1016/j.eng.2019.01.014 [Google Scholar] [CrossRef]
15. Zhang, H., Qi, Q., Tao, F. (2022). A multi-scale modeling method for digital twin shop-floor. Journal of Manufacturing Systems, 62, 417–428. https://doi.org/10.1016/j.jmsy.2021.12.011 [Google Scholar] [CrossRef]
16. Zhang, Q., Zheng, S., Yu, C., Wang, Q., Ke, Y. (2022). Digital thread-based modeling of digital twin framework for the aircraft assembly system. Journal of Manufacturing Systems, 65, 406–420. https://doi.org/10.1016/j.jmsy.2022.10.004 [Google Scholar] [CrossRef]
17. Xiong, M., Wang, H. (2022). Digital twin applications in aviation industry: A review. International Journal of Advanced Manufacturing Technology, 121(9–10), 5677–5692. https://doi.org/10.1007/s00170-022-09717-9 [Google Scholar] [CrossRef]
18. Kumar, P., Prasad, S. B., Patel, D., Kumar, K., Dixit, S. et al. (2023). Optimization of cycle time assembly line for mass manufacturing. International Journal on Interactive Design and Manufacturing. https://doi.org/10.1007/s12008-023-01343-3 [Google Scholar] [CrossRef]
19. Shafto, M., Conroy, M., Doyle, R., Glaessgen, E., Kemp, C. et al. (2010). Draft modeling, simulation, information technology & processing roadmap. USA: National Aeronautics and Space Administration. [Google Scholar]
20. Grieves, M. W. (2005). Product lifecycle management: The new paradigm for enterprises. International Journal of Product Development, 2(1–2), 71–84. https://doi.org/10.1504/IJPD.2005.006669 [Google Scholar] [CrossRef]
21. van Beek, A., Nevile Karkaria, V., Chen, W. (2023). Digital twins for the designs of systems: A perspective. Structural and Multidisciplinary Optimization, 66(3), 49. https://doi.org/10.1007/s00158-023-03488-x [Google Scholar] [CrossRef]
22. Griever, M. (2011). Virtually perfect: Driving innovative and lean products through product lifecycle management. Cocoa Beach, USA: Space Coast Press. [Google Scholar]
23. Schroeder, G. N., Steinmetz, C., Rodrigues, R. N., Henriques, R. V. B., Rettberg, A. et al. (2021). A methodology for digital twin modeling and deployment for Industry 4.0. Proceedings of the IEEE, 109(4), 556–567. https://doi.org/10.1109/JPROC.2020.3032444 [Google Scholar] [CrossRef]
24. Iglesias, D., Bunting, P., Esquembri, S., Hollocombe, J., Silburn, S. et al. (2017). Digital twin applications for the JET divertor. Fusion Engineering and Design, (125), 71–76. https://doi.org/10.1016/j.fusengdes.2017.10.012 [Google Scholar] [CrossRef]
25. Tao, F., Liu, W., Liu, J., Liu, X., Liu, Q. et al. (2018). Digital twin and its potential application exploration. Computer Integrated Manufacturing Systems, 24(1), 1–18. https://doi.org/10.13196/j.cims.2018.01.001 [Google Scholar] [CrossRef]
26. Rosen, R., von Wichert, G., Lo, G., Bettenhausen, K. D. (2015). About the importance of autonomy and digital twins for the future of manufacturing. IFAC-Papers OnLine, 48(3), 567–572. https://doi.org/10.1016/j.ifacol.2015.06.141 [Google Scholar] [CrossRef]
27. Liu, Q., Zhang, H., Leng, J., Chen, X. (2019). Digital twin-driven rapid individualised designing of automated flow-shop manufacturing system. International Journal of Production Research, 57(12), 3903–3919. https://doi.org/10.1080/00207543.2018.1471243 [Google Scholar] [CrossRef]
28. Wang, H., Li, H., Wen, X., Luo, G. (2021). Unified modeling for digital twin of a knowledge-based system design. Robotics and Computer-Integrated Manufacturing, 68, 102074. https://doi.org/10.1016/j.rcim.2020.102074 [Google Scholar] [CrossRef]
29. Zhuang, C., Liu, J., Xiong, H. (2018). Digital twin-based smart production management and control framework for the complex product assembly shop-floor. International Journal of Advanced Manufacturing Technology, 96(1–4), 1149–1163. https://doi.org/10.1007/s00170-018-1617-6 [Google Scholar] [CrossRef]
30. Ding, K., Chan, F. T. S., Zhang, X., Zhou, G., Zhang, F. (2019). Defining a digital twin-based cyber-physical production system for autonomous manufacturing in smart shop floors. International Journal of Production Research, 57(20), 6315–6334. https://doi.org/10.1080/00207543.2019.1566661 [Google Scholar] [CrossRef]
31. Gehrmann, C., Gunnarsson, M. (2020). A digital twin based industrial automation and control system security architecture. IEEE Transactions on Industrial Informatics, 16(1), 669–680. https://doi.org/10.1109/TII.2019.2938885 [Google Scholar] [CrossRef]
32. Zhang, M., Tao, F., Nee, A. Y. C. (2021). Digital twin enhanced dynamic job-shop scheduling. Journal of Manufacturing Systems, 58, 146–156. https://doi.org/10.1016/j.jmsy.2020.04.008 [Google Scholar] [CrossRef]
33. Yang, W., Zheng, Y., Li, S. (2022). Digital twin of spacecraft assembly cell and case study. International Journal of Computer Integrated Manufacturing, 35(3), 263–281. https://doi.org/10.1080/0951192X.2021.1992657 [Google Scholar] [CrossRef]
34. Zhang, H., Qi, Q., Tao, F. (2022). A consistency evaluation method for digital twin models. Journal of Manufacturing Systems, 65, 158–168. https://doi.org/10.1016/j.jmsy.2022.09.006 [Google Scholar] [CrossRef]
35. Zhang, D., Leng, J., Xie, M., Yan, H., Liu, Q. (2022). Digital twin enabled optimal reconfiguration of the semi-automatic electronic assembly line with frequent changeovers. Robotics and Computer-Integrated Manufacturing, 77, 102343. https://doi.org/10.1016/j.rcim.2022.102343 [Google Scholar] [CrossRef]
36. Zhu, Q., Huang, S., Wang, G., Moghaddam, S. K., Lu, Y. et al. (2022). Dynamic reconfiguration optimization of intelligent manufacturing system with human-robot collaboration based on digital twin. Journal of Manufacturing Systems, 65, 330–338. https://doi.org/10.1016/j.jmsy.2022.09.021 [Google Scholar] [CrossRef]
37. Sjöberg, A., Önnheim, M., Frost, O., Cronrath, C., Gustavsson, E. et al. (2023). Online geometry assurance in individualized production by feedback control and model calibration of digital twins. Journal of Manufacturing Systems, 66, 71–81. https://doi.org/10.1016/j.jmsy.2022.11.011 [Google Scholar] [CrossRef]
38. Luo, W. C., Hu, T. L., Ye, Y. X., Zhang, C. R., Wei, Y. L. (2020). A hybrid predictive maintenance approach for CNC machine tool driven by digital twin. Robotics and Computer-Integrated Manufacturing, 65, 101974. https://doi.org/10.1016/j.rcim.2020.101974 [Google Scholar] [CrossRef]
39. Leng, J., Chen, Z., Sha, W., Lin, Z., Lin, J. et al. (2022). Digital twins-based flexible operating of open architecture production line for individualized manufacturing. Advanced Engineering Informatics, 53, 101676. https://doi.org/10.1016/j.aei.2022.101676 [Google Scholar] [CrossRef]
40. Li, H., Yan, X., Zhang, Y., Liu, G., Zhai, Z. et al. (2023). Real-time detection method for welding parts completeness based on improved YOLOX in a digital twin environment. Measurement Science and Technology, 34(5), 055004. https://doi.org/10.1088/1361-6501/acb0ee [Google Scholar] [CrossRef]
Cite This Article
 Copyright © 2024 The Author(s). Published by Tech Science Press.
This work is licensed under a Creative Commons Attribution 4.0 International License , which permits unrestricted use, distribution, and reproduction in any medium, provided the original work is properly cited.
 Downloads
 Citation Tools