
 Submit a Paper
 Propose a Special lssue
 Open Access
ARTICLE

Prediction of Ground Vibration Induced by Rock Blasting Based on Optimized Support Vector Regression Models
1 Faculty of Engineering, China University of Geosciences, Wuhan, 430074, China
2 Institute of Geological Survey, China University of Geosciences, Wuhan, 430074, China
* Corresponding Author: Xuedong Luo. Email:
(This article belongs to the Special Issue: Bio-inspired Optimization in Engineering and Sciences)
Computer Modeling in Engineering & Sciences 2024, 139(3), 3147-3165. https://doi.org/10.32604/cmes.2024.045947
Received 12 September 2023; Accepted 21 December 2023; Issue published 11 March 2024
 View Full Text
 Download PDF
Abstract
Accurately estimating blasting vibration during rock blasting is the foundation of blasting vibration management. In this study, Tuna Swarm Optimization (TSO), Whale Optimization Algorithm (WOA), and Cuckoo Search (CS) were used to optimize two hyperparameters in support vector regression (SVR). Based on these methods, three hybrid models to predict peak particle velocity (PPV) for bench blasting were developed. Eighty-eight samples were collected to establish the PPV database, eight initial blasting parameters were chosen as input parameters for the prediction model, and the PPV was the output parameter. As predictive performance evaluation indicators, the coefficient of determination (R2), root mean square error (RMSE), mean absolute error (MAE), and a10-index were selected. The normalized mutual information value is then used to evaluate the impact of various input parameters on the PPV prediction outcomes. According to the research findings, TSO, WOA, and CS can all enhance the predictive performance of the SVR model. The TSO-SVR model provides the most accurate predictions. The performances of the optimized hybrid SVR models are superior to the unoptimized traditional prediction model. The maximum charge per delay impacts the PPV prediction value the most.Keywords
Controlling blast-induced ground vibrations is a crucial issue in geological and mining engineering. When an explosive is detonated in a blast hole, an enormous quantity of energy is instantly released. However, only about 20%–30% of the energy is used for granite fragmentation. The rest of the energy is wasted, producing disturbances such as blast vibration, air shock waves, flying rocks, noise, and other harmful effects [1–3]. Among them, blast vibration can induce a series of secondary hazards, such as slope instability and structure damage [4], which is considered the most harmful effect of rock blasting. Therefore, there is a need for accurate prediction of blast vibration in rock engineering and mining [5].
Blast peak particle velocity, as an essential indicator to describe the level of blast vibration, is mainly influenced by various factors such as the blasting process, amount of charge, dosage, and ground conditions. Chen et al. [6], through theoretical analysis of long-column charge blasting, found that charge length and blast velocity only contribute to blast vibration velocity within a specific range, while the longer the charge embedment length, the greater the blast vibration velocity at the same ground surface. At the same time, the detonation method also affects the blast vibration speed. Kan et al. [7] studied the factors affecting the peak particle velocity (PPV) of blast-induced vibration through engineering tests and numerical simulations of underground roof pre-cracking blasting, and the results showed that explosive unit consumption, maximum single-section charge, blast center distance, and elevation distance all have a significant effect on PPV. Previous studies found that the factors affecting blast vibration speed are numerous and complex, and it is essential to predict it accurately.
The empirical formula of blast velocity prediction is usually based on many years of practical experience and a large amount of test data, which is a simple and practical engineering calculation method. The traditional Sadovsky empirical formula has high generality but needs better prediction accuracy in different practical blasting projects. Khandelwal et al. [8] proposed a new blast vibration velocity prediction equation based on the magnitude analysis. They verified the reliability of the equation by comparing the measured values with the predicted values. Himanshu et al. [9] investigated the effect of engineering rock properties on PPV modeling and proposed empirical equations for estimating PPV. Himanshu et al. [9] used a multivariate statistical regression method to develop an equation to predict PPV.
Due to the highly nonlinear relationship between most blasting initial parameters and peak blast vibration velocity, empirical equations are often challenging to make accurate predictions. In recent years, with the development of computer and artificial intelligence technologies, many scholars have introduced advanced machine learning techniques into blasting engineering research [10–12]. Álvarez-Vigil et al. [13] established an artificial neural network model for open pit mine blasting PPV and frequency. They compared the results with multiple regression predictions and found that the correlation coefficients of the method increased by 0.48 and 0.80, respectively. Dindarloo [14] used a support vector machine algorithm to predict PPV at different distances from the blasting face. The results showed the method has high prediction accuracy and fast computational speed. Dzimunya et al. [15] used random forest algorithm to build a model for predicting PPV using four blast parameters as predictor variables, and the results showed that the method has strong potential in predicting blast vibration velocity. Kadingdi et al. [16] based on random forest, Gaussian process, and gradient augmentation machine to build an integrated model for predicting blast vibration velocity with high accuracy by superimposed generalization method, which used seven parameters such as hole depth, load, and spacing as independent variables and collected 196 observed data sets for training, and the prediction performance of the trained model was significantly better than that of the base algorithm, and the prediction accuracy R2 was greatly improved.
The metaheuristic algorithm is an artificial intelligence-based optimization algorithm that solves optimization problems by simulating the evolutionary process in nature, and it is more suitable for dealing with high-dimensional and complex nonlinear problems than traditional algorithms. In recent years, more and more meta-heuristic algorithms combined with machine learning have been proposed for prediction methods [17–21]. Bui et al. [22] combined a swarm-based metaheuristic algorithm-moth flame optimization algorithm with adaptive fuzzy inference neural network to build a model to predict the blasting of open pit mine PPV of the project. They compared the prediction results with those of other intelligent models and found that the model prediction results were more accurate. Cai et al. [23] obtained a model capable of predicting blast vibration velocity using the beetle antenna search algorithm to find the optimal solution and bring it into the Elman neural network model for training. This method prolonged the model running time but significantly improved the model. Nguyen et al. [24] proposed a hybrid model combining artificial neural networks with a Hunger Games Search Optimization algorithm. They applied it to blast vibration prediction, and the results showed that the model is more robust than other benchmark hybrid models. Table 1 shows recent studies on the use of intelligent models to predict PPV.
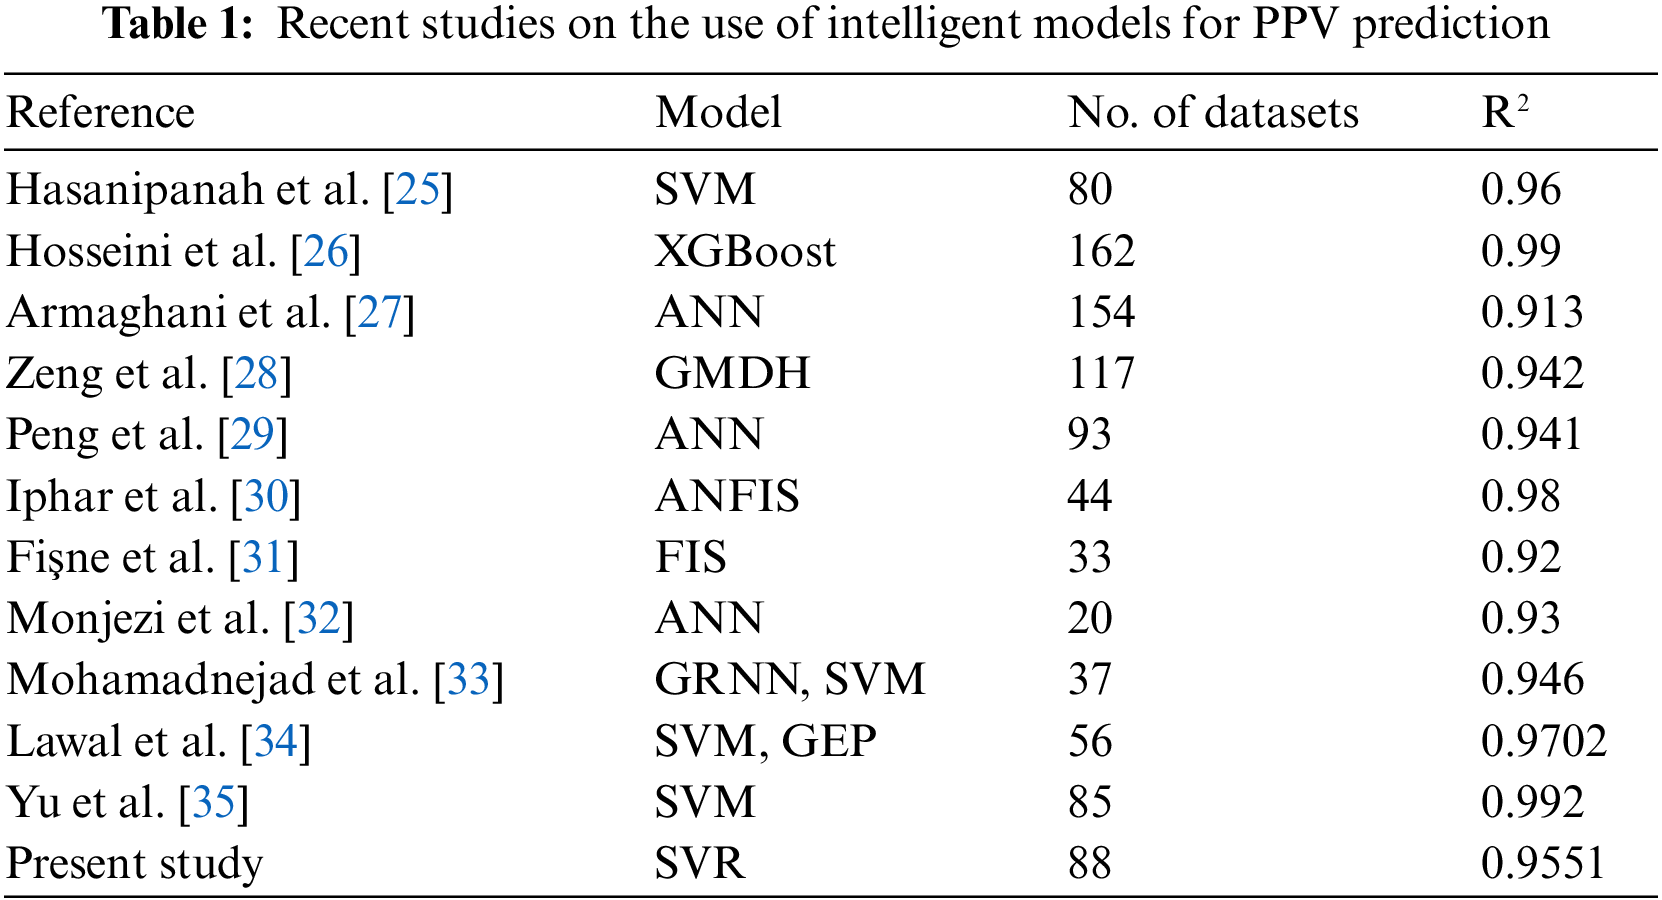
Group Method of Data Handling (GMDH); Support Vector Machine (SVM); eXtreme Gradient Boosting (XGBoost); Generalized Regression Neural Network (GRNN); Gene Expression Programming (GEP); Fuzzy Inference System (FIS); Adaptive Neuro-Fuzzy Inference System (ANFIS); Artificial Neural Network (ANN).
In this paper, eight factors affecting PPV are comprehensively selected as input parameters of the machine learning model, and the Tuna Swarm Optimization (TSO), Cuckoo Search (CS), and Whale Optimization Algorithm (WOA) are selected to optimize the support vector regression model to construct three hybrid optimization models based on the support vector regression method for predicting blast PPV in an engineering context of open-stage blasting. In addition, four indexes are selected to evaluate the prediction performance of the hybrid models and compare the comprehensive prediction performance of different models. Finally, the sensitivity of various input parameters was analyzed using normalized mutual information values, and the study results can serve as a guide for the safety control of step-blasting rock excavation.
Support Vector Regression (SVR) [36] is a machine learning technique based on statistical learning theory. SVR is an important branch of Support Vector Machines (SVM) [37], commonly used in regression analysis and function approximation problems. SVR uses a kernel function to project the data into a high dimensional space and performs regression.
SVR estimates the corresponding mapping by finding the optimal function:
where φ(x) is the regression hyperplane, W is the weighting factor, and e is the intercept.
where C is the penalty factor, ε is the insensitivity coefficient and Rε is the loss function. Regression prediction can be converted to solving quadratic programming problems:
where
SVR utilizes a nonlinear mapping algorithm to map low-dimensional linearly indistinguishable samples into a linearly distinguishable high-dimensional feature space, and the functional expression of SVR is:
where K(xr, xj) is the kernel function, SVR generally has a variety of kernel functions to choose from, considering the prediction accuracy and convergence speed, the kernel function chosen in this paper is the radial basis function, which has a good generalization ability.
Cuckoo Search (CS) algorithm searches for the optimal solution based on the random search step generated by Levi’s flight [38], which has a large randomness and can achieve the purpose of global optimal search. The pseudo code of Cuckoo Search is shown in Table 2.
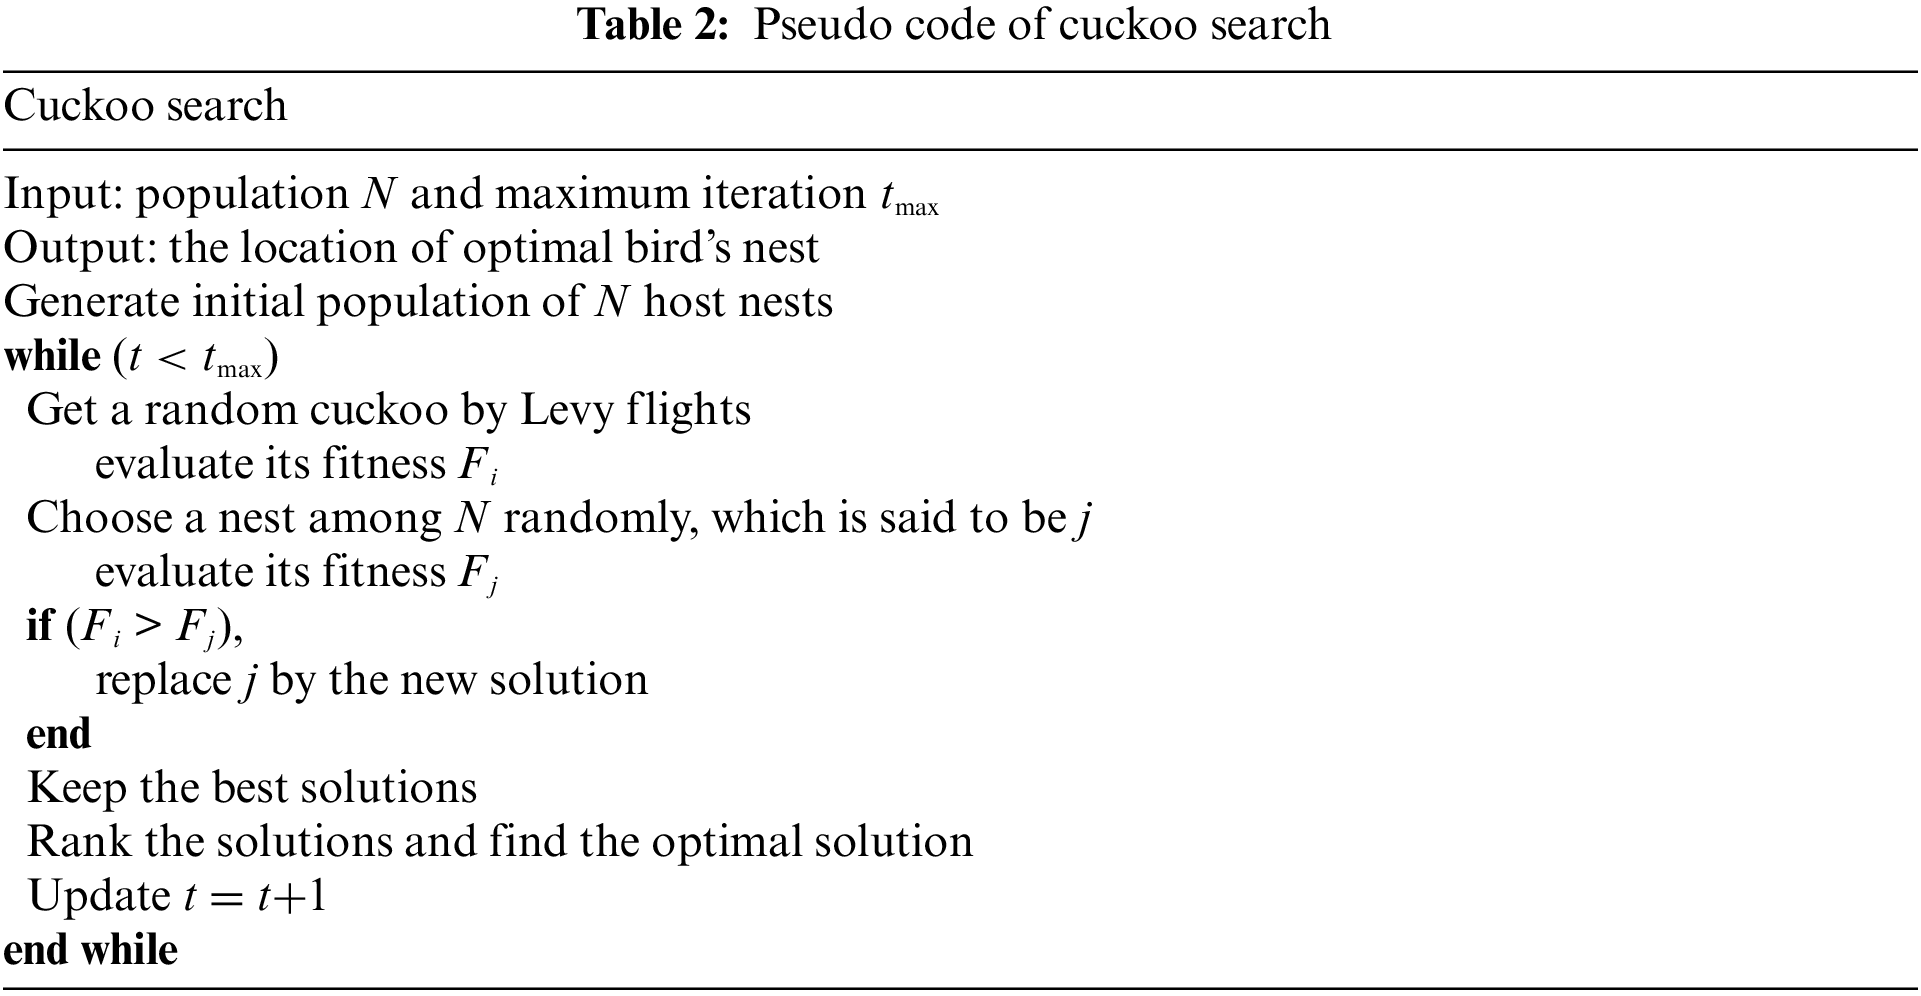
Update the cuckoo’s location and search path:
where n is the number of iterations, m is the bird’s nest position coordinates, µ is the step size adjustment, and L(λ) is the randomly generated value obeying Levy distribution. The randomized step size can be obtained according to the following equation:
where μ0 is a constant and X is the optimal bird’s nest location.
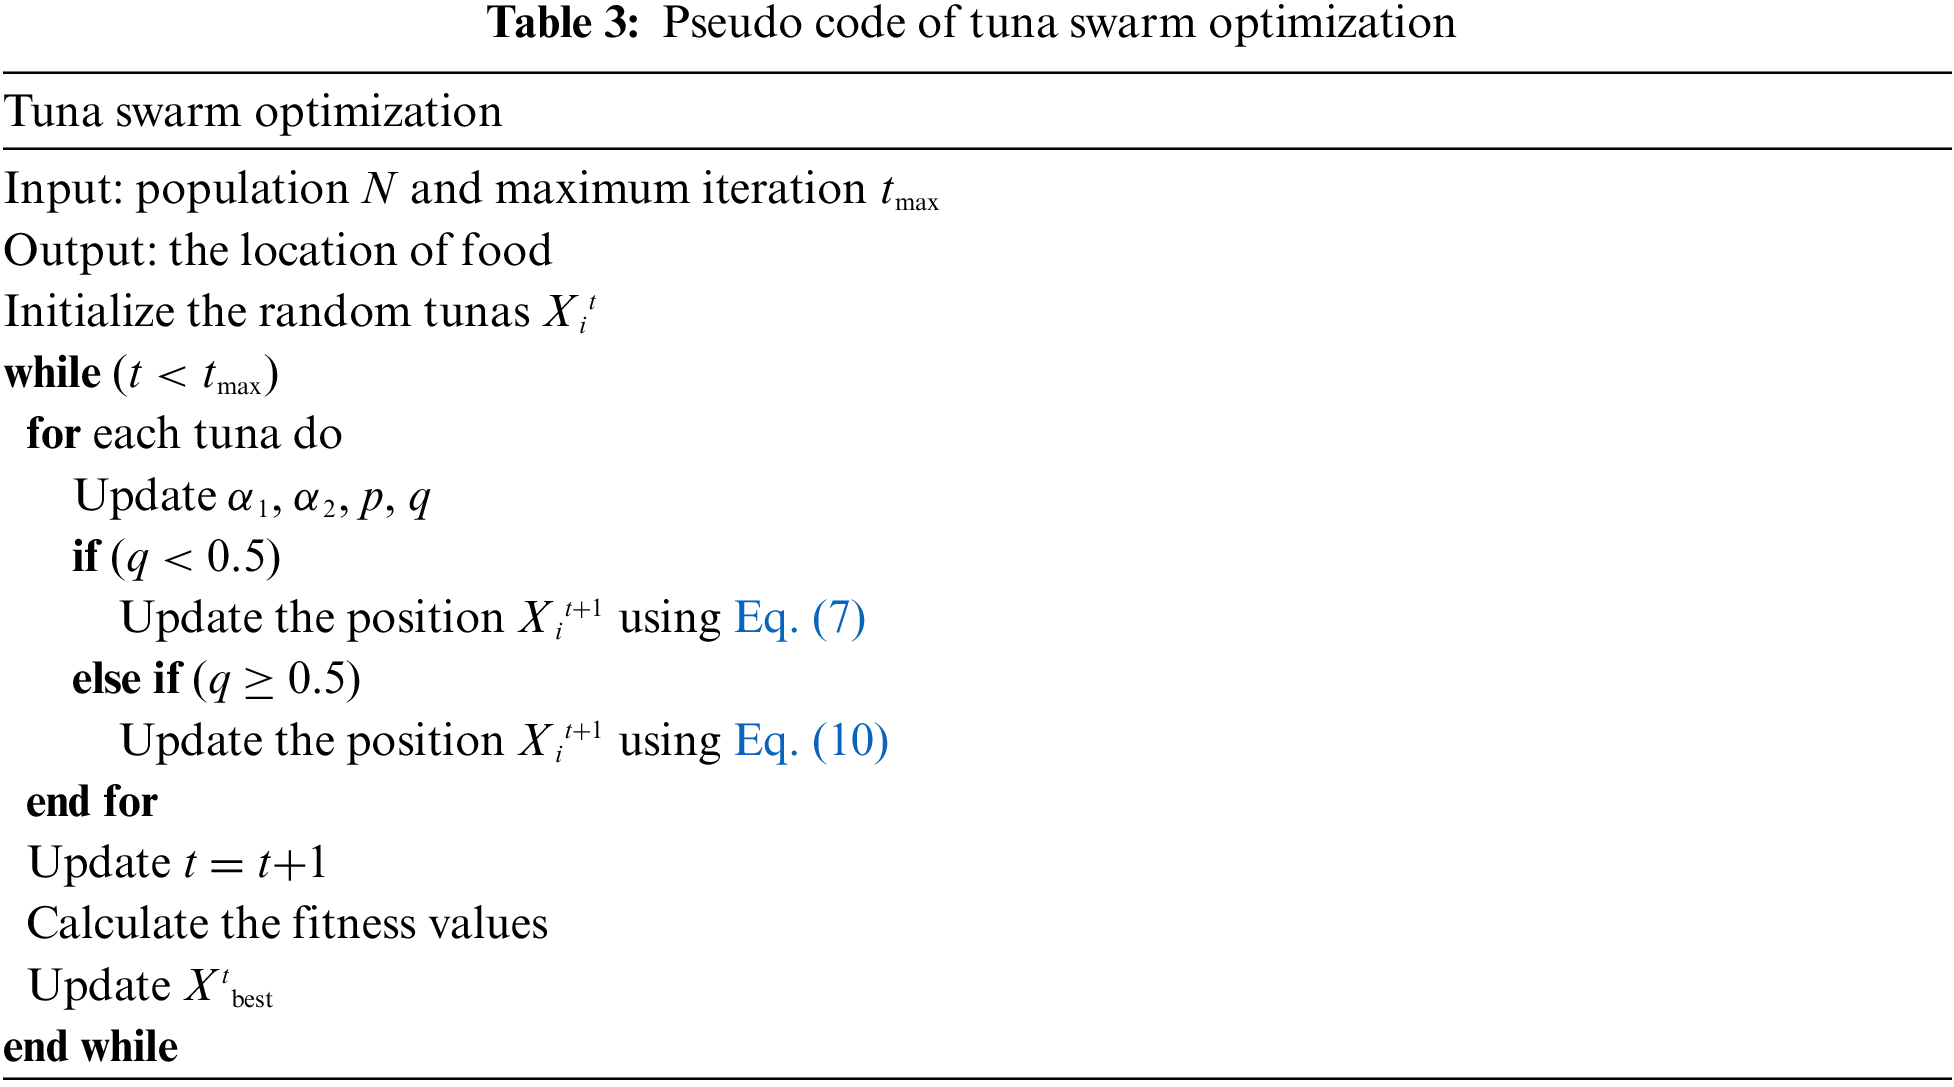
Tuna swarm optimization algorithm is a new intelligent optimization algorithm [39], which simulates two kinds of cooperative foraging behaviors of the tuna population, namely spiral subject to foraging and parabolic foraging. When spiral foraging is executed, the position of the population can be expressed as:
where t is the current iteration number, the population number is N, Xit+1 is the position of the ith individual after the (t+1)th iteration, Xtbest and Xtrand are the current optimal and random individuals, respectively, α1 and α2 are the weight coefficients controlling the tendency of the individual to move towards the optimal and previous individual, and β is the development parameter related to the optimal or random individual. β is the exploitation coefficient associated with the optimal or random individual.
When parabolic foraging is executed, the position of the population can be expressed as:
where TF is a random number between −1 and 1 that determines the direction of population exploitation, p is a crucial covariate that varies adaptively with the number of iterations and influences the extent of population exploitation. The pseudo code of Tuna Swarm Optimization is shown in Table 3.
2.4 Whale Optimization Algorithm
Whale Optimization Algorithm (WOA) is a bionic-based heuristic search algorithm inspired by the hunting behavior of humpback whales. In reference [40], the WOA algorithm assumes that the prey captured by the whale is the optimal solution and the location of the whale is the potential solution. At each iteration, the location update strategy of each whale is determined by the value of the random number m and the mode of the coefficient vector A. As the iteration proceeds, the whale population continuously approaches the optimal solution. The pseudo code of Whale Optimization Algorithm is shown in Table 4.
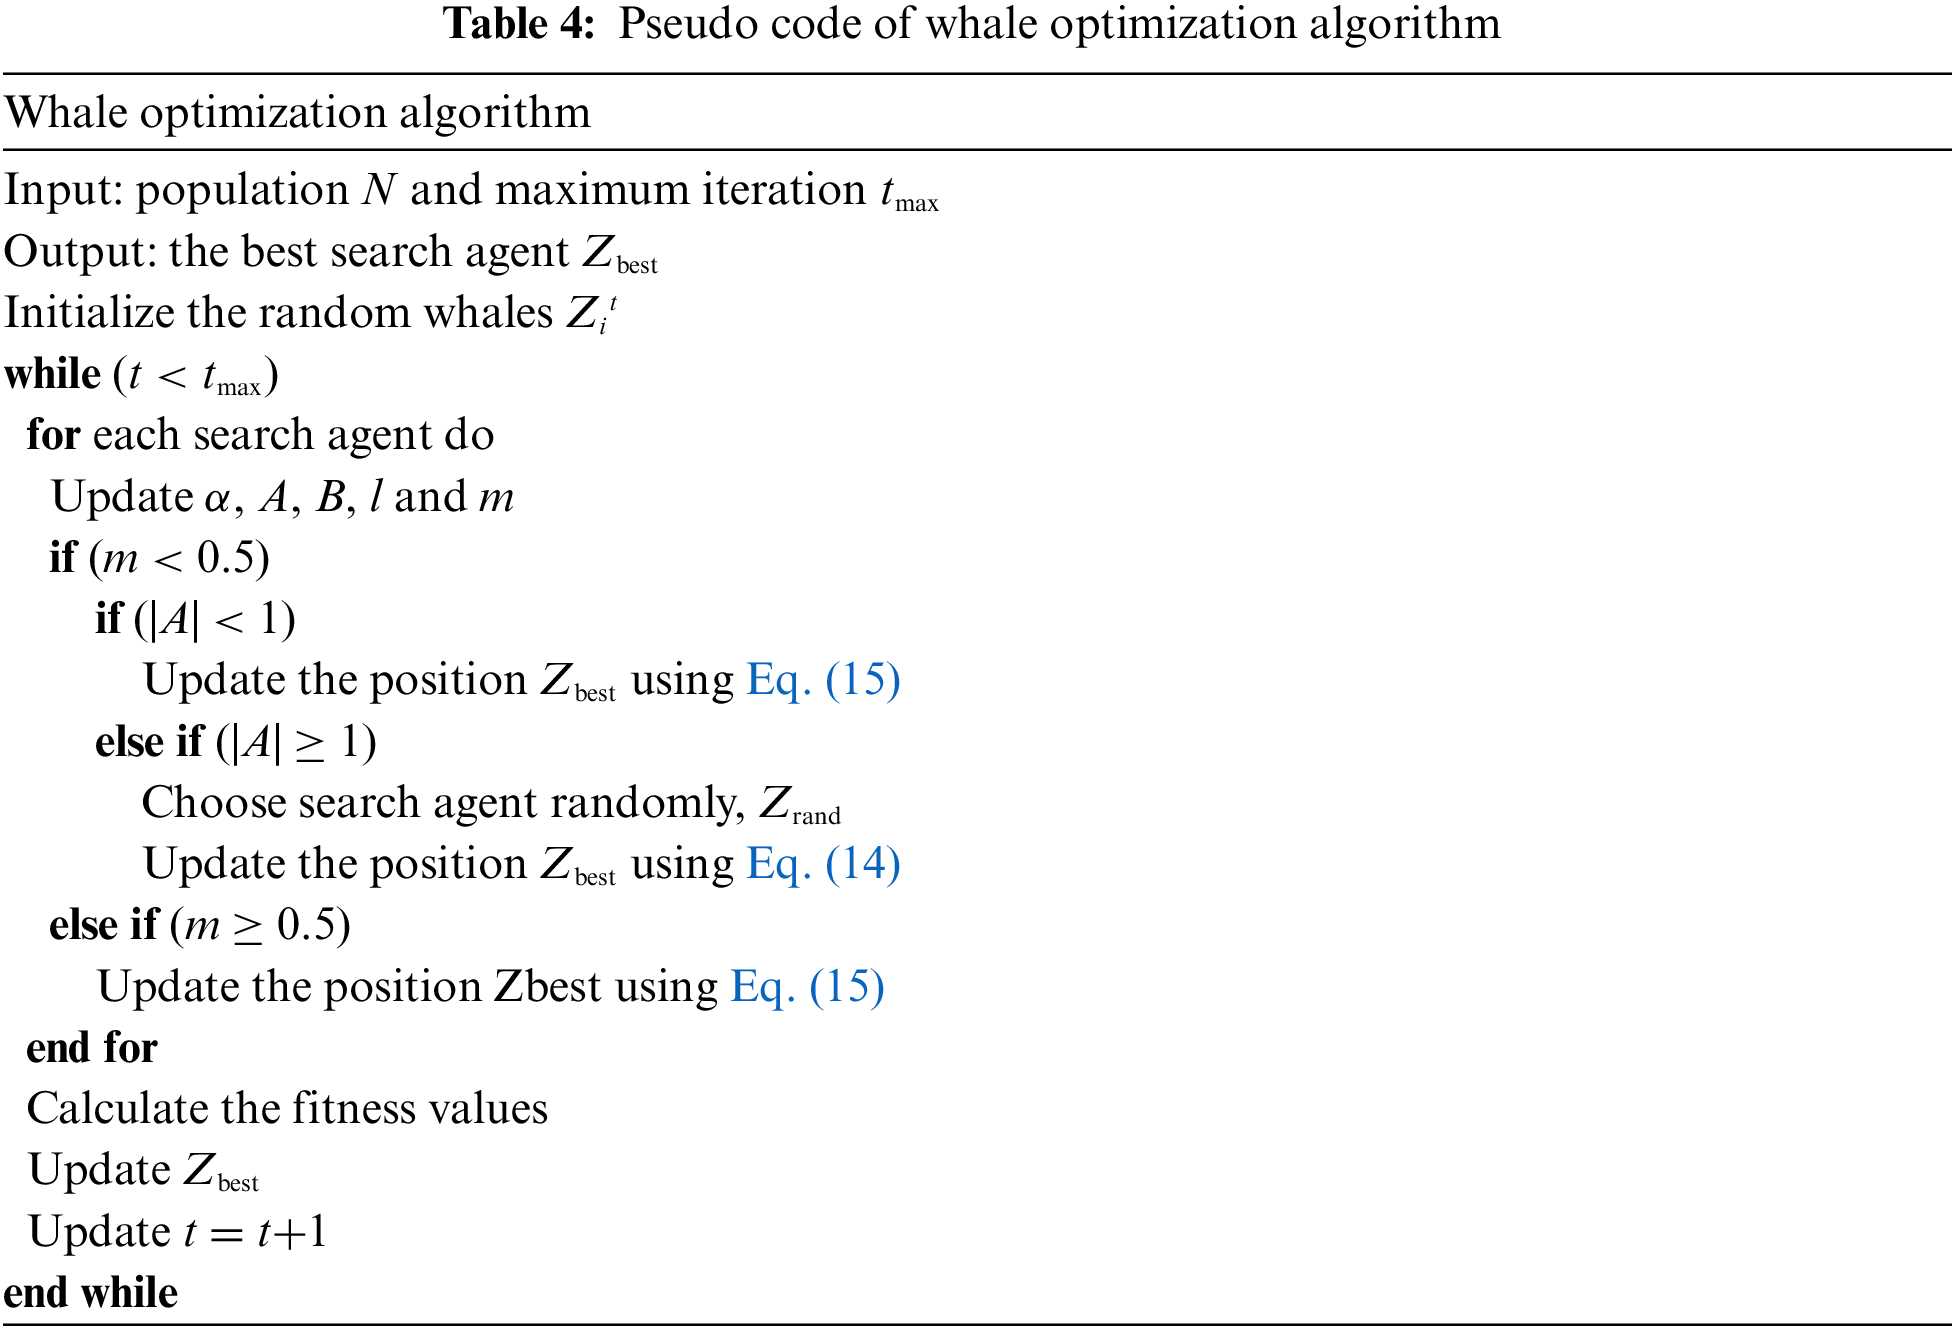
(1) The process of searching for predation is shown in the following equation:
where q decreases linearly between 2 and 0, and r denotes a random number between 0 and 1.
(2) Update position in bracketing mode:
where l ranges from 0 to 1, and b is a constant describing the shape of the spiral.
Cross-validation techniques are necessary to avoid overfitting the training data and enhance the model’s generalization ability. This study introduces the K-fold cross validation technique in the parameter optimization process of the hybrid model. K-fold cross validation, which is to divide the original training set into K subsets equally, use one of the subsets for validation each time, and use the remaining (K-1) subsets as the new training set, and cycle this process K times. The detailed flow of K-fold cross validation is shown in Fig. 1. The root mean square error of all the validation results is averaged to obtain the cross-validation error as shown in the following equation:
Figure 1: K-fold cross validation
3.1 Data Preparation and Description
Eighty-eight sets of blast vibration data were selected from open-air step blasting [41], and the distribution of PPV values ranged from 1.8 to 36.2 mm/s. Each set of data samples included eight input parameters, namely, ratio of spacing to burden (S/B), ratio of bench height to drilled burden (H/B), ratio of burden to hole diameter (B/D), ratio of stemming to burden (T/B), ratio of subdrilling to burden (U/B), powder factor (PF), maximum charge per delay (W), distance from the blasting face (DI). PF is the amount of explosive consumed per cubic meter or tonne of rock. Drilling design of bench blasting is shown in Fig. 2. The PPV is used as the output parameter of the machine learning prediction model. The distribution violin plots of each input variable and output variable, as shown in Fig. 3, show that the data used in this study are widely distributed and more uniformly distributed. In addition, the interrelationships among the parameters are evaluated by Pearson correlation coefficients, as shown in Fig. 4. From Fig. 4, it can be seen that correlations exist between all eight input parameters and PPV. Except for the significant correlation coefficient between PF and B/D, the correlation between each input parameter is small. In the actual blasting process in the field, the PF and B/D are two uncorrelated initial parameters. Therefore, during the training of the machine learning model, the PF and B/D are input to the model as input parameters simultaneously.
Figure 2: Drilling design of bench blasting
Figure 3: Violin plots of blast velocity database
Figure 4: Correlation coefficients matrix of blast velocity database
3.2 SVR-Based Optimization Model
In the kernel function of SVR, the penalty factor and kernel deviation of the radial basis function are the most influential parameters on the prediction effect. In order to achieve better blasting vibration velocity prediction, CS, TSO, and WOA are selected as the three group intelligent optimization algorithms to optimize the penalty factor and radial basis function kernel deviation. Based on prior research, the penalty factor and radial basis function kernel deviation optimization ranges for this work are set to (0.01,100) and (0.01,100), respectively. Randomly selecting 80% of the database’s data as the training set and the remaining 20% as the test set [42]. Since the database contains 88 data sets, 70 data sets were chosen as the training set, and 18 were chosen as the test set for this study. The three hybrid models are independently trained on the same training set, the data from the training set are used to construct the prediction models, and the test set is used to evaluate the constructed hybrid intelligence prediction models. The parameter settings of the three swarm intelligence optimization algorithms CS, TSO, and WOA are shown in Table 5, where six population sizes are set in each hybrid model, and the population size parameter of the meta-heuristic algorithm is adjusted using a 5-fold cross-validation technique. The three hybrid models’ fitness values are plotted against the number of iterations in Fig. 5. The model with the fastest convergence speed and lowest fitness value is the TSO-SVR model. Fig. 6 depicts the overall implementation process based on the SVR model by CS, TSO, and WOA.
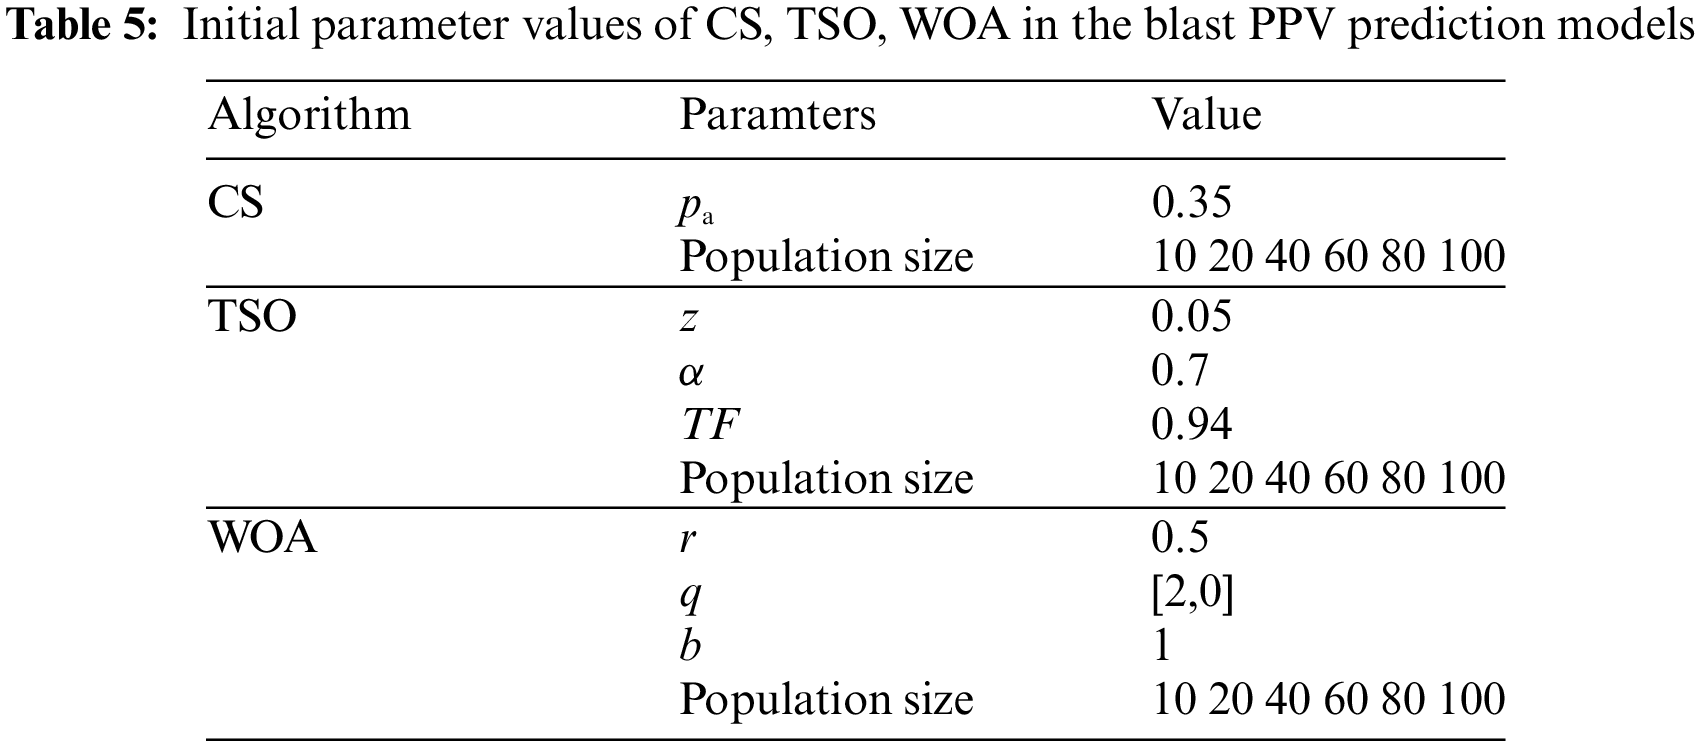
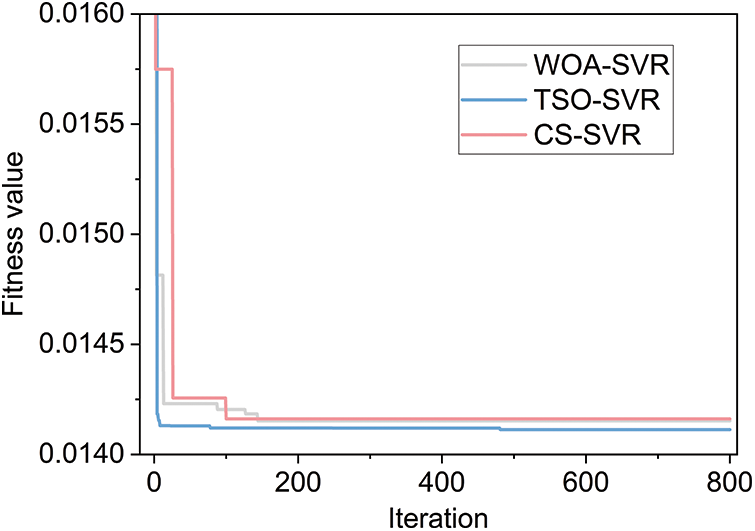
Figure 5: Fitness value with number of iterations for hybrid models
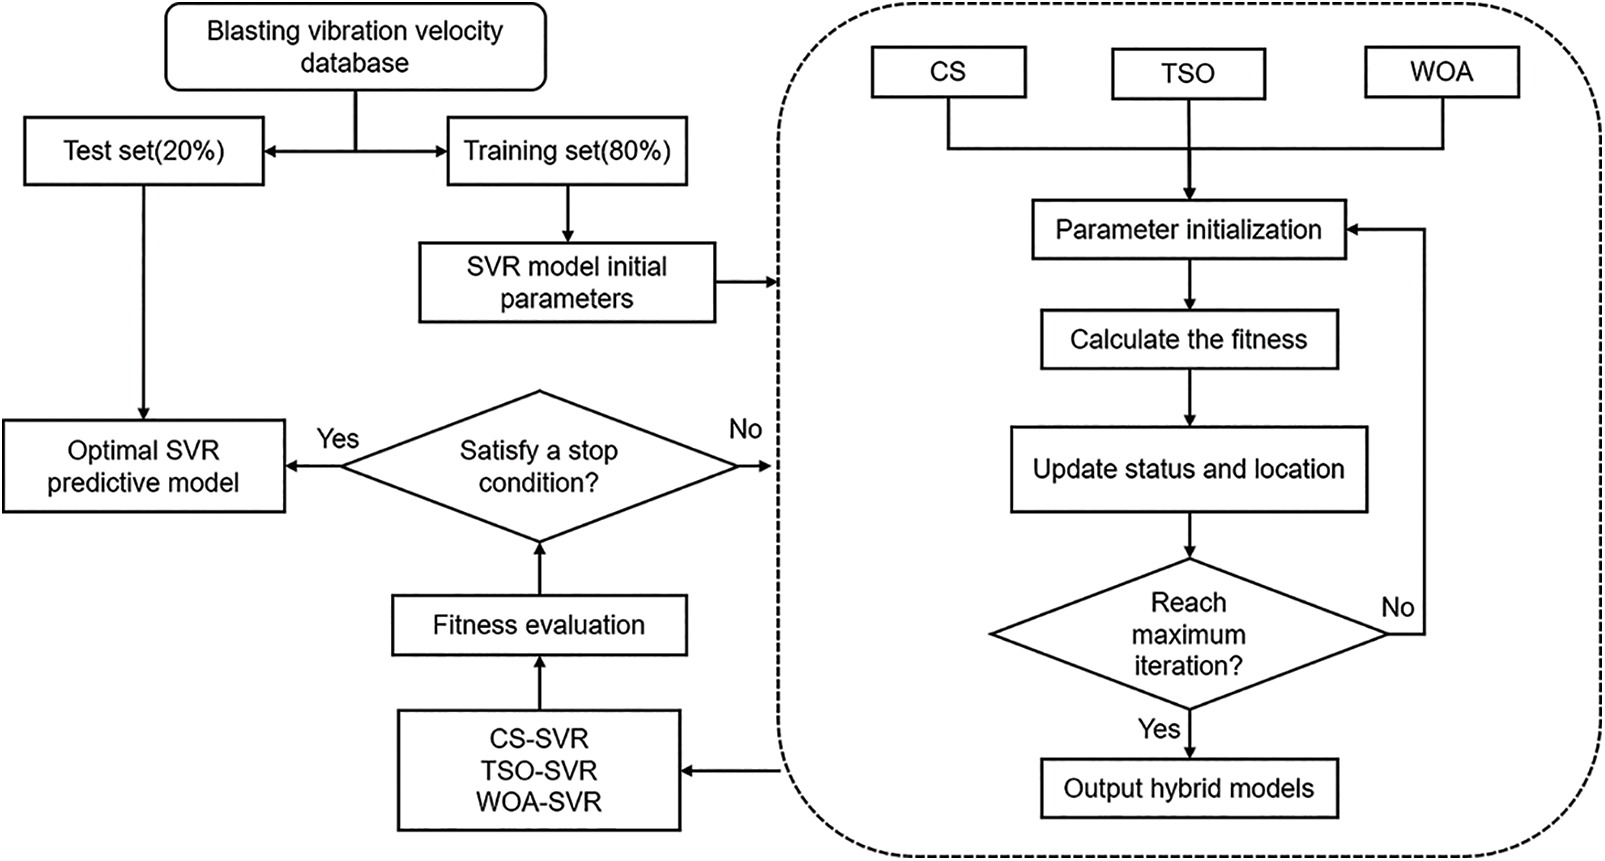
Figure 6: Flowchart of SVR-based hybrid models
The reliability of the hybrid model is effectively evaluated by utilizing the correlation evaluation indexes such as the coefficient of determination (R2), the root mean square error (RMSE), and the mean absolute error (MAE), which explains the relationship between the actual values and the predicted values. The root mean square error represents the standard deviation of the error between the predicted value and the actual value, the coefficient of determination represents the percentage of the correlation squared between the predicted value and the actual value, the mean absolute error is the average of the absolute error, which more accurately reflects the actual situation of the error in the prediction value, and the a10-index can be used as an important indicator of a model’s accuracy and usefulness in a prediction task. Each evaluation index has the following formula [43–46]:
where
To reasonably determine the population size of each hybrid model, five-fold cross-validation was used to determine the optimal parameters based on the training set, the population sizes corresponding to the number of cuckoos in CS, the number of tunas in TSO, and the number of whales in WOA, respectively, are shown in Fig. 7, along with the MSEcv for various population sizes of each hybrid model. As shown in the figure, the optimal population sizes for the three optimization algorithms are, in order, 40, 40, and 80.
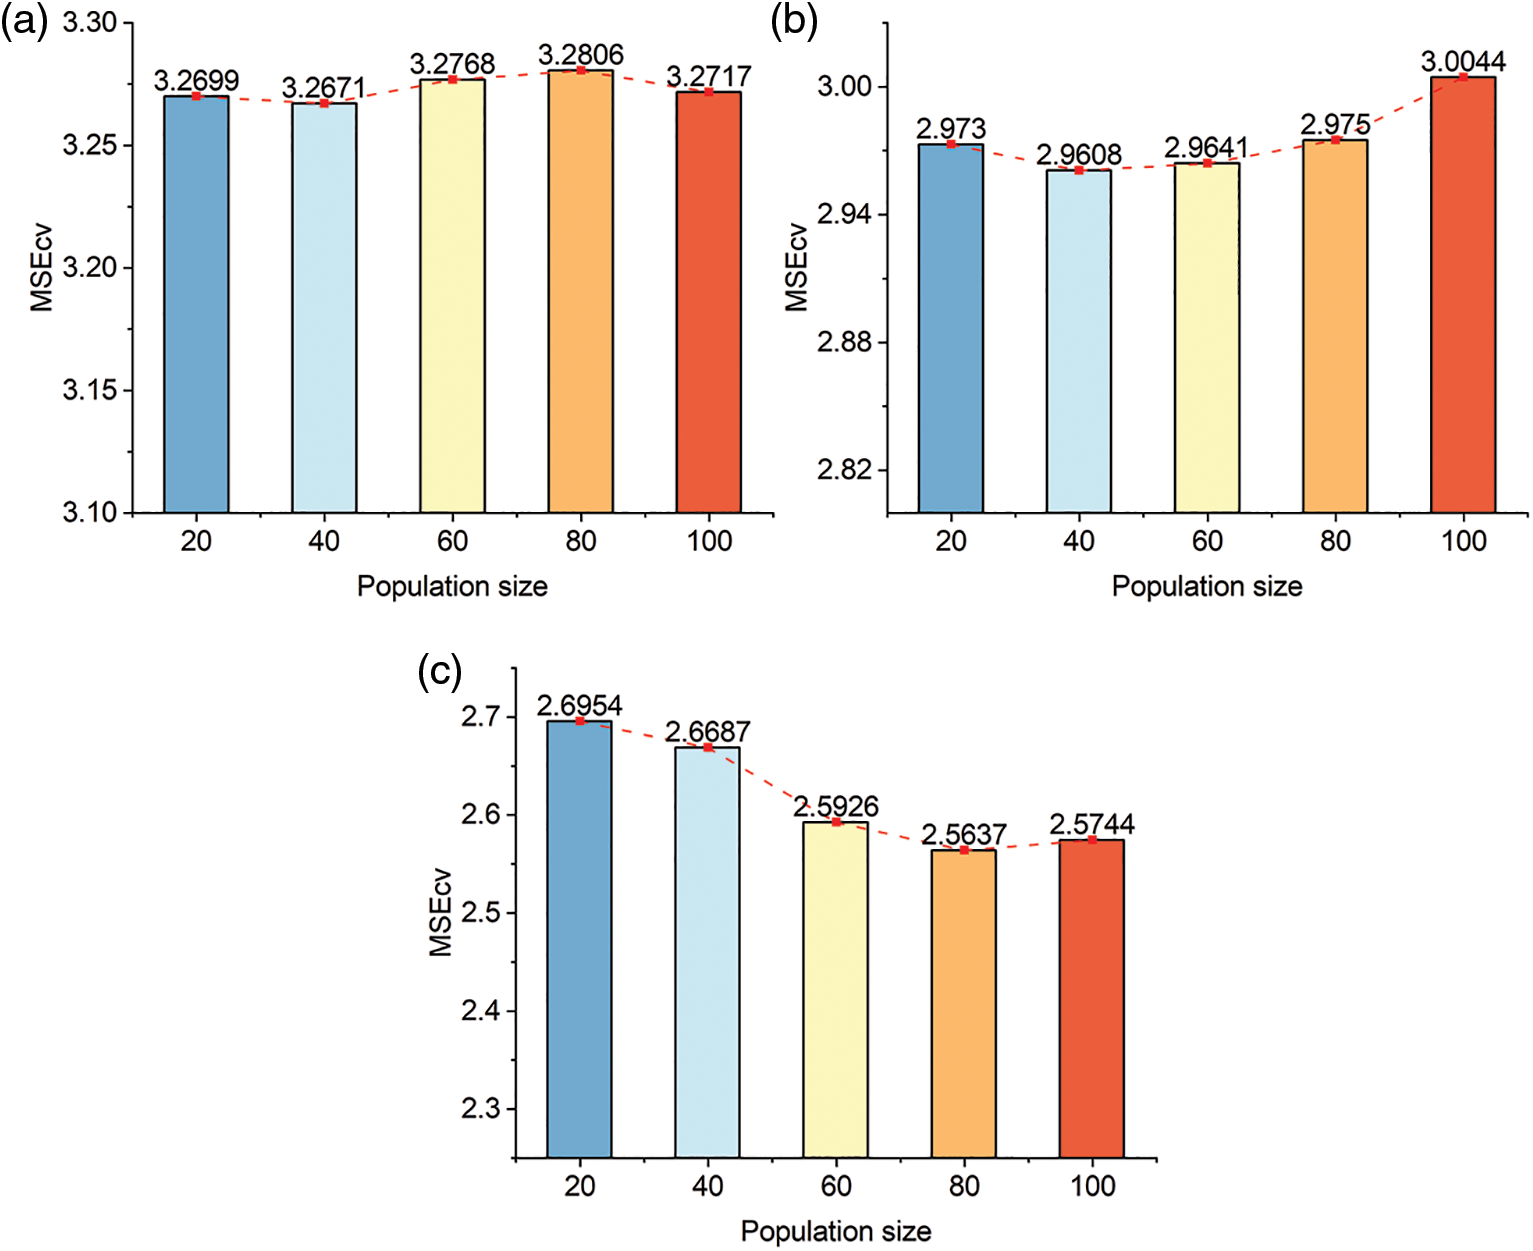
Figure 7: Cross-validation confirms population size of hybrid models (a) CS (b) WOA (c) TSO
Fig. 8 displays the correlation between the predicted and actual values of PPV for the three hybrid models. Each hybrid model has a solid predictive effect in both the training and test sets and the distribution of training and test samples is near the ideal fit line. In terms of the three evaluation indexes, R², RMSE, and MAE, the R² of all three hybrid models is above 0.94, indicating that the hybrid models based on SVR proposed in this study can achieve better prediction results. The TSO-SVR model outperforms the other two hybrid models in terms of prediction accuracy, with R2 of 0.9622, RMSE of 1.6019, MAE of 1.2001, and a10-index of 0.6571 in the training set, and R2 of 0.9551, RMSE of 1.3702, MAE of 1.1157, and a10-index of 0.7222 in the test set.
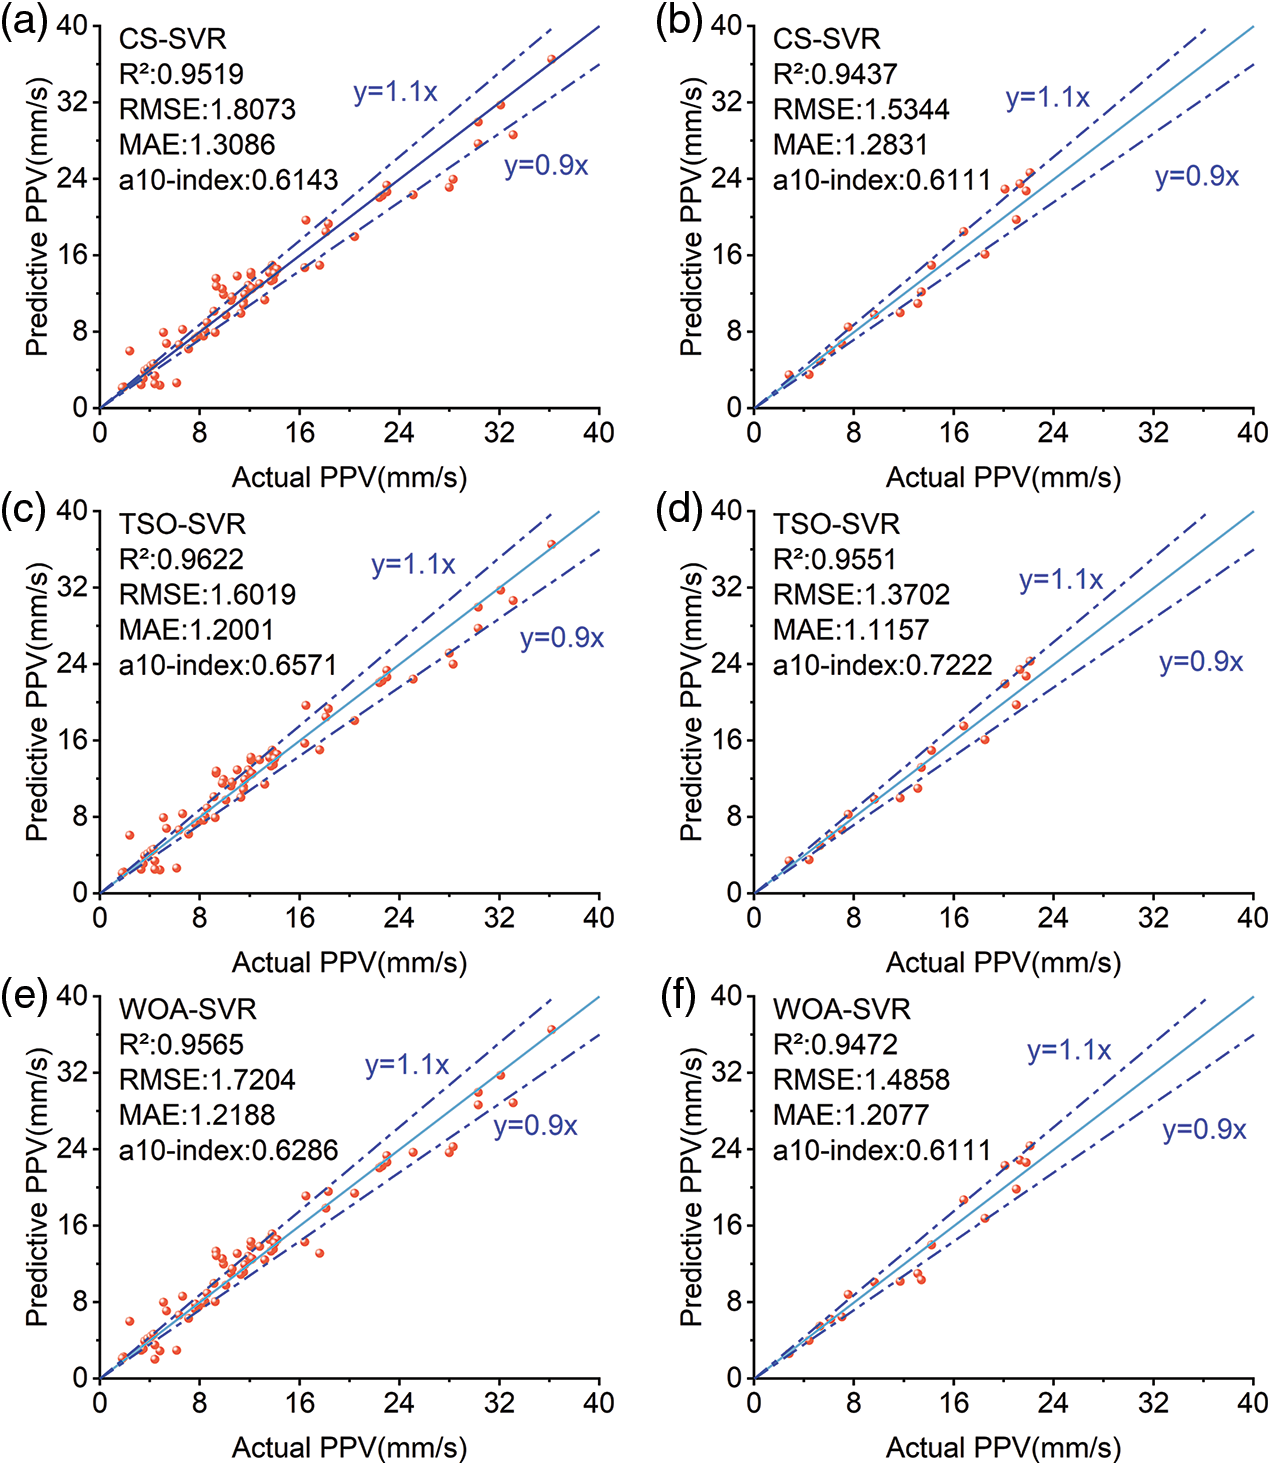
Figure 8: Comparison of actual and predicted PPV values for different hybrid models
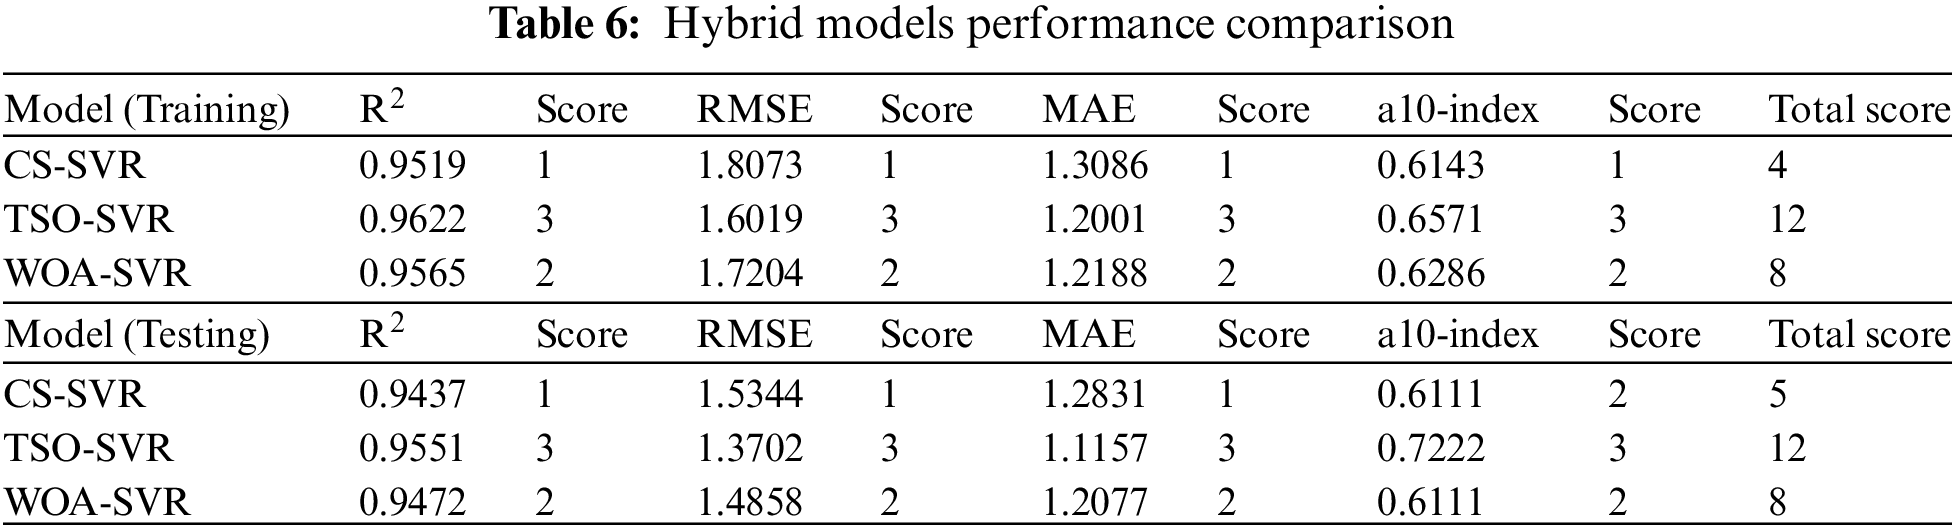
To further compare and analyze the prediction performance of each hybrid model, a comprehensive scoring method was chosen to evaluate the prediction performance of the three hybrid models [47], and the comprehensive scoring results of the three hybrid models (CS-SVR, TSO-SVR, and WOA-SVR) in terms of their performance indicators for the prediction of the PPV of the blasting are shown in Table 6. The prediction ability of the three hybrid models is ranked as follows: TSO-SVR > WOA-SVR > CS-SVR, and the TSO-SVR model can predict the blast PPV more accurately than the WOA-SVR and CS-SVR models.
To compare the prediction effectiveness of the hybrid prediction model of the swarm intelligence optimization algorithm to that of the unoptimized classical SVR model, the prediction results of a single SVR model were evaluated using the three model evaluation metrics. Fig. 9 depicts the various evaluation metrics for the prediction outcomes of the CS-SVR, the TSO-SVR, the WOA-SVR, and the sole SVR model. The hybrid SVR model is able to make more accurate predictions than the SVR model. After implementing the swarm intelligence optimization algorithm, the RMSE of the SVR model can be decreased from 2.5396 to 1.3702, the MAE can be decreased from 1.7803 to 1.1157, and the R2 can be increased from 0.8998 to 0.9551.
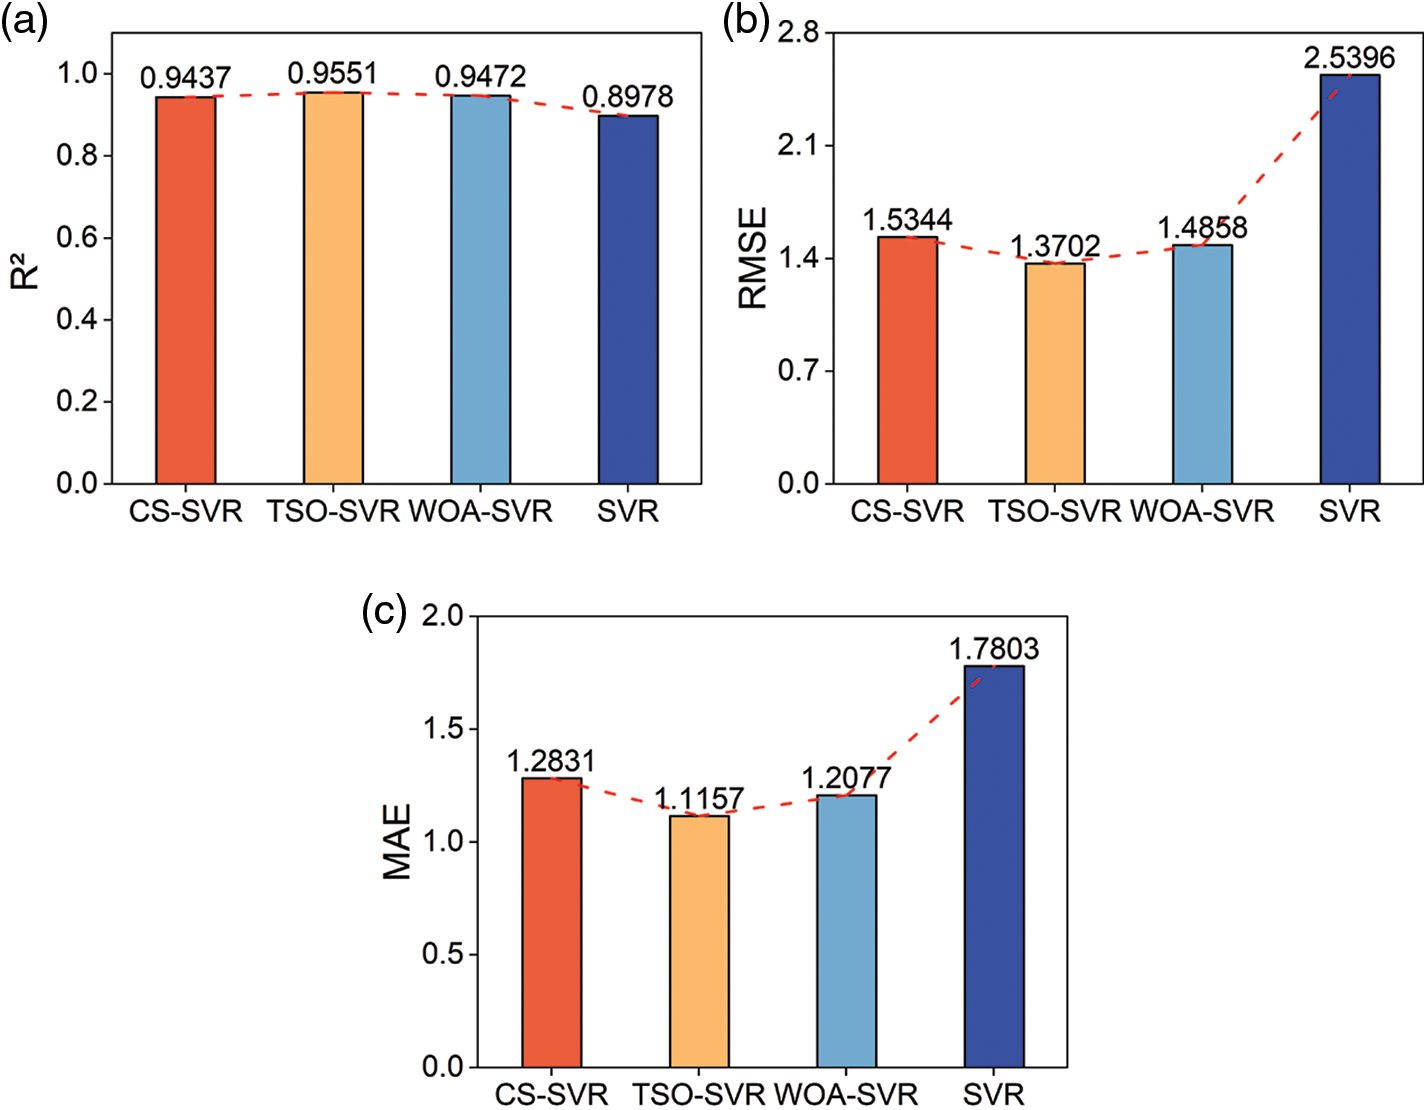
Figure 9: Comparative chart of predicted effects (a) R2 (b) RMSE (c) MAE
The Taylor diagram, depicted in Fig. 10, is employed for assessing the predictive performance of hybrid models in relation to other machine learning models. This diagram provides a visual representation of a model’s predictive ability by amalgamating the standard deviation, R2, and RMSE of numerous models. As evidenced by its closest proximity to observation locations, the TSO-SVR model demonstrates the greatest level of prediction accuracy. Relative to the other three singular models, the points associated with the three hybrid models reside closer to the observation points, signifying a significantly enhanced prediction accuracy compared to the SVR, Random Forest (RF), and XGBoost models.
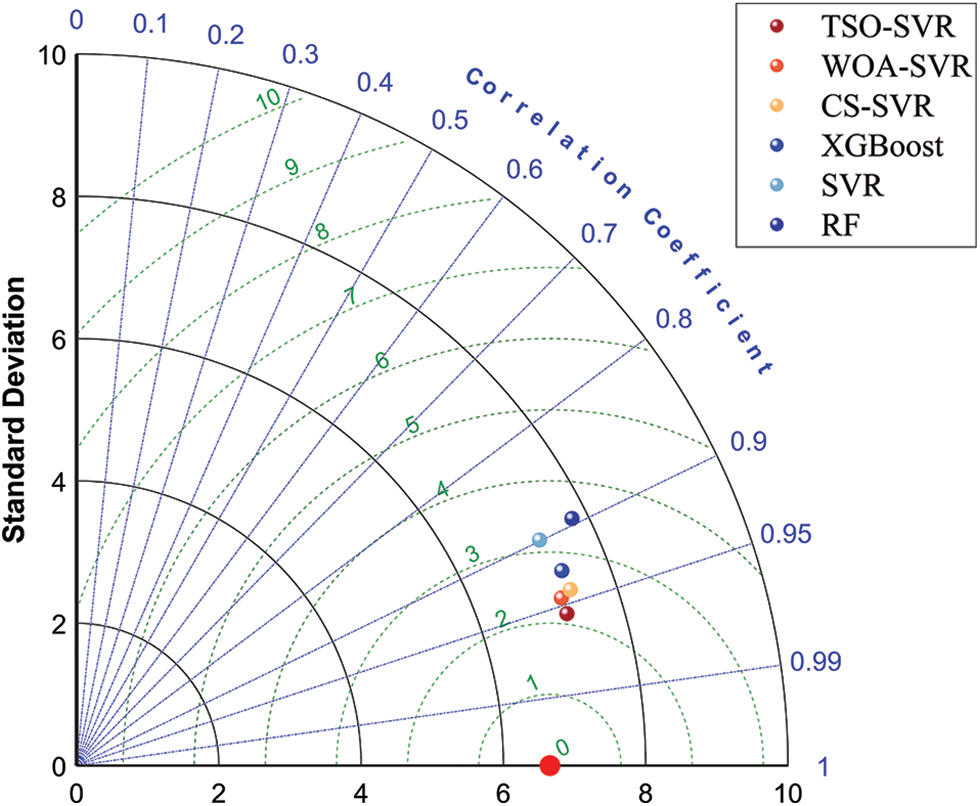
Figure 10: Taylor diagram on the comparison of the predictive performance of the models
All eight parameters selected in this paper affect the PPV prediction results. However, each parameter’s sensitivity needs to be clarified and needs further study. In order to study the sensitivity of different parameters to the PPV, the normalized mutual information method is used in this section to analyze the importance of different influencing factors on PPV. The mutual information method is a feature screening method that measures the correlation between two feature data sets [48], and the mutual information value indicates the amount of information that one feature variable contains about another feature variable. Non-linear relationships between data sets can be mined by the mutual information method. The value of mutual information is calculated as shown in the following equation:
where Y is the set of sample eigenvalues; X is the set of sample actual values; H(Y) is the measure of uncertainty of Y, the larger it is, the greater the randomness of the random attribute; H(Y|X) is the conditional information entropy of Y on X, where Y includes all possible values of the random attribute.
Fig. 11 illustrates how the importance of each input variable to the PPV of blasting is determined using the mutual information value in the normalized mutual information method. As shown in the figure, the maximum charge per delay has the greatest influence on the predicted value of the blasting’s PPV. The normalized value of each input variable’s mutual information is as follows: W > DI > PF > H/B > T/B > S/B > U/B > B/D. In a study by Hasanipanah et al. [25], maximum charge per delay was also found to have the greatest influence on PPV. The W, DI, and PF have the greatest impact on predicting the PPV of detonation and should be prioritized.
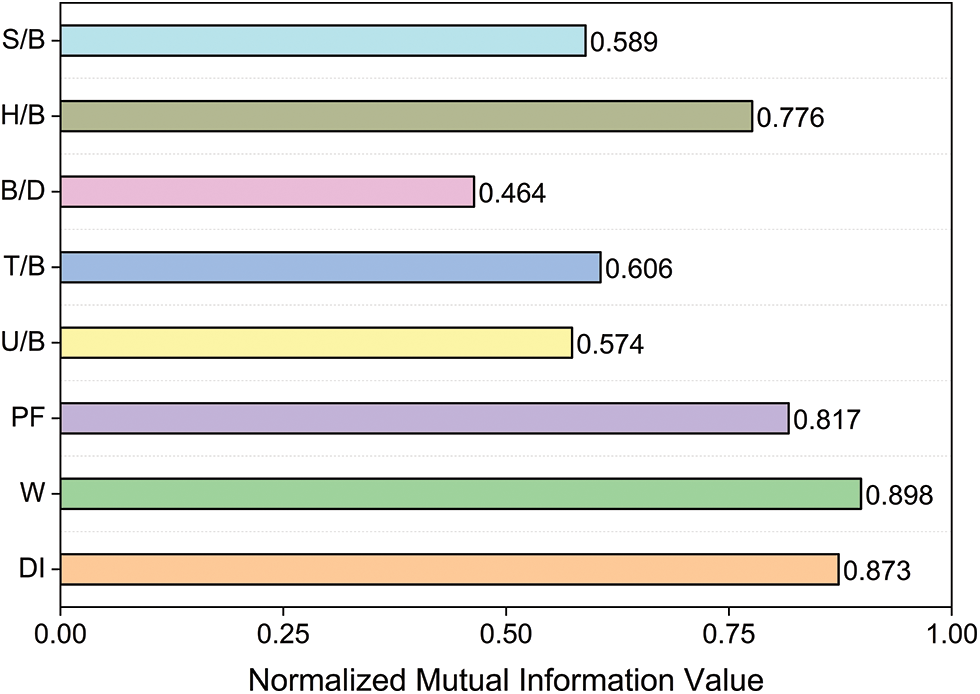
Figure 11: Sensitivity values of input parameters
In order to accurately estimate the blast vibration velocity of open-air step blasting, this study combines SVR with three hybrid algorithms, CS, TSO and WOA, and establishes three hybrid models, compares the effectiveness of the three hybrid models in predicting the PPV of blasting, and conducts sensitivity analysis on each input parameter, and obtains the following conclusions:
(1) The prediction performance of the TSO-SVR model in the training stage and the testing stage is superior to that of the CS-SVR model and the WOA-SVR model. The R2 values of the training set and the testing set are 0.9622 and 0.9551, the RMSE values are 1.6019 and 1.3702, the MAE values are 1.2001 and 1.1157, and a 10-index are 0.6571 and 0.7222, respectively. The prediction ability is ranked as follows: TSO-SVR>WOA-SVR>CS-SVR, and the TSO-SVR model has the greatest prediction performance.
(2) The three hybrid models can effectively improve the prediction ability of SVR model, and the prediction accuracy can meet the demand of actual engineering blasting.
(3) For predicting the PPV of blasting, the maximum charge per delay is the most essential input variable, and the sensitivity values of the input variables are as follows: W > DI > PF > H/B > T/B > S/B > U/B > B/D. When predicting blasting vibration, the effects of W, DI, and PF on the PPV of blasting must be taken into account.
Acknowledgement: Thanks to the help of four anonymous reviewers and journal editors, the content quality of this paper has been improved.
Funding Statement: This research is financially supported by the National Natural Science Foundation of China (Grant No. 42072309), the Fundamental Research Funds for National University, China University of Geosciences (Wuhan) (Grant No. CUGDCJJ202217), the Knowledge Innovation Program of Wuhan-Basic Research (Grant No. 2022020801010199), and the Hubei Key Laboratory of Blasting Engineering Foundation (HKLBEF202002).
Author Contributions: The authors confirm contribution to the paper as follows: study conception and design: Yifan Huang; data collection: Zikang Zhou; analysis and interpretation of results: Yifan Huang, Xuedong Luo; draft manuscript preparation: Mingyu Li, Yifan Huang. All authors reviewed the results and approved the final version of the manuscript.
Availability of Data and Materials: The data that support the findings of this study are available from the corresponding author upon reasonable request.
Conflicts of Interest: The authors declare that they have no conflicts of interest to report regarding the present study.
References
1. Khandelwal, M., Singh, T. N. (2005). Prediction of blast induced air overpressure in opencast mine. Noise Vibration Worldwide, 36, 7–16. [Google Scholar]
2. Mohamed, M. T. (2009). Artificial neural network for prediction and control of blasting vibrations in Assiut (Egypt) limestone quarry. International Journal of Rock Mechanics and Mining Sciences, 46(2), 426–431. [Google Scholar]
3. Yu, Z., Shi, X., Zhang, Z., Gou, Y., Miao, X. et al. (2023). Using a dividing open-pit blast (DOPB) method to reduce ore loss and dilution caused by blast-induced rock movement. Acta Geotechnica, 18, 4311– 4327. [Google Scholar]
4. Singh, C. P., Agrawal, H. E. M. A. N. T., Mishra, A. K., Singh, P. K. (2019). Reducing environmental hazards of blasting using electronic detonators in a large opencast coal project–A case study. Journal of Mines Metals and Fuels, 67(7), 345–350. [Google Scholar]
5. Khandelwal, M., Singh, T. N. (2009). Prediction of blast-induced ground vibration using artificial neural network. International Journal of Rock Mechanics and Mining Sciences, 46(7), 1214–1222. [Google Scholar]
6. Chen, S. H., Hu, S. W., Chu, S. F. (2017). Study on the blasting vibration effect influenced by millisecond time and cylindrical charging characteristics. Chinese Journal of Rock Mechanics and Engineering, 36(S2), 3974–3983 (In Chinese). [Google Scholar]
7. Kan, J., Dou, L., Li, X., Cao, J., Bai, J. et al. (2022). Study on influencing factors and prediction of peak particle velocity induced by roof pre-split blasting in underground. Underground Space, 7(6), 1068–1085. [Google Scholar]
8. Khandelwal, M., Saadat, M. (2015). A dimensional analysis approach to study blast-induced ground vibration. Rock Mechanics and Rock Engineering, 48, 727–735. [Google Scholar]
9. Himanshu, V. K., Roy, M., Mishra, A., Paswan, R. K., Panda, D. (2018). Multivariate statistical analysis approach for prediction of blast-induced ground vibration. Arabian Journal of Geosciences, 11(16), 460. [Google Scholar]
10. Zhu, C., Xu, Y. Z., Wu, Y. X., He, M. C., Zhu, C. Q. et al. (2022). A hybrid artificial bee colony algorithm and support vector machine for predicting blast-induced ground vibration. Earthquake Engineering and Engineering Vibration, 21, 861–876. [Google Scholar]
11. Yu, Z., Shi, X., Zhou, J., Gou, Y., Huo, X. et al. (2020). A new multikernel relevance vector machine based on the HPSOGWO algorithm for predicting and controlling blast-induced ground vibration. Engineering with Computers, 38, 1905–1920. [Google Scholar]
12. Marto, A., Hajihassani, M., Jahed Armaghani, D., Tonnizam Mohamad, E., Makhtar, A. M. (2014). A novel approach for blast-induced flyrock prediction based on imperialist competitive algorithm and artificial neural network. The Scientific World Journal, 2014, 643715. [Google Scholar] [PubMed]
13. Álvarez-Vigil, A. E., González-Nicieza, C., Gayarre, F. L., Álvarez-Fernández, M. I. (2012). Predicting blasting propagation velocity and vibration frequency using artificial neural networks. International Journal of Rock Mechanics and Mining Sciences, 55, 108–116. [Google Scholar]
14. Dindarloo, S. R. (2015). Peak particle velocity prediction using support vector machines: A surface blasting case study. Journal of the Southern African Institute of Mining and Metallurgy, 115(7), 637–643. [Google Scholar]
15. Dzimunya, N., Besa, B., Nyirenda, R. (2023). Prediction of ground vibrations induced by bench blasting using the random forest algorithm. Journal of the Southern African Institute of Mining and Metallurgy, 123(3), 123–132. [Google Scholar]
16. Kadingdi, F. A., Ayawah, P. E., Azure, J. W., Bruno, K. A., Kaba, A. G. et al. (2022). Stacked generalization for improved prediction of ground vibration from blasting in open-pit mine operations. Mining, Metallurgy & Exploration, 39(6), 2351–2363. [Google Scholar]
17. Zhou, S., Zhang, Z., Luo, X., Niu, S., Jiang, N. et al. (2023). Developing a hybrid CEEMDAN-PE-HE-SWT method to remove the noise of measured carbon dioxide blast wave. Measurement, 223, 113797. [Google Scholar]
18. Ren, F. Q., Zhu, C., Yuan, Z. H., Karakus Murat, Tang, S. B. (2023). Recognition of shear and tension signals based on acoustic emission parameters and waveform using machine learning methods. International Journal of Rock Mechanics and Mining Sciences, 171, 105578. [Google Scholar]
19. Zhang, X., Zhu, C., He, M. C., Dong, M. L., Zhang, G. C. et al. (2022). Failure mechanism and long short-term memory neural network model for landslide risk prediction. Remote Sensing, 14, 166. [Google Scholar]
20. Zhou, S., Yao, Y., Luo, X., Jiang, N., Niu, S. (2023). Dynamic response evaluation for single-hole bench carbon dioxide blasting based on the novel SSA-VMD-PCC method. International Journal of Geo mechanics, 23(1), 04022248. [Google Scholar]
21. Yu, Z., Li, C. Q., Zhou, J. (2023). Tunnel boring machine performance prediction using supervised learning method and swarm intelligence algorithm. Mathematics, 11, 4237. [Google Scholar]
22. Bui, X. N., Nguyen, H., Tran, Q. H., Nguyen, D. A., Bui, H. B. (2021). Predicting blast-induced ground vibration in quarries using adaptive fuzzy inference neural network and moth-flame optimization. Natural Resources Research, 30, 4719–4734. [Google Scholar]
23. Cai, C., Qian, Q., Fu, Y. (2020). Application of BAS-Elman neural network in prediction of blasting vibration velocity. Procedia Computer Science, 166, 491–495. [Google Scholar]
24. Nguyen, H., Bui, X. N. (2021). A novel hunger games search optimization-based artificial neural network for predicting ground vibration intensity induced by mine blasting. Natural Resources Research, 30(5), 3865–3880. [Google Scholar]
25. Hasanipanah, M., Monjezi, M., Shahnazar, A., Armaghani, D. J., Farazmand, A. (2015). Feasibility of indirect determination of blast induced ground vibration based on support vector machine. Measurement, 75, 289–297. [Google Scholar]
26. Hosseini, S., Pourmirzaee, R., Armaghani, D. J., Sabri Sabri, M. M. (2023). Prediction of ground vibration due to mine blasting in a surface lead-zinc mine using machine learning ensemble techniques. Scientific Reports, 13(1), 6591. [Google Scholar] [PubMed]
27. Armaghani, D. J., He, B., Mohamad, E. T., Zhang, Y., Lai, S. H. et al. (2022). Applications of two neuro-based metaheuristic techniques in evaluating ground vibration resulting from tunnel blasting. Mathematics, 11(1), 106. [Google Scholar]
28. Zeng, J., Mohammed, A. S., Mirzaei, F., Moosavi, S. M., Armaghani, D. J. et al. (2022). A parametric study of ground vibration induced by quarry blasting: An application of group method of data handling. Environmental Earth Sciences, 81, 127. [Google Scholar]
29. Peng, K., Zeng, J., Armaghani, D. J., Hasanipanah, M., Chen, Q. (2021). A novel combination of gradient boosted tree and optimized ANN models for forecasting ground vibration due to quarry blasting. Natural Resources Research, 30, 4657– 4671. [Google Scholar]
30. Iphar, M., Yavuz, M., Ak, H. (2008). Prediction of ground vibrations resulting from the blasting operations in an open-pit mine by adaptive neuro-fuzzy inference system. Environmental Geology, 56, 97–107. [Google Scholar]
31. Fişne, A., Kuzu, C., Hüdaverdi, T. (2011). Prediction of environmental impacts of quarry blasting operation using fuzzy logic. Environmental Monitoring and Assessment, 174, 461–470. [Google Scholar] [PubMed]
32. Monjezi, M., Hasanipanah, M., Khandelwal, M. (2012). Evaluation and prediction of blast-induced ground vibration at Shur River Dam, Iran, by artificial neural network. Neural Computing and Applications, 22, 1637–1643. [Google Scholar]
33. Mohamadnejad, M., Gholami, R., Ataei, M. (2012). Comparison of intelligence science techniques and empirical methods for prediction of blasting vibrations. Tunnelling and Underground Space Technology, 28, 238–244. [Google Scholar]
34. Lawal, A. I., Kwon, S., Kim, G. Y. (2021). Prediction of the blast-induced ground vibration in tunnel blasting using ANN, moth-flame optimized ANN, and gene expression programming. Acta Geophys, 69, 161–174. [Google Scholar]
35. Yu, Q., Monjezi, M., Mohammed, A. S., Dehghani, H., Armaghani, D. J. et al. (2021). Optimized support vector machines combined with evolutionary random forest for prediction of back-break caused by blasting operation. Sustainability, 13, 12797. [Google Scholar]
36. Smola, A. J., Schölkopf, B. (2004). A tutorial on support vector regression. Statistics and Computing, 14, 199–222. [Google Scholar]
37. Vapnik, V. (1995). The nature of statistical learning theory. Germany: Springer. [Google Scholar]
38. Yang, X. S., Deb, S. (2009). Cuckoo search via Lévy flights. 2009 World Congress on Nature & Biologically Inspired Computing (NaBIC), pp. 210–214. Coimbatore, India. [Google Scholar]
39. Xie, L., Han, T., Zhou, H., Zhang, Z. R., Han, B. et al. (2021). Tuna swarm optimization: A novel swarm-based metaheuristic algorithm for global optimization. Computational Intelligence and Neuroscience, 2021, 1–22. [Google Scholar]
40. Mirjalili, S., Lewis, A. (2016). The whale optimization algorithm. Advances in Engineering Software, 95, 51–67. [Google Scholar]
41. Hudaverdi, T. (2012). Application of multivariate analysis for prediction of blast-induced ground vibrations. Soil Dynamics and Earthquake Engineering, 43, 300–308. [Google Scholar]
42. Forman, E., Peniwati, K. (1998). Aggregating individual judgments and priorities with the analytic hierarchy process. European Journal of Operational Research, 108(1), 165–169. [Google Scholar]
43. Lei, Y., Zhou, S., Luo, X., Niu, S., Jiang, N. (2022). A comparative study of six hybrid prediction models for uniaxial compressive strength of rock based on swarm intelligence optimization algorithms. Frontiers in Earth Science, 10, 930130. [Google Scholar]
44. Zhou, J., Dai, Y., Khandelwal, M., Monjezi, M., Yu, Z. et al. (2021). Performance of hybrid SCA-RF and HHO-RF models for predicting backbreak in open-pit mine blasting operations. Natural Resources Research, 30, 4753–4771. [Google Scholar]
45. Yu, Z., Shi, X., Miao, X., Zhou, J., Khandelwal, M. et al. (2021). Intelligent modeling of blast-induced rock movement prediction using dimensional analysis and optimized artificial neural network technique. International Journal of Rock Mechanics and Mining Sciences, 143, 104794. [Google Scholar]
46. Huang, Y., Lei, Y., Luo, X. et al. (2023). Prediction of compressive strength of rice husk ash concrete: A comparison of different metaheuristic algorithms for optimizing support vector regression. Case Studies in Construction Materials, 18, e02201. [Google Scholar]
47. Zorlu, K., Gokceoglu, C., Ocakoglu, F., Nefeslioglu, H. A., Acikalin, S. J. E. G. (2008). Prediction of uniaxial compressive strength of sandstones using petrography-based models. Engineering Geology, 96(3–4), 141–158. [Google Scholar]
48. Studholme, C., Hill, D. L., Hawkes, D. J. (1999). An overlap invariant entropy measure of 3D medical image alignment. Pattern Recognition, 32(1), 71–86. [Google Scholar]
Cite This Article
 Copyright © 2024 The Author(s). Published by Tech Science Press.
This work is licensed under a Creative Commons Attribution 4.0 International License , which permits unrestricted use, distribution, and reproduction in any medium, provided the original work is properly cited.
 Downloads
 Citation Tools