
 Submit a Paper
 Propose a Special lssue
 Open Access
ARTICLE

Numerical Investigation of the Angle of Attack Effect on Cloud Cavitation Flow around a Clark-Y Hydrofoil
1 College of Engineering, Peking University, Beijing, 100871, China
2 College of Shipbuilding Engineering, Harbin Engineering University, Harbin, 150001, China
* Corresponding Authors: Jiale Yan. Email: ; Shiping Wang. Email:
Computer Modeling in Engineering & Sciences 2024, 139(3), 2947-2964. https://doi.org/10.32604/cmes.2024.047265
Received 31 October 2023; Accepted 11 January 2024; Issue published 11 March 2024
 View Full Text
 Download PDF
Abstract
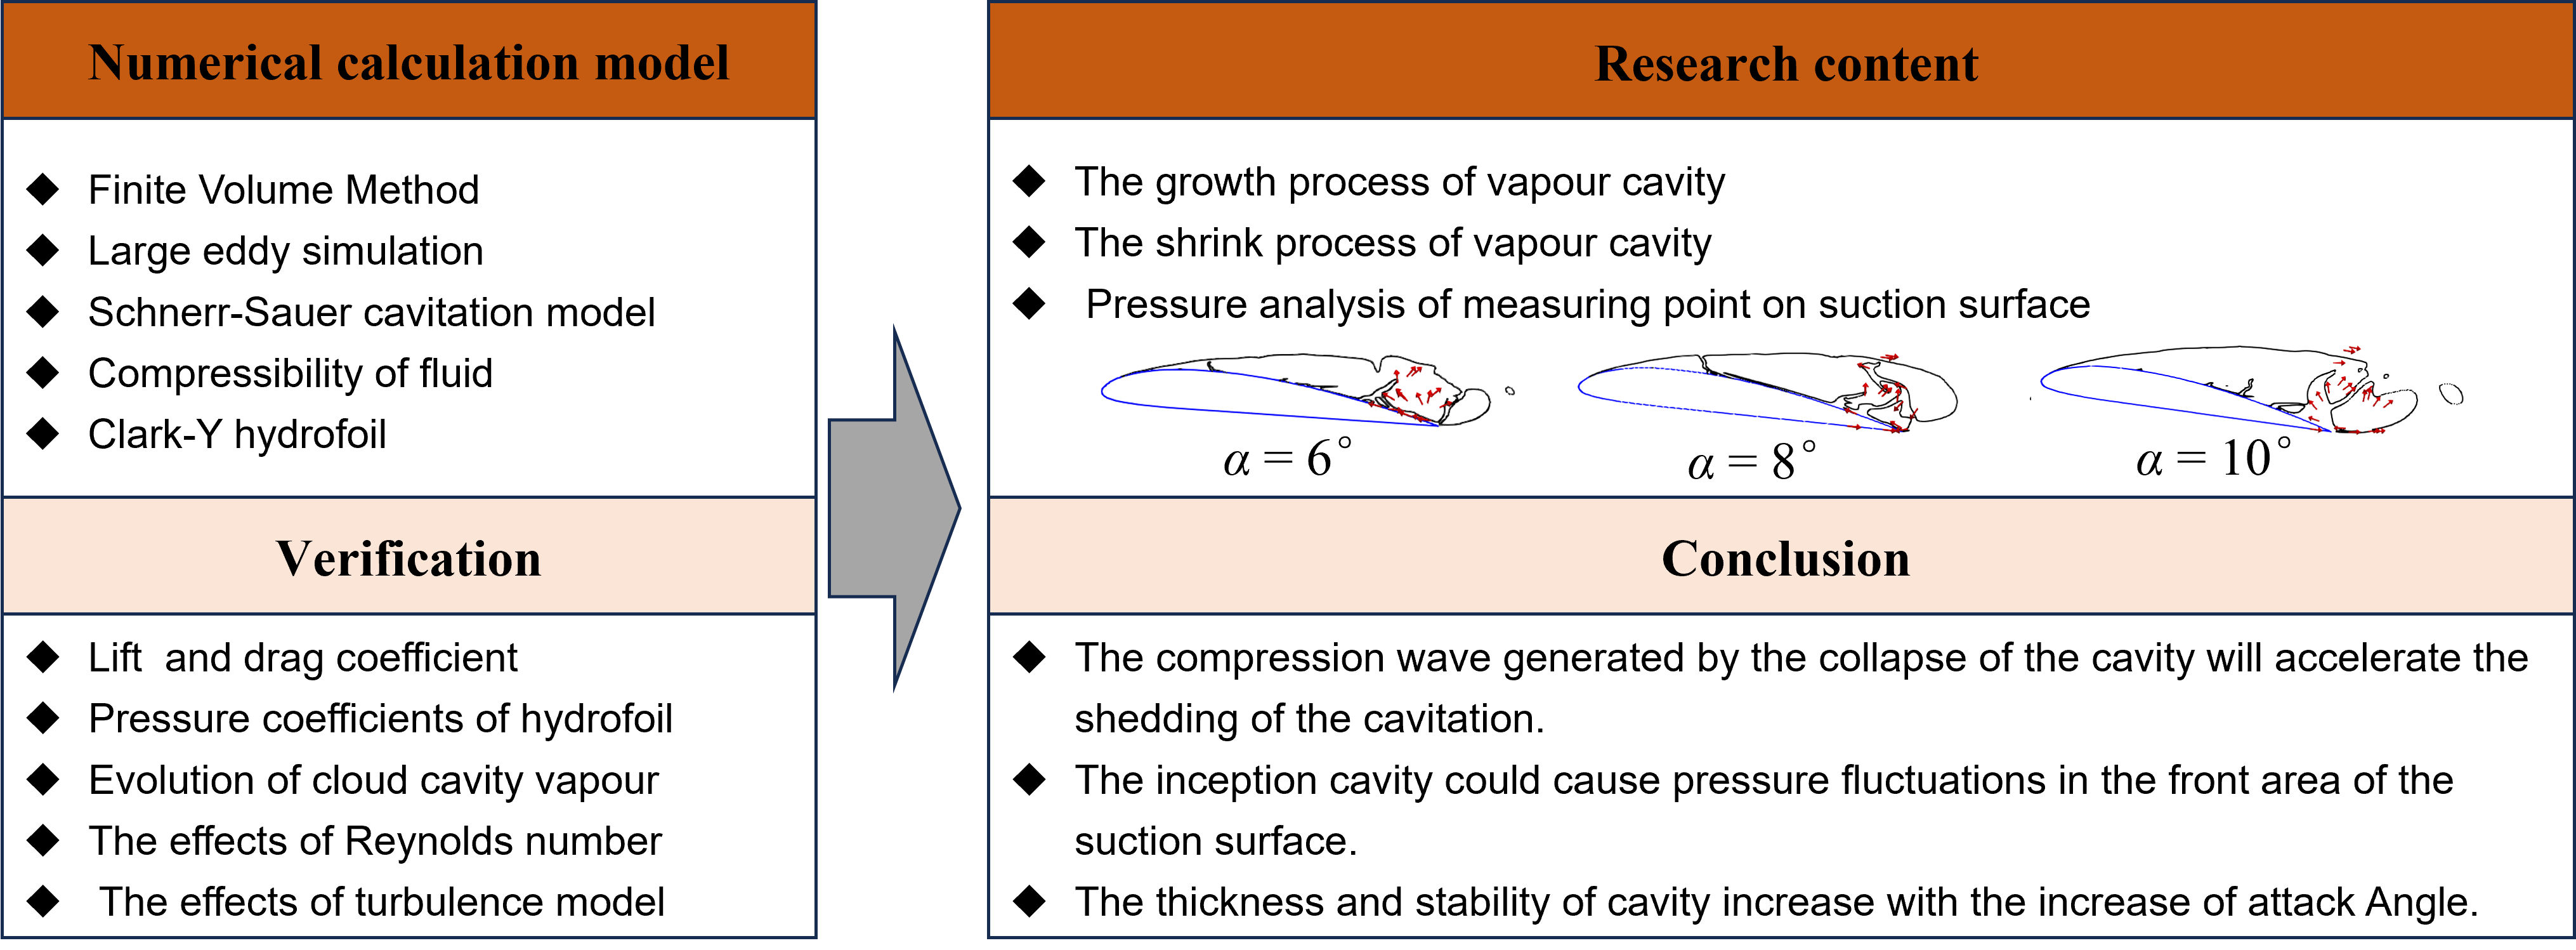
Cavitation is a prevalent phenomenon within the domain of ship and ocean engineering, predominantly occurring in the tail flow fields of high-speed rotating propellers and on the surfaces of high-speed underwater vehicles. The re-entrant jet and compression wave resulting from the collapse of cavity vapour are pivotal factors contributing to cavity instability. Concurrently, these phenomena significantly modulate the evolution of cavitation flow. In this paper, numerical investigations into cloud cavitation over a Clark-Y hydrofoil were conducted, utilizing the Large Eddy Simulation (LES) turbulence model and the Volume of Fluid (VOF) method within the OpenFOAM framework. Comparative analysis of results obtained at different angles of attack is undertaken. A discernible augmentation in cavity thickness is observed concomitant with the escalation in attack angle, alongside a progressive intensification in pressure at the leading edge of the hydrofoil, contributing to the suction force. These results can serve as a fundamental point of reference for gaining a deeper comprehension of cloud cavitation dynamics.Graphic Abstract
Keywords
Nomenclature
| CD | Drag coefficient |
| CL | Lift coefficient |
| CP | Pressure coefficient |
| c | Chord |
| Evaporation rate | |
| Condensation rate | |
| n | The number of gas nuclei per unit volume of water |
| p | Free flow pressure |
| pv | Vapor pressure |
| Rb | Radius of nuclei |
| U | Freestream velocity |
| σ | Cavitation number |
| Dynamic viscosity | |
| Dynamic viscosity of liquid phases | |
| Dynamic viscosity of gas phases | |
| Liquid phase volume fraction | |
| Gas phase volume fraction | |
| Fluid density | |
| Liquid density | |
| Gas density |
Cavitation is initiated when gas nuclei present in the liquid phase undergo an explosive growth into a vapor cavity, triggered by local pressures dropping below the saturated vapor pressure threshold [1]. The evolution of this cavity is significantly influenced by the cavitation number, denoted as σ, which is formulated as
In instances of cloud cavitation, the vapor cavity adhered to the structure tends to detach and collapse, engendering noise that consequently induces vibration and cavitation upon the structure surface [4–6]. This phenomenon has garnered substantial scholarly attention [7–10]. Certain researchers have used supercavitation to significantly reduce the friction resistance of small underwater vehicles [11,12]. Additionally, others have developed multi-scale models to capture the explosive growth process of gas nuclei [13]. Rayleigh’s theoretical study of bubble collapse laid the foundation for subsequent research on cavitation and its dynamics [14]. Plesset [15] building upon Rayleigh’s research, derived the renowned Rayleigh-Pleseet equation, which incorporated additional variables such as viscosity and surface tension of liquids. Recently, Zhang et al. [16] established a unified theory for bubble dynamics, capable of predicting the dynamics of bubbles in various sources and environments. Wang et al. [17,18] conducted a series of studies on the cavitation evolution process in the Clark-Y hydrofoil’s flow field and discovered that a re-entrant jet forms at the trailing edge. The re-entrant jet could extend to the leading-edge area of the cavitation, resulting in the detachment and collapse of the attached cavitation. Callenaer et al. [19] employed a Laser Doppler Velocimetry (LDV) system to explore the evolution of cloud cavity. They identified a significant negative pressure gradient in the vapor cavity’s tail region, which established the necessary conditions for the formation of a re-entrant jet. Furthermore, the emission of compression waves from the collapse of cavitation can result in additional vapor collapse [20,21]. The process of the vapour cavity collapse is closely related to the compressibility of both vapor and liquid, as well as the mixture of gas-liquid [22–24]. Significantly reduced in sound velocity compared to pure gas or liquid, the velocity of sound within the gas-liquid mixture descends by several meters per second [25]. However, in the period of vapour cavity collapse, the cavity wall velocity can surpass the fluid sound speed [26–28]. Leroux et al. [29] observed that a cavity length exceeding half the hydrofoil chord length exacerbates vapor instability, with the radiated compression wave pinpointed as a pivotal contributor to cavity instability.
The simulation of turbulence is critical to capture flow details. The direct solution method could yield precise data regarding the turbulent flow field. However, its implementation in practical engineering is infrequent due to the substantial computing resources it demands. In the field of cavitation, the Reynolds average method is widely used for its ability to accurately model turbulence effects with low computational and grid quality demands. However, numerous studies indicate that the RANS model tends to overpredict turbulent viscosity in the closed region at the tail of the cloud cavitation cavity. This overprediction impedes the formation and development of backwash flow, leading to predominantly quasi-static cavitation evolution in the flow field [30–32]. In recent years, the large eddy simulation method has gained popularity due to its efficiency in reducing calculation time while retaining critical pulsation information of turbulence [33,34]. He et al. accurately predicted the initiation of cavitation, the return jet, and the shedding of cavitation clouds, which was consistent with the development process of cavitation captured by experimental high-speed photography, by simulating diesel cavitation with a 2 mm wide nozzle using LES [35]. Pendar et al. used LES to study cavitation and super cavitation flow around spheroidal clouds, and found that cavitation can suppress instability in the wake region, in which the expansion and contraction term in the vorticity transport equation is the main factor affecting the vorticity in the wake region [36]. At present, the process of cavitation growth and collapse in hydrofoil clouds are the subject of numerous ongoing studies. Nevertheless, research on the impact of the Angle of attack on this process is still relatively scant, and studies on the hydrofoil’s force throughout the evolution of cavitation are virtually nonexistent. In this paper, the Large Eddy Simulation alongside the Schnerr-Sauer cavitation model is employed to scrutinize the cloud cavity over the Clark-Y hydrofoil. A concrete analysis of the pressure change process on the structure is presented. This study examines the impact of the angle of attack on the development of the cloud cavity, specifically in terms of the growth and shrinking of the vapour cavity.
The rest of this paper is organized as follows: In Section 2, the governing equation and cavitation model used in the numerical calculation are described, and the accuracy of the results obtained through the utilization of the numerical calculation model in this paper is verified. Section 3 discusses the results, with Section 3.1 analyzing the growth process of cavitation and Section 3.2 delving into its shrinkage process. Section 3.3 examines the variation of suction surface pressure throughout the development of cavities. In Section 4, we conclude with a summary of our key findings and prospects. As the angle of attack increases, the thickness and stability of the cavity gradually increase, and the growth and collapse of the vapour could have a significant effect on the pressure on the surface of the structure.
2 Numerical Calculation Model and Verification
In this paper, the mixture model is employed to calculate the cavitation flow, where a uniform mixture of gas and liquid phases is designated as the mixture phase. The fundamental premise underlying this model is the disregard for the relative motion that occurs between the liquid and gas phases. The specific governing equations are defined as follows:
where
The Schnerr-Sauer cavitation model based on the bubble dynamics is adopted in this paper [37]. There is an assumption that gas nuclei are present in the water in a uniform distribution and that their development process remains constant in response to changes in the flow field pressure. This process is meticulously modeled by the Rayleigh-Plesset equation [14,15]. Consequently, the vapor phase fraction is expressed as follows:
where Rb signifies the radius of nuclei, the number of gas nuclei per unit volume of water is denoted as n = 1.6 × 10¹³. After differentiation, it yields:
the change rate of
Based on the continuity equation of the gas phase, it can be obtained:
By substituting Eqs. (4) and (5) into Eq. (7), the expression for the source term of mass transport can be derived. A refinement is introduced to the Schnerr-Sauer cavitation model by incorporating a marginal quantity, approaching zero, to the mass transfer term; this amendment enhances the stability of the numerical computation. The calculation formula is as follows:
where saturated vapor pressure pv = 3200 Pa.
In the present study, a Clark-Y hydrofoil is adopted as the research project. The hydrofoil chord length C is specified as 0.07 m, with the maximum thickness constituting 11.7% of the chord length. The calculation domain is depicted in Fig. 1, wherein the length of the calculated domain is equivalent to 10 times the chord length, and the width is 2.85 times the chord length. 4C represents the lateral distance between the centroid of the hydrofoil and the left boundary of the computed domain. Conversely, 1.4C represents the vertical distance to the upper boundary of the computed domain. The angle of attack α is defined as the angle between the direction of incoming flow and the transverse axis of the hydrofoil, which can be adjusted by rotating the hydrofoil around the centroid. The inlet velocity within the flow field is maintained at 10 m/s, with the pressure condition designated as the boundary condition of non-reflective pressure. The outlet pressure of the flow field is set as 43200 Pa, which could ensure σ = 0.8. The upper and lower boundaries of the flow field are set as symmetric boundary conditions. The initial time step is set equal to 10−7 s, with the maximum Courant number defined as 0.3, facilitating the automatic adjustment of the time step to ascertain computational stability. The Large Eddy Simulation (LES) turbulence model is used [38–40]. The sublattice stress is modeled by the equation sublattice turbulent kinetic energy eddy viscosity model. The equations of state for vapor and water are described as follows [41,42]:
where constant

Figure 1: Computational domain
The mesh characteristics are shown in Fig. 2. Meshes of sparse, medium, and fine quality were delineated, with the corresponding grids counts being 90350, 105252 and 125436, respectively. The case (α, σ) = (8◦, 0.8) is conducted with three mesh configurations. The lift coefficient

Figure 2: Mesh details


Figure 3: Pressure coefficients of hydrofoil [43]
The accuracy of the results is further verified through a comparison between the numerical results delineated in this paper and the experimental results presented by Huang et al. [44], as depicted in Fig. 4. The distribution of cavity vapour in different stages exhibits fundamental consistency. Assume that the start time of the cycle is t0 and the duration is Tcycle. At the beginning of the current cycle (t = t0), the cavity vapor engendered during the antecedent cycle has entirely dissipated, instigating the formation of vapor at the upper extremity of the hydrofoil. Subsequently, the cavity vapor adhering to the suction surface of the hydrofoil progressively propagates rearward, and by t = t0 + 0.38Tcycle, it extends to the tail of the hydrofoil. Under the effect of the re-entrant jet, the tail region of the cavitation gradually fractured by t = t0 + 0.58Tcycle. Thereafter, the cavity vapor affixed to the hydrofoil detaches entirely by t = t0 + 0.7Tcycle. Ultimately, the shed cavity vapour gathered above the tail of the hydrofoil by t = t0 + 0.84Tcycle. The accumulated cavity vapour advances downstream within the flow field, undergoing a gradual collapse, thereby marking the incipient formation of cavitation in the subsequent cycle.

Figure 4: Comparison of numerical and experimental results of cavitation periodic evolution process (Left: Experimental of Huang et al. [44]; Right: Numerical result at present)
Upon comparing the computed cavitation area in this study with the experimental findings reported by Huang et al. [44], as illustrated in Fig. 5, it becomes evident that the numerically calculated cavitation area’s development law is largely congruent with the experimental results. The numerical calculation adopts a two-dimensional calculation model, and the cavitation flow in the actual experiment is a three-dimensional model, so the obtained results are biased from the experimental results.

Figure 5: Comparison of cavitation area values with experiments [44]
2.4 The Effects of Reynolds Number
In this section, the influence of Re on the development of cavitation flow is studied by changing the chord length while keeping the velocity and pressure of incoming flow unchanged. The cavitation number


Figure 6: Evolution of cavitation under different Re (Left: Re = 7 × 10⁴; Right: Re = 3.5 × 10⁵)
2.5 The Effects of Turbulence Model
The results obtained by using RANS turbulence model (RNG k-

Figure 7: Evolution of cavitation with RANS turbulence model
3.1 The Growth Process of Vapour Cavity
This section studies the influence of the angle of attack, α, on the evolution process of the vapour cavity. The representation of vapour fraction under α = 6–10° is depicted in Fig. 8. After the complete shedding of the vapor cavity formed in the preceding cycle, the incipient cavity commences growth from the upper edge of the hydrofoil, gradually morphing into a sheet cavity. The size of the shedding cavity cloud gradually increases with the increase of α. The growth of the cavity is inhibited by the shock wave engendered by cavity collapse. Once the shed vapour reached the downstream flow field behind the trailing edge, the inception cavity starts to grow in the upper part of the hydrofoil, with the size of the vapor incrementally enlarging in tandem with the increase of α. The hydrofoil-adsorbed vapor undergoes rearward propagation within the sheet cavity phase. As α increases in conjunction with the thickness of the cavity region, the interface of the cavity becomes progressively more stable.

Figure 8: Cavity cloud under different attack angles
Fig. 9 depicts the pressure coefficients’ distribution on both the pressure and suction surfaces around the hydrofoil as the vapor cavity grows, while considering different attack angles α. In the case of α = 6°, pressures on both the suction and pressure surfaces experience a substantial rise during the stage of vapour cavity shedding. This increase is primarily controlled by the compression wave. In the growth stage of the inception cavity, pressure fluctuations of the suction surface of the hydrofoil are observed as cavity bubbles incessantly expand and collapse above the hydrofoil’s median. The pressure on the suction surface is lower than that in the process of cavity bubble growth, particularly in stage of the sheet cavitation. The pressure distribution over the hydrofoil surface remains consistent between α = 8° and α = 6°. Nevertheless, as the angle of attack reaches α = 10°, the detached vapour cavity expands in size, leading to significant fluctuations in the pressure on the hydrofoil suction surface during the first stage of cavitation formation. As α increases, the cavity size gradually expands, and the pressure fluctuation on the suction surface of the hydrofoil becomes more intense.

Figure 9: Pressure coefficients of the growth process of cavitation
Fig. 10 illustrates the distribution of vortex areas throughout various stages of cavitation development, with varied values of α. The intensity of the vortex within the cavity region is pronounced. During the cavity shedding stage, the vortex region is predominantly localized above the tail section of the hydrofoil. The vortex flow intensity amplifies with the increase of α. In the vicinity of the hydrofoil head, small scale vortices continuously appear in the head area of the hydrofoil. The size of the vortex expands according to the rise in α. As the cavity develops backwards, small scale vortices progressively transform into large scale vortices. The stability of the vortex flow in the cavity area is enhanced when the angle α is set to 10°.
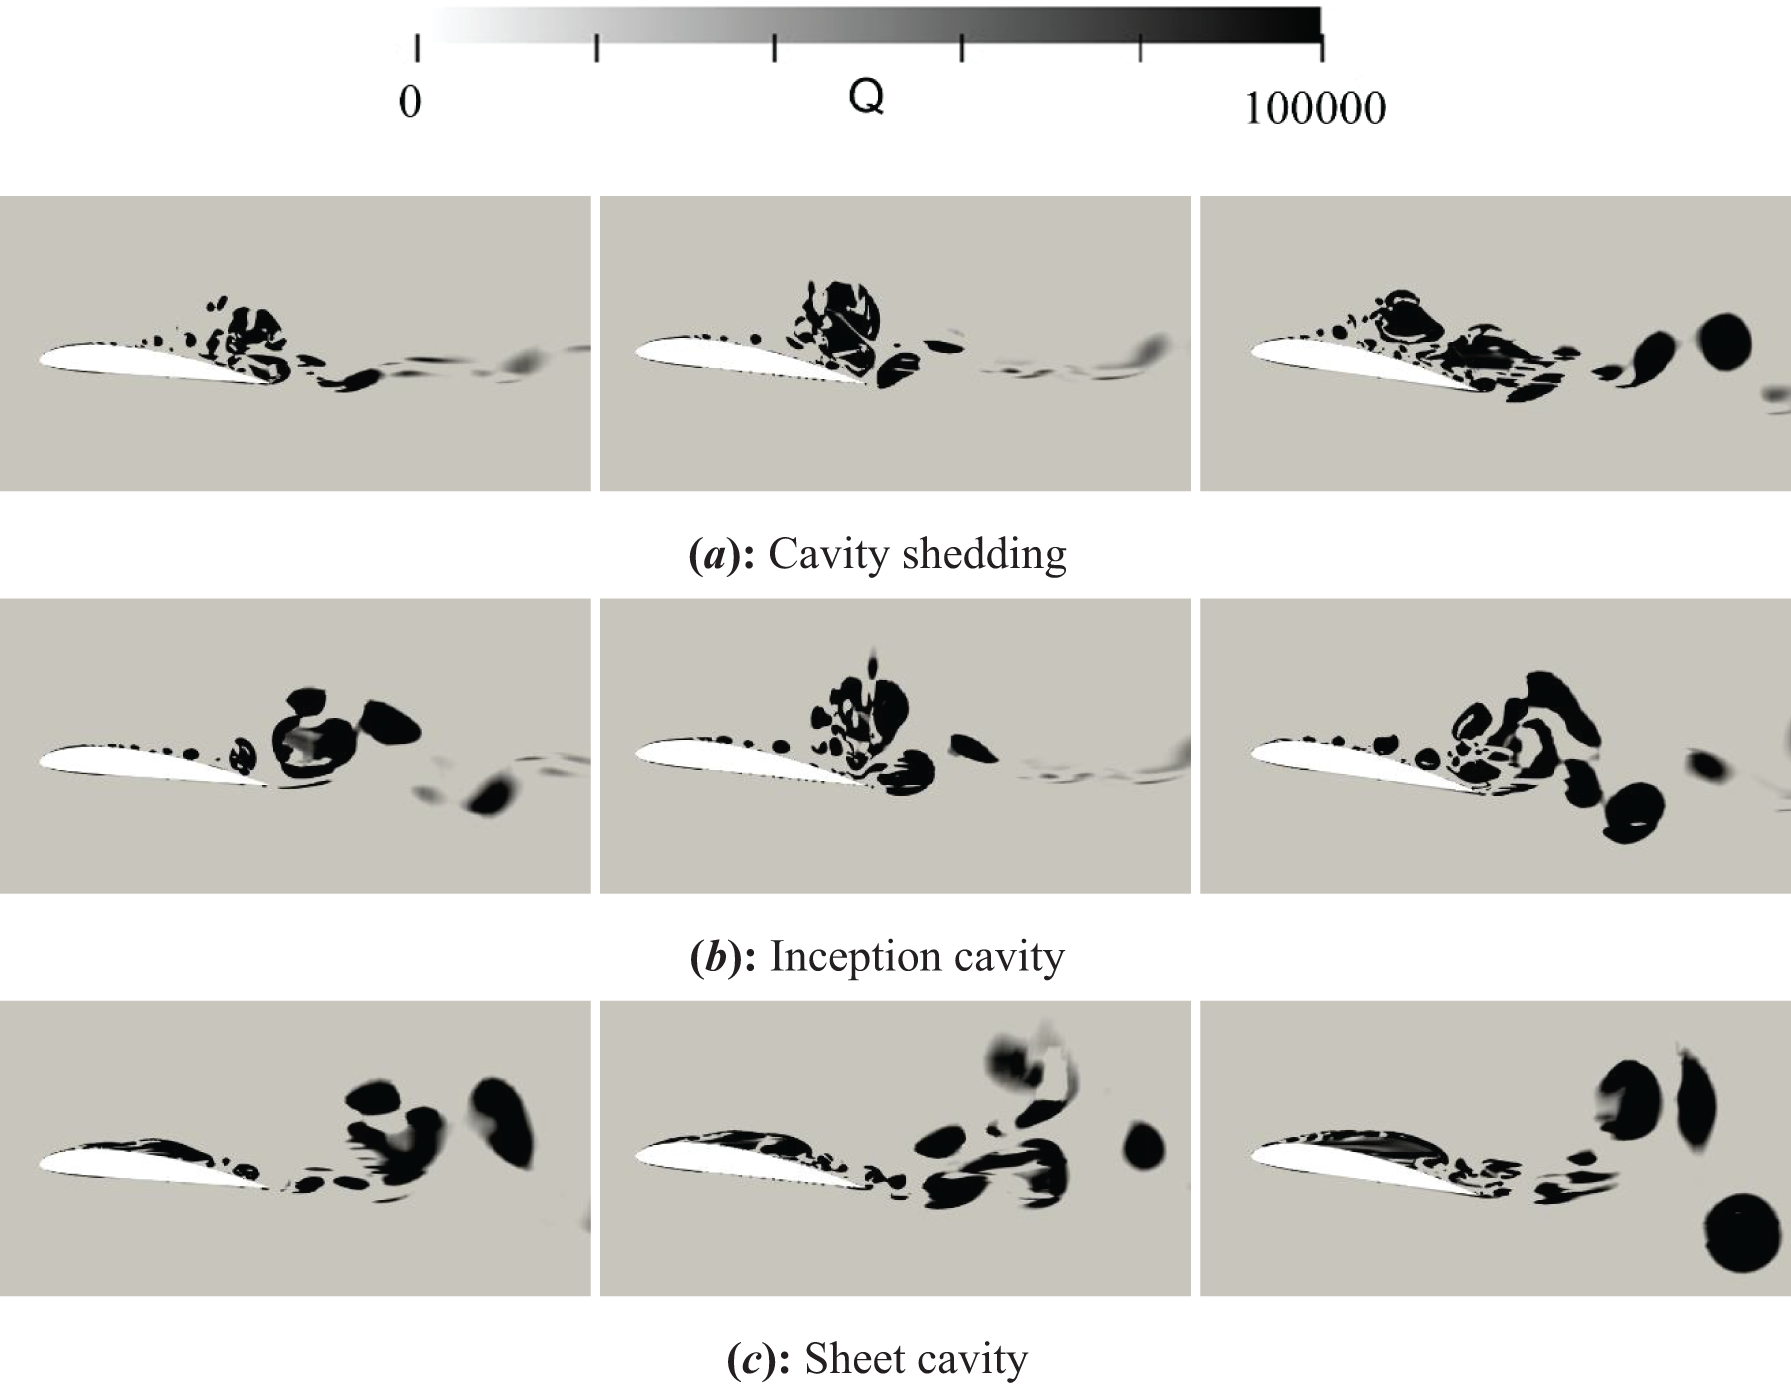
Figure 10: Vortex region distribution (Left: α = 6°; Middle: α = 8°; Right: α = 10°)
3.2 The Shrink Process of Vapour Cavity
The shrink process of vapour cavity under different attack angles is shown in Figs. 11–13. The black line depicted within the figures demarcates the boundary where the gas phase fraction is equal to 0.4, and the direction indicated by the arrow is the velocity direction of the local flow field. The re-entrant jet formed in the tail region of the hydrofoil suction surface incrementally advances forward. Under the effect of re-entrant jet, the tail area of cavity vapour gradually uplifted and fractured. When the angle of attack α = 6°, the tail area of the cavity is on the verge of detachment under the impetus of the re-entrant jet. The shed vapour cavity forms a vortex flow above the tail area of the hydrofoil under the combined effect of the re-entrant jet and incoming flow (Fig. 11a). As the vapor at the tail of the cavity severs, the re-entrant jet intensifies and persists in its forward development (Fig. 11b). Under the influence of the re-entrant jet, the cloud cavity affixed to the hydrofoil commences contraction, and the side of the cavity interfacing with the flow field fractures under the compounded effects of the re-entrant and incoming flows. As α increases, there is a corresponding improvement in the integrity of the interface between the cavity and the liquid. Additionally, the thickness of the tail cavity gradually increases.

Figure 11: Re-entrant jet and vapour fracture of α = 6°

Figure 12: Re-entrant jet and vapour fracture of α = 8°

Figure 13: Re-entrant jet and vapour fracture of α = 10°
The phenomenon under examination pertains to the behavior of vapor adhered to a hydrofoil, observing a progressive contraction towards the forefront until a complete detachment within the head cavity of hydrofoil is realized. Fig. 14 shows the precise moment preceding the complete detachment, showcasing the liquid phase fraction distribution through a cloud image. The cavity vapour at the tail of the foils has gradually broken up. However, cavity vapour adhering to the upper edge of the hydrofoil remains partially attached. When the angle of attack α = 6°, the resulting shed cavity manifests as elongated and level. It is discerned that a decrement in α accelerates the collapse of the vapor cavity. In contrast, at α = 8°, the collapse rate of the cavity reduces compared with that of 6°. Under the condition of α = 10°, the shed vapour accumulates in the tail of the hydrofoil. There exists a clear and direct correlation between the increment of the attack angle and the thickening of the collapsed cavity. The hydrofoil pressure distribution curve under different attack angles is shown in Fig. 15. In general, the pressure distribution is essentially identical between them. In particular, as α increases at the head position of the hydrofoil suction surface, the pressure gradually rises in the center and in front of the hydrofoil, but gradually decreases in the tail region.

Figure 14: Cavity shedding

Figure 15: Pressure coefficients under different attack angles
3.3 Pressure Analysis of Measuring Point on Suction Surface
Pressure measurement points were strategically positioned on the surface of the hydrofoil to facilitate the analysis of the stress conditions at different positions on the upper surface of the hydrofoil. The specific locations of these measurement points are depicted in Fig. 16.

Figure 16: The distribution of measuring points
Pertaining to five discrete measurement sites over the course of an entire cycle, Fig. 17 shows the time-domain diagram of pressure variations corresponding to 5 distinct measurement points throughout a complete cycle. Initially, there is a rearward development of the cavity, during which the pressure remains relatively stable. As the cavity vapor commences detachment from the hydrofoil, pressure fluctuations are first recorded at the tail of the hydrofoil. Along the suction side of the hydrofoil, the pressure fluctuation was also detected at each pressure measuring point. Notably, as the position of the measurement point is shifted rearward along the suction side of the hydrofoil, the duration of pressure fluctuations extends. Li et al. [46] also found that the cavitation area was mainly concentrated in the middle and rear part of the hydrofoil in the experimental study. This implies that there might be a relationship between the force applied to the measurement locations situated on the suction surface of the hydrofoil and the duration for which the cavity vapor is covered. The cavity vapor has the potential to mitigate the surface pressure impact of the hydrofoil. Moreover, the shed cavitation remains within the hydrofoil’s tail region due to the vortex’s influence. This highlights the complex interplay of hydrodynamic phenomena by revealing a prolonged duration of pressure fluctuation in the hydrofoil’s tail.

Figure 17: Time domain of measuring point pressure
Fig. 18 corresponds to the frequency domain analysis of pressure at specified measurement point. The pressure period for the frequency domain analysis is equal to 5 cavity development cycles. Notably, points P1, P2 and P5 exhibit a higher frequency of pressure pulsations. This heightened frequency is correlated with the inception and growth of the cavity at the head area of the hydrofoil, as well as the subsequent cavity shedding occurring within the tail region of the hydrofoil. During the growth and shedding phase of the cavity, compression waves are radiated. A comparative analysis reveals that the collapse duration of the inception cavity is abbreviated relative to the shedding cavity, thereby engendering a more pronounced high-frequency component in the hydrofoil’s head area. With lower detection of high-frequency pressure pulsations, sites P3 and P4 illustrate the spatial variability of hydrodynamic interactions throughout the hydrofoil and exhibit a diminished impact. The maximum pressure frequency, approximately 43 Hz, corresponded to the hydrofoil’s cavitation evolution period.
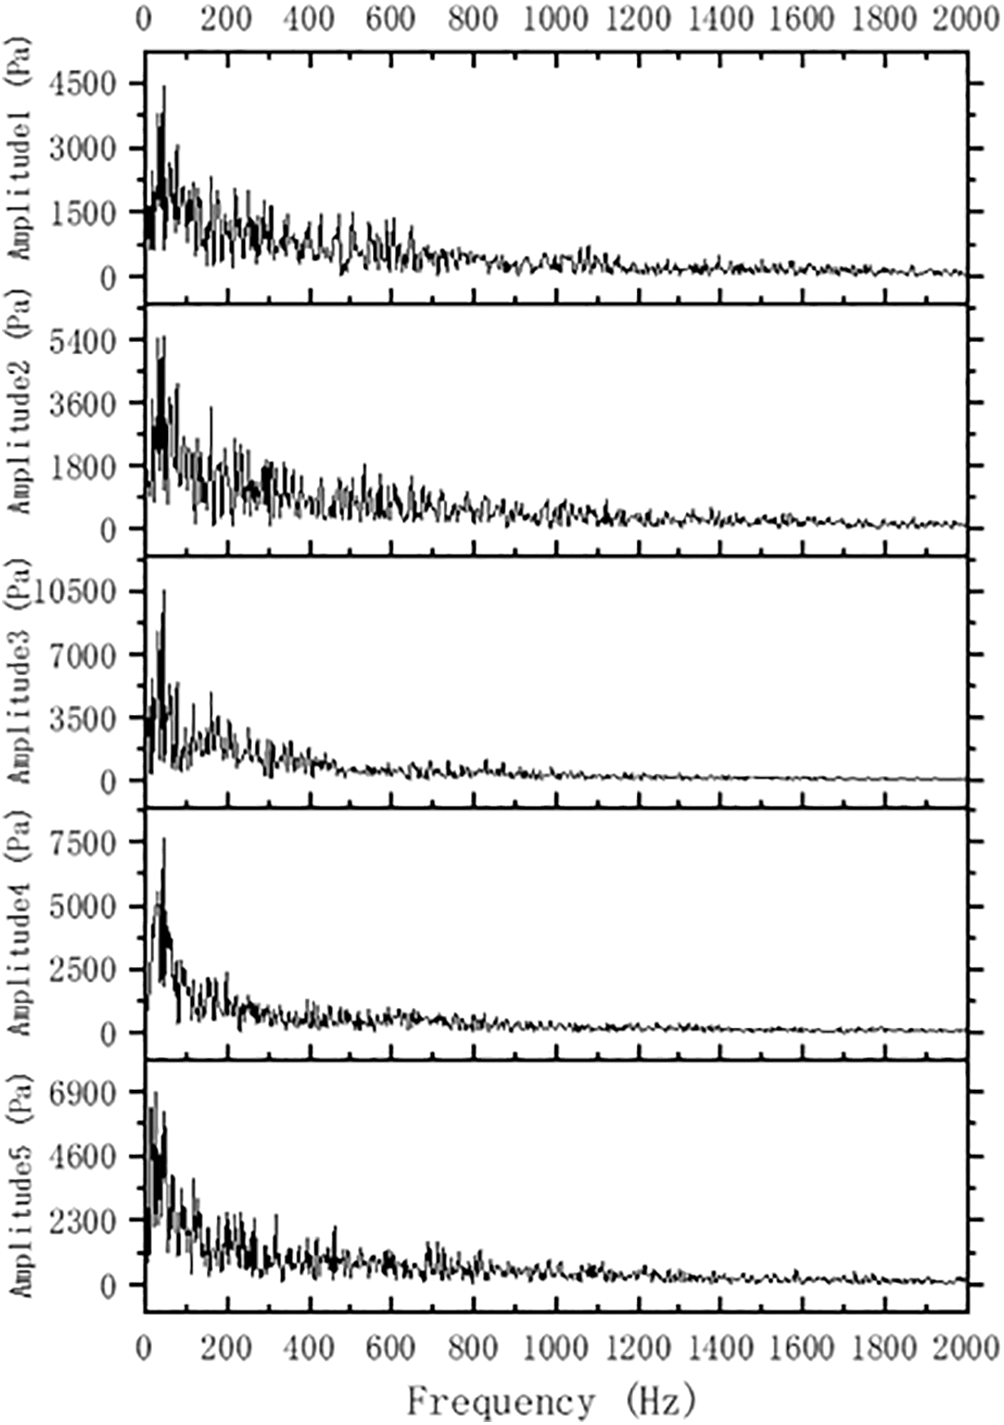
Figure 18: Frequency domain of measuring point pressure
In this work, the influence of the attack angle α on the evolution of the cavitation around hydrofoil is studied based on the Finite Volume and Large Eddy Simulation methodologies. The comprehensive analysis leads to the following conclusions:
(1) The initiation of cavitation is observed in the proximal region of the hydrofoil, subsequently leading to the formation of a sheet cavity as the vapour, adhering to the hydrofoil, progressively extends rearward. The disintegration of the cavity vapour in the distal region signifies the commencement of the detachment of the cavity from the suction surface of the hydrofoil, ultimately resulting in a complete fall-off. When the cavitation number remains constant, the Reynolds number exhibits minimal influence on the process of cavity evolution.
(2) The re-entrant jet induces scattering in the tail region of the cavity, which initiates the formation of a vortex at the hydrofoil’s tail due to the combined force of the return jet and incoming flow. Opposed to the increase in cavity vapor, the compression wave generated by the cavity shedding functions as a deterrent.
(3) A comprehensive study of the fluctuation of α demonstrates a clear association with a progressive increase in the thickness of the cavity. Concurrently, there is a progressive increase in the stability of the cavity. A more drastic cavitation flow can be obtained by increasing the Angle of attack. Within the anterior region of the hydrofoil’s suction surface, a gradual increment in pressure is discerned, while a contrasting gradual decrement in pressure is exhibited within the posterior region. In erosion protection, our attention lies on the specific regions where cavitation is generated and subsequently collapses.
The current investigation into the dynamics of re-entrant jets and compression waves significantly augments the existing body of knowledge surrounding the evolutionary mechanisms of cloud cavitation. Further, some dimensionless relationships between angle of attack and cavitation thickness would be conducted. The current investigation of the hydrofoil pressure coefficient across disparate stages of cavitation evolution furnishes a robust reference framework, potentially serving as a cornerstone for subsequent investigative endeavors into the phenomena of cavitation erosion. This exploration not only elucidates the underlying mechanisms but also propounds a fertile ground for further academic inquiry into optimizing hydrofoil design and understanding cavitation-induced erosion. As a result, it contributes to the wider academic discussion on fluid dynamics and hydrofoil engineering.
Acknowledgement: The authors acknowledge the supports provided by the National Natural Science Foundation of China and China Postdoctoral Science Foundation.
Funding Statement: The paper is supported by the National Natural Science Foundation of China (Nos. 12202011, 12332014) and China Postdoctoral Science Foundation (No. 2022M710190).
Author Contributions: The authors confirm contribution to the paper as follows: study conception and design: Di Peng, Jiale Yan; data collection: Di Peng, Guoqing Chen; analysis and interpretation of results: Di Peng, Shiping Wang; draft manuscript preparation: Di Peng, Jiale Yan. All authors reviewed the results and approved the final version of the manuscript.
Availability of Data and Materials: The data used in this study are from [17,43,44], and the data cited are all stated in the paper. There is no unavailable data cannot be released in this paper.
Conflicts of Interest: The authors declare that they have no conflicts of interest to report regarding the present study.
References
1. Russell, P., Barbaca, L., Venning, J. A., Pearce, B. W., Brandner, P. A. (2020). Measurement of nuclei seeding in hydrodynamic test facilities. Experiments in Fluids, 61(3), 1–18. [Google Scholar]
2. Knapp, R. T., Daily, J. W., Hammitt, F. G. (1972). Cavitation. Journal of Fluid Mechanics, 54(1), 189–191. [Google Scholar]
3. Franc, J. P., Michel, J. M. (2006). Fundamentals of cavitation. USA: Springer Science & Business Media. [Google Scholar]
4. Wang, S. P., Zhang, A. M., Liu, Y. L., Zhang, S., Cui, P. (2018). Bubble dynamics and its applications. Journal of Hydrodynamics, 30(6), 975–991. [Google Scholar]
5. Schenke, S., Melissaris, T., Van, T. J. C. (2019). On the relevance of kinematics for cavitation implosion loads. Physics of Fluids, 31(5), 052102. [Google Scholar]
6. Qin, Y. Z., Wang, Y., Wang, Z. K., Yao, X. L. (2021). The influence of various structure surface boundary conditions on pressure characteristics of underwater explosion. Computer Modeling in Engineering & Sciences, 126(3), 1093–1123. https://doi.org/10.32604/cmes.2021.012969 [Google Scholar] [CrossRef]
7. Huang, B., Wang, G. Y., Wang, F. F., Gao, D. M. (2011). Experimental investigation on flow field structure of unsteady cavitation flow. Journal of Experimental Mechanics, 26(4), 417–424 (In Chinese). [Google Scholar]
8. Huang, B., Wang, G. Y. (2011). Experimental and numerical investigation of unsteady cavitating flows through a 2D hydrofoil. Science China Technological Sciences, 54(7), 1801–1812. [Google Scholar]
9. Liu, X., Chen, X. Y., Kang, R. Y., Shen, X. J., Ni, B. (2020). A coupled cavitation model in an oscillatory oil squeeze film. Computer Modeling in Engineering & Sciences, 123(1), 129–152. https://doi.org/10.32604/cmes.2020.07836 [Google Scholar] [CrossRef]
10. Zhan, L. L., Wang, S. P., Li, T., Zhang, S., Zhang, A. M. (2020). Numerical investigation on the cavitation instability induced by local collapse around a 2D CLARK-Y hydrofoil. Applied Ocean Research, 102(9), 102300. [Google Scholar]
11. Ye, J. C., Zhang, J., Wang, Y. B., Zhao, P. (2023). A numerical investigation of supercavitation vehicle’s hydrodynamic noise. Journal of Marine Science and Engineering, 11(5), 1004. [Google Scholar]
12. Arad, L. L., Gany, A. (2023). Theoretical study of supercavitation bubble formation based on gillespie’s algorithm. Journal of Marine Science and Engineering, 11(4), 768. [Google Scholar]
13. Cheng, H. Y., Long, X. P., Ji, B., Peng, X. X., Farhat, M. (2021). A new Euler-Lagrangian cavitation model for tip-vortex cavitation with the effect of non-condensable gas. International Journal of Multiphase Flow, 134(2), 103441. [Google Scholar]
14. Rayleigh, L. (1917). On the pressure developed in a liquid during the collapse of a spherical cavity. Philosophical Magazine, 34(200), 94–98. [Google Scholar]
15. Plesset, M. W. (1949). The dynamics of cavitation bubbles. Journal of Applied Mechanics, 16(3), 277–282. [Google Scholar]
16. Zhang, A. M., Li, S. M., Cui, P., Li, S., Liu, Y. L. (2023). A unified theory for bubble dynamics. Physics of Fluids, 35(3), 033323. [Google Scholar]
17. Wang, G. Y., Senocak, I., Shyy, W. (2001). Dynamics of attached turbulent cavitating flows. Progress in Aerospace Sciences, 37(6), 551–581. [Google Scholar]
18. Huang, B., Wang, G. Y., Zhao, Y. (2014). Numerical simulation unsteady cloud cavitating flow with a filter-based density correction model. Journal of Hydrodynamics, 26(1), 26–36. [Google Scholar]
19. Callenaer, M., Franc, J., Michel, J., Riondet, M. (2001). The cavitation instability induced by the development of a re-entrant jet. Journal of Fluid Mechanics, 444, 223–256. [Google Scholar]
20. Wang, C. C., Huang, B., Wang, G. Y., Zhang, M. D., Ding, N. (2017). Unsteady pressure fluctuation characteristics in the process of breakup and shedding of sheet/cloud cavitation. International Journal of Heat and Mass Transfer, 114(3), 769–785. [Google Scholar]
21. Wang, C. C., Huang, B., Zhang, M. D., Wang, G. Y., Wu, Q. et al. (2018). Effects of air injection on the characteristics of unsteady sheet/cloud cavitation shedding in the convergent-divergent channel. International Journal of Multiphase Flow, 106(9), 1–20. [Google Scholar]
22. Harish, G., Simo, A. M., Steven, L. C. (2016). Bubbly shock propagation as a mechanism for sheet-to-cloud transition of partial cavities. Journal of Fluid Mechanics, 802(4), 37–78. [Google Scholar]
23. Wang, C. C., Huang, B., Wang, G. Y., Duan, Z. P., Ji, B. (2018). Numerical simulation of transient turbulent cavitating flows with special emphasis on shock wave dynamics considering the water/vapor compressibility. Journal of Hydrodynamics, 30(4), 573–591. [Google Scholar]
24. Gubaidullin, D. A., Fedorov, Y. V. (2015). Sound waves in liquids with polydisperse vapor-gas and gas bubbles. Fluid Dynamics, 50(1), 61–70. [Google Scholar]
25. Lin, M. D., Cui, G. X., Zhang, Z. S., Xu, C. X., Huang, W. X. (2017). Large eddy simulation on the evolution and the fast-time prediction of aircraft wake vortices. Chinese Journal of Theoretical and Applied Mechanics, 49(6), 1185–1200. [Google Scholar]
26. Ferenc, H., Sandra, K., Walter, G., Zoltán, P., György, P. et al. (2013). The effect of high viscosity on compressible and incompressible Rayleigh-plesset-type bubble models. International Journal of Heat and Fluid Flow, 42(8), 200–208. [Google Scholar]
27. Lv, M., Ning, Z., Sun, C. H. (2016). Study on the growth and collapse of cavitation bubble within a droplet. Chinese Journal of Theoretical and Applied Mechanics, 48(4), 857–866. [Google Scholar]
28. Shamsborhan, H., Coutier, D. O., Caignaert, G., Nour, F. A. (2010). Experimental determination of the speed of sound in cavitating flows. Experiments in Fluids, 49(4), 1359–1373. [Google Scholar]
29. Leroux, J. B., Astolfi, J. A., Yves, B. J. (2004). An experimental study of unsteady partial cavitation. Journal of Fluids Engineering, Transactions of the ASME, 126(1), 94–101. [Google Scholar]
30. Ji, B., Cheng, H. Y., Huang, B., Luo, X. W., Peng, X. X. et al. (2019). Research progresses and prospects of unsteady hydrodynamics characteristics for cavitation. Advances in Mechanics, 49, 201906 (In Chinese). [Google Scholar]
31. Huang, B., Wang, G. Y., Yu, Z., Wu, Q. (2013). Physical and numerical investigation on transient cavitating flows. Science China Technological Sciences, 56, 2207–2218. [Google Scholar]
32. Coutier-Delgosha, O., Patella, R. F., Reboud, J. L. (2003). Evaluation of the turbulence model influence on the numerical simulations of unsteady cavitation. Journal of Fluids Engineering, 125(1), 38–45. [Google Scholar]
33. Zhao, X. T., Cheng, H. Y., Ji, B. (2022). LES investigation of the cavitating hydrofoils with various wavy leading edges. Ocean Engineering, 243, 110331. [Google Scholar]
34. Pendar, M. R., Esmaeilifar, E., Roohi, E. (2020). LES study of unsteady cavitation characteristics of a 3-D hydrofoil with wavy leading edge. International Journal of Multiphase Flow, 132, 103415. [Google Scholar]
35. He, Z. X., Chen, Y. H., Leng, X. Y., Wang, Q., Guo, G. M. (2016). Experimental visualization and LES investigations on cloud cavitation shedding in a rectangular nozzle orifice. International Communications in Heat and Mass Transfer, 76, 108–16. [Google Scholar]
36. Pendar, M. R., Roohi, E. (2018). Cavitation characteristics around a sphere, an LES investigation. International Journal of Multiphase Flow, 98, 1–23. [Google Scholar]
37. Sauer, J., Winkler, G., Schnerr, G. H. (2000). Cavitation and condensation-common aspects of physical modeling and numerical approach. Chemical Engineering & Technology, 23(8), 663–666. [Google Scholar]
38. Kiran, J., Abhilash, J. C. (2020). Assessment of SGS models for large eddy simulation (LES) of a Stratified Taylor–Green vortex. Flow, Turbulence and Combustion, 106(6), 37–60. [Google Scholar]
39. Payri, R., Tormos, B., Gimeno, J., Bracho, G. (2010). The potential of large eddy simulation (LES) code for the modeling of flow in diesel injectors. Mathematical & Computer Modelling, 52(7–8), 1151–1160. [Google Scholar]
40. Smagorinsky, J. (1963). General circulation experiments with the primitive equations. Monthly Weather Review, 91(3), 99–164. [Google Scholar]
41. Arndt, R. E. A., Song, C. C., Kjeldsen, M., He, J., Keller, A. (2000). Instability of partial cavitation: A numerical/experimental approach. Symposium on Naval Hydrodynamics, Val de Reuil, France. [Google Scholar]
42. Park, S., Rhee, S. H. (2015). Comparative study of incompressible and isothermal compressible flow solvers for cavitating flow dynamics. Journal of Mechanical Science and Technology, 29(8), 3287–3296. [Google Scholar]
43. Kim, J., Lee, J. S. (2015). Numerical study of cloud cavitation effects on hydrophobic hydrofoils. International Journal of Heat & Mass Transfer, 83(4), 591–603. [Google Scholar]
44. Huang, B., Young, Y. L., Wang, G. Y., Shyy, W. (2013). Combined experimental and computational investigation of unsteady structure of sheet/cloud cavitation. Journal of Fluids Engineering, Transactions of the ASME, 135(7), 071301. [Google Scholar]
45. Chang, S. M., Ding, E. B., Sun, C., Wang, C., Liu, G. S. (2022). Analysis of cavitation number and scale effect of hydrofoil cavitation initiation. Chinese Journal of Ship Research, 17(3), 178–186 + 204 (In Chinese). [Google Scholar]
46. Li, Z. R., Pourquie, M., Terwisga, T. V. (2014). Assessment of cavitation erosion with a URANS method. Journal of Fluids Engineering, 136(4), 041101. [Google Scholar]
Cite This Article
 Copyright © 2024 The Author(s). Published by Tech Science Press.
This work is licensed under a Creative Commons Attribution 4.0 International License , which permits unrestricted use, distribution, and reproduction in any medium, provided the original work is properly cited.
 Downloads
 Citation Tools