
 Submit a Paper
 Propose a Special lssue
 Open Access
ARTICLE

Scheme Based on Multi-Level Patch Attention and Lesion Localization for Diabetic Retinopathy Grading
1 School of Computer and Communication Engineering, Changsha University of Science and Technology, Changsha, China
2 Hunan Province People’s Hospital (The First Affiliated Hospital of Hunan Normal University), Changsha, China
3 The First Affiliated Hospital of Guangxi Medical University, Nanning, China
4 International Graduate Institute of AI, National Yunlin University of Science and Technology, Yunlin, China
5 Department of Electrical and Computer Engineering, Lebanese American University, Bayrut, Lebanon
* Corresponding Author: Arun Kumar Sangaiah. Email:
(This article belongs to the Special Issue: Smart and Secure Solutions for Medical Industry)
Computer Modeling in Engineering & Sciences 2024, 140(1), 409-430. https://doi.org/10.32604/cmes.2024.030052
Received 20 March 2023; Accepted 15 September 2023; Issue published 16 April 2024
A correction of this article was approved in:
Correction: Scheme Based on Multi-Level Patch Attention and Lesion Localization for Diabetic Retinopathy Grading
Read correction
 View Full Text
 Download PDF
Abstract
Early screening of diabetes retinopathy (DR) plays an important role in preventing irreversible blindness. Existing research has failed to fully explore effective DR lesion information in fundus maps. Besides, traditional attention schemes have not considered the impact of lesion type differences on grading, resulting in unreasonable extraction of important lesion features. Therefore, this paper proposes a DR diagnosis scheme that integrates a multi-level patch attention generator (MPAG) and a lesion localization module (LLM). Firstly, MPAG is used to predict patches of different sizes and generate a weighted attention map based on the prediction score and the types of lesions contained in the patches, fully considering the impact of lesion type differences on grading, solving the problem that the attention maps of lesions cannot be further refined and then adapted to the final DR diagnosis task. Secondly, the LLM generates a global attention map based on localization. Finally, the weighted attention map and global attention map are weighted with the fundus map to fully explore effective DR lesion information and increase the attention of the classification network to lesion details. This paper demonstrates the effectiveness of the proposed method through extensive experiments on the public DDR dataset, obtaining an accuracy of 0.8064.Keywords
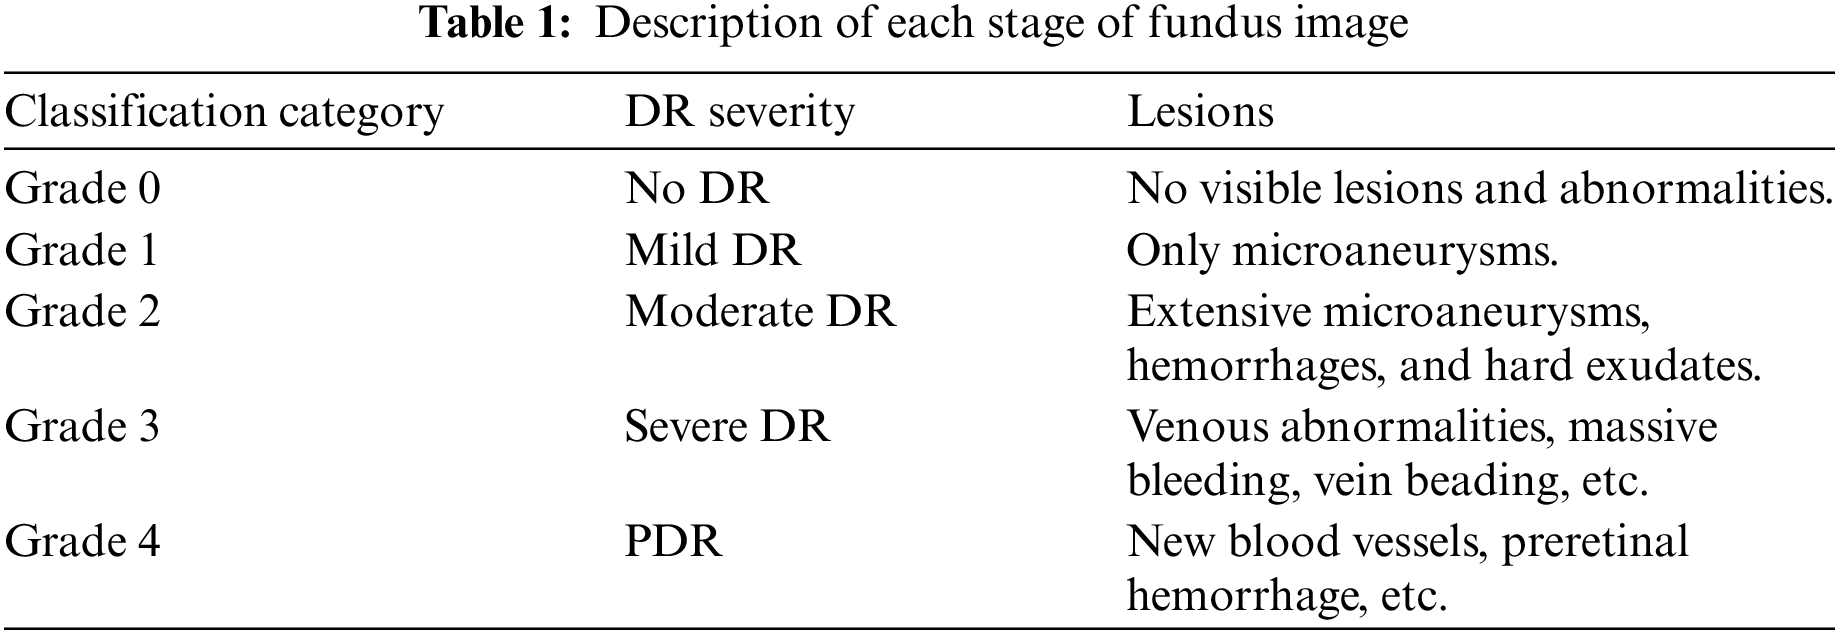
Diabetic retinopathy (DR) is a microvascular disease and a very common complication of diabetic eye diseases. It is recognized as one of the main factors that endanger human vision worldwide, which seriously affects people’s production and life [1,2]. According to the International Clinical DR Protocol [1,3], DR can be divided into two stages according to the severity: non-proliferative diabetes retinopathy (NPDR) and proliferative diabetes retinopathy (PDR), These two stages can be divided into five grades, as shown in Fig. 1, which are no retinopathy (grade 0), mild non-proliferative retinopathy (grade 1), moderate retinopathy (grade 2), severe NPDR (grade 3), and proliferative DR (grade 4). The symptoms and signs of DR at different stages are usually different. For non-proliferative DR patients, many different DR symptoms can be observed in their retinas, including micro angioma (MA), hemorrhage (HE), and exudation (EX). For patients with proliferative DR, retinal damage can promote the growth of new blood vessels. In conclusion, as shown in Table 1, DR classification usually depends on the number and size of different related pathological manifestations and complications. Therefore, the different types of lesion features in the fundus map are an important basis for determining DR grading, and an effective diagnosis scheme for diabetic retinopathy should reasonably consider the impact of the different types of lesion features in the fundus map on grading diagnosis.

Figure 1: Diagram of various stages of DR: (a) no retinopathy (grade 0); (b) mild non-proliferative retinopathy (grade 1); (c) moderate retinopathy (grade 2); (d) severe NPDR (grade 3); (e) proliferative DR (grade 4)
Patients with proliferative DR have a 60% chance of developing severe vision loss within five years [1]. Regular fundus screening can help detect the condition and reduce the risk of blindness. According to the World Health Organization’s first World Report on Vision (2019) [3], globally, at least 2.2 billion people are visually impaired or blind, of which at least 1 billion could have been prevented. One of the main drivers of this is DR [4,5]. Under the requirements of huge screening tasks, the use of computer-aided diagnosis algorithms can effectively avoid misdiagnosis, save medical resources, and reduce costs. Therefore, this paper proposes a diagnosis method for DR based on a multi-level patch attention generator and a lesion localization module. The method in this paper consists of three parts: Multi-level patch attention generator (MPAG) extracts local features for lesion detection, at the same time, the local features are used to generate attention weights and build a multi-level patch weight attention map; the Lesion localization module (LLM) can indicate the lesions of the fundus map, and build a global attention weight map containing lesion localization information; the global network uses global image features for DR classification diagnosis. In this paper, we construct a weighted lesion map that gives unbalanced attention to different locations in fundus images through the first two modules and use it to train a global graded diagnostic network. The weighted lesion map is derived from a fundus map that integrates global lesion-indicative attention as well as multi-level patch attention. In this way, there will be more attention to the patches where lesions are present, as well as more severely diseased patches.
The main contributions of this paper are summarized in the following three points:
• This paper proposed a DR diagnostic framework that fuses a multi-level patch attention mechanism and a lesion location network, which can not only detect, locate, and indicate lesion information, but also grade the severity of DR. In this paper, we use a staged Deep Convolutional Neural Network (DCNN) to learn more complete deep features of fundus images, integrating global lesion localization attention weights and local multi-level patch attention weights for global and local scale DR analysis.
• This paper proposed a new multi-level patch attention mechanism, which gives more refined unbalanced attention to lesion regions of different degrees in patch-level images by grading. To a certain extent, the submersion of relatively fine lesion information in the fundus map is avoided, and this unbalanced weighting scheme significantly improves the utilization of lesion information in the DR grading algorithm.
• This paper proposes for the first time the use of lesion target detection results to adapt to the grading diagnosis of DR fundus map. The ablation study of each module experimentally proves the contribution of lesion characteristics to the grading of DR severity. The proposed diagnostic scheme achieves an accuracy of 0.8064, a kappa value of 0.7420, and an area under the curve (AUC) value of 0.905 in the test on the DDR dataset.
The rest of this paper is organized as follows: In related work, existing methods for intelligent diagnosis of DR are investigated. In Methods, the paper presents the proposed method explicitly. In the experimental section, we introduce the dataset used for the experiments and report the experimental results and the comparison with the results of existing methods. Finally, conclusions are drawn and future work is described in the conclusions.
The research on intelligent diagnosis methods for DR is an important task in the field of medical image analysis, and many researchers at home and abroad have carried out a lot of related work.
2.1 Traditional DR Assisted Diagnosis
The traditional DR-assisted detection method includes two main steps: one is to extract pathological features. In traditional methods, pathological features such as vessel area and exudate are mainly extracted by morphological methods [6,7]; the second is to design Classifiers, such as the use of support vector machine algorithm (SVM) to classify and diagnose DR [7].
Although traditional methods can achieve certain results, when faced with huge and diverse data, the extraction process of lesion features will be an extremely complicated task [8].
2.2 Disease Grading with Lesion Detection
In recent years, deep learning technology has demonstrated its important research value and application value in the field of medical image analysis [8]. Most of the DR detection methods tend to use ordinary deep learning models. The Convolutional Neural Network (CNN) architecture [9,10] is often adopted to directly classify the severity of DR fundus images, and train the network model through image-level annotation to achieve automatic detection. However, the end-to-end approach mentioned above only learns from a large amount of image-level annotation data, which cannot guarantee classification accuracy in the case of imbalanced DR data at all levels and low image resolution. Therefore, adversarial learning has also been adopted in image classification tasks to solve the problem of imbalanced data at all levels in DR [11]. Wang et al. [12] proposed a multi-channel-based generative adversarial network (MGAN) model that can generate a series of sub-peak images including effective local features. All sub-fundus images were then merged to obtain the most representative features of the entire fundus image. Zhou et al. [13] proposed a DR generative adversarial network (DR-GAN) to synthesize high-resolution fundus images that can be manipulated with arbitrary grade and lesion information. The proposed retinal generator is conditioned on structure and lesion masks and an adaptive grading vector sampled from the latent grading space, which can be used to control synthetic grading severity.
Furthermore, in the DR grade classification task, attention mechanisms are widely used to extract lesion salient regions from fundus images while automatically ignoring irrelevant parts such as non-lesioned regions and background regions [14,15]. Yang et al. [16] designed a two-stage framework for lesion detection and DR classification using location annotations including MA, HE, and EX combined with attention weights. Lin et al. [17] introduced a lesion detection model that first extracts lesion information, and then uses an attention-based network to fuse raw image and lesion features to identify DR. Wang et al. [18] proposed a deep learning-based upscaling network to simultaneously diagnose DR and highlight suspicious areas. Bodapati et al. [19] proposed a composite deep neural network architecture with a gated attention mechanism for automatic diagnosis of DR. Zhou et al. [20] introduced a collaborative learning framework to optimize the lesion segmentation model and disease grading model in an end-to-end manner, and proposed a lesion attention classification module to improve the accuracy of severity grading. Wu et al. [21] performed segmentation and classification in parallel. The lesion probability map predicted by the segmentation model and the class activation map of the weakly supervised classification model are combined for joint diagnosis. Yang et al. [22] proposed a framework that uses patch-level and image-level annotations synergistically, combined with an attention mechanism for DR severity classification.
Although most of the above-related DR diagnostic studies performed lesion detection and used an attention mechanism, the accuracy of DR grading was improved in this way. However, this ignores the hierarchical refinement of the attention weights for specific regions with multiple lesions, resulting in some lesions with important indications not paying enough attention in the network while the weights of some noise backgrounds are increased. In addition, the indication of lesions in the fundus map is of great significance to patients and doctors in the clinical diagnosis process, and most of the above networks do not locate and display the lesions in the DR fundus map.
Only a few studies have performed lesion localization in the diagnostic task of DR. Alyoubi et al. [23] proposed a fundus image classification and lesion localization system for DR using deep learning. The system includes two models based on deep learning. The first model (CNN512) uses the whole image as the input of the CNN model to predict classification, the second model uses the adopted YOLOv3 [24] model to detect and localize DR lesions, and finally, the two proposed structures CNN512 and YOLOv3 are fused to Classify DR images and localize DR lesions. Redmon et al. established an advanced DR fundus map database and used the YOLO [25] framework to achieve the detection and localization of lesion targets on the dataset.
Although the above-mentioned methods achieve effective localization and indication of specific lesions in the DR fundus map, their localization information has not been exploited to contribute to the diagnosis of DR.
In summary, firstly, traditional DR diagnostic methods are unable to handle large and diverse image data. Secondly, disease grading based on lesion detection does not fully consider the impact of lesion type differences in patient fundus images on grading diagnosis. Existing attention schemes cannot refine the attention weights of image regions containing multiple lesions. Finally, lesion localization information through target detection has not been effectively utilized. Therefore, this paper proposes a diagnosis method of diabetes retinopathy that integrates a multi-level patch attention mechanism and lesion localization. Through the artificial intelligence model based on deep learning, it can effectively process large and diverse image data. In addition, the proposed multi-level patch attention mechanism can comprehensively consider the impact of the lesion type differences on the grading diagnosis, The lesion localization module can effectively utilize the localization results of target detection and contribute to the final grading task. This paper will elaborate on the details of the proposed method in the following sections.
This section will present the details of the proposed DR diagnosis method fusing a multi-level patch attention mechanism and a lesion localization network. As shown in Fig. 2, the proposed algorithm can be divided into the following parts: (a) Orange part: a multi-level patch lesion attention generator for exploring the lesion area and generating optimized multi-level patch attention weights; (b) Green part: a lesion localization module that locates lesions for fundus map and generates lesion-indicating attention weights; (c) Blue part: a DR grading module for diagnosing DR severity in the fundus map.

Figure 2: System framework for the diagnosis of diabetic retinopathy with a fusion of multi-level patch attention mechanism and lesion localization module
3.1 Multi-Level Patch Attention Generator
The MPAG consists of weight-optimized blocks and a local network that generates patch weight probabilities, and aims to explore lesion probability maps relevant to the DR classification task. In the first stage, this paper divides the input original image into patches (first-level patches) through a sliding window. Through the local network, the four-dimensional probability vector and patch label of the corresponding patch is generated according to the lesions existing in the first-level patch. The second stage will judge whether there are multiple types of lesions in the patch according to the probability of the four dimensions. If it exists, the first-level patches are further segmented through the weight optimization block to generate refined weights. If there is only a single type of lesion or no lesion, the weight of the corresponding patch is generated by the maximum probability and the predicted patch label. Finally, the weights of the patches at all levels are spliced by index to obtain the global probability weights.
The four dimensions of the probability vector in this paper correspond to the probabilities of MA, HE, EX, and none of the three types of lesions, respectively. Ideally, the larger the probability value in the probability vector, the greater the probability that the corresponding lesion exists in the corresponding patch. Under this mechanism, Yang et al. [16] proposed a two-stage framework for lesion detection and DR grading that combines attention weight design with lesion location annotation, and a framework that uses patch-level and image-level annotations synergistically [22], combined with attention mechanism for DR severity classification. However, the generation of attention in the above two methods only depends on the largest value in the four-dimensional classification probability of the patch, ignoring the situation that there may be multiple types of lesions in the patch. When there are multiple types of lesions in the patch, lesion attention cannot be further refined to suit the final DR diagnosis task.
In this article, the proposed multi-level patch lesion attention generator consists of a lesion detection backbone network (i.e., local network) and weight optimization block, which can further refine the attention maps corresponding to patches with multiple types of lesions by identifying the types of lesions contained in patches of different sizes (multi-level patches). Details are as follows:
3.1.1 Detection Backbone Network (Local Network)
In the first stage, this paper divides the input image I
3.1.2 Weight Optimization Block
The first-level patch of size h

Figure 3: Weight optimization block framework
First, the weight optimization block discriminates the four-dimensional probability vector generated by the previous image patch through the local network. Determine whether there are multiple probabilities greater than the set probability threshold. Then a series of calculations are performed according to the discriminant situation to obtain the corresponding weight matrix. The selection method of the probability threshold is shown in Fig. 4.

Figure 4: Probability threshold selection method example. The figure shows how to map the x and y values described in this article and use the K-means algorithm to take the threshold
1. When the two predicted probability values are both greater than 0.5 and the distance is within 0.15, this paper considers that the two probabilities are close to each other;
2. In the case where there are multiple probabilities that are close to each other in the predicted four-dimensional probability, let the smallest value among the probabilities being close to each other of the patch be x;
3. In addition, this paper sets a y value for whether there are multiple lesions in the lesion patch label. If there are multiple probabilities in the predicted probability that are close to each other and there are indeed multiple lesions in the patch, y = 1. There are multiple probabilities in the predicted probability that are close to each other but there is only one lesion in the patch, then y = 0.5;
4. Map x and y, and use the K-means algorithm to take the probability threshold;
When only one dimension probability is less than the probability threshold or all four-dimension probabilities are less than the probability threshold, the maximum output probability
When there are multiple probabilities greater than the probability threshold, the first-level patch is input into the weight optimization block, and the image up-sampling operation is performed through the amplification algorithm so that the first-level patch is enlarged four times to obtain the second-level patch. In this paper, the amplification algorithm used in this paper is the cubic convolution interpolation algorithm. The corresponding four-dimensional lesion probability vector
Similarly, after obtaining the four-dimensional probability vector of the second-level patch, it is determined whether there are multiple probabilities that exceed the probability threshold, and if so, the third-level patch weight is further refined through the weight optimization block in the same way. If none, construct the corresponding weighting matrix for the current second-level patch (to get the secondary patch weights).
When constructing the three-level patch weights, this paper does not discriminate the four-dimensional probability vector generated by the three-level patch through the local network. Further refinement of the fourth-level patch weight under the current third-level patch weight will result in the information of some larger lesions being submerged in further segmentation while generating some redundant weight information, which does not significantly improve the model’s performance. Therefore, in practice, for the generation of the third-level patch, this paper directly follows the situation when there is only one dimension in the first-level patch whose probability is less than the probability threshold or when the probabilities of all four dimensions are less than the probability threshold. The three-level patch weights are constructed by taking the maximum output of all three-level patch Soft-max layers and the predicted label value. So far, this paper has made a detailed introduction to the weight generation process. The process is shown in Fig. 5.
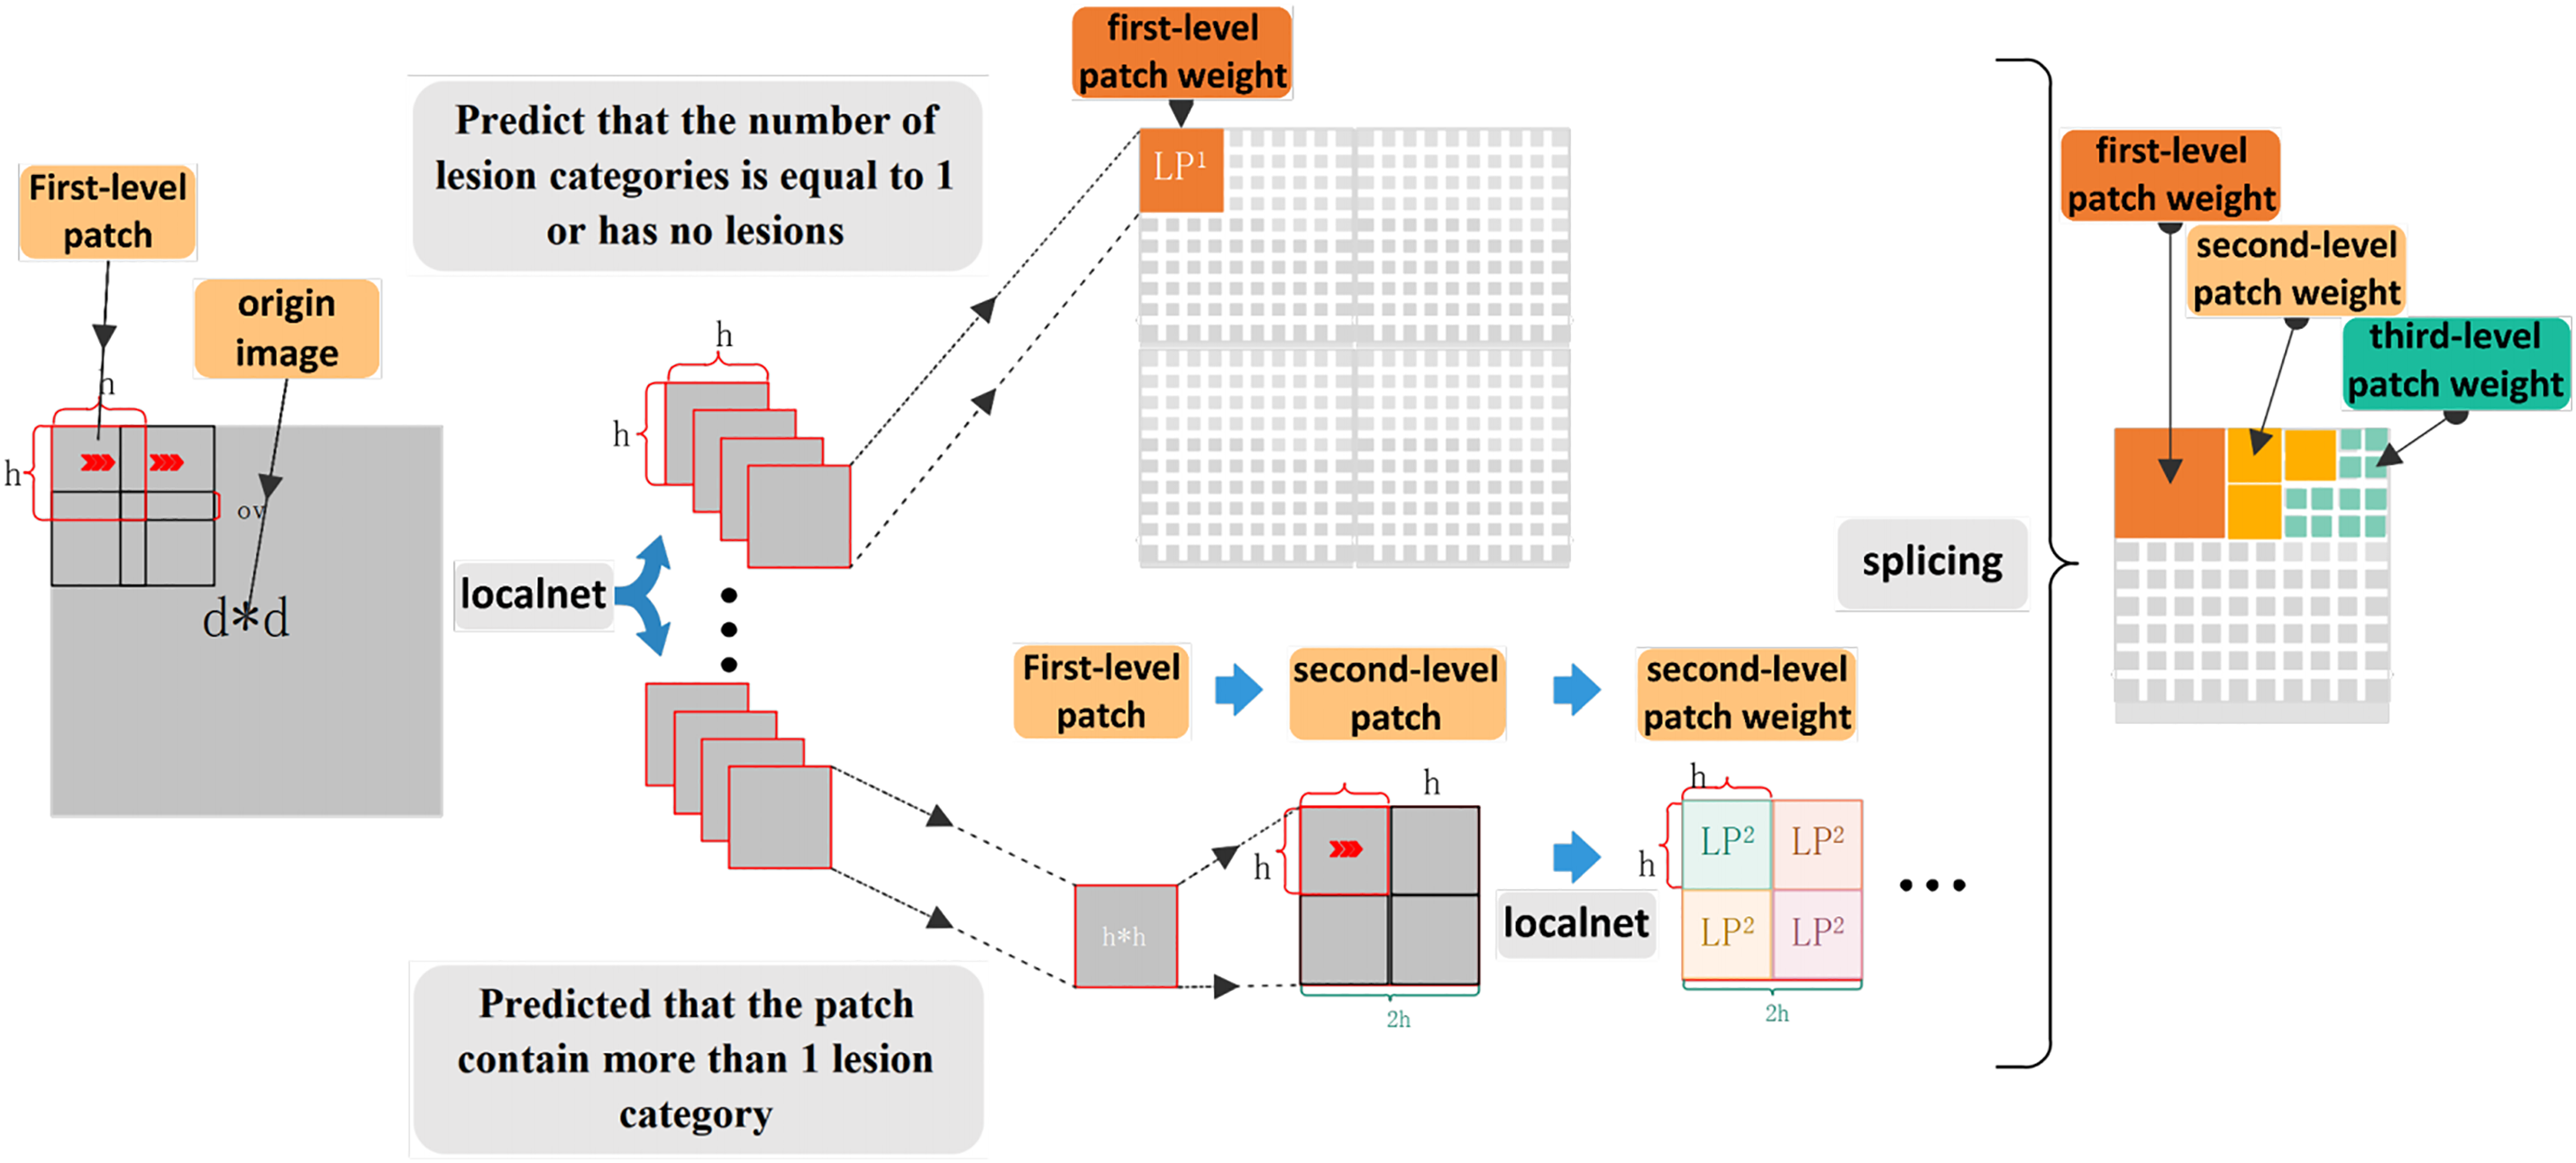
Figure 5: The weight generation model diagram
3.2 Lesion Localization Module
In order to indicate the lesion area that is of great significance to patients and doctors in the process of clinical diagnosis, and to fuse the lesion location information into the attention network to improve the attention of the lesion area in the classification and diagnosis task, this paper designs a Lesion localization module of YOLOv3 network [24].
YOLOv3 is a public object detector model that predicts object bounding boxes and predicts their classes. YOLOv3 contains 53 CONV layers formed in a network named Darknet-53 [24]. In our method, we finetune and retrain all YOLOv3 [24] layers using preprocessed images from the DDR dataset with an input size of 1024
This DR diagnostic grading module is designed to grade the severity of DR according to the International Scale of Clinical Diabetic Retinopathy Variables Table [2]. At present, most diagnostic and treatment guidelines for DR grading provide the following recommendations: for patients without or with mild DR, annual screening should be conducted; for patients with moderate, severe, or more severe DR, repeated examinations and referral to ophthalmologists should be conducted within a few months or even weeks [2]. Considering the changes in the recommended DR screening management method based on the development of the patient’s disease level, we set up two types of classification modules, including a five-level classification according to the International Table of Clinical Diabetic Retinopathy Variables [2] and a binary classification task of classifying fundus images into normal images and referential DR.

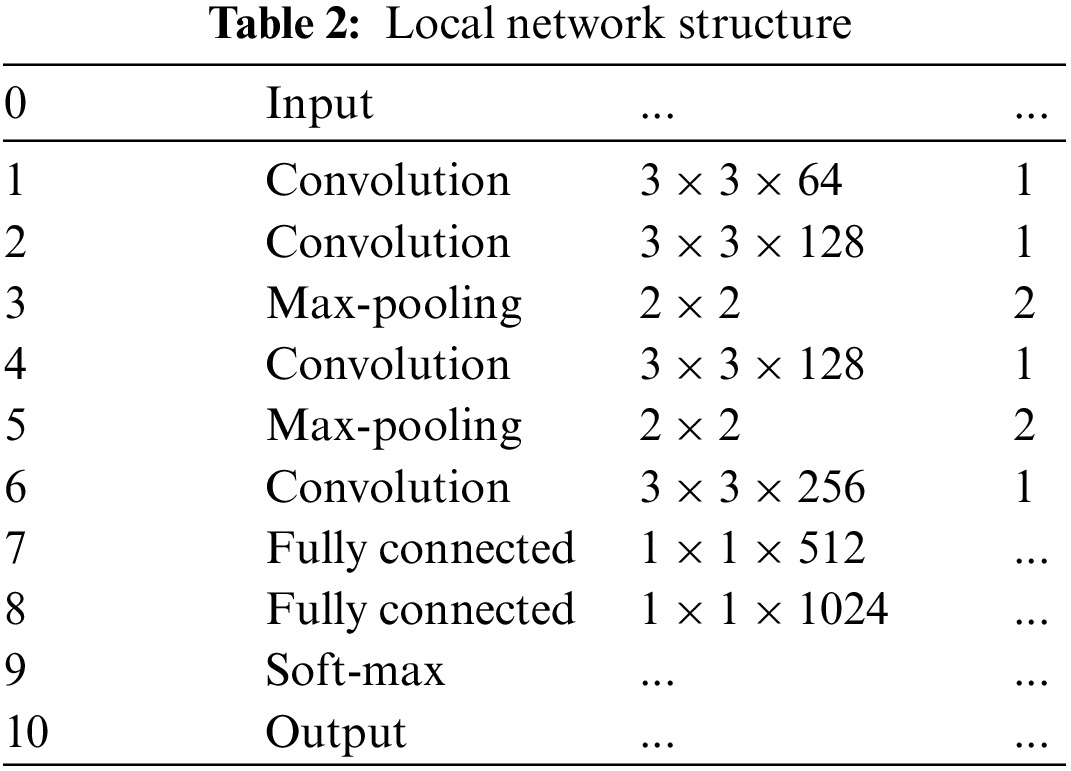
In this paper, a global network is trained using the lesion information map weighted by the attention map to test the severity level of the fundus images. Since this paper uses a weighted lesion map of the same size as the original image, the depth of the global network is deeper than that of the local network. The detailed structure of the global network is similar to the local network, which is composed of 23 layers. The first 19 layers of the network are alternately stacked with convolution layers and maximum pooling layers. The last four layers include three full connection layers and one softmax output layer. Batch normalization (BN) is used before each rectified linear unit (ReLU) activation and dropout is used after the fully connected layer.
The dataset used in this study is the DDR dataset [29], which contains labels for three different tasks: severity classification, lesion segmentation, and object detection. The dataset consists of 13,673 fundus images acquired at a 45° field of view (FOV). All images have been desensitized for general use. This dataset consists of six image categories: no DR, mild non-proliferative DR, moderate non-proliferative DR, severe non-proliferative DR, proliferative DR, and non-gradable DR. Among them, there are 1151 non-gradable images, 6266 normal images, and 6256 DR images [29]. There are 757 images to localize all DR lesion types by providing a bounding box for lesions (MA, HM, hard EX, and soft EX). In the DR grading task label, images are divided into 5 DR stages and divided into training images, validation images, and test images [29].
The different modules proposed in this article involve multiple detection tasks, including identifying patch types, identifying lesion locations in fundus images, and identifying DR grades. Therefore, the data required for each module needs to be processed differently. This article will describe the construction detail and volume of datasets for different models in the following two sections.
4.1.1 Data Used for Local Network
In the training and testing of the local network of the MPAG, our goal is to be able to identify whether and which lesions are contained in the patches of the fundus map, so the training and testing data we need are both patch-level image annotation data. According to our literature review, there is currently no published independent data with patch-level image annotation of DR fundus maps, so this paper selects 30 fundus images from the lesion segmentation task under the publicly available DDR dataset image data. After processing, the training and testing data of the MPAG in this paper are constructed.
The specific processing method is as follows:
1. First, we resize the selected 30 fundus images and their pixel-level annotated images of three types of lesions, including MA, HE, and EX, to 1024
2. Randomly crop the 1024
3. Determine the proportion of lesion pixels in the pixel-level annotated images of the three categories. The label of each patch image is determined by whether the corresponding pixel-level annotated image contains lesion pixels. If different pixel-level annotated images contain lesion pixels, the most severe lesions are labeled accordingly. The severity scale herein is EX > HE > MA.
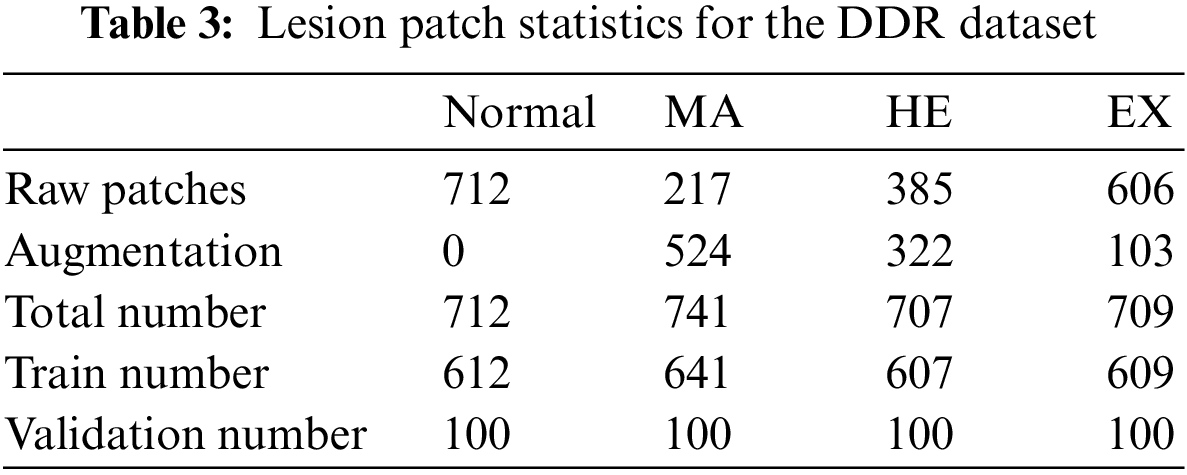
The distribution of lesion patch is shown in Table 3. During the experiment, to reduce the computational overhead and keep the data balanced, this paper controls the training and validation patches of the four categories to be 700 and 100, respectively.
4.1.2 Data Used for Lesion Localization Module and Global Network
In this paper, the data of the LLM is directly adopted from the 757 target detection image data in the DDR dataset.
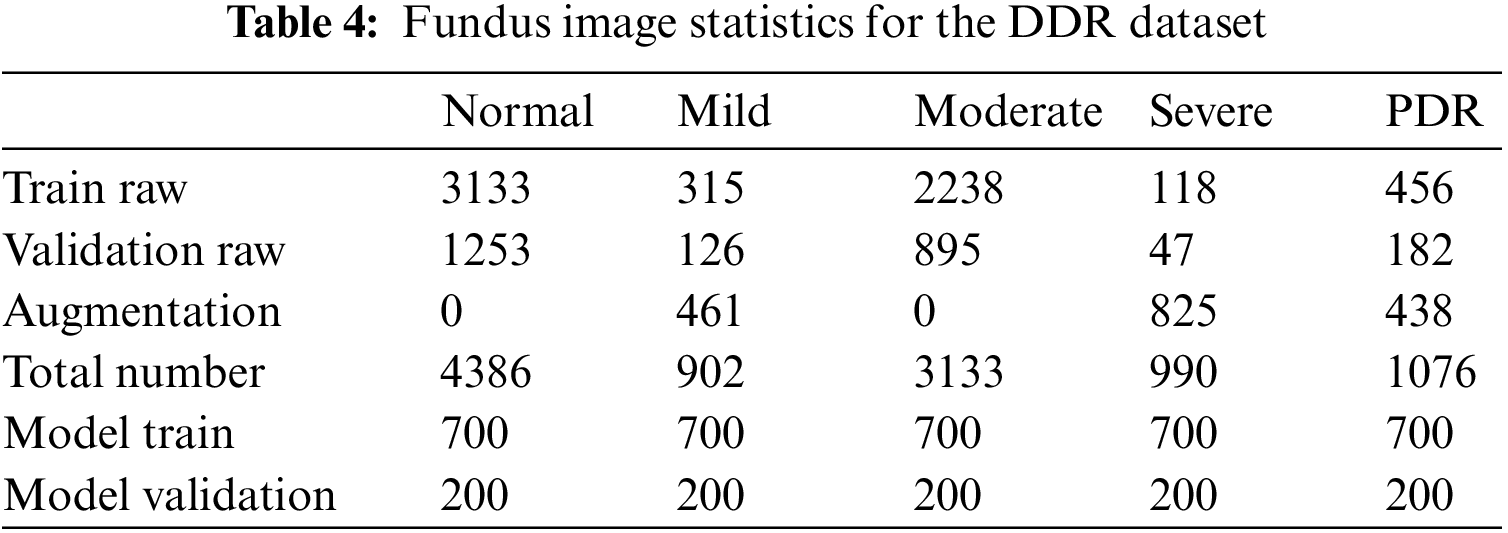
There are a total of 9568 fundus images under the disease grading task in the DDR dataset, of which 805 are ungradable images, and the remaining data are divided into training sets and test sets with 6260 and 2503 images, respectively. Due to the imbalance in the number of images of each category in the original training and validation datasets, data expansion processing is adopted in this paper. The original data set of the DR grading module is taken from part of the data in the expanded image library, and the specific label distribution is shown in Table 4.
Data preprocessing: In this paper, contrast limited adaptive histogram equalization (CLAHE) processing is performed on all images [30,31] to highlight the lesion details of fundus images. The clipping limit is set to 3, and the tile grid size is set to 8
Data expansion: In the process of experimental verification, to solve the training problem caused by data imbalance, this paper also applies some common data augmentation strategies to patches and fundus images [32,33], including changing image brightness, image rotation (rotation degree 90/180), horizontal flip, blur operation (applying Gaussian filter), the specific data expansion is shown in Tables 3 and 4.
4.2 Evaluation Design and Metrics
To fully study the performance of the proposed method, this paper conducts the following experiments: (1) Study the effectiveness of the local network: the recall and precision are recorded. Sensitivity and specificity between normal and diseased patches were shown by receiver operating characteristic (ROC) curves and AUC measures. (2) Study the superiority of the DR diagnostic grading module: Kappa [34] score and accuracy are introduced. And calculate the ROC curve and AUC of the grading algorithm to classify normal fundus images and reference DR (moderate or severe DR) images [16]. (3) To investigate the effectiveness of the LLM, the mean precision (AP) used to evaluate the performance of YOLOv3 is adopted. Whereas mAP is the average of APs for each class. (4) To illustrate the effectiveness of the MPAG and the LLM, an ablation study is carried out.
All the experiment was conducted using the PyCharm experimental platform in a Win10, 2.5 Ghz Intel i5-10300H CPU, 16GB RAM, NVIDIA GeForce RTX 3060 GPU, and 12 GB graphics memory experimental environment.
4.3.1 Lesion Recognition (Local Network)
To evaluate the performance of local network lesion patch recognition, this paper records the recall and precision of each type of lesion in the test patches. In the specific experimental process, this paper initially selected all images (divided into training and validation sets) under the lesion segmentation task in the DDR dataset. The size of the patch is adjusted to 256
The specific performance statistics are shown in Table 5. The left and right values in the table represent recall and precision, respectively. We compare two baseline algorithms: two-stage method [16], and random forest (RF) [35]. The test of the RF baseline algorithm uses the same input conditions as the local network in this paper, and the algorithm settings are the same as in [16]. The number of RF numbers is set to 500. The input of the Two-stages method is set according to [16], using the 256
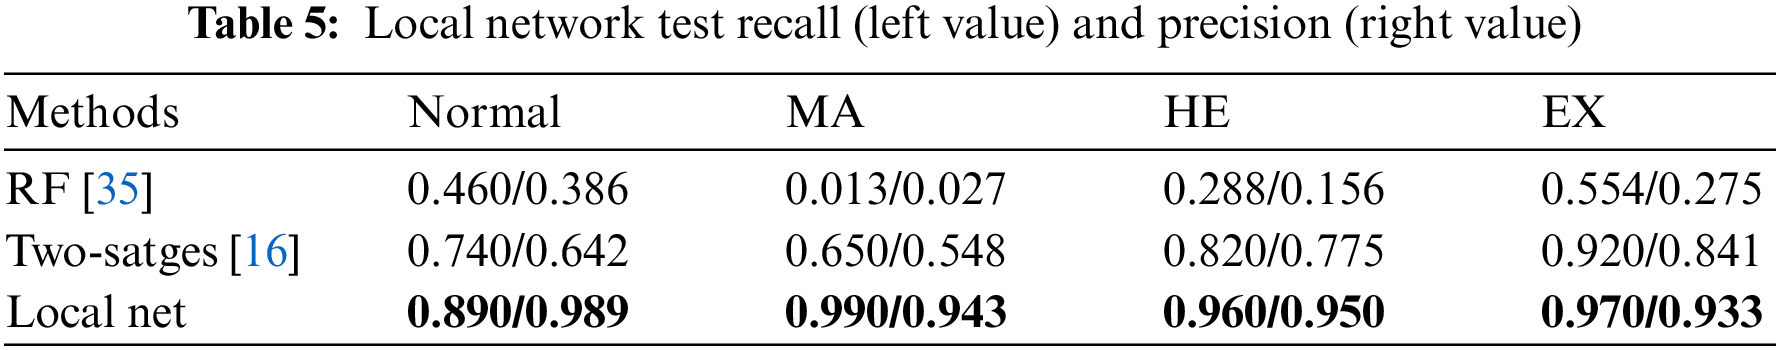

Figure 6: Lesion recognition confusion matrix. The x-axis represents the true labels. The y-axis represents the predicted classes. And c1-c4 represents four different types of lesion patches: Normal, microaneurysm, hemorrhage, and exudation. The left diagonal line data annotated in blue represents the number of correct predictions of lesion patches for each class
To show the importance of the local network in detecting lesions [36], we also trained a binary classification network to identify lesion-containing patches vs. normal patches. ROC curves based on sensitivity and specificity are depicted in Fig. 7. For an ROC curve, an important feature is its area under the curve (AUC). An AUC of 0.5 indicates random classification and a recognition ability of 0. The closer the AUC is to 1, the stronger the recognition ability and the area equal to 1 means complete recognition. The AUC value of the proposed method is 0.959. This indicates that the proposed local network has a strong ability to identify lesions.

Figure 7: ROC curve (red) of local network for lesion identification
4.3.2 Diagnostic Classification (Global Network)
To show the effectiveness of the DR grading module in grading the severity of fundus images [37,38], this paper tests the proposed grading global network on the DDR dataset. The five-class classification Kappa score of the model is 0.6117, the model accuracy is 0.6078, and we also record the classification precision and recall under the five classification levels. This measures the agreement between global network predictions and reference scores. The data statistics are shown in Table 6. This section also trains classifiers of different grading algorithms to perform binary classification on normal images and referential DR (moderate or more severe DR) images. Its ROC curve and AUC are shown in Fig. 8. The AUC value can reach 0.882.
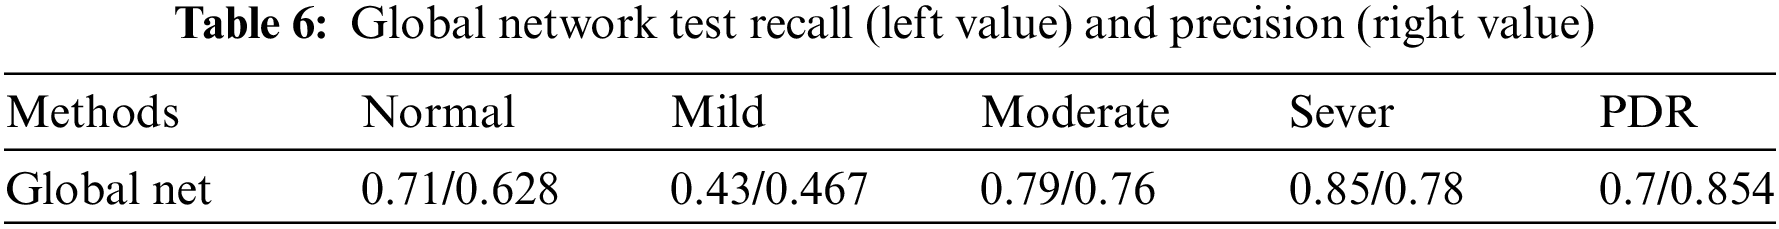
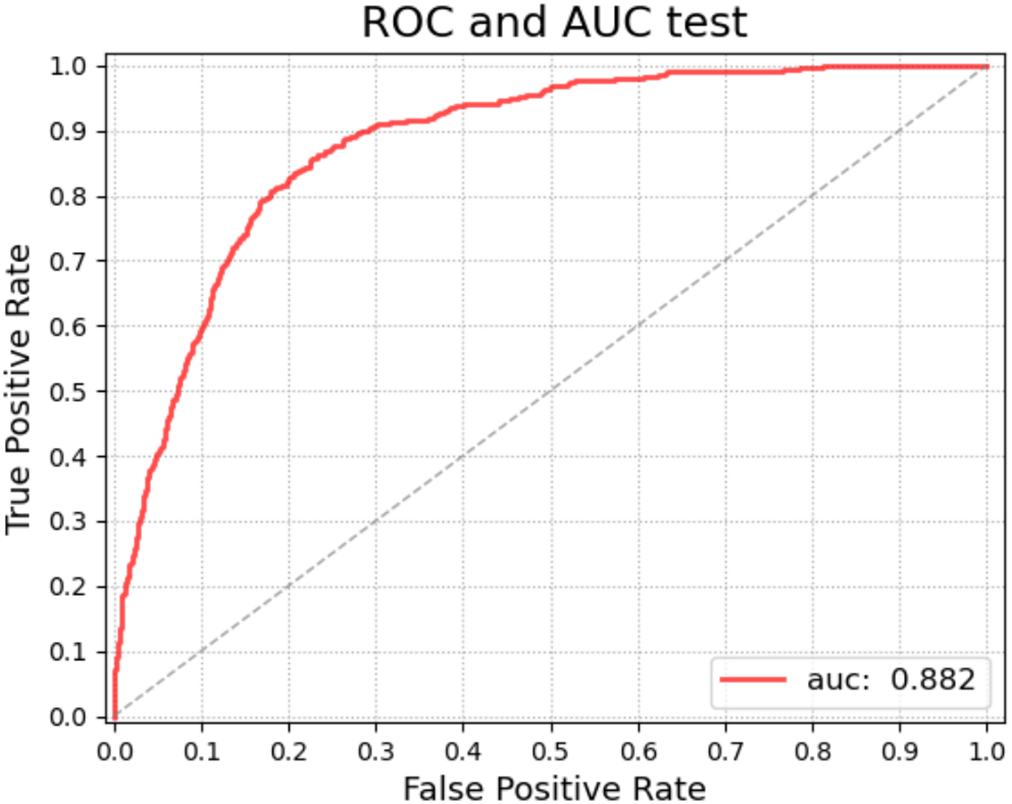
Figure 8: ROC curve (red) of the global network for diagnostic grading
4.3.3 Lesion Localization (Object Detection Network)
To study the effectiveness of the LLM, this paper introduced the mainstream evaluation index mAP (IoU = 0.5) of the YOLOv3 model to measure localization accuracy. mAP (IoU = 0.5) is the AP measurement value detected by the model when the overlap rate between the predicted target area and the labeled rectangle is greater than the threshold of 0.5. AP is the average precision index used to evaluate the performance of YOLOv3, that is, the average of the Precision values on the Precision-Recall curve (Precision represents the proportion of the real target objects detected by the model in this paper, and Recall represents all real objects that are proportion detected by the model.)
The YOLOv3 model was trained on the DDR dataset to locate all DR lesions and draw a bounding box around each lesion. The number of images for training and validation is 608, and 149, respectively. In the experiment, we found that the update method of the model weights has a certain impact on the test effect, and the specific performance is that the global update method is less effective than the local update method by freezing DarkNet53 [24]. Therefore, we finally adopted the strategy of partial update of model weights. During the experiment, the Stochastic Gradient Descent (SGD) optimizer was used, and the training epoch was 400. The learning rate adopts the dynamic learning rate method, which decreases from 0.001 to 0.00001. Contrasted with [23] and [29], the finetuned YOLOv3 achieves the highest mAP of 0.256 in locating lesions when a partial weight update strategy, SGD optimizer and dropout are employed. As shown in Table 7. In this section, we visualize the lesion localization test results of the model with the optimal mAP in this paper. The lesion localization can be seen in Fig. 9, which shows the effectiveness of our proposed model.
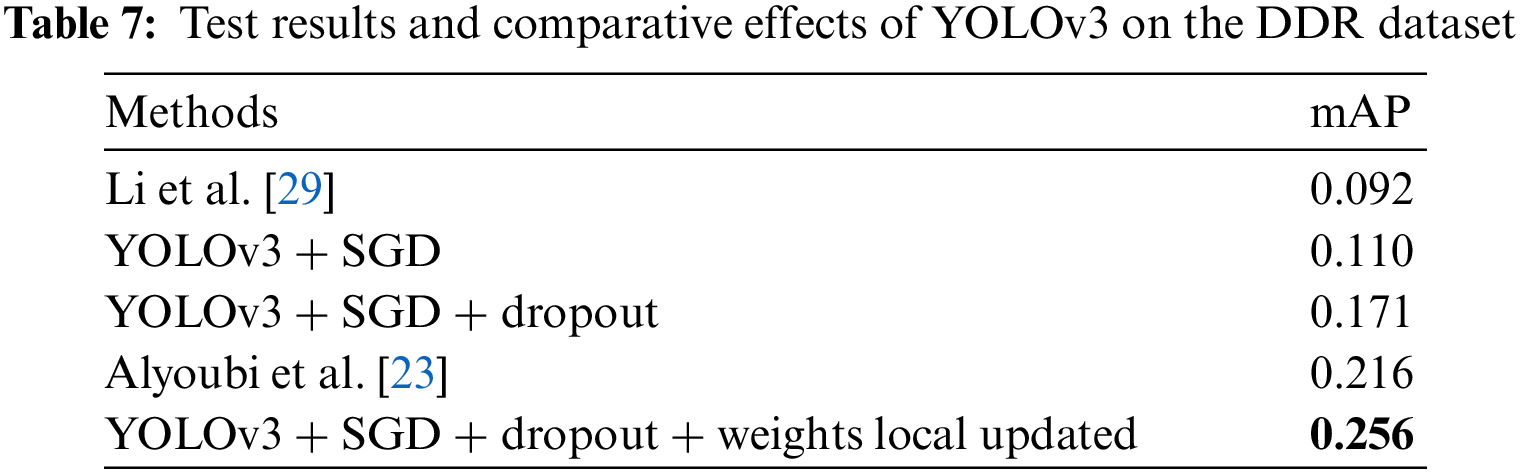

Figure 9: Visualization samples of the results predicted by LLM: (a) 1380
To illustrate the effectiveness of the proposed MPAG and LLM for disease grading, this paper conducts an ablation study on the two modules separately under the same implementation setting. experiment including the testing of the following different frameworks for the diagnosis method: MPAG + DR grading module, LLM + DR grading module, and MPAG + LLM + DR grading module.
Kappa value and accuracy were used to evaluate the five-grade classification effect of the global network combined with each proposed module, respectively. The calculation results are shown in Table 8. Compared with the global network alone, the multi-level patch attention weighting scheme combined with the global network achieved significantly improved results. In addition, as shown in Section 4.3.3 of this paper, although the LLM achieves better results, the effect of the LLM combined with the global network for DR grading diagnosis has not been significantly improved. This shows that the localization of lesions in the lesion fundus map and their effective utilization are extremely difficult, posing challenges to researchers. We believe that the reasons are as follows: the image lesion labeling is unbalanced, which leads to a decrease in the detection effect; although the current yolov3 has good detection performance for small objects, it is still difficult to detect fundus map lesions such as microaneurysms. Finally, in ablation experiments, our proposed full scheme (multi-level patch attention mechanism + LLM + global network) achieves better performance.
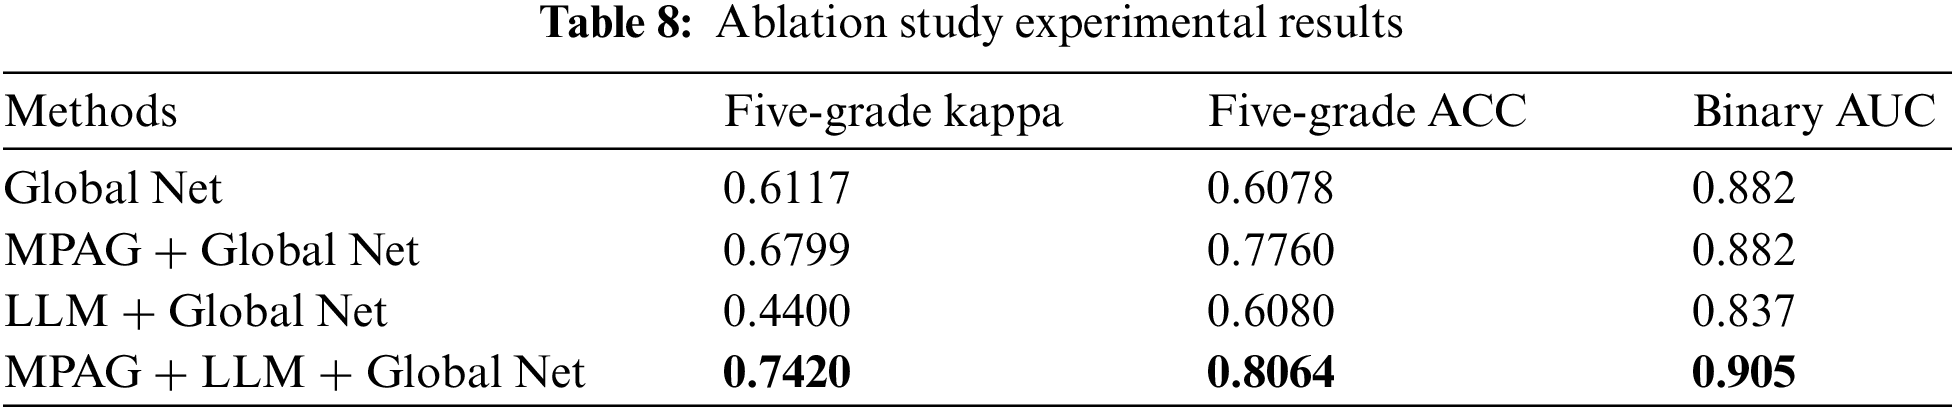
Since the DR fundus map may contain both large areas of severe symptoms and scattered small lesions, this leads to confusion and difficulty in distinguishing lesions. Even licensed physicians’ criteria for identifying such lesions are not easily unified. Therefore, similar to [16] and [20], we trained a binary classification global network to identify normal images and reference DR images and introduced the AUC metric to detect its performance. As shown in the fourth column of Table 8, the proposed full scheme (multi-level patch attention weighting scheme + LLM + global network) achieves better results, further demonstrating the effectiveness of the proposed scheme.
This paper also compared the proposed method with [16]. Following the same experimental setup as the proposed method, we reproduced the DR detection scheme of Yang et al. [16] and obtained the results with a kappa value of 0.665, an accuracy of 0.652, and an AUC value of 0.904 (binary classification between normal images and referable DR) on the adjusted DDR dataset. As shown in Fig. 10, the kappa value and accuracy of our proposed method in the five-grade test of DR diagnosis reached 0.742 and 0.8064, respectively, and both indicators were greatly improved. In the normal image and referable DR binary classification experiments, the AUC value also reached 0.905. This again demonstrates the robustness of our proposed DR diagnostic scheme.

Figure 10: Histogram of comparative data between the proposed scheme and current related research
In the step-by-step diagnosis scheme proposed in this paper, the MPAG and global network proposed in this paper form two complementary parts, which provide clearer, richer, and more valuable lesion information for ophthalmologists in clinical DR analysis of patients’ fundus images. On the one hand, the lesion attention map from the MPAG is beneficial for the hierarchical diagnosis of the proposed global network. On the other hand, the global network can eliminate the misprediction effect of the local network in the type prediction of the lesion by learning the rich features in the image weighted by the lesion attention map.
Besides, although the proposed DR diagnosis method achieves decent performance in practical medical image analysis experiments. This paper also provides a reasonable explanation for the proposed scheme. But there are still some shortcomings. Limited by the lack of datasets with fine annotation, especially patch-level annotated datasets, the experimental performance still has room for improvement [39]. It would be better if more professional annotators could devote themselves to the annotation work in related fields [40,41]. Limited by current resources, this paper has ensured the correctness of the samples to the greatest extent and reasonably demonstrated the performance of the proposed method. In addition, although the performance of the LLM combined with the global network has not been significantly improved, the work of this paper first reflects the idea of using lesion target detection to contribute to the grading diagnosis of DR fundus maps. It opens up a way to establish a complete system for automatic localization of lesions and grading diagnosis in DR fundus images. For the research that uses lesion target detection to contribute to the grading diagnosis of the DR fundus map, we hope to improve the positioning effect by creating a custom detection scheme in the future. Training and testing the system on a more balanced dataset may also improve.
Questions about the diagnosis of DR still exist. In the future, we plan to conduct more in-depth research on the detection and diagnosis of lesions in DR, including achieving more accurate detection of other lesions patches that are not limited to the three types of lesions in this paper, more efficient localization for lesions in fundus images, and extend the multi-level patch attention mechanism to other practical applications beyond DR diagnosis.
This paper proposes a diagnostic scheme for DR that fuses multi-level patch attention and lesion localization. In the scheme, the MPAG trained with lesion patches integrates the lesion information of different types from the DR patches, which solves the problem that the lesion attention cannot be further refined and then adapted to the final DR diagnosis task. Finally, a more reliable, more informative lesion attention is provided for the grading network. The research on the lesion localization module also gives doctors and patients a more intuitive reference for lesion localization and solves the problem that the black box-like end-to-end DR diagnosis system cannot provide lesion details. In model testing, the diagnostic accuracy, AUC value, and kappa score of the scheme on the public DDR data set reached 0.8064, 0.905, and 0.7420, respectively. Comparative experiments and ablation research results demonstrate the effectiveness of the proposed multi-level patch attention mechanism and lesion localization module as well as the robustness of the DR diagnostic scheme.
Acknowledgement: The authors would like to express their gratitude to Changsha University of Science and Technology for providing equipment support. Additionally, we would like to thank Mr. Xi Lin, Mr. Haidong Tang, and Mr. Longfei Huang, students of Changsha University of Science and Technology, for their assistance in proofreading the English.
Funding Statement: This work was supported in part by the Research on the Application of Multi-modal Artificial Intelligence in Diagnosis and Treatment of Type 2 Diabetes under Grant No. 2020SK50910, in part by the Hunan Provincial Natural Science Foundation of China under Grant 2023JJ60020.
Author Contributions: Conceptualization, Z. Xia and H. Hu; methodology, H. Hu; software, W. Li; validation, L. Pu, Q. Jiang and Y. Shu; formal analysis, H. Hu; investigation, W. Li; resources, W. Li; writing original draft preparation, H. Hu; writing review and editing, H. Hu and Y. Shu; visualization, Q. Jiang; project administration, Z. Xia. All authors have read and agreed to the published version of the manuscript.
Availability of Data and Materials: The data set used in this study is a public DDR data set, which is available at https://github.com/nkicsl/DDR-dataset.
Conflicts of Interest: The authors declare no conflict of interest. The funders had no role in the design of the study; in the collection, analyses, or interpretation of data; in the writing of the manuscript; or in the decision to publish the results.
References
1. Gulshan, V., Peng, L., Coram, M., Stumpe, M. C., Wu, D. et al. (2016). Development and validation of a deep learning algorithm for detection of diabetic retinopathy in retinal fundus photographs. Jama, 316(22), 2402–2410. [Google Scholar] [PubMed]
2. Haneda, S., Yamashita, H. (2010). International clinical diabetic retinopathy disease severity scale. Nihon Rinsho. Japanese Journal of Clinical Medicine, 68, 228–235. [Google Scholar] [PubMed]
3. Bashshur, R., Ross, C. (2020). World report on vision. International Journal of Eye Banking, 8(3). [Google Scholar]
4. Ramsay, S. (1998). Who launches first world report on health. Lancet, 351(9114), 1493. [Google Scholar]
5. Sun, H., Saeedi, P., Karuranga, S., Pinkepank, M., Ogurtsova, K. et al. (2022). IDF Diabetes Atlas: Global, regional and country-level diabetes prevalence estimates for 2021 and projections for 2045. Diabetes Research and Clinical Practice, 183, 109119. [Google Scholar] [PubMed]
6. Shahin, E. M., Taha, T. E., Al-Nuaimy, W., El Rabaie, S., Zahran, O. F. et al. (2012). Automated detection of diabetic retinopathy in blurred digital fundus images. 2012 8th International Computer Engineering Conference (ICENCO), Giza, Cairo, Egypt, IEEE. [Google Scholar]
7. Acharya, U. R., Lim, C. M., Ng, E. Y. K., Chee, C., Tamura, T. (2009). Computer-based detection of diabetes retinopathy stages using digital fundus images. Proceedings of the Institution of Mechanical Engineers, Part H: Journal of Engineering in Medicine, 223(5), 545–553. [Google Scholar] [PubMed]
8. Shen, D., Wu, G., Suk, H. I. (2017). Deep learning in medical image analysis. Annual Review of Biomedical Engineering, 19, 221–248. [Google Scholar] [PubMed]
9. Doshi, D., Shenoy, A., Sidhpura, D., Gharpure, P. (2016). Diabetic retinopathy detection using deep convolutional neural networks. 2016 International Conference on Computing, Analytics and Security Trends (CAST), Pune, India, IEEE. [Google Scholar]
10. Pratt, H., Coenen, F., Broadbent, D. M., Harding, S. P., Zheng, Y. (2016). Convolutional neural networks for diabetic retinopathy. Procedia Computer Science, 90, 200–205. [Google Scholar]
11. Raman, R., Srinivasan, S., Virmani, S., Sivaprasad, S., Rao, C. et al. (2019). Fundus photograph-based deep learning algorithms in detecting diabetic retinopathy. Eye, 33(1), 97–109. [Google Scholar] [PubMed]
12. Wang, S., Wang, X., Hu, Y., Shen, Y., Yang, Z. et al. (2020). Diabetic retinopathy diagnosis using multichannel generative adversarial network with semisupervision. IEEE Transactions on Automation Science and Engineering, 18(2), 574–585. [Google Scholar]
13. Zhou, Y., Wang, B., He, X., Cui, S., Shao, L. (2020). DR-GAN: Conditional generative adversarial network for fine-grained lesion synthesis on diabetic retinopathy images. IEEE Journal of Biomedical and Health Informatics, 26(1), 56–66. [Google Scholar]
14. Zhou, Y., Liu, L., Shao, L. (2018). Vehicle re-identification by deep hidden multi-view inference. IEEE Transactions on Image Processing, 27(7), 3275–3287. [Google Scholar] [PubMed]
15. Zhou, Y., Shao, L. (2018). Aware attentive multi-view inference for vehicle re-identification. Proceedings of the IEEE Conference on Computer Vision and Pattern Recognition, Salt Lake City, USA. [Google Scholar]
16. Yang, Y., Li, T., Li, W., Wu, H., Fan, W. et al. (2017). Lesion detection and grading of diabetic retinopathy via two-stages deep convolutional neural networks. Medical Image Computing and Computer Assisted Intervention–MICCAI 2017, pp. 533–540. Quebec City, QC, Canada, Springer. [Google Scholar]
17. Lin, Z., Guo, R., Wang, Y., Wu, B., Chen, T. et al. (2018). A framework for identifying diabetic retinopathy based on anti-noise detection and attention-based fusion. Medical Image Computing and Computer Assisted Intervention–MICCAI 2018, pp. 74–82. Granada, Spain, Springer. [Google Scholar]
18. Wang, Z., Yin, Y., Shi, J., Fang, W., Li, H. et al. (2017). Zoom-in-Net: Deep mining lesions for diabetic retinopathy detection. Medical Image Computing and Computer Assisted Intervention–MICCAI 2017, pp. 267–275. Quebec City, QC, Canada, Springer. [Google Scholar]
19. Bodapati, J. D., Shaik, N. S., Naralasetti, V. (2021). Composite deep neural network with gated-attention mechanism for diabetic retinopathy severity classification. Journal of Ambient Intelligence and Humanized Computing, 12(10), 9825–9839. [Google Scholar]
20. Zhou, Y., He, X., Huang, L., Liu, L., Zhu, F. et al. (2019). Collaborative learning of semi-supervised segmentation and classification for medical images. Proceedings of the IEEE/CVF Conference on Computer Vision and Pattern Recognition, Los Angeles, USA. [Google Scholar]
21. Wu, Y. H., Gao, S. H., Mei, J., Xu, J., Fan, D. P. et al. (2021). JCS: An explainable COVID-19 diagnosis system by joint classification and segmentation. IEEE Transactions on Image Processing, 30, 3113–3126. [Google Scholar] [PubMed]
22. Yang, Y., Shang, F., Wu, B., Yang, D., Wang, L. et al. (2021). Robust collaborative learning of patch-level and image-level annotations for diabetic retinopathy grading from fundus image. IEEE Transactions on Cybernetics, 52(11), 11407–11417. [Google Scholar]
23. Alyoubi, W. L., Abulkhair, M. F., Shalash, W. M. (2021). Diabetic retinopathy fundus image classification and lesions localization system using deep learning. Sensors, 21(11), 3704. [Google Scholar] [PubMed]
24. Redmon, J., Farhadi, A. (2018). YOLOv3: An incremental improvement. arXiv preprint arXiv: 1804.02767. [Google Scholar]
25. Redmon, J., Divvala, S., Girshick, R., Farhadi, A. (2016). You only look once: Unified, real-time object detection. Proceedings of the IEEE Conference on Computer Vision and Pattern Recognition, Las Vegas, USA. [Google Scholar]
26. Hinton, G. E., Srivastava, N., Krizhevsky, A., Sutskever, I., Salakhutdinov, R. R. (2012). Improving neural networks by preventing co-adaptation of feature detectors. arXiv preprint arXiv:1207.0580. [Google Scholar]
27. Biship, C. M. (2007). Pattern recognition and machine learning (information science and statistics). New York: Springer. [Google Scholar]
28. Sun, R., Li, Y., Zhang, T., Mao, Z., Wu, F. et al. (2021). Lesion-aware transformers for diabeticretinopathy grading. 2021 IEEE/CVF Conference on Computer Vision and Pattern Recognition (CVPR), Nashville, TN, USA. [Google Scholar]
29. Li, T., Gao, Y., Wang, K., Guo, S., Liu, H. et al. (2019). Diagnostic assessment of deep learning algorithms for diabetic retinopathy screening. Information Sciences, 501, 511–522. [Google Scholar]
30. Ramlugun, G. S., Nagarajan, V. K., Chakraborty, C. (2012). Small retinal vessels extraction towards proliferative diabetic retinopathy screening. Expert Systems with Applications, 39(1), 1141–1146. [Google Scholar]
31. Fadzil, M. A., Nugroho, H. A., Nugroho, H., Iznita, I. L. (2009). Contrast enhancement of retinal vasculature in digital fundus image. 2009 International Conference on Digital Image Processing, pp. 137–141. Bangkok, Thailand, IEEE. [Google Scholar]
32. Zou, B., Dai, Y., He, Q., Zhu, C., Liu, G. et al. (2020). Multi-label classification scheme based on local regression for retinal vessel segmentation. IEEE/ACM Transactions on Computational Biology and Bioinformatics, 18(6), 2586–2597. [Google Scholar]
33. Zhu, C., Zou, B., Xiang, Y., Cui, J., Wu, H. (2016). An ensemble retinal vessel segmentation based on supervised learning in fundus images. Chinese Journal of Electronics, 25(3), 503–511. [Google Scholar]
34. Schütze, H., Manning, C. D., Raghavan, P. (2008). Introduction to information retrieval, vol. 39. Cambridge: University Press Cambridge. [Google Scholar]
35. Ho, T. K. (1998). The random subspace method for constructing decision forests. IEEE Transactions on Pattern Analysis and Machine Intelligence, 20(8), 832–844. [Google Scholar]
36. Wu, J., Chang, L., Yu, G. (2020). Effective data decision-making and transmission system based on mobile health for chronic disease management in the elderly. IEEE Systems Journal, 15(4), 5537–5548. [Google Scholar]
37. Chang, L., Wu, J., Moustafa, N., Bashir, A. K., Yu, K. (2021). Ai-driven synthetic biology for non-small cell lung cancer drug effectiveness-cost analysis in intelligent assisted medical systems. IEEE Journal of Biomedical and Health Informatics, 26(10), 5055–5066. [Google Scholar]
38. Yang, W., Luo, J., Wu, J. (2021). Application of information transmission control strategy based on incremental community division in IoT platform. IEEE Sensors Journal, 21(19), 21968–21978. [Google Scholar]
39. Zhou, X., Xu, X., Liang, W., Zeng, Z., Shimizu, S. et al. (2021). Intelligent small object detection for digital twin in smart manufacturing with industrial cyber-physical systems. IEEE Transactions on Industrial Informatics, 18(2), 1377–1386. [Google Scholar]
40. Zhou, X., Liang, W., Kevin, I., Wang, K., Yang, L. T. (2020). Deep correlation mining based on hierarchical hybrid networks for heterogeneous big data recommendations. IEEE Transactions on Computational Social Systems, 8(1), 171–178. [Google Scholar]
41. Zhou, X., Xu, X., Liang, W., Zeng, Z., Yan, Z. (2021). Deep-learning-enhanced multitarget detection for end–edge–cloud surveillance in smart IoT. IEEE Internet of Things Journal, 8(16), 12588–12596. [Google Scholar]
Cite This Article
 Copyright © 2024 The Author(s). Published by Tech Science Press.
This work is licensed under a Creative Commons Attribution 4.0 International License , which permits unrestricted use, distribution, and reproduction in any medium, provided the original work is properly cited.
 Downloads
 Citation Tools