
 Submit a Paper
 Propose a Special lssue
 Open Access
ARTICLE

Enhancing Ulcerative Colitis Diagnosis: A Multi-Level Classification Approach with Deep Learning
Department of Information Systems, Faculty of Computing and Information Technology in Rabigh, King Abdulaziz University, Jeddah, 21589, Saudi Arabia
* Corresponding Author: Hasan J. Alyamani. Email:
(This article belongs to the Special Issue: Intelligent Medical Decision Support Systems: Methods and Applications)
Computer Modeling in Engineering & Sciences 2024, 140(1), 1129-1142. https://doi.org/10.32604/cmes.2024.047756
Received 16 November 2023; Accepted 04 February 2024; Issue published 16 April 2024
 View Full Text
 Download PDF
Abstract
The evaluation of disease severity through endoscopy is pivotal in managing patients with ulcerative colitis, a condition with significant clinical implications. However, endoscopic assessment is susceptible to inherent variations, both within and between observers, compromising the reliability of individual evaluations. This study addresses this challenge by harnessing deep learning to develop a robust model capable of discerning discrete levels of endoscopic disease severity. To initiate this endeavor, a multi-faceted approach is embarked upon. The dataset is meticulously preprocessed, enhancing the quality and discriminative features of the images through contrast limited adaptive histogram equalization (CLAHE). A diverse array of data augmentation techniques, encompassing various geometric transformations, is leveraged to fortify the dataset’s diversity and facilitate effective feature extraction. A fundamental aspect of the approach involves the strategic incorporation of transfer learning principles, harnessing a modified ResNet-50 architecture. This augmentation, informed by domain expertise, contributed significantly to enhancing the model’s classification performance. The outcome of this research endeavor yielded a highly promising model, demonstrating an accuracy rate of 86.85%, coupled with a recall rate of 82.11% and a precision rate of 89.23%.Graphic Abstract
Keywords
An individual with Ulcerative Colitis (UC) requires ongoing medical treatment or surgical intervention for the remainder of their life. Due to its unpredictable course and frequent shifts in the severity of physical symptoms, UC significantly negatively influences patients’ quality of life [1]. Surprisingly, few studies have investigated how UC affects patients’ quality of life. Researchers in Germany found a high emotional cost associated with UC in a study of patients [2]. A more recent study with UC patients in Spain highlighted the need to apply a patient-centered approach to UC care, taking psychological, emotional, and social difficulties into account [3].
In the context of UC, a substantial number of people experiencing moderate to severe illness (84%) claimed that the illness detrimentally affected their mental health. Both those in remission (82%) and those with milder cases of UC (75%) indicated this. Despite some regional variations, 69% of patients in France and Germany and 57% in Finland felt that UC had a significant presence in their lives. Additionally, almost two-thirds of the patients (67%) claimed to spend the majority of their time in illness [4]. The phenomenon of image analysis has been the subject of substantial research in previous studies [5–9], as it has been recognized as an efficient method for enhancing the representation capabilities of Convolutional Neural Networks (CNNs) in multiple domains. CNNs are also used for object recognition [10], detection of human movement [11], target detection [12], and person identification [13].
There are four levels of UC, from normal health to serious illness, divided into 4 severity levels (Mayo Endoscopic Subscore), ranging from Level-0 to Level-3. Levels 0 and 1 are regarded as normal, while Levels 2 and 3 are regarded as moderate or severe illness, respectively. The ability to distinguish between disorders of Levels 0, 1, 2, and 3 has only been assessed in a small number of studies to date [14,15]. Clinical recurrence and colectomy rates are higher in Level-1 patients than in Level-0 ones, according to recent research [14,15]. Compared to Level-2 patients, Level-3 patients had higher rates of clinical recurrence, colectomy, and poorer response to steroids [16,17]. The ability to differentiate between Level-0 disease and Level-1 disease or between Level-2 disease and Level-3 disease is essential. Each separate level of UC provides important prognostic information.
In recent years, deep learning (DL) models have demonstrated remarkable capabilities in the classification of medical images, as documented in several studies [18–22]. Medical image analysis has been completely redesigned using DL, which produces outstanding results in image processing tasks, including feature extraction, segmentation, and classification. However, when it comes to the applications of DL for UC severity level classification in patients, the research landscape has been relatively limited, with only a handful of studies showcasing promising outcomes. Notably, one study [23] primarily focused on a binary classification approach, discerning between UC patients in remission (defined as Levels 0 or 1) and those with severe disease (defined as Levels 2 or 3). Another study [24] extended this binary classification by examining the differentiation between Levels 0/1 and Levels 2/3, as well as Level 0 vs. Levels 1–3 UC.
CNNs have also achieved tremendous success in recent times [25–29]. Researchers have recently employed CNNs in human action recognition [30,31], statistical models [32,33], and other medical imaging domains [34–36]. A more comprehensive approach was taken by the authors of [37], who successfully demonstrated the potential of DL in distinguishing between individual UC grades, specifically Grades 1, 2, and 3, yielding promising results. With a CNN-based model, they achieved an accuracy of 77.2%. Additionally, another study [38] significantly expanded the dataset, encompassing one thousand four hundred eighty-four distinct endoscopic images obtained from 467 individuals, each appropriately labeled with their respective UC Levels. In this case, the authors reported an accuracy of 84%. While these findings are encouraging, it is evident that there remains room for further enhancement in the accuracy of classification for the various UC levels. Addressing this need for improved accuracy is essential for advancing the utility of deep learning in UC grading.
The process of endoscopic assessment is notably susceptible to inherent variations, both within and between observers, compromising the reliability of individual evaluations. This study addresses this challenge by harnessing the power of deep learning to develop a robust model capable of discerning and distinguishing among discrete levels of endoscopic disease severity. Moreover, the lighting issue in endoscopic images is resolved using the CLAHE method. This study utilizes a pre-trained deep CNN, fine-tuned with modifications in layers, to classify grades of UC. Initially, a dataset is extracted, and then data augmentation is applied to it, followed by passing the dataset to the modified deep CNN model to classify the UC grades. The proposed model demonstrates robustness in the form of experimental results. The main contributions include improving the visualization of Ulcerative Colitis images through contrast and brightness enhancement on individual channels like Red, Green, and Blue using contrast-limited adaptive histogram equalization. Improved classification of Ulcerative Colitis severity levels is also achieved using the transfer learning approach to fine-tune a pre-trained deep neural network, yielding better results. The robustness of the model is demonstrated using multiple performance measures such as Accuracy, Precision, Recall, and F-Measure.
The arrangement of the article is as follows: Section 1 explains dataset information, Section 2 shows the proposed methodology, Section 3 elucidates results, and Section 4 concludes the study.
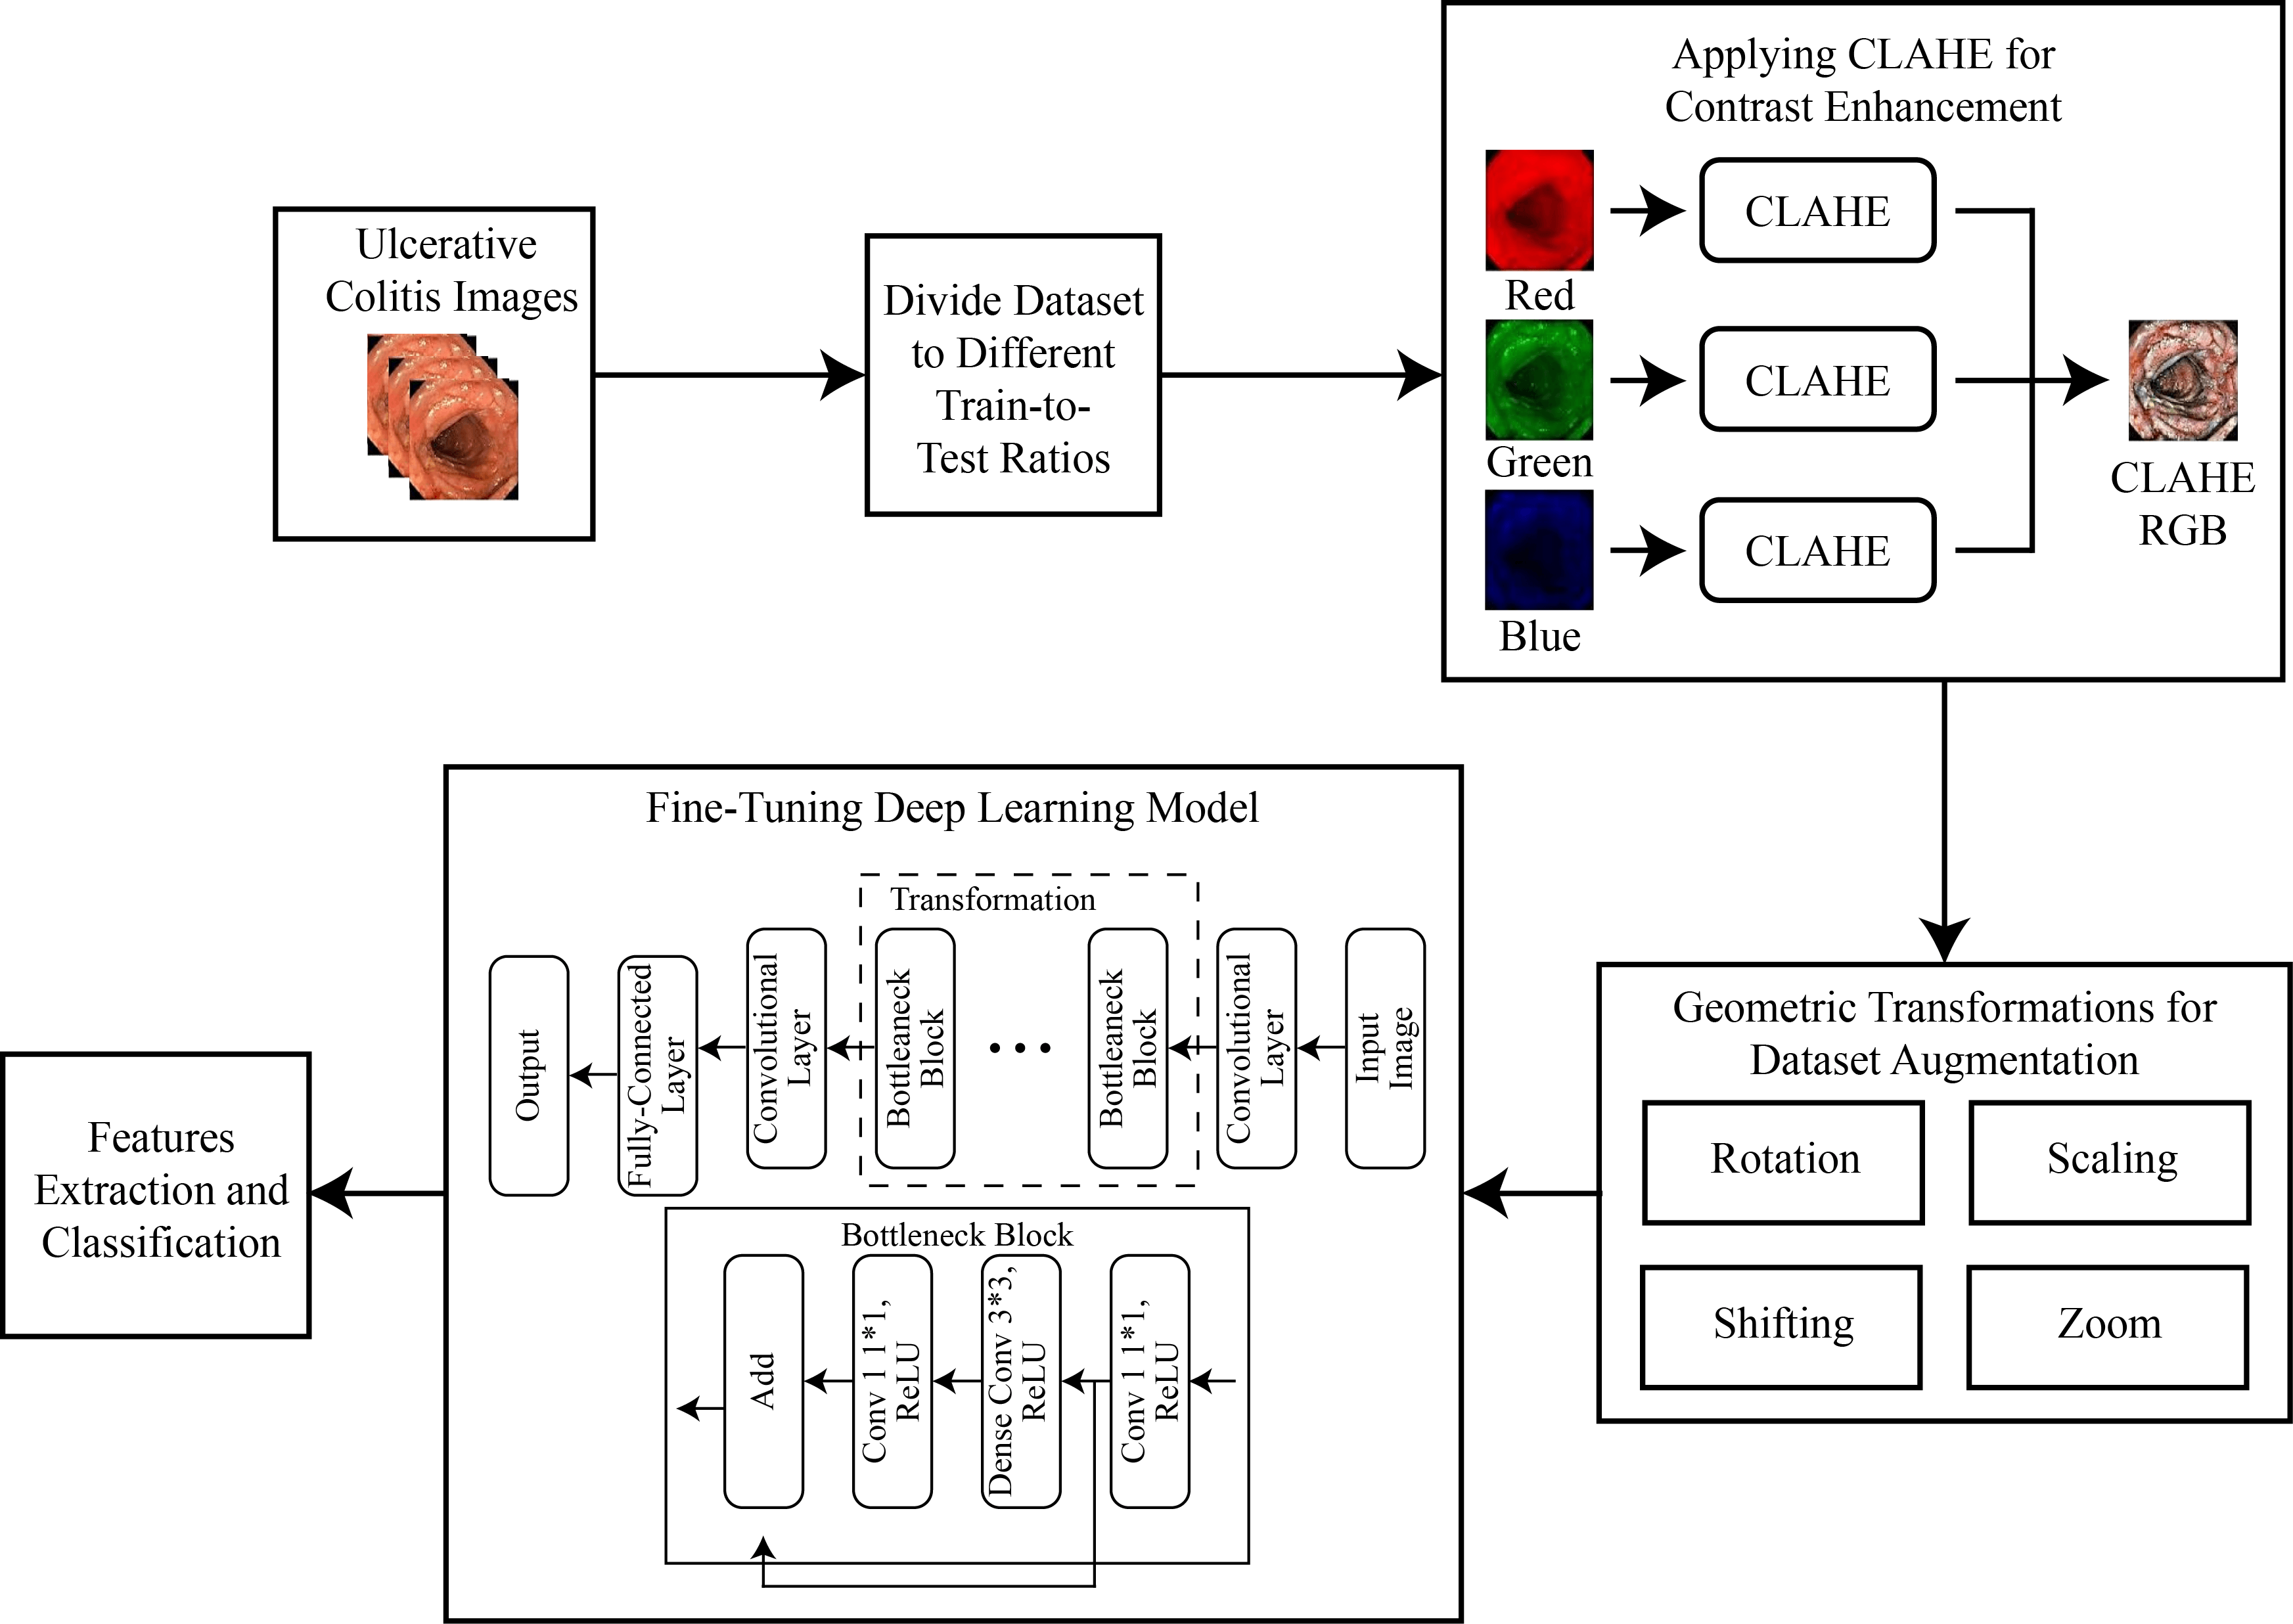
For the classification of UC levels, the dataset was initially divided into multiple train-to-test ratios like 70/30, 80/20, and 60/40. The images were then divided into red, green, and blue channels, and CLAHE was applied to each channel separately before combining them. This step increased the contrast of the images, and data augmentation was applied to increase the total images in each class. Subsequently, a transfer learning approach was applied to a pre-trained deep neural network to extract features, followed by the application of a deep classifier for the classification of UC levels. The complete methodology flow is shown in Fig. 1.
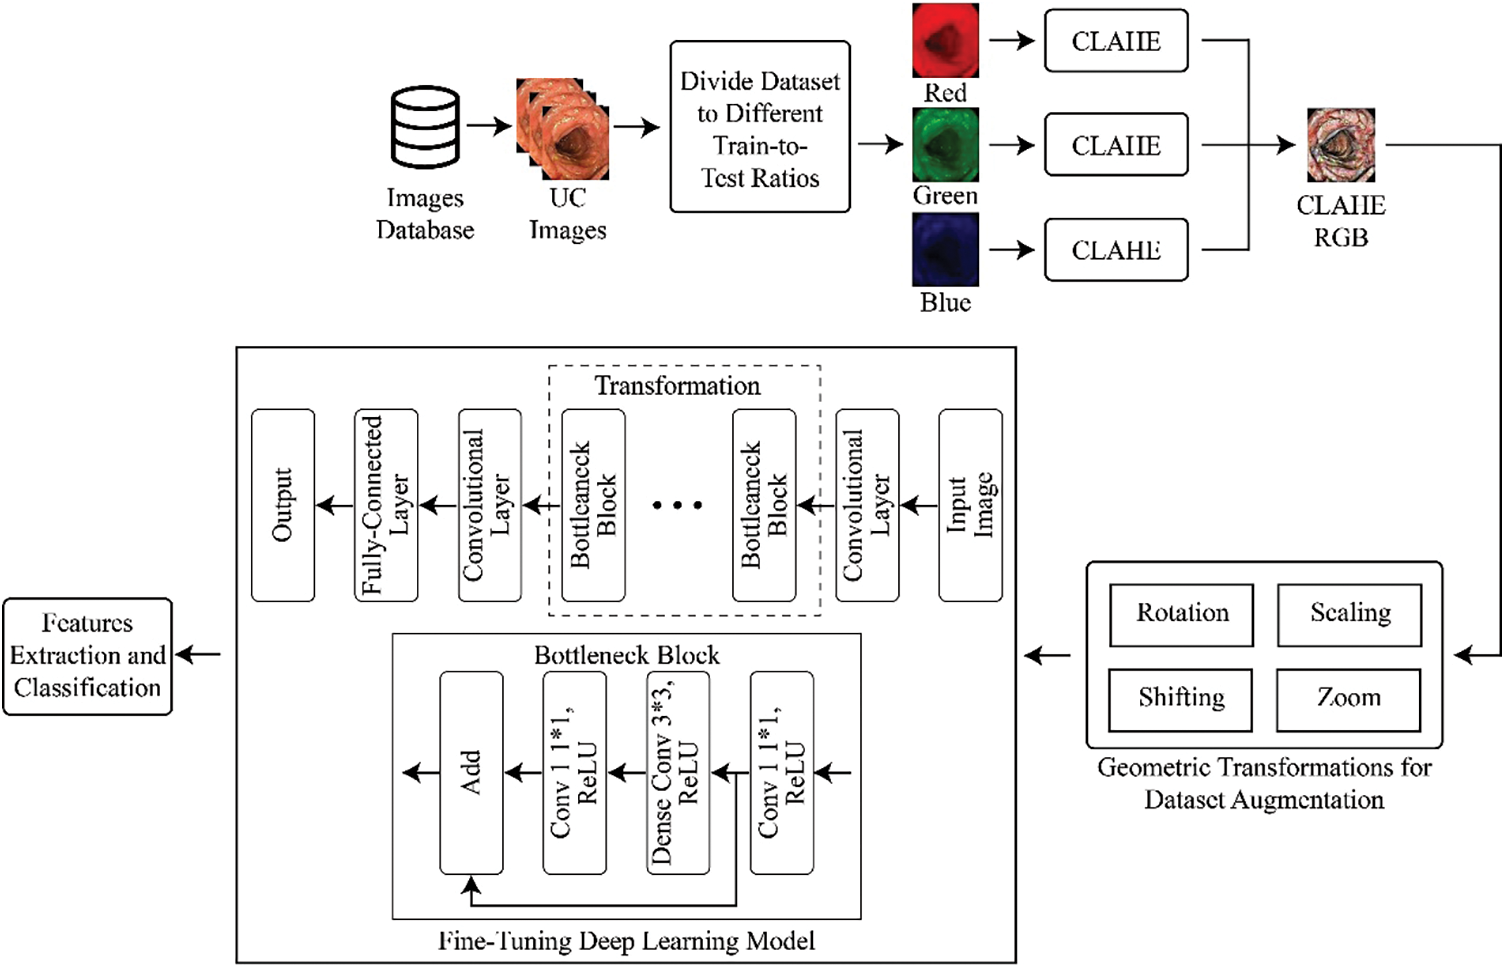
Figure 1: Methodology for multi-level classification of ulcerative colitis
In the context of this study, a comprehensive collection of endoscopic images, publicly accessible and obtained for research purposes, was utilized. This collection is characterized by its meticulous curation, involving expert validation by medical professionals. Within this repository, a diverse array of annotated photographs, each corresponding to a specific pathological grade, is found. These grades are categorized into four distinct classes, spanning from Grade 0 to Grade 3, representing a spectrum of pathological findings. It is noteworthy that the dataset consists of a total of 850 images. However, an inherent class distribution imbalance exists within this dataset. Despite this imbalance, the dataset’s voluminous size makes it a compelling resource for machine learning and deep learning-based categorization. This assertion is substantiated by a growing body of literature, as indicated by reference [39]. To provide visual insight into the dataset, Fig. 2 offers a selection of photographs from this collection, showcasing its richness and diversity.
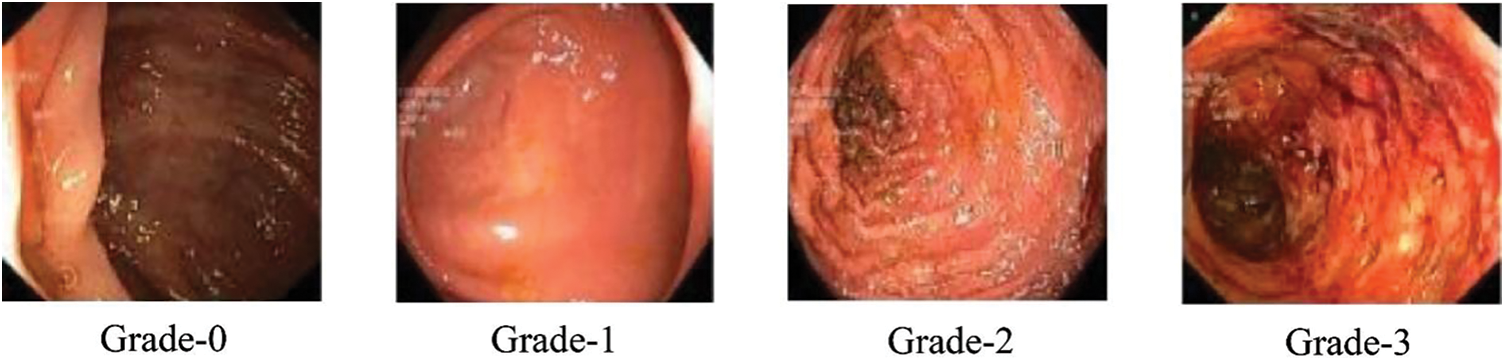
Figure 2: Sample classes of dataset
Following dataset loading, images were separated into multiple training/testing ratios like 70%/30%, 80%/20%, and 60%/40%. The unwanted text written for doctors on the endoscopic images was removed using an available filter. Fig. 3 shows the image before and after applying the filter, with the written text on the image removed.
Figure 3: Images after removing superfluous text
After the initial step, CLAHE is applied to the images to increase their contrast. CLAHE has demonstrated remarkable efficacy when applied to medical imagery [40–42]. This method’s underlying principle is rooted in the division of an image into multiple, non-overlapping regions of nearly uniform dimensions. For optimal statistical estimation, it is customary to partition the image into a grid composed of 64 regions. This grid is established by dividing the image evenly in both the horizontal and vertical directions, resulting in a total of eight subdivisions per side. The division of the image into 64 regions gives rise to three distinct classes of regions. The first category comprises the four corner regions, forming the class of “Corner Regions” (CR). The second group encompasses the border regions, referred to as the “Border Regions” (BR), comprising a total of 24 regions. These border regions include all portions of the image periphery except for the corners. Lastly, the remaining regions, which are neither in the corner nor border categories, collectively constitute the “Inner Regions” (IR) class. This systematic categorization of regions into CR, BR, and IR classes allows for a refined and region-specific application of CLAHE, contributing to improved contrast enhancement in medical images. Let the input image
where
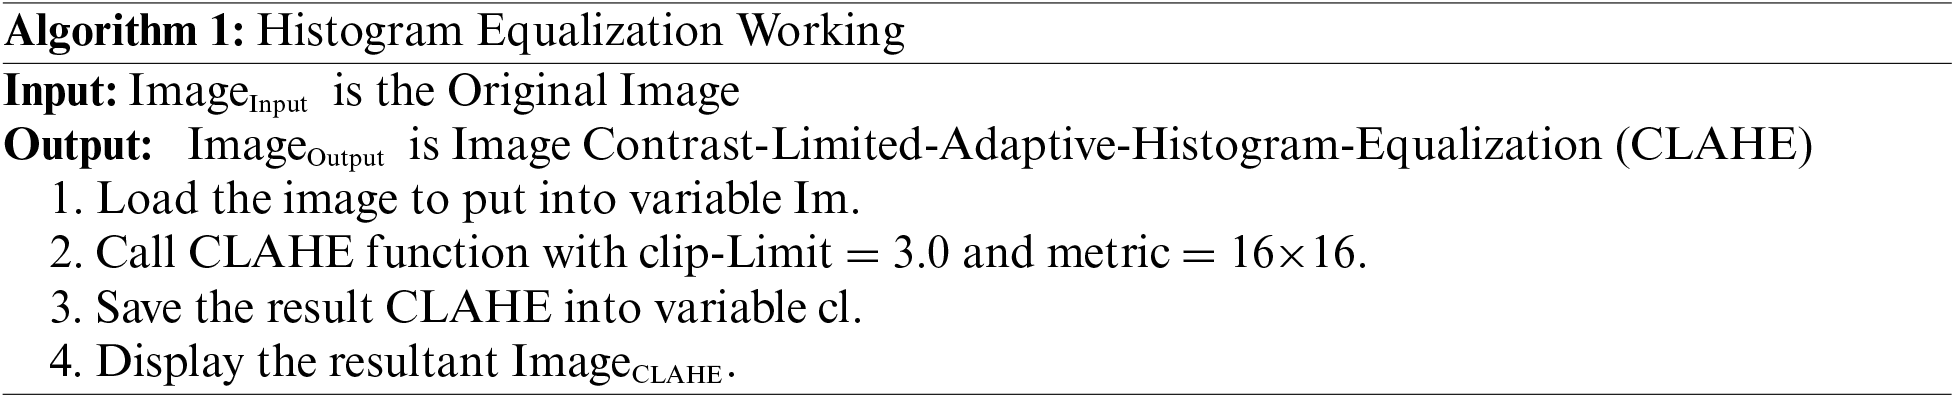
In this methodological approach, the initial step involves computing histograms for each designated region within the image. Subsequently, a critical component of this process entails establishing a clip limit for histogram truncation based on the desired extent of contrast expansion. Following this, a fundamental objective is to redistribute each region’s histogram in a manner that ensures the height of the histogram remains within the confines of the predetermined clip limit. This iterative process culminates in the derivation of cumulative distribution functions (CDF), specifically CDF [40–42], for the transformed, contrast-limited histograms, which are then instrumental in mapping gray scales within the image. In the context of Contrast Limited Adaptive Histogram Equalization (CLAHE), the pixel mapping procedure is intricate. It involves a linear amalgamation of outcomes from mappings carried out on the four nearest neighboring regions. While the formulation of this method for regions falling within the Inner Regions (IR) group is straightforward, it is imperative to underscore that the approach necessitates nuanced consideration when applied to regions in the Corner Regions (CR) and Border Regions (BR) categories. Specialized strategies are thus employed to address the unique characteristics and spatial relationships inherent to CR and BR regions, ensuring that the CLAHE technique operates optimally and effectively across the diverse regions of the image [43]. The step-by-step process for CLAHE is shown in Algorithm 1.
In pursuit of enhancing the robustness and generalization capabilities [44] of the model, the dataset was extended through the implementation of a variety of geometric transformations. This augmentation strategy serves the dual purpose of mitigating the risk of model overfitting while also ensuring that similar images do not recur during the training process. The augmentation techniques encompass rotational adjustments, horizontal translations (altering image width), zoom operations (both in and out), shear transformations, rescaling, and vertical flips. As a result of this data augmentation initiative, the dataset expanded significantly, now comprising a total of 2000 images. Each pathological grade category is uniformly represented, with precisely 500 images attributed to each grade. This augmentation strategy not only contributes to an enriched and diverse dataset but also reinforces the model’s capacity to generalize effectively, thereby enhancing its performance during subsequent classification tasks. The data augmentation applied is shown mathematically in Eq. (9).
where
2.4 Features Extraction and Classification
Transfer learning (TL) stands as a pivotal paradigm in the domain of machine learning, denoting a strategic approach for the transference of acquired model knowledge from one domain to another. The essence of TL lies in its remarkable capability to obviate the necessity of retraining a model entirely afresh when confronted with novel tasks [45]. This strategic advantage translates into significant time and resource conservation, considering the substantial computational and human resources involved in training machine learning models from the ground up, particularly when dealing with extensive datasets that mandate precise and time-intensive labeling processes. In the framework of TL, the crux of the technique revolves around the utilization of a pre-existing deep learning (DL) model, which has previously undergone training, as the foundation for a new task. The methodological cornerstone lies in fine-tuning this pre-trained model by exposing it to a distinct dataset that pertains to the novel task at hand [45]. This fine-tuning process, while building upon the knowledge encoded in the pre-existing model, is instrumental in tailoring the model’s parameters and features to specifically align with the intricacies of the new problem domain.
The MobileNet-V2 CNN model is a pre-trained architecture particularly well-suited for classification tasks. Notably, it offers a distinct advantage over its predecessor, MobileNet-V1, by addressing the issue of gradient vanishing more effectively. This improvement can be attributed to MobileNet-V2’s deployment of innovative design elements such as inverted-residual-blocks and linear-bottleneck-frames. Consequently, MobileNet-V2 not only demonstrates superior performance but also exhibits the capacity to facilitate faster training while maintaining a relatively lower parameter count. An inherent characteristic of MobileNet-V2 is the incorporation of a 1 by 1 convolutional extension layer, which plays a pivotal role in augmenting the channel dimensions of the tensor. For instance, when a tensor with 24 channels enters this layer, the extension operation increases this count by a factor of 6, yielding a new tensor with 144 channels. Subsequently, this 144-channel tensor undergoes depth-wise convolution, whereby filters are applied to further enhance its feature representations. Following this, the projection layer efficiently reduces the 144 filtered channels back to the original number, in this case, 24. This intricate architecture underlines MobileNet-V2’s capacity for channel augmentation and streamlined feature extraction. The network, referred to as ‘DagNetwork,’ is configured to accept input data with dimensions of 224 by 224 by 3. Notably, this network encompasses a total of 163 links and is comprised of 154 layers, embodying 3.4 million parameters. Within the network’s architecture, the ReLU activation function is utilized. The final layer of the network is tailored to accommodate 1000 distinct classes [46], initially trained on the extensive ImageNet dataset. In preparation for the model’s adaptability for feature extraction from endoscopic images, a dropout layer with a probability value of 0.5 is introduced to facilitate fine-tuning. Furthermore, an additional fully connected layer is appended atop the architecture, enabling the extraction of 1280 distinctive features. This multi-faceted and adaptable design imparts MobileNet-V2 with a high degree of flexibility, rendering it an invaluable asset in the realm of feature extraction from diverse datasets and image sources.
In the context of this training regimen, the Adam optimizer was judiciously selected, a choice substantiated by its well-documented efficacy and accomplishments within the recent landscape of DL advancements, as elucidated in references [47,48]. Notably, the Adam optimizer stands out for its intrinsic capability to dynamically adapt the learning rate, thereby serving as a potent strategy for the minimization of the objective function concerning model parameters. This dynamic adaptability is achieved through the systematic update of model parameters in the direction opposite to the gradient of the objective function. By doing so, the Adam optimizer effectively orchestrates the convergence of the training process in the direction of optimal model performance while simultaneously curtailing divergence along less relevant dimensions. This self-adaptive learning rate mechanism contributes significantly to the expedited and efficient convergence of the neural network training process. In this experimental setup, categorical-cross-entropy (CCE) was employed as the designated loss function for the evaluation of the neural network’s performance. The choice of loss function is of paramount importance during the fine-tuning of weight parameters, as it profoundly influences the model’s convergence and overall suitability. The essence of the loss function is encapsulated in its role of quantifying the discrepancies or penalties associated with disparities between the model’s output and the desired output variable, as comprehensively expounded upon in reference [28]. Thus, the meticulous selection of CCE underscores its pivotal role in guiding the training process toward optimal model performance, aligning the neural network with the task objectives, and facilitating a robust and informed approach to weight parameter refinement.
In this comprehensive research endeavor, the model training process, as elucidated in reference [49], spanned a course of 300 epochs [50], each characterized by a consistent batch size of 30. The determination of the number of steps per epoch was methodically executed by dividing the total length of the training dataset by the aforementioned batch size [51]. This systematic approach ensured meticulous orchestration of the training procedure, providing a structured framework for model optimization [52] and convergence.
The experimental setup for the study was conducted in a computing environment featuring a CPU with 16 GB of RAM, a 10th Generation Core i-7 processor operating at 3.2 GHz, and an 8 GB NVIDIA graphics card. The experiments leveraged the Python programming language, along with the Keras library and associated Python libraries, ensuring a robust and versatile platform for the investigations. During the training phase, the model’s accuracy was observed to stabilize around the 260th epoch, maintaining consistency until the completion of 300 epochs. This behavior highlights the network’s learning saturation and the convergence of the training process. When alternatives to the Adam optimizer, such as Adagrad, stochastic gradient descent, and regular gradient descent, were employed, training accuracy showed negligible improvement, even with an increased number of epochs. Concurrently, validation accuracy registered a decline, emphasizing the optimizer’s crucial role in shaping network performance and its impact on the model’s generalization capacity. Adjustments in momentum and learning rates within the optimization process led to significant fluctuations in both training and validation accuracy, illustrating the delicate balance between these hyperparameters and the precision required for optimal model performance. Interestingly, variations in batch size did not result in noticeable changes in accuracy, but they did affect the time required for training. Similarly, modifications to the steps per epoch parameter influenced training duration, while accuracy remained relatively stable, shedding light on the interplay between batch size, steps per epoch, and training efficiency and highlighting the model’s accuracy resilience under these adjustments.
Initially, results were collected by training the model directly on input images without any augmentation step, using various train-to-test ratios. Table 1 presents these results, with superior performance achieved at a 70/30 ratio.

Subsequently, results were gathered from training models on contrast-enhanced images using CLAHE without any data augmentation steps. Table 2 displays these results, indicating superior performance again at a 70/30 ratio. A comparison with Table 1 reveals that CLAHE-enhanced images outperform the original input images across all three ratios.

Finally, results were collected using the proposed methodology. Table 3 presents these findings, with the best performance noted at a 70/30 ratio. A comparison with the previous two tables shows that the proposed methodology outperformed both the original input images and the CLAHE-enhanced results across all ratios.

The results indicate that the accuracy of the proposed model stands at 86.85%, with a precision of 89.23% and a recall of 82.11%. This level of accuracy positions the model as a strong competitor among state-of-the-art models.
In an effort to comprehensively assess and compare the model’s performance at various stages of the experimental pipeline, a rigorous analysis of the outcomes was conducted. This examination revealed consistent enhancements in the results after applying each sequential step, including techniques like contrast enhancement and data augmentation. An observed increase in the recall rate testifies to the robustness of the proposed methodology. Additionally, a plot graph of the red, green, and blue values for CLAHE-processed images was included to better visualize the results. Fig. 4 shows the histogram of these values before applying CLAHE, and Fig. 5 displays the red, green, and blue channel values on the images after the application of CLAHE.
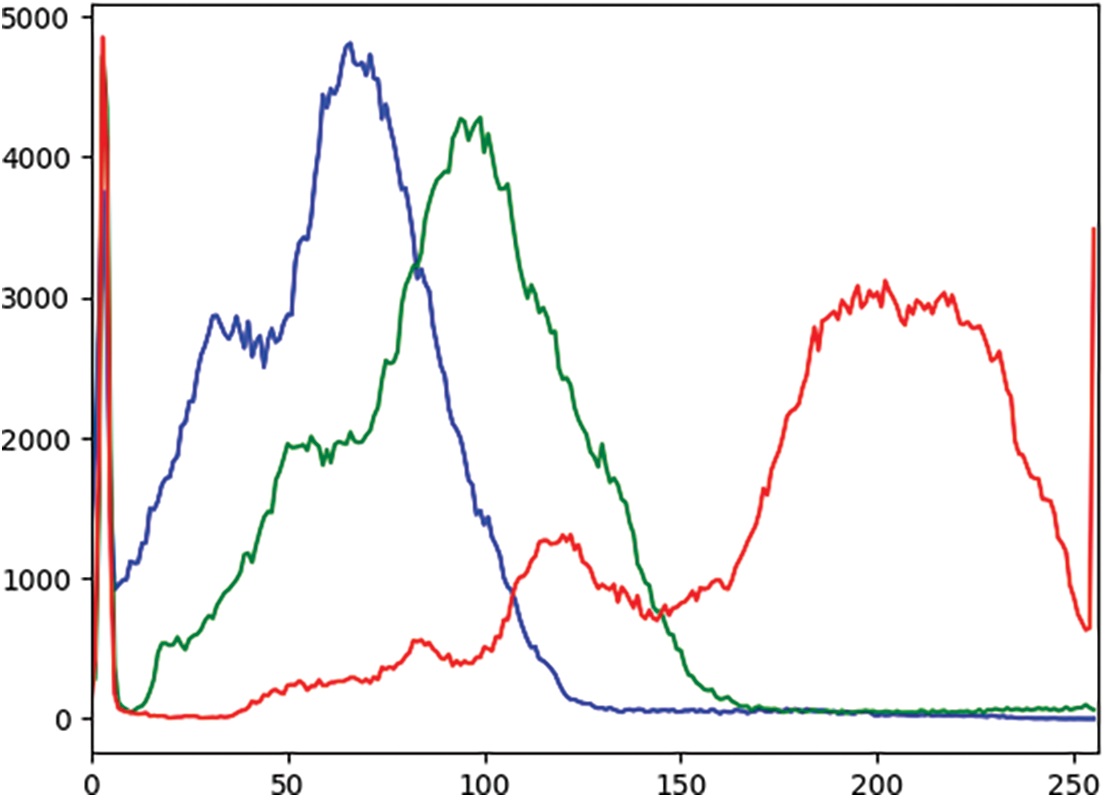
Figure 4: Histogram of red, green, and blue values of the image before CLAHE (X-axis: Pixel values, Y-axis: Frequency of each pixel)
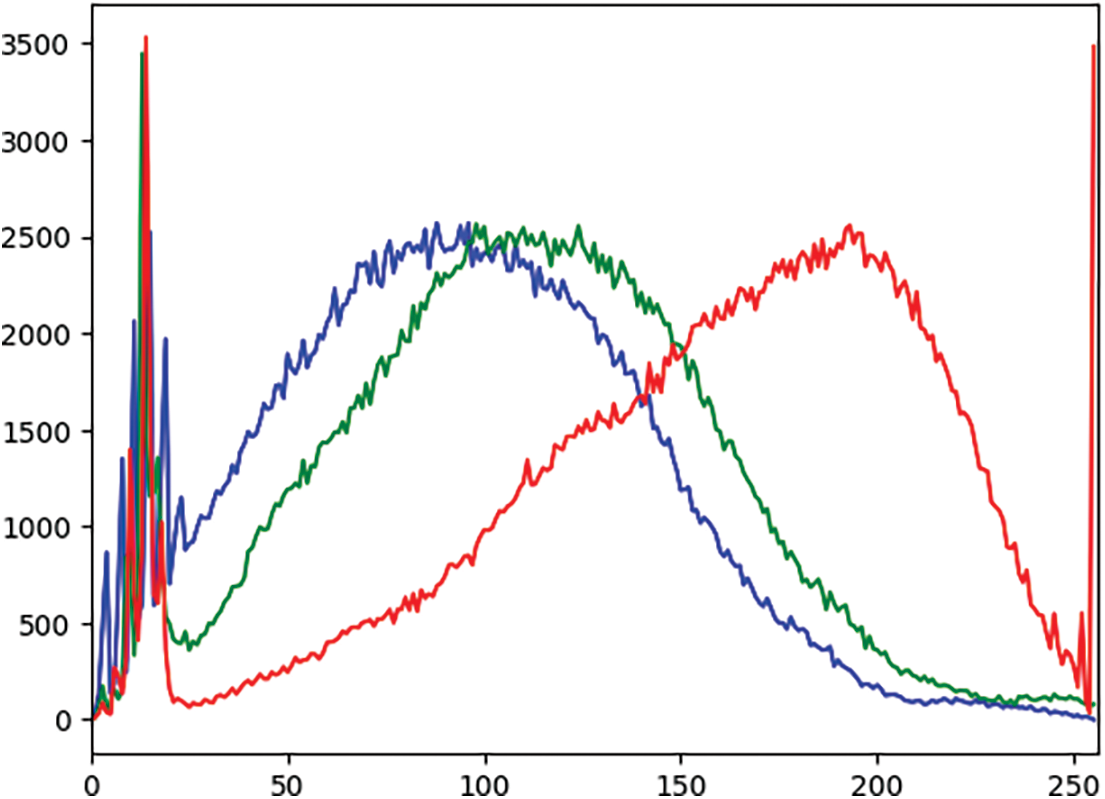
Figure 5: Histogram of red, green, and blue values of the image after CLAHE (X-axis: Pixel values, Y-axis: Frequency of each pixel)
This iterative process of performance evaluation involves the systematic integration of each individual step, underscoring the incremental improvements in model efficacy. Furthermore, the noticeable enhancement of the recall rate highlights the model’s ability to effectively capture and retrieve relevant information, solidifying the methodology’s robustness and its utility in real-world applications. These findings collectively emphasize the progressive refinement of the model’s performance and underscore the significance of these research endeavors.
An ablation study was conducted by tuning the model to multiple different hyper-parameters. The results of these are presented in Table 4.

This study introduces a discerning transfer learning strategy for classifying ulcerative colitis levels using a deep CNN. The research workflow begins with the meticulous extraction of a dedicated dataset, followed by a comprehensive preprocessing phase designed to accentuate the contrast and enhance the visual quality of the dataset. Subsequently, the dataset undergoes an augmentation process wherein multiple geometric transformations are applied to the images. This augmentation process increases the diversity and variability of the dataset, thereby enhancing the model’s capacity for robust feature extraction. The cornerstone of this classification approach rests on the use of a pre-trained MobileNet-V2 model, which is then fine-tuned on this specifically curated dataset. The results of the proposed model demonstrate a commendable accuracy of 86.85%, coupled with an impressive recall rate of 82.11% and a precision rate of 89.23%. These performance metrics highlight the model’s efficacy and potential for clinical application, marking the culmination of this rigorous research effort in the field of medical image classification. The research has limitations, namely that the model has not been tested on multiple datasets and the feature optimization step, which will be addressed in future work.
Acknowledgement: The author would like to express sincere gratitude to the Department of Information Systems, Faculty of Computing, and Information Technology in Rabigh, King Abdulaziz University, Jeddah, 21589, Saudi Arabia, for their invaluable support and guidance.
Funding Statement: The author received no specific funding for this study.
Author Contributions: The authors confirm their contribution to the paper as follows: study conception, design, data collection, analysis, interpretation of results, and draft manuscript preparation: Hasan J. Alyamani. The author reviewed the results and approved the final version of the manuscript.
Availability of Data and Materials: The data that support the findings of this study are available from the first and corresponding author upon reasonable request.
Conflicts of Interest: The author declares that they have no conflicts of interest to report regarding the present study.
References
1. Ghosh, S., Mitchell, R. (2007). Impact of inflammatory bowel disease on quality of life: Results of the European Federation of Crohn’s and Ulcerative Colitis Associations (EFCCA) patient survey. Journal of Crohn’s and Colitis, 1(1), 10–20 [Google Scholar] [PubMed]
2. Bokemeyer, B., Hardt, J., Hüppe, D., Prenzler, A., Conrad, S. et al. (2013). Clinical status, psychosocial impairments, medical treatment and health care costs for patients with inflammatory bowel disease (IBD) in Germany: An online IBD registry. Journal of Crohn’s and Colitis, 7(5), 355–368 [Google Scholar] [PubMed]
3. Sanromán, A., Carpio, D., Calvet, X., Romero, C., Cea-Calvo, L. et al. (2017). Perceived emotional and psychological impact of ulcerative colitis on outpatients in Spain: UC-LIFE survey. Digestive Diseases and Sciences, 62(1), 207–216. [Google Scholar]
4. Dubinsky, M., Watanabe, K., Molander, P., Biroulet, L., Rubin, M. et al. (2021). Ulcerative colitis narrative global survey findings: The impact of living with ulcerative colitis—patients’ and physicians’ view. Inflammatory Bowel Diseases, 27(11), 1747–1755 [Google Scholar] [PubMed]
5. Rehman, S., Saeed, M., Riaz, F., Hassan, A., Abbas, M. (2017). Self-organizing hierarchical particle swarm optimization of correlation filters for object recognition. IEEE Access, 5(1), 24495–24502. [Google Scholar]
6. Rehman, S., Awan, A., Chaudry, Q., Abbas, M., Young, R. et al. (2016). Improved maximum average correlation height filter with adaptive log base selection for object recognition. Optical Pattern Recognition XXVII, pp. 29–41. Canberra, Australia. [Google Scholar]
7. Rehman, S., Bilal, A., Chaudry, Q., Saeed, O., Abbas, M. et al. (2017). Comparative analysis of zero aliasing logarithmic mapped optimal trade-off correlation filter. Pattern Recognition and Tracking XXVIII, pp. 22–37. California, USA. [Google Scholar]
8. Rehman, S., Riaz, F., Saeed, O., Hassan, A., Khan, M. et al. (2017). Fully invariant wavelet enhanced minimum average correlation energy filter for object recognition in cluttered and occluded environments. Pattern Recognition and Tracking XXVIII, pp. 28–39. California, USA. [Google Scholar]
9. Akbar, N., Tehsin, S., Bilal, A., Rubab, S., Rehman, S. et al. (2020). Detection of moving human using optimized correlation filters in homogeneous environments. Pattern Recognition and Tracking XXXI, pp. 73–79. New Mexico, USA. [Google Scholar]
10. Asfia, Y., Akbar, N., Riaz, F., Rehman, S., Young, R. et al. (2020). Selection of CPU scheduling dynamically through machine learning. Pattern Recognition and Tracking XXXI, pp. 67–72. New Mexico, USA. [Google Scholar]
11. Akbar, N., Tehsin, S., Rehman, H., Rehman, S., Young, R. (2019). Hardware design of correlation filters for target detection. Pattern Recognition and Tracking XXX, pp. 71–79. Strasbourg, France. [Google Scholar]
12. Asfia, Y., Tehsin, S., Shahzeen, A., Khan, S. (2019). Visual person identification device using raspberry Pi. The 25th Conference of FRUCT Association, pp. 422–427. Maryland, USA. [Google Scholar]
13. Saad, S., Bilal, A., Tehsin, S., Rehman, S. (2020). Spoof detection for fake biometric images using feature-based techniques. SPIE Future Sensing Technologies, pp. 342–349. Yokohama, Japan. [Google Scholar]
14. Acosta, M., Vallejo, N., Iglesia, D., Uribarri, L., Bastón, I. et al. (2016). Evaluation of the risk of relapse in ulcerative colitis according to the degree of mucosal healing (Mayo 0 vs 1A longitudinal cohort study. Journal of Crohn’s and Colitis, 10(1), 13–19. [Google Scholar]
15. Manginot, C., Baumann, C., Biroulet, L. (2015). An endoscopic Mayo score of 0 is associated with a lower risk of colectomy than a score of 1 in ulcerative colitis. Gut, 64(7), 1181–1182 [Google Scholar] [PubMed]
16. Osterman, M., Scott, F., Fogt, F., Gilroy, E., Parrott, S. et al. (2021). Endoscopic and histological assessment, correlation, and relapse in clinically quiescent ulcerative colitis (MARQUEE). Inflammatory Bowel Diseases, 27(2), 207–214 [Google Scholar] [PubMed]
17. Xie, T., Zhang, T., Ding, C., Dai, X., Li, Y. (2018). Ulcerative colitis endoscopic index of severity (UCEIS) versus mayo endoscopic score (MES) in guiding the need for colectomy in patients with acute severe colitis. Gastroenterology Report, 6(1), 38–44 [Google Scholar] [PubMed]
18. Noor, M., Nazir, M., Khan, S., Ashraf, I., Song, O. (2023). Localization and classification of gastrointestinal tract disorders using explainable AI from endoscopic images. Applied Sciences, 13(15), 90–111. [Google Scholar]
19. Noor, M., Nazir, M., Ashraf, I., Almujally, N., Aslam, M. et al. (2023). GastroNet: A robust attention-based deep learning and cosine similarity feature selection framework for gastrointestinal disease classification from endoscopic images. CAAI Transactions on Intelligence Technology, 34(1), 1–21. [Google Scholar]
20. Noor, M., Nazir, M., Ashraf, I. (2023). Emerging trends and advances in the diagnosis of gastrointestinal diseases. BioScientific Review, 5(2), 118–143. [Google Scholar]
21. Nouman, M., Nazir, M., Khan, S., Song, O., Ashraf, I. (2023). Efficient gastrointestinal disease classification using pretrained deep convolutional neural network. Electronics, 12(7), 155–187. [Google Scholar]
22. Alhajlah, M., Noor, M., Nazir, M., Mahmood, A., Ashraf, I. (2023). Gastrointestinal diseases classification using deep transfer learning and features optimization. Computers, Materials & Continua, 75(1), 2227–2245. https://doi.org/10.32604/cmc.2023.031890 [Google Scholar] [CrossRef]
23. Stidham, R., Liu, W., Bishu, S., Rice, M., Higgins, P. et al. (2019). Performance of a deep learning model vs human reviewers in grading endoscopic disease severity of patients with ulcerative colitis. JAMA Network Open, 2(5), 193963–193993. [Google Scholar]
24. Ozawa, T., Ishihara, S., Fujishiro, M., Saito, H., Kumagai, Y. et al. (2019). Novel computer-assisted diagnosis system for endoscopic disease activity in patients with ulcerative colitis. Gastrointestinal Endoscopy, 89(2), 416–421 [Google Scholar] [PubMed]
25. Raza, M., Shah, J. H., Wang, S. H., Tariq, U., Khan, M. A. (2022). HAREDNet: A deep learning based architecture for autonomous video surveillance by recognizing human actions. Computers and Electrical Engineering, 99(1), 107–135. [Google Scholar]
26. Rashid, M., Shah, J. H., Sharif, M., Awan, M. Y., Alkinani, M. H. (2021). An optimized approach for breast cancer classification for histopathological images based on hybrid feature set. Current Medical Imaging, 17(1), 136–147 [Google Scholar] [PubMed]
27. Raza, M., Shah, J. H., Khan, M. A., Rehman, A. (2021). Human action recognition using machine learning in uncontrolled environment. 1st International Conference on Artificial Intelligence and Data Analytics, pp. 182–187. Riyadh, Saudi Arabia. [Google Scholar]
28. Bibi, A., Shah, J. H., Khan, M. A., Sharif, M., Iqbal, K. (2021). Deep learning-based classification of fruit diseases: An application for precision agriculture. Computers, Materials & Continua, 66(2), 1949–1962. https://doi.org/10.32604/cmc.2020.012945 [Google Scholar] [CrossRef]
29. Khan, M. A., Nasir, I. M., Sharif, M., Alhaisoni, M., Kadry, S. (2021). A blockchain based framework for stomach abnormalities recognition. Computers, Materials & Continua, 67(1), 141–158. https://doi.org/10.32604/cmc.2021.013217 [Google Scholar] [CrossRef]
30. Raza, M., Shah, J. H., Khan, M. A., Nam, Y. C., Nam, Y. (2023). Improved shark smell optimization algorithm for human action recognition. Computers, Materials & Continua, 76(3), 2667–2684. https://doi.org/10.32604/cmc.2023.035214 [Google Scholar] [CrossRef]
31. Raza, M., Ulyah, S. M., Shah, J. H., Fitriyani, N. L., Syafrudin, M. (2023). ENGA: Elastic net-based genetic algorithm for human action recognition. Expert Systems with Applications, 227(1), 120–139. [Google Scholar]
32. Tariq, J., Alfalou, A., Ijaz, A., Ali, H., Ashraf, I. et al. (2022). Fast intra mode selection in HEVC using statistical model. Computers, Materials & Continua, 70(2), 3903–3918. https://doi.org/10.32604/cmc.2022.019541 [Google Scholar] [CrossRef]
33. Mushtaq, I., Umer, M., Imran, M., Nasir, I. M., Muhammad, G. et al. (2021). Customer prioritization for medical supply chain during COVID-19 pandemic. Computers, Materials and Continua, 70(1), 59–72. [Google Scholar]
34. Khan, M. A., Yasmin, M., Shah, J. H., Gabryel, M., Scherer, R. et al. (2020). Pearson correlation-based feature selection for document classification using balanced training. Sensors, 20(23), 67–83. [Google Scholar]
35. Khan, M. A., Armghan, A., Javed, M. Y. (2020). SCNN: A secure convolutional neural network using blockchain. 2nd International Conference on Computer and Information Sciences, pp. 1–5. Riyadh, Saudi Arabia. [Google Scholar]
36. Khan, M. A., Alhaisoni, M., Saba, T., Rehman, A., Iqbal, T. et al. (2020). A hybrid deep learning architecture for the classification of superhero fashion products: An application for medical-tech classification. Computer Modeling in Engineering & Sciences, 124(3), 1017–1033. https://doi.org/10.32604/cmes.2020.010943 [Google Scholar] [CrossRef]
37. Bhambhvani, H., Zamora, A. (2021). Deep learning enabled classification of Mayo endoscopic subscore in patients with ulcerative colitis. European Journal of Gastroenterology & Hepatology, 33(5), 645–649. [Google Scholar]
38. Lo, B., Liu, Z., Bendtsen, F., Igel, C., Vind, I. et al. (2022). High accuracy in classifying endoscopic severity in ulcerative colitis using convolutional neural network. The American Journal of Gastroenterology, 117(10), 1648–1654 [Google Scholar] [PubMed]
39. Pogorelov, K., Randel, K., Griwodz, C., Eskeland, S., Lange, T. et al. (2017). KVASIR: A multi-class image dataset for computer aided gastrointestinal disease detection. Proceedings of the 8th ACM on Multimedia Systems Conference, pp. 164–169. New York, USA. [Google Scholar]
40. Reza, A. M. (2004). Realization of the contrast limited adaptive histogram equalization (CLAHE) for real-time image enhancement. Journal of VLSI Signal Processing Systems for Signal, Image and Video Technology, 38(1), 35–44. [Google Scholar]
41. Setiawan, A., Mengko, T., Santoso, O., Suksmono, A. (2013). Color retinal image enhancement using CLAHE. International Conference on ICT for Smart Society, pp. 1–3. Jawa Barat, Indonesia. [Google Scholar]
42. Musa, P., Rafi, F., Lamsani, M. (2018). A review: Contrast-limited adaptive histogram equalization (CLAHE) methods to help the application of face recognition. Proceedings of the 8th ACM on Multimedia Systems Conference, pp. 106–114. New York, USA. [Google Scholar]
43. Sahu, S., Singh, A., Ghrera, S., Elhoseny, M. (2019). An approach for de-noising and contrast enhancement of retinal fundus image using CLAHE. Optics & Laser Technology, 110(1), 87–98. [Google Scholar]
44. Shorten, C., Khoshgoftaar, T. (2019). A survey on image data augmentation for deep learning. Journal of Big Data, 6(1), 1–48. [Google Scholar]
45. Noor, M., Nazir, M., Rehman, S., Tariq, J. (2021). Sketch-recognition using pre-trained model. Proceedings of the National Conference on Engineering and Computing Technology, pp. 1–15. Islamabad, Pakistan. [Google Scholar]
46. Peng, J., Kang, S., Ning, Z., Deng, H., Shen, J. et al. (2020). Residual convolutional neural network for predicting response of transarterial chemoembolization in hepatocellular carcinoma from CT imaging. European Radiology, 30(3), 413–424 [Google Scholar] [PubMed]
47. Kingma, D., Ba, J. (2014). Adam: A method for stochastic optimization. Computer Modeling, 25(3), 1–15. [Google Scholar]
48. Ho, Y., Wookey, S. (2019). The real-world-weight cross-entropy loss function: Modeling the costs of mislabeling. IEEE Access, 8(1), 4806–4813. [Google Scholar]
49. Noor, M., Khan, T., Haneef, F., Ramay, M. (2022). Machine learning model to predict automated testing adoption. International Journal of Software Innovation, 10(1), 1–15. [Google Scholar]
50. Brownlee, J. (2018). What is the difference between a batch and an epoch in a neural network. Machine Learning Mastery, 20(1), 1–15. [Google Scholar]
51. Radiuk, P. M. (2017). Impact of training set batch size on the performance of convolutional neural networks for diverse datasets. IEEE Access, 23(2), 20–35. [Google Scholar]
52. Van, W., Schutter, E., Achard, P. (2008). Automated neuron model optimization techniques: A review. Biological Cybernetics, 99(7), 241–251. [Google Scholar]
Cite This Article
 Copyright © 2024 The Author(s). Published by Tech Science Press.
This work is licensed under a Creative Commons Attribution 4.0 International License , which permits unrestricted use, distribution, and reproduction in any medium, provided the original work is properly cited.
 Downloads
 Citation Tools