 Open Access
REVIEW
Advancement in CFD and Responsive AI to Examine Cardiovascular Pulsatile Flow in Arteries: A Review
1 Department of Engineering Science and Humanities, JSPM Rajarshi Shahu College of Engineering, Pune, 411033, India
2 Robotics and Automation Department, Symbiosis Institute of Technology, Symbiosis Institute (Deemed) University, Pune, 412115, India
* Corresponding Authors: Priyambada Praharaj. Email: ; Chandrakant R. Sonawane. Email:
Computer Modeling in Engineering & Sciences 2024, 141(3), 2021-2064. https://doi.org/10.32604/cmes.2024.056289
Received 19 July 2024; Accepted 08 October 2024; Issue published 31 October 2024
Abstract
This paper represents a detailed and systematic review of one of the most ongoing applications of computational fluid dynamics (CFD) in biomedical applications. Beyond its various engineering applications, CFD has started to establish a presence in the biomedical field. Cardiac abnormality, a familiar health issue, is an essential point of investigation by research analysts. Diagnostic modalities provide cardiovascular structural information but give insufficient information about the hemodynamics of blood. The study of hemodynamic parameters can be a potential measure for determining cardiovascular abnormalities. Numerous studies have explored the rheological behavior of blood experimentally and numerically. This paper provides insight into how researchers have incorporated the pulsatile nature of the blood experimentally, numerically, or through various simulations over the years. It focuses on how machine learning platforms derive outputs based on mass and momentum conservation to predict the velocity and pressure profile, analyzing various cardiac diseases for clinical applications. This will pave the way toward responsive AI in cardiac healthcare, improving productivity and quality in the healthcare industry. The paper shows how CFD is a vital tool for efficiently studying the flow in arteries. The review indicates this biomedical simulation and its applications in healthcare using machine learning and AI. Developing AI-based CFD models can impact society and foster the advancement towards responsive AI.Keywords
The biomedical domain has extensively used engineering and technology in recent years. Technology has aided the medical industry in all possible ways for decades by providing accurate, cheaper, and effective treatment methods for various diseases. Computational Fluid Dynamics (CFD) is the latest technology widely used in cardiovascular disease studies [1]. The review analyzes the pulsating blood flow in arteries using the latest technologies. This paper provides detailed insight into the recent contribution and state-of-the-art developments in CFD for studying blood flow patterns in arteries. Plaque and unwanted deposits on the walls of the arteries narrow the lumen of the arteries. This is termed stenosis. Stenosis blocks blood flow and exerts high stress on the artery walls. The geometry, location, and size of the stenosis have a crucial role in diagnosing various cardiovascular diseases. Mild stenosis (less than 25% reduction by flow area) is usually not noticeable as the blood flow is laminar. Moderate stenosis (less than 50% reduction by flow area) can have symptoms during heavy exercise as the blood flow increases, leading to disturbed flows. Severe stenosis (Over 50% reduction by flow area) brings abnormal and turbulent blood flows. This causes an excessive pressure drop, impacting the walls of the arteries. CFD simulations help in studying flow changes in case of such abnormalities. Thus, the various uses of CFD in bio-medical engineering include:
• Simulation of Blood Flow in Vessels: The present review focuses on this bio-medical application of CFD. It helps find out the flow properties of the blood, such as its velocity profiles, pressure drop, and shear stress exerted, by replicating the geometry of arteries and providing appropriate boundary conditions [2]. The shape, severity, length, location, and other characteristics of stenosis are altered to study its effects. Wall shear stress increases at the stenosis region, which is quite uneven in irregular stenosis. Irregular stenosis brings about more disturbed flows than uniform stenosis. Apart from the severity and shape, the location of the stenosis also plays an important role. Stenosis in the coronary artery affects the blood supply to the heart, whereas carotid artery stenosis affects the brain. These parameters play a determining role in finding out the various vascular diseases at the initial stages [3]. CFD provides functional information about the arteries and how flow properties affect some rare diseases such as dyspnea [4]. The other uses of CFD in the bio-medical domain are discussed in subsequent points.
• Flow simulation in different body vessels: The human body contains various shapes of blood vessels where the flow patterns differ. Flow patterns change with the shape and size of blood vessels [5]. The flow behavior in capillaries, veins, and arteries also differs due to the wall structure and pressure in the vessels [6]. Apart from blood, other flows of interstitial fluids are also studied.
• Precision Medicine: This is another challenging domain where the medicines prescribed are specific to an individual [7]. Personalized models are tried and tested for this purpose. All the flow patterns change from person to person; hence, medicines would also change, studying the individual blood’s properties [8]. Also, the use of AI and its various machine learning algorithms, such as support vector machines (SVM), deep learning, logistic regression, decision tree, random forest, K-nearest neighbor (KNN), and others, helps to give the customized solution comparing the results with the previous history [9].
• Artificial Organ Design: CFD has been successfully designing artificial organs [10]. It can design and simulate the results to show how successfully a designed organ can work. This avoids the repeated creation of a prototype that is expensive and cumbersome. Therefore, it is an excellent method for testing and designing such organs. It is cost and time-efficient [11].
• Cancer Removal simulation: Cancer is also a widespread and dreadful disease, and research for its study is another critical study in the biomedical field. It helps highlight how and where small tumors alter flow properties [12].
Fig. 1 shows the various critical applications of CFD in the biomedical field. Among them, the study of pulsatile blood flow in arteries has been quite prevalent among researchers. There are various heart-related diseases in today’s world. Diseases such as Atherosclerosis [13], where the arteries are hardened and the blood supply is reduced, and coronary artery disease (CAD), where plaque formation occurs, are some of the common cardiovascular diseases [14]. Flow properties, such as the shear stress on arteries’ walls and the blood’s velocity profile, among others, change whenever an abnormality occurs [15]. Hence, hemodynamics can be a valuable aid to doctors in diagnosing diseases at an early stage. Though it has been a very widely employed research topic for decades, the methodology to achieve this has been changing drastically with the advancement of technology. Initially, researchers focused on replicating blood flow experimentally, but with the advancement of computers, simulation results became more feasible and accurate. Computational fluid dynamics has recently been used in the simulation and analysis of fluid flow [16,17]. It allows for solving complex problems that are hard for experimental replications [18]. Performance improvements and enhancements can be done by changing configurations and geometries.
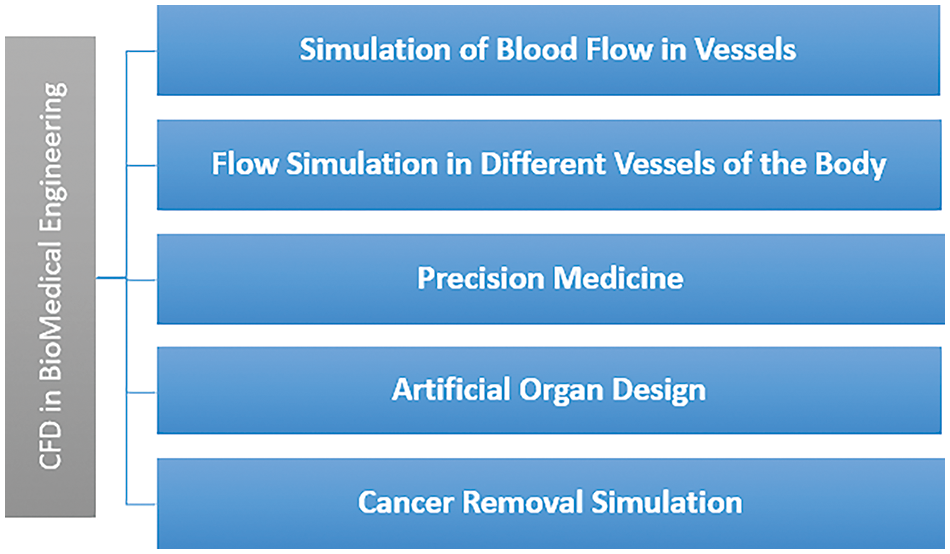
Figure 1: Common applications of CFD in biomedical engineering
Thus, instead of conducting numerous tedious experiments, which are challenging to replicate, efforts were made to model various artery sizes and stenosis using various software. Detailed meshing was performed to incorporate it into a computational grid, preparing it for simulation and facilitating the determination of flow properties. After successfully executing models, researchers emphasized retrieving the patient images and putting them into the computational domain. The introduction of Graphics Processing Units (GPU) and Artificial Intelligence (AI) in such simulations also provides a more realistic approach to the study [19]. The use of CFD modeling in the cardiovascular field has not only been restricted to the study of flow properties of blood but also in medicines, designing devices, clinical investigations, and others [20]. Therefore, with the fast advancement of technology, simulation methods have changed drastically from image acquisition to the development of CFD solvers [21]. This review aims to highlight the various research and methodologies involved to offer a clear insight into various methods to study this biomedical application. Fig. 2 illustrates the various methods used in the last few decades, from experimental to patient-specific modeling of blood. Experimental studies investigate the flow properties of the blood by replicating them and analyzing the flow through various visualization techniques. Then, models of the arteries are created and refined by providing proper boundary conditions. Various post-processing tools facilitate these studies. Recently, images of the diseased arteries have been segmented and processed for input into CFD software and solvers, yielding more realistic results using actual geometries.
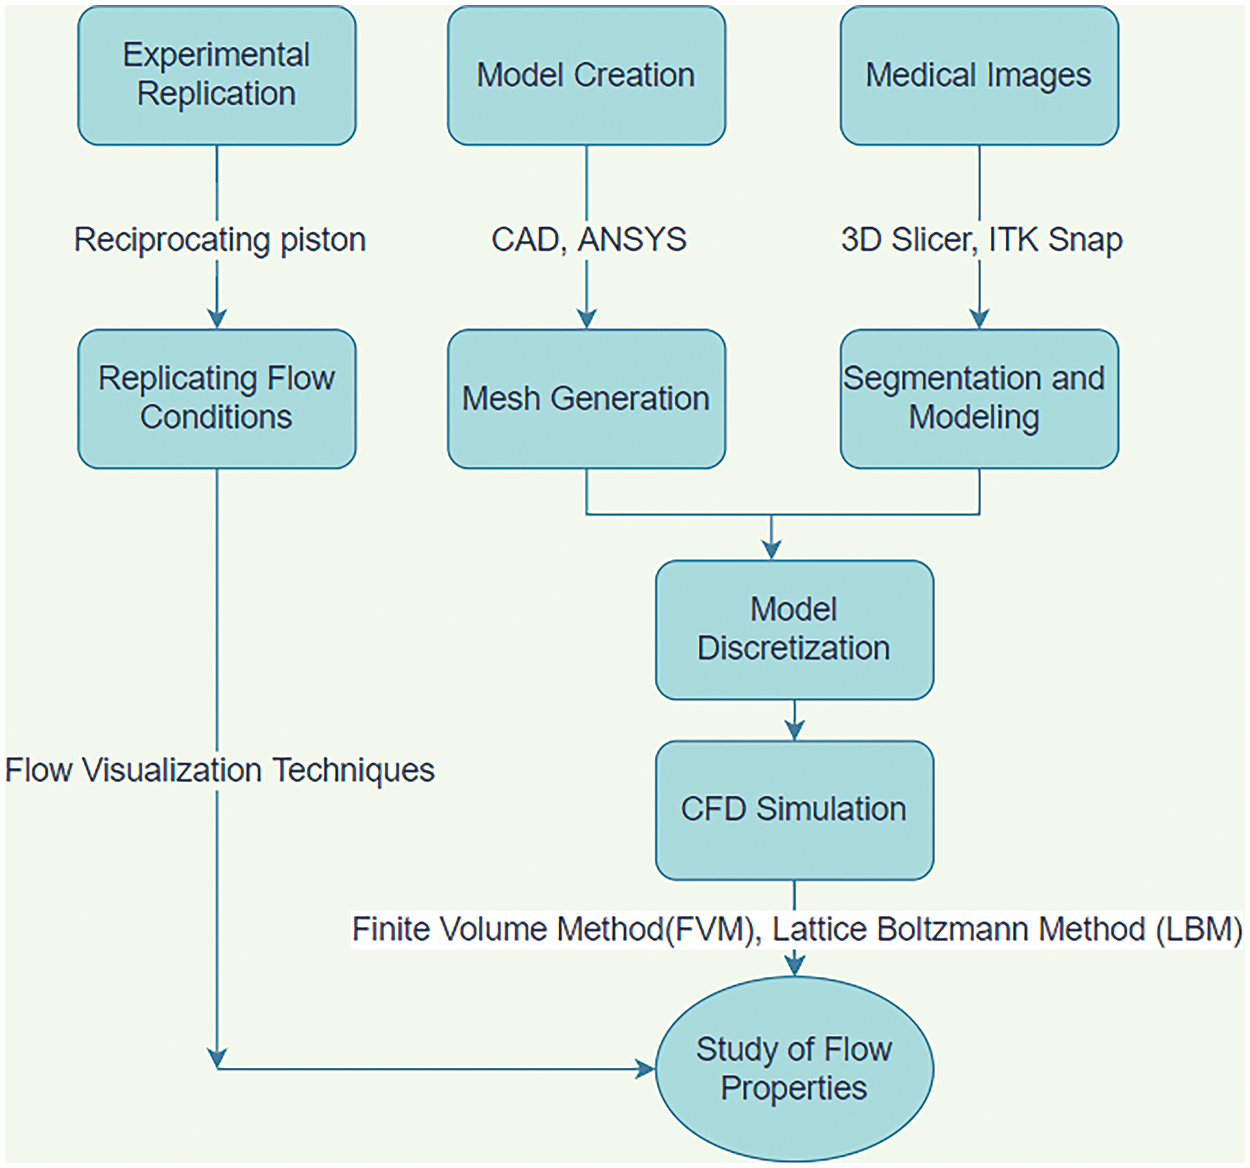
Figure 2: Various methods used for CFD simulation over the years
This paper’s Section 2 explains the Research Methodology used for data collection and extraction. The Section 3 deals with the ‘Quantitative Analysis’, through tables, graphs, and pictorial representation. The Section 4 deals with the “Qualitative Analysis” which gives a broad overview of the growth of the latest technologies utilized to investigate the flow patterns in arteries. Section 5 briefs about the various results obtained from these simulations. It presents the conventional methods and the state-of-the-art techniques available in this field. Section 6 discusses the challenges encountered, followed by the advanced approach of CFD in Section 7. This section explains the role of AI in CFD for studying cardiovascular diseases, followed by a conclusion and future scope in Section 8, respectively.
An extensive survey was conducted to provide a vivid idea about the ongoing research for analyzing and quantifying the documents and literature. It is also a one-stop solution for getting informed about the area of research, outstanding researchers, various collaborators, and others. To be precise, it is first-hand information regarding a particular field of research.
An extensive search on the topic was done in various databases. The most relevant papers were found in Scopus and Web of Science databases. Also, the types of papers were similar to the intention of the search. It can find the same papers reoccurring in both databases [20]. Therefore, this paper focused on Scopus and Web of Science (WoS) databases for the search query. Hemodynamics is “the study of the dynamics of blood” in arteries. Hence, the keyword “hemodynamics” was employed to see a huge collection of documents in Scopus and WoS. 66,412 documents were found in WoS, whereas 257,526 documents were available in Scopus. However, since this search was quite comprehensive and will not serve the actual purpose, the paper refined the search with the keywords “hemodynamics”, “CFD” and “heart arteries.” The search has been conducted since 1991. The results dropped to 879 documents in Scopus and 388 documents in WoS. Finally, “pulsat**” was added to the search. The word pulsat** indicates that the database would include words starting with pulsat**, such as pulsating, pulsatile, and others. The number of documents reached 114 and 183 in WoS and Scopus, respectively. The number of documents also gets refined as the search becomes more specific. Table 1 shows the result as follows:
The Quantitative Analysis of both databases focuses primarily on
• Trends in the yearly publication of documents.
• Country-wise publication of documents.
• Distribution based on research institution.
• Distribution based on subject categories.
• Network analysis.
• Citation analysis.
The Qualitative Analysis portrays the history of the study of the “pulsatile nature” of blood flow. It shows the introduction of CFD in the last few decades for accurate simulation. It also highlights how image processing has successfully incorporated patient-specific geometries into CFD simulation, giving it a more realistic approach. The latest developments, such as GPU and AI, are introduced in this study.

The analysis is done on the refined search of the two databases, taking the second search result out of the three searches (388 for WoS and 879 for Scopus). Before the detailed literature review, this gives an overall idea of the developments carried out in the past years and the need for research in the upcoming years.
3.1 Trends in the Yearly Publication of Documents
Fig. 3 depicts the importance of the research by showing the number of papers published every year. Although the research started early in the early 70s, it gained momentum only a few decades ago. The number of publications showed an increasing trend, showing a maximum number of documents in 2020 for Scopus and 2021 for Web of Science. CFD in the biomedical domain is quite complex and expensive due to the complex computational domain and realistic boundary problems such as pulsating flow, moving boundaries, patient-specific geometry, and others. Hence, the integration of Deep Learning in CFD helps accelerate CFD simulations. This makes the research more realistic from the clinical point of view. This new technology in CFD gives the problem a multidisciplinary approach, which also increases the number of papers published in the last ten years.
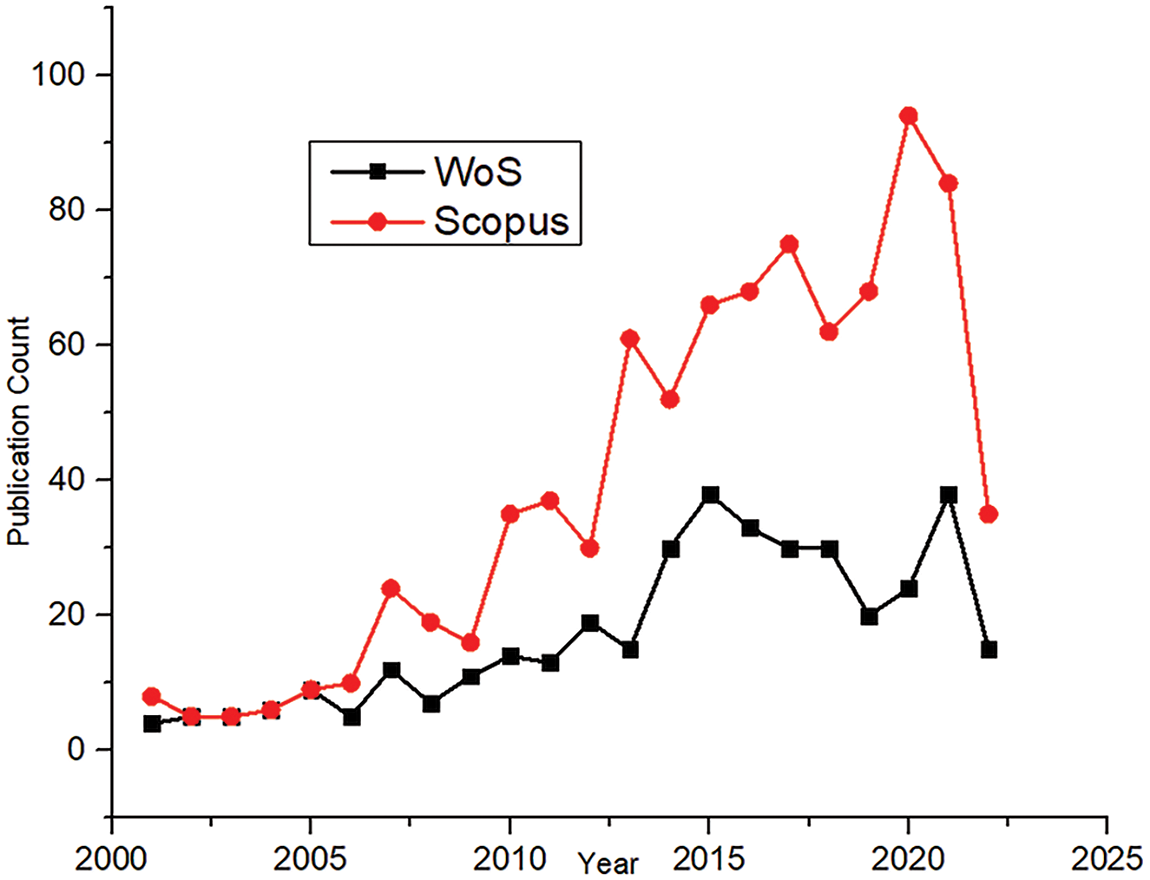
Figure 3: Year-wise comparison of publications
3.2 Publication Based on Countries
Cardiovascular diseases are one of the most commonly occurring diseases throughout the world. Due to an increasing death rate, extensive research has been done across the globe. A detailed analysis was done for all the countries involved in this research area. Both the databases, Scopus and WoS, were evaluated where. Scopus has publications from more than 70 countries, whereas WoS contains publications from over 50 countries.
Fig. 4 shows the number of documents published by the top ten countries. Records show that the maximum number of deaths in The United States is due to heart-related diseases.
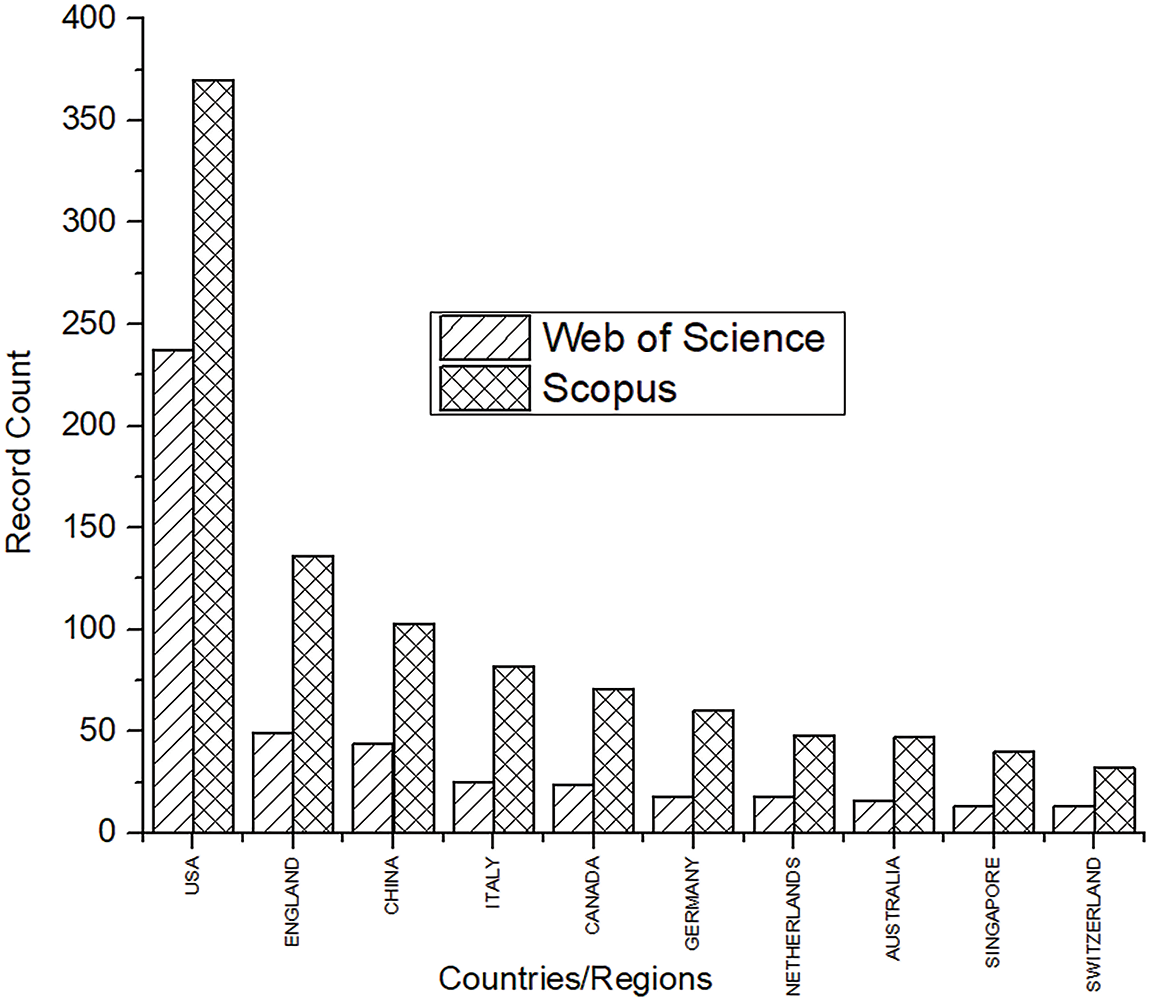
Figure 4: Top 10 countries in Scopus and WoS with the highest number of publications
High blood pressure, cholesterol, and smoking are some essential factors for heart strokes. Obesity and type 2 diabetes are the culprits commonly observed in the United States. Hence, the research in this area has also been highest in the U.S. for both databases. A sedentary lifestyle commonly seen in such developed countries increases the risks of CAD. Research shows that the death rate in Eastern Europe is 59%, whereas in Sub-Saharan Africa it is about 10% [22]. After the USA, other vital countries included England, China, and Italy. Certain undefined publications were also observed in Scopus that were not affiliated with any country. A satellite map showing the top 20 countries will help to understand the actively involved countries. A world map in Fig. 5 gives a global overview of the 20 major countries in this research area.
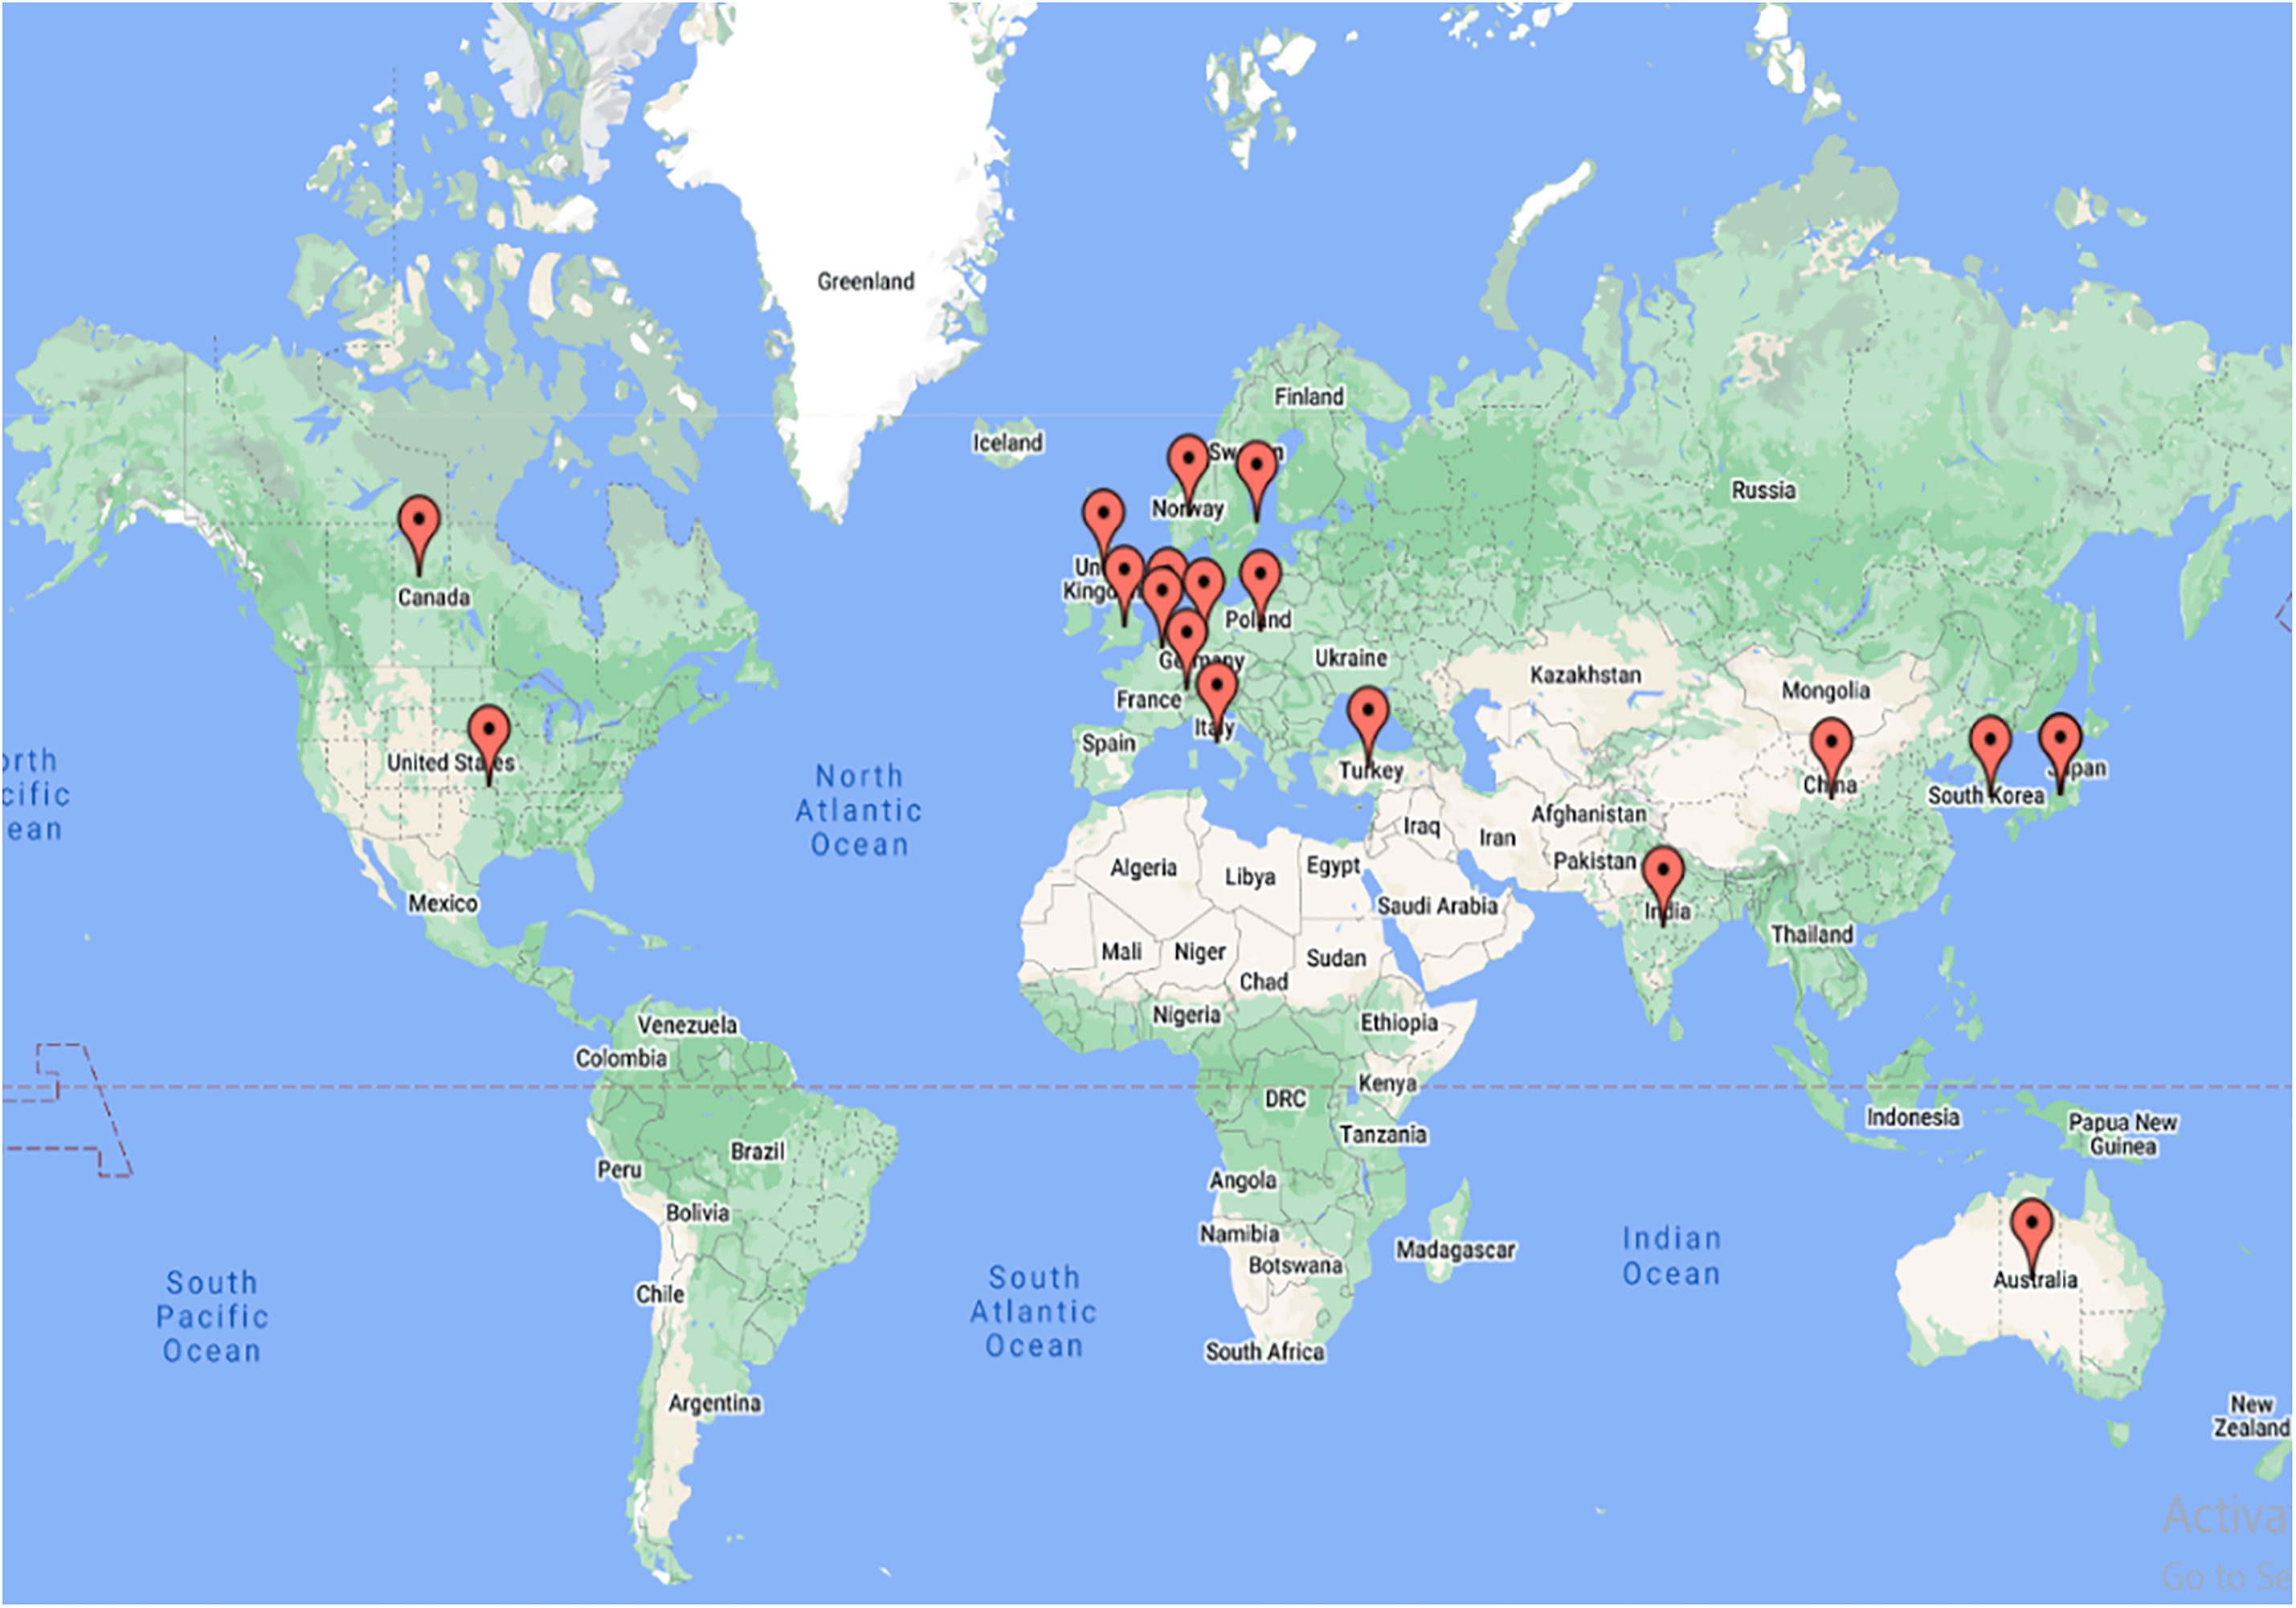
Figure 5: Satellite map of the top 20 publishing countries in both databases
Thus, the research has been seen as dominating in most developed countries. Recent studies also show that modernization in low and middle-income countries has led to an increase in cardiovascular diseases and deaths, too. The need is the mother of innovation. Hence, hemodynamics and cardiovascular research have started to show their presence in developing countries such as India and Poland. For this purpose, various research institutions across the globe have established adequate and world-class research facilities. The details of such research institutes are discussed in the next section.
3.3 Distribution Based on Research Institutions
The analysis of publications related to countries and yearly publications gave knowledge about the growth of this research domain across the globe. A similar analysis regarding the research institutes was conducted and compared for both databases. Research institutes give researchers a platform to perform basic and applied research. It has all the essential facilities required by a researcher. Hence, surveying the research institutes will help researchers approach them and find the facilities essential for their work. Fig. 6 shows that the US has great research funding institutions, such as the “University of California (UC)” and “Georgia Institute of Technology (GIT)” where the research is funded not only by the government but also by big corporations. Excellent facilities provided by the finest research institutes in the United States, the United Kingdom, and others can be another possible reason for the large number of publications in these areas. These institutions are equipped with the latest technical specialties. Cardiovascular fluid mechanics (CFM) at Georgia Tech is one of the world’s greatest laboratories, studying heart mechanisms and various cardiovascular defects.
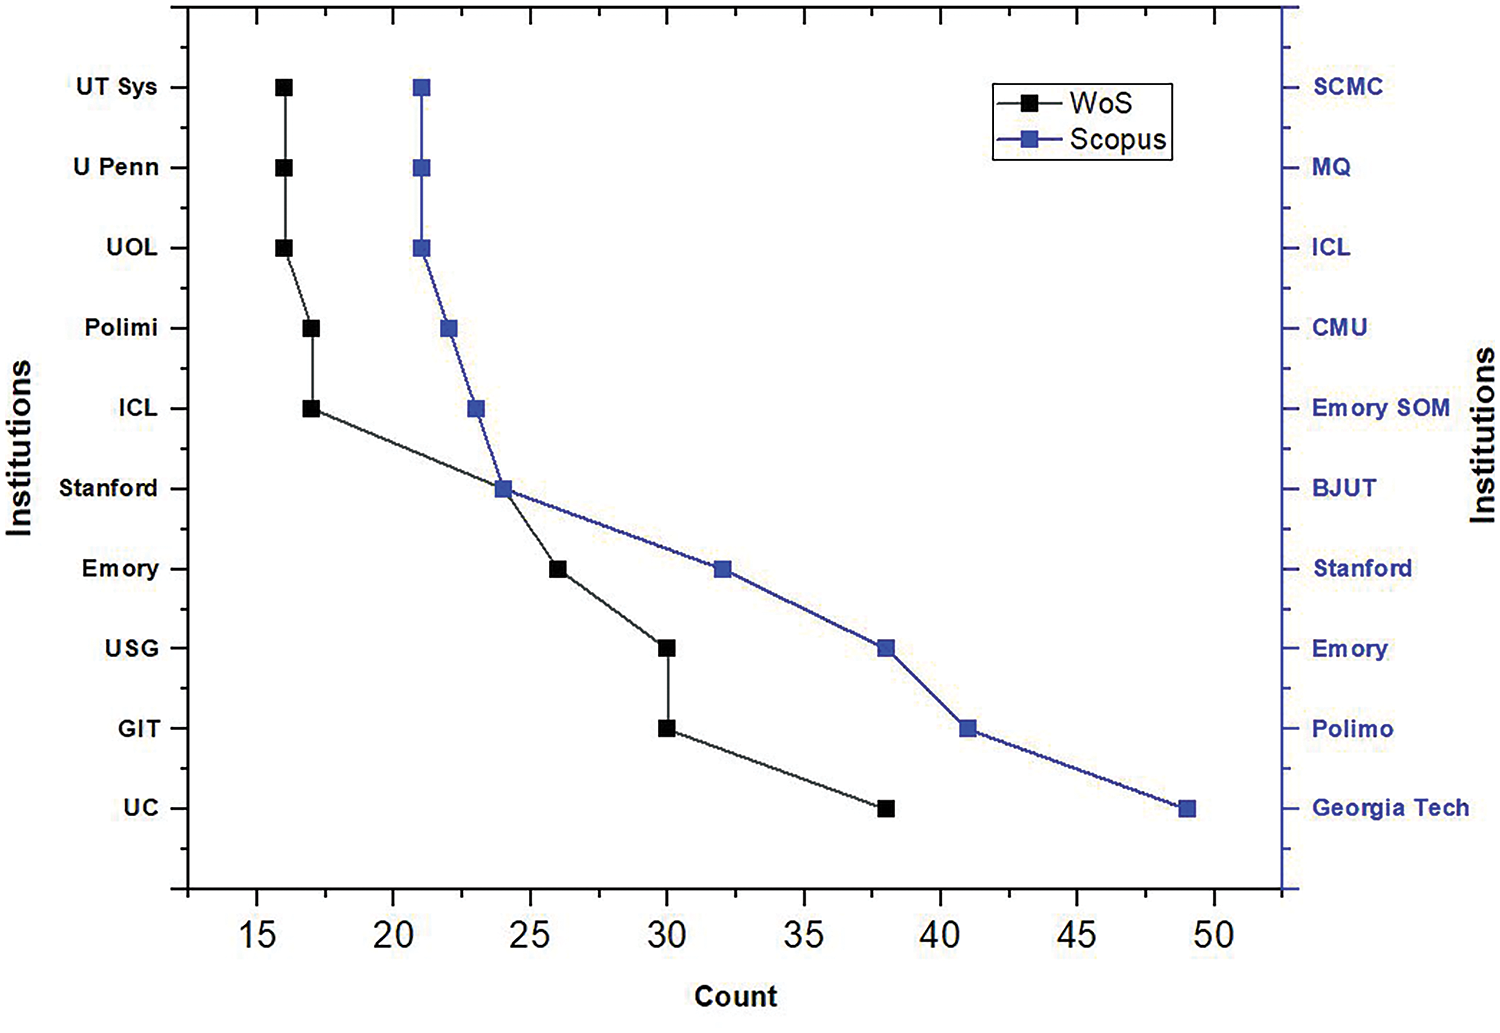
Figure 6: Top ten affiliations: WoS and Scopus
The top ten affiliations of the research institutes were gathered from both databases. The United Kingdom also has outstanding research institutions like the Imperial College of London and the University of London. These premium institutes work extensively in science, engineering, business, and medicine.
3.4 Distribution Based on Subject Categories
The study of flow in arteries is a multidisciplinary approach. Apart from CFD, it has significant roles in medicine, bio-engineering, physics, and others. Hence, an analysis based on the subject area will be conducted to determine the significant disciplines actively involved in this field of research. Data from Scopus and WoS show that medicine and engineering are the top domains. This signifies that engineers are actively involved in studying biomedical applications.
Blood flow studies are an essential social factor and a critical research domain. The medical industry goes hand in hand with engineering techniques to fight the problems related to cardiovascular diseases. The pie chart in Fig. 7 also validates how engineering has supported the medical domain. It shows maximum contribution in this field of research. Various fields of engineering have a significant role in contributing to hemodynamics. Initially, CFD has successfully studied functional information such as localized shear stress in the artery’s walls. Not only that, the study of CFD gives us an idea of the underlying cause of the disease from the flow perspective of blood. Flow simulation was used clinically in 2015 for the first time by Alberto Figueroa, professor of Biomedical Engineering and Cardiovascular Surgery at the University of Michigan, for surgical intervention.
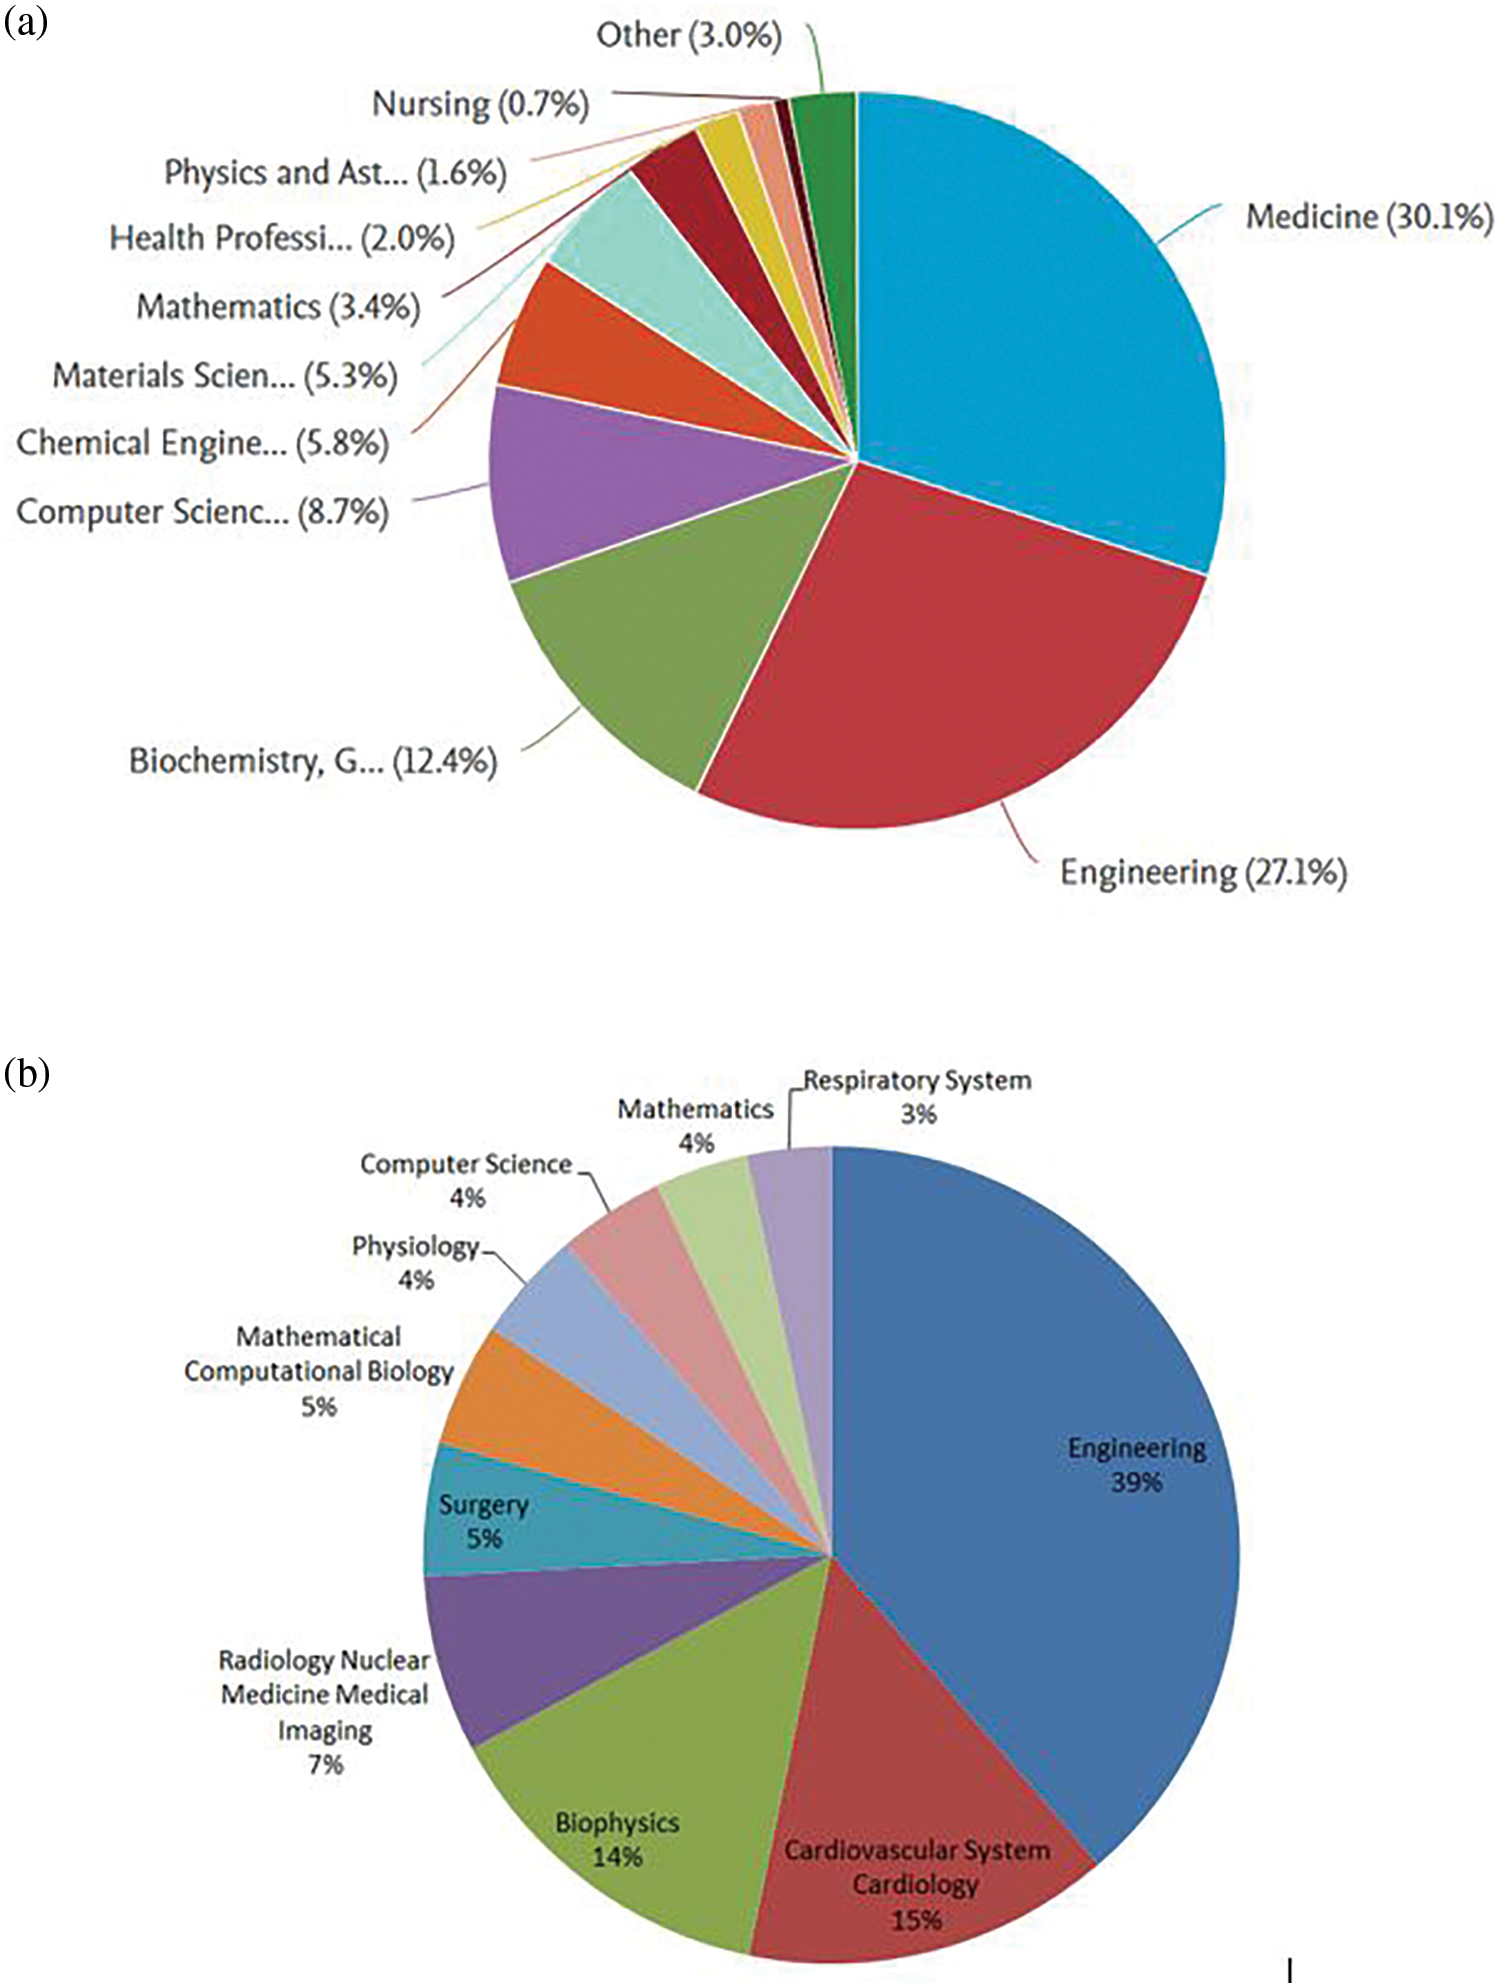
Figure 7: Top ten subject categories: (a) Scopus and (b) WoS
Apart from CFD, mini sensors are designed that can be implanted in the bloodstream and measure important cardiovascular indicators [23]. Philips is a global electronics company with a global partnership with the “World Heart Federation” by providing personalized solutions for diagnosis and treatment. Various machine learning algorithms work in many fields of cardiovascular diseases. Big data analytics is beneficial in predicting abnormal conditions related to heart diseases. Deep learning analysis is helpful in various diagnostic modalities, such as angiography and echocardiography. These successfully identify diseases such as atherosclerosis and know the disease’s stage [24]. With these studies, the graph justifies the role of engineering in studying cardiovascular diseases.
Network analysis generally refers to the study of various visual patterns between various factors, depending on the domain of survey and research. The main idea of the analysis is to get information about the dimensional domain of research and its relevance. This can be very well found by visual analysis. There are various tools for analyzing such scientific data analysis. Software tools such as VOSviewer, Citeseer, and Pajek offer excellent data visualization. Statistical analysis software such as Gephi also provides statistical data in CSV files. VOSviewer is employed to analyze the data network due to its excellent visual distribution. Such visualization analysis highlights the relations based on keywords, publications, citations, and author relationships. Hence, a network analysis was done using VOSviewer software by taking data from the Scopus database. Since the database has massive data for our area of research, two attributes were considered at a time and compared for better understanding.
Fig. 8 shows the relation between the co-authorship and countries. The nodes imply countries with research articles that different scholars have co-authored in the same publication. It helps identify global collaboration when working on a particular research area. The network is selected based on the criteria of selecting five countries’ documents with at least one citation per country. It indicates that out of 124 countries, 42 countries meet the threshold. The bigger the dot size, the greater the research influence. The United States of America has the highest collaboration with other countries, followed by China and UK.

Figure 8: Network analysis based on co-authorships with other nations
Bibliometric Coupling tells us about the overlap or the intersection of the references. It is an excellent way of identifying clusters in a particular research area. Bibliographic Coupling is possible when two works point to the same third work in their references. When two research papers share many references, it implies that they have a strong relationship and work on similar aspects. The more meshing in the network, the more the coupling. Fig. 9 indicates that the nodes refer to the research papers of a country, and the connecting lines are the links they share. The United States, China, and the United Kingdom have maximum coupling with other countries, as shown in Fig. 9.
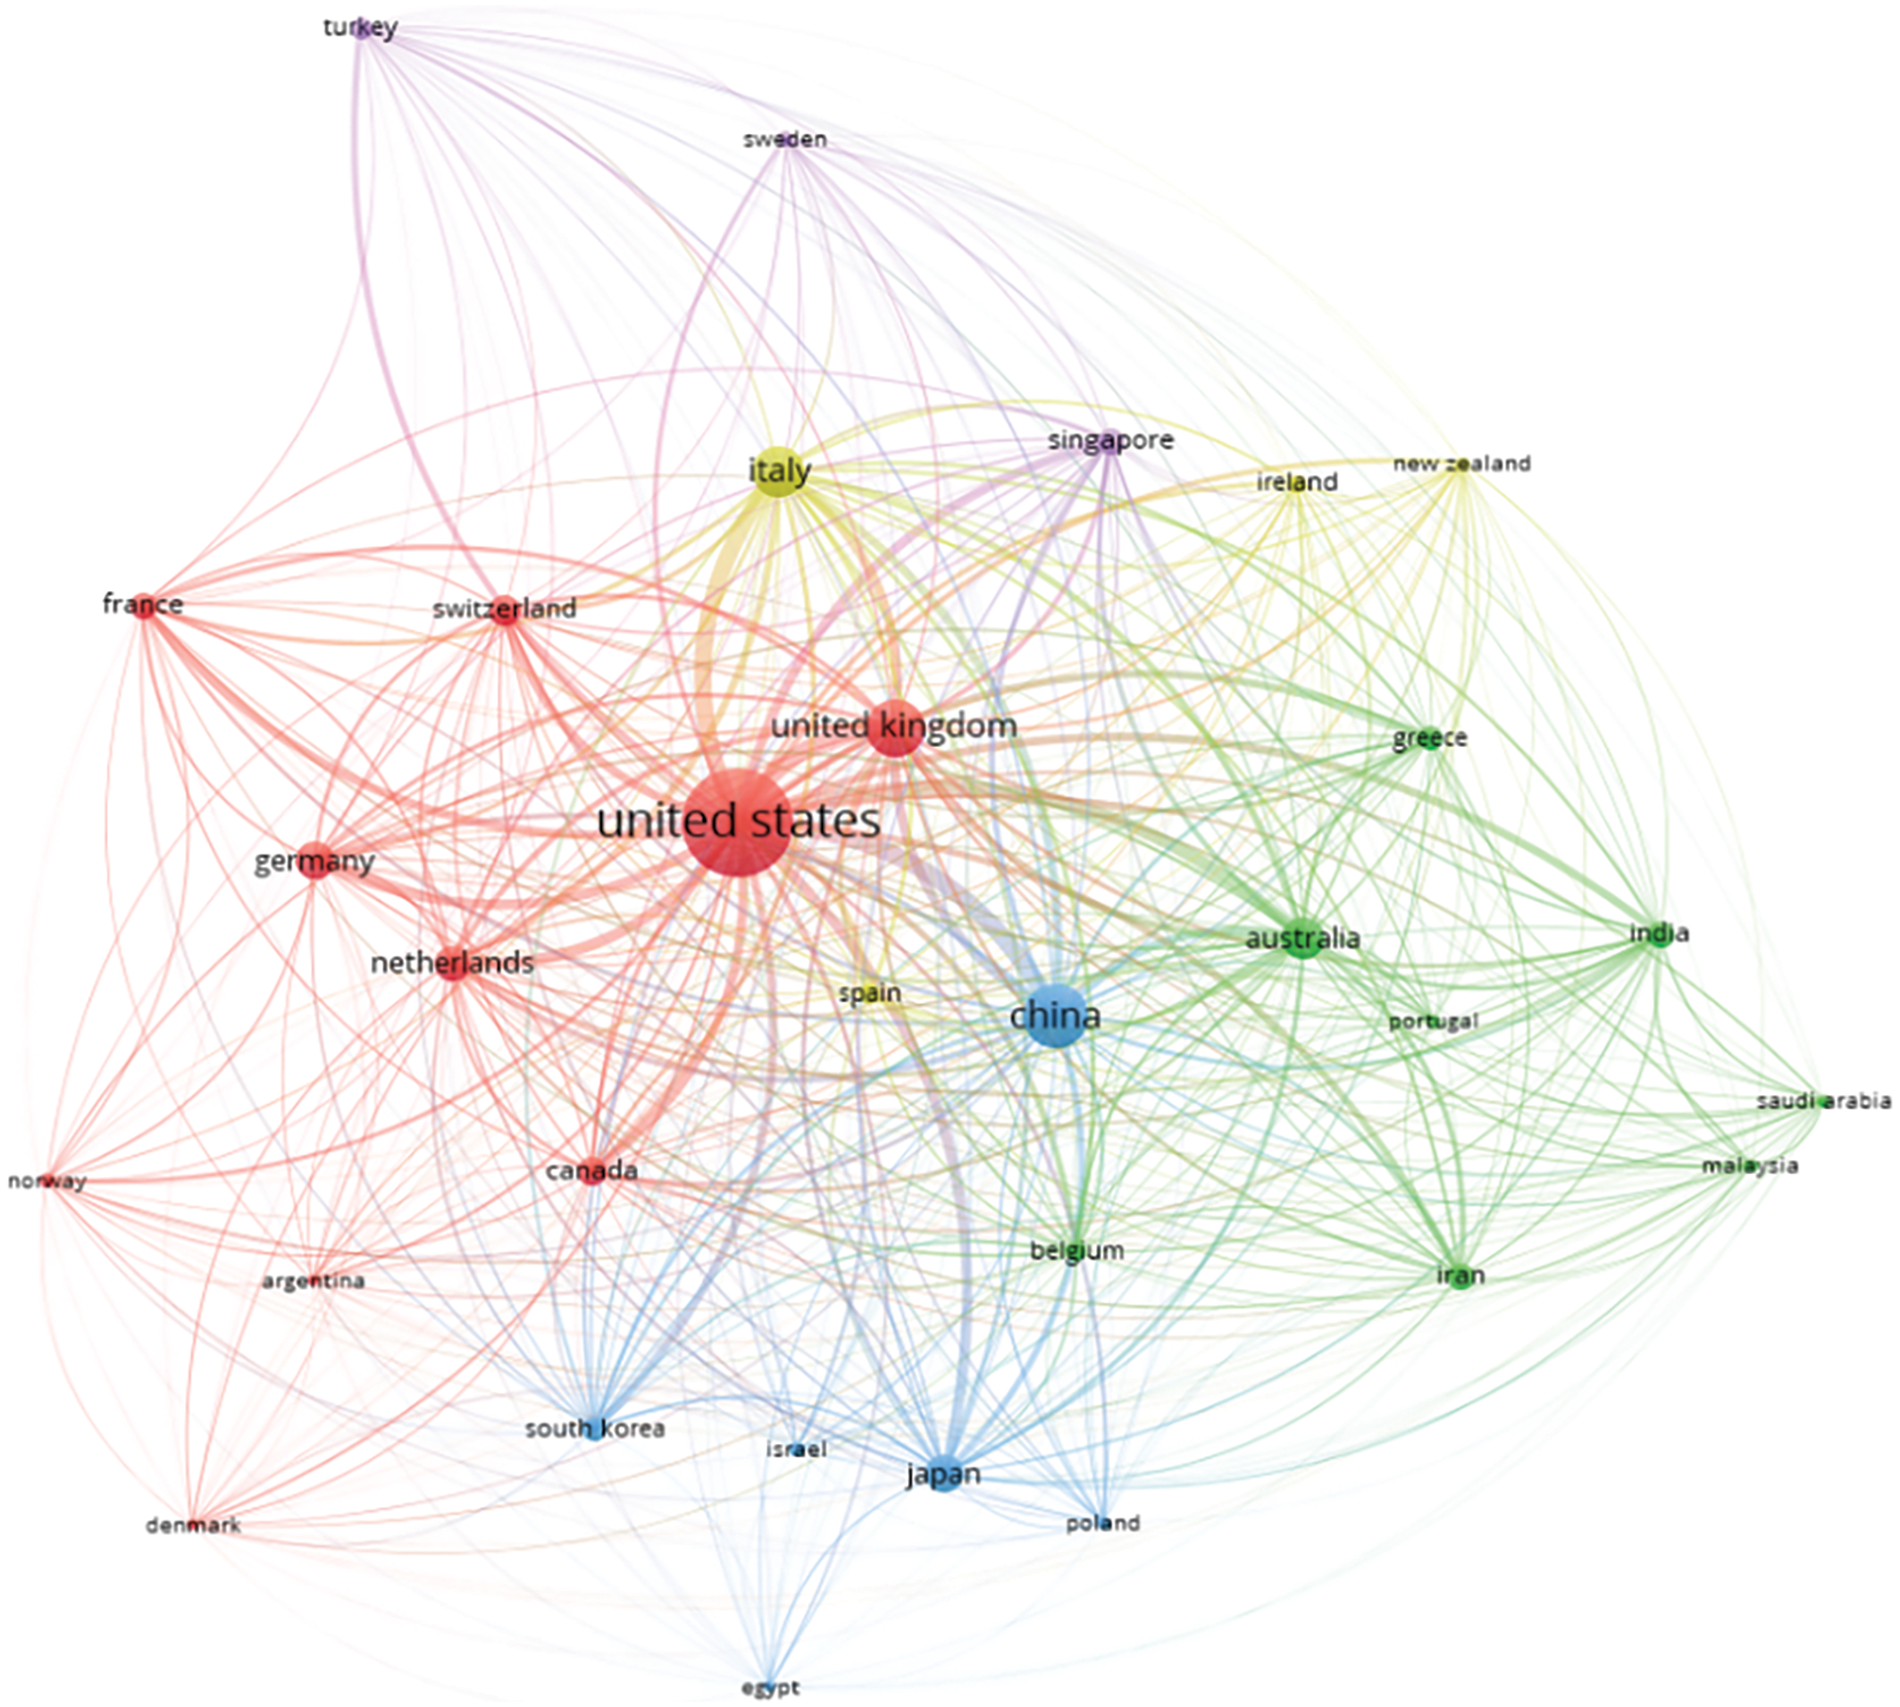
Figure 9: Network analysis based on bibliometric coupling
Citations refer to authentic sources that are utilized to support research. Citation analysis validates and authenticates a document. More citations refer to good quality work, which would benefit the researcher. It is an excellent way of tracking the research trends. An increasing trend in the graph states that the research area has become increasingly recognized and impactful in society.
Fig. 10 shows the citation of the total number of documents in the particular research area from 2018 to mid-2022 for both Scopus and WoS. The increasing trend in the citation index represents that research is of interest in the present field of research. The increasing trend in the citation index represents the activeness in the present field of research.
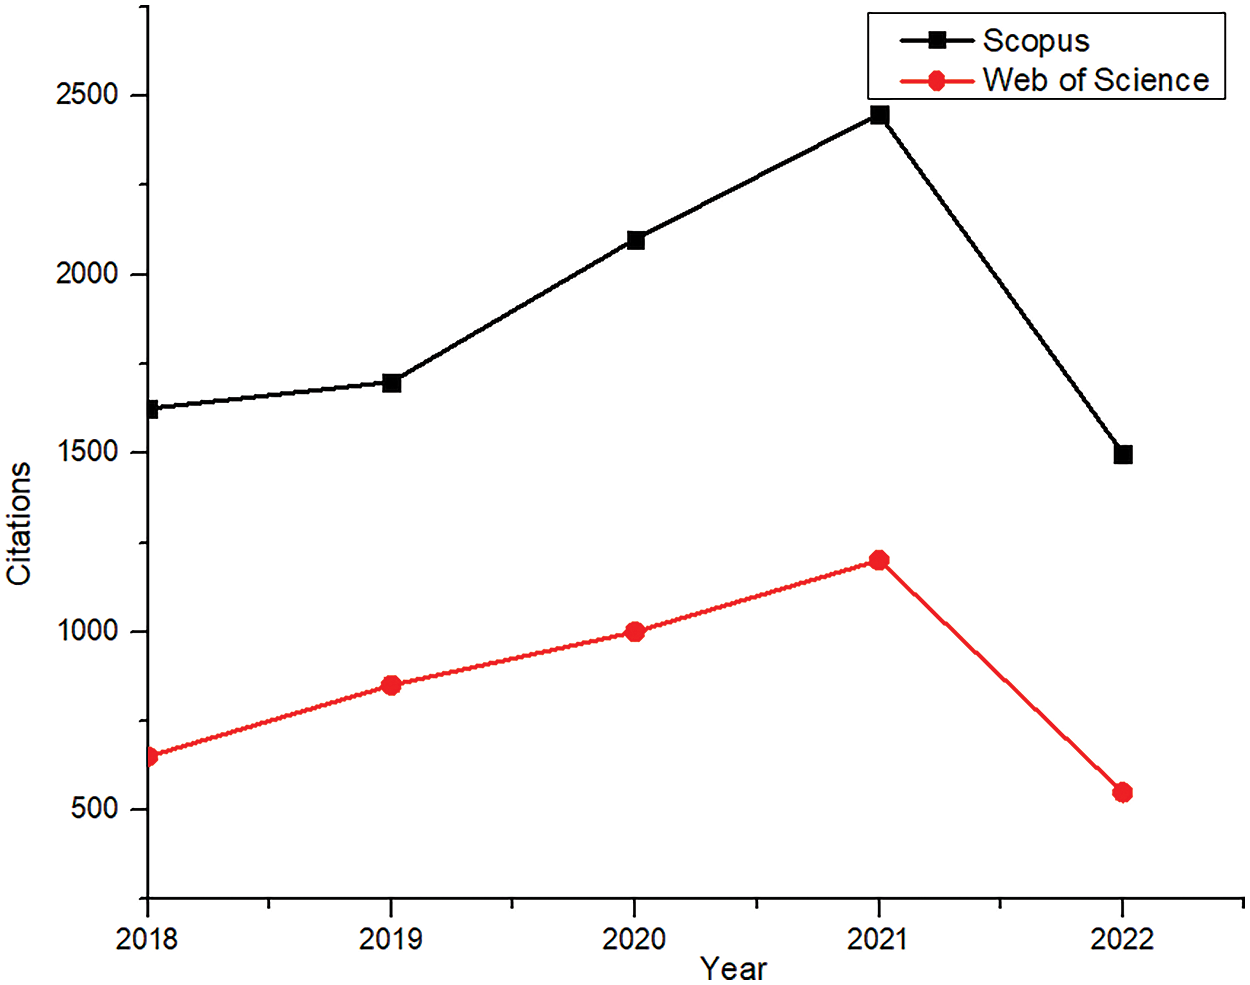
Figure 10: Citation analysis (Scopus and WoS)
Tables 2 and 3 communicate the top ten cited publications from the two databases in the last five years.
This section describes the detailed journey of the study of pulsatile flow in arteries. Apart from experimental and numerical studies, it highlights other aspects, such as the introduction of patient-specific modeling and the use of parallel computing in CFD simulations. The non-Newtonian nature of blood [42], as well as the elastic walls of the arteries, is taken into account while doing the CFD simulations. These help to bring more realistic and faster results. Non-Newtonian models successfully record the variable viscosity, and the elastic walls show the changes in structure due to the pulsatile nature of the flow. Researchers have observed that non-Newtonian behavior is seen prominently in the region of stenosis [43]. The addition of responsive AI in recent years has helped adapt real-time monitoring and accurate diagnosis.
4.1 History or Conventional Method to Study the Pulsatile Flow
Cardiovascular diseases have been a crucial problem in society for decades. Scientists have always tried to replicate the heart’s blood flow. Many experimental setups [44] have been conducted for decades when computer-based simulations were relatively rare. Various methodologies and assumptions were considered while studying the pulsatile flow of the artery. Most of the experimental investigations studied this unsteady flow and its effects by considering the artery as a pipe, neglecting its flexibility [45]. Experiments were conducted for channels, ducts, and pipes to analyze flow properties such as pressure drop, velocity profiles, and wall shear stress [46]. Researchers also considered various geometries such as curved, straight, bent, and constricted tubes by providing a pulsating inlet [47–49]. A non-dimensional parameter called the Dean number helped study the flow in curved pipes [50]. It helps determine whether the flow is unidirectional, laminar, or turbulent. Dean Number also helped study the secondary flow developed due to curvature in the bend [51]. The Green Function method also effectively studies pulsating and laminar flow in ducts and microchannels [52].
Initially, various non-dimensional quantities, velocities, flow rates, and viscous drag were calculated for rabbits and dogs, similar to humans’ arterial flow [54]. The blood was also regarded as Newtonian. The pressure gradient and velocity gradient were a function of time only. Pressure variations and velocity gradient, measured at different points from the stenosis (constriction), clearly understood the phase lag conditions, which were prominent at fast oscillations [55]. Various experiments were evaluated for rigid and elastic walls and were compared to their wall stress, flow separation layer, velocity profiles, and others [56].
Experimental investigations included single stenosis and tried to evaluate the changes in hemodynamic parameters by increasing the severity and number of stenosis. The pressure drop rises exponentially with the increase in severity.
Fig. 11 shows the experimental set-up of stenosis with 75% constriction to investigate the flow properties. It indicates the tube has a mechanical property similar to the stenosed artery and a pump to provide the pulsatile flow. The data acquisition system is attached to the setup and provides the hemodynamic parameters as output. Table 4 lists the pressure drop of single and double stenosis at different severity percentages [57]. It highlights the increase in pressure drop when the blockage increases. Double stenosis has a greater pressure drop than single stenosis. Table 4 indicates that the pressure drop is almost the same when the stenosis percentage is 45%, but for 82% stenosis, the pressure drop in double stenosis is much more than in single stenosis. Thus, multiple stenosis with a lesser percentage poses less danger than single stenosis of higher severity. The experimental investigation became a crucial breakthrough to validate the theories and replicate the flow properties of blood in arteries. Table 5 lists various experiments conducted and the outcomes achieved.
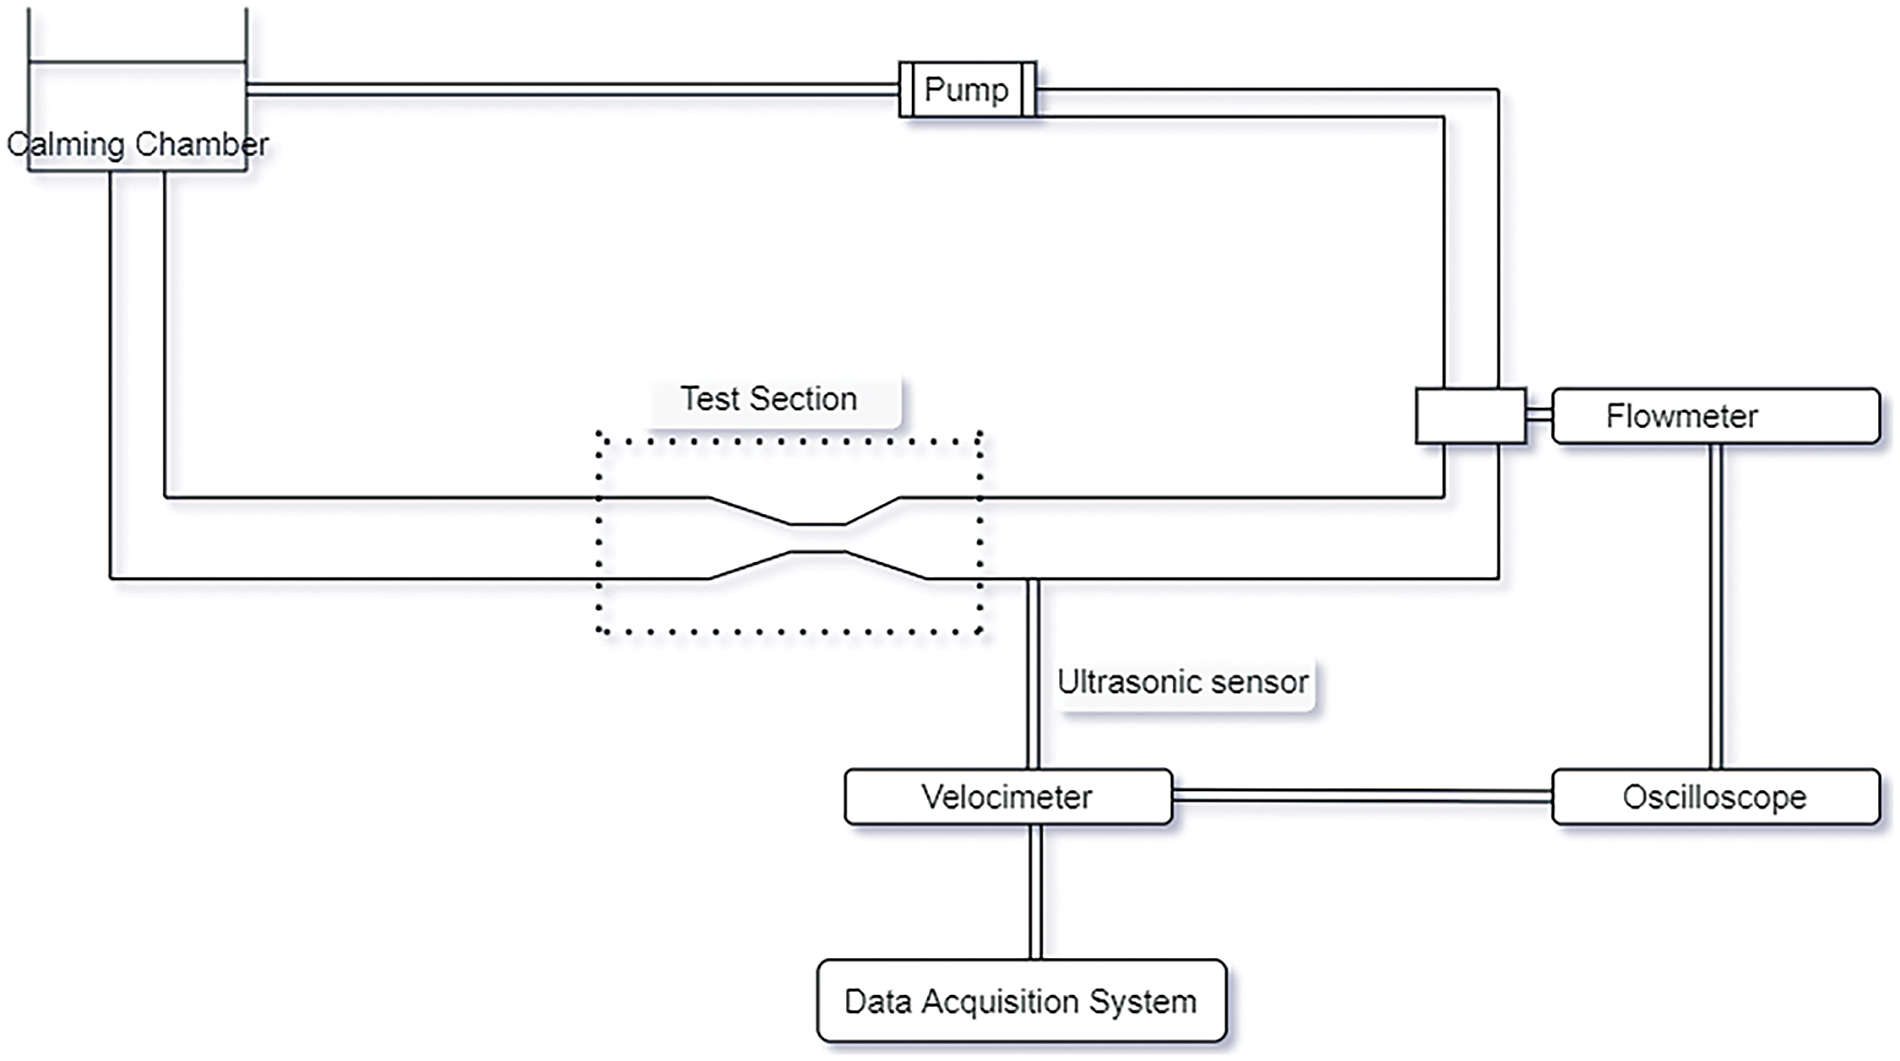
Figure 11: Experimental study of flow through stenosis [53]

4.2 Numerical Analysis in Cardiovascular Studies
Due to the advancement of technology, the research mode shifted from experimental to numerical and then computational by the early 90s. From mathematical models to computational methods, the change has been drastic. The introduction of CFD was a significant breakthrough in fluid dynamics. Computers began calculating the flow properties efficiently [60,61]. The early 2000s was the era when CFD techniques took over mathematical models. Various finite volume-based algorithms and software, such as ANSYS Fluent, CFX, and others, were introduced for simulation purposes [62–64]. It involved pre-processing, i.e., geometry definition and mesh generation. Once the mesh is generated, fluid properties are considered. Flow physics is then modeled using appropriate boundary conditions. Finally, the results are validated [65–68]. Fig. 12 depicts the step-wise process for the numerical simulation for a clear understanding. Numerical simulation has become highly beneficial, as it can avoid the experimental replication of the heart’s blood flow, which is quite complex in nature.

Figure 12: Steps involved in numerical simulation
Defining the geometry and appropriate mesh creation are the initial steps to numerical simulation. Inappropriate mesh creation would lead to erroneous results. Mesh elements and nodes of the mesh should be appropriately utilized to extract information and validate flow properties. Mesh discretizes the flow domain into an appropriate number of cells for optimum prediction. Researchers have tried discretizing their models for different grid densities and time steps to evaluate the flow properties. Grids are refined, time steps are altered till stable solutions are attained, and the solution is grid-independent. Lee et al. [56] tested three different grid densities and numerous time steps to bring about the stability of a solution. He finalized his meshing with 30,750 nodes and 50 time steps for optimum results. The following steps in numerical simulation are implementing governing equations and selecting appropriate models, such as the turbulence model, based on the problem. The selected mathematical models are now solved by defining appropriate boundary conditions and flow properties, followed by results and validation [69]. The geometry and meshing can also be axis-symmetric in cases of uniform stenosis. The purpose of making an axis-symmetric geometry is that the simulation can be done for only one-half of the geometry, saving computation time. The geometry and meshing of a stenotic model are shown in Fig. 13.
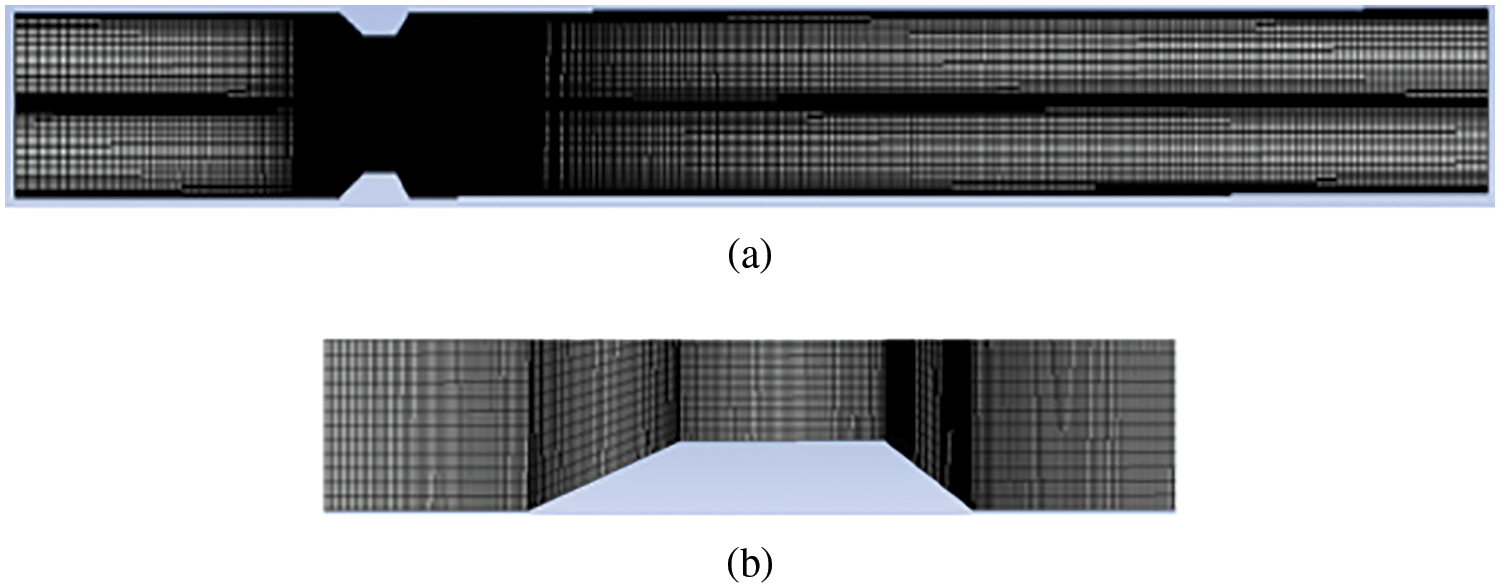
Figure 13: (a) Structural model of the stenosed artery for computational purposes; (b) Closer view of the mesh
Various image-based modeling techniques were introduced to simulate pulsating flow in arteries and give a realistic view [70]. The major hindrance that came in the way was the simulation time. Due to complex geometry and complex codes, calculations took much time. Parallel computing was introduced to handle such complexities. The problem was broken down and solved in multiple cores using multicore processors to reduce time and money. Independent blocks of codes were written, which can be solved simultaneously. CUDA, OpenACC, and Open MP are beneficial for this purpose [71–74]. Such platforms significantly reduced the time for complex numerical simulations [75–79].
4.3 Medical Image Segmentation for Patient-Specific Modeling of Blood Flow
In the last decade, patient-specific models took over geometric models. Fig. 14 illustrates the basic steps involved in analyzing a patient-specific blood flow in the heart. Patient-specific models give more realistic results in studying the pulsating flow of arteries [80]. The images were taken from various modalities such as CT, cardiac MRI, and 3D/4D echo. These images need processing, such as reconstruction, denoising, mapping, and others. Echocardiography is usually utilized to diagnose many heart diseases as it is readily employed to calculate cardiac output, ejection fraction, diastolic function, and others. These images need processing, such as reconstruction, denoising, and mapping. In addition, Cardiac CT is also used as it provides spatial resolution, but it has a higher risk of radiation.
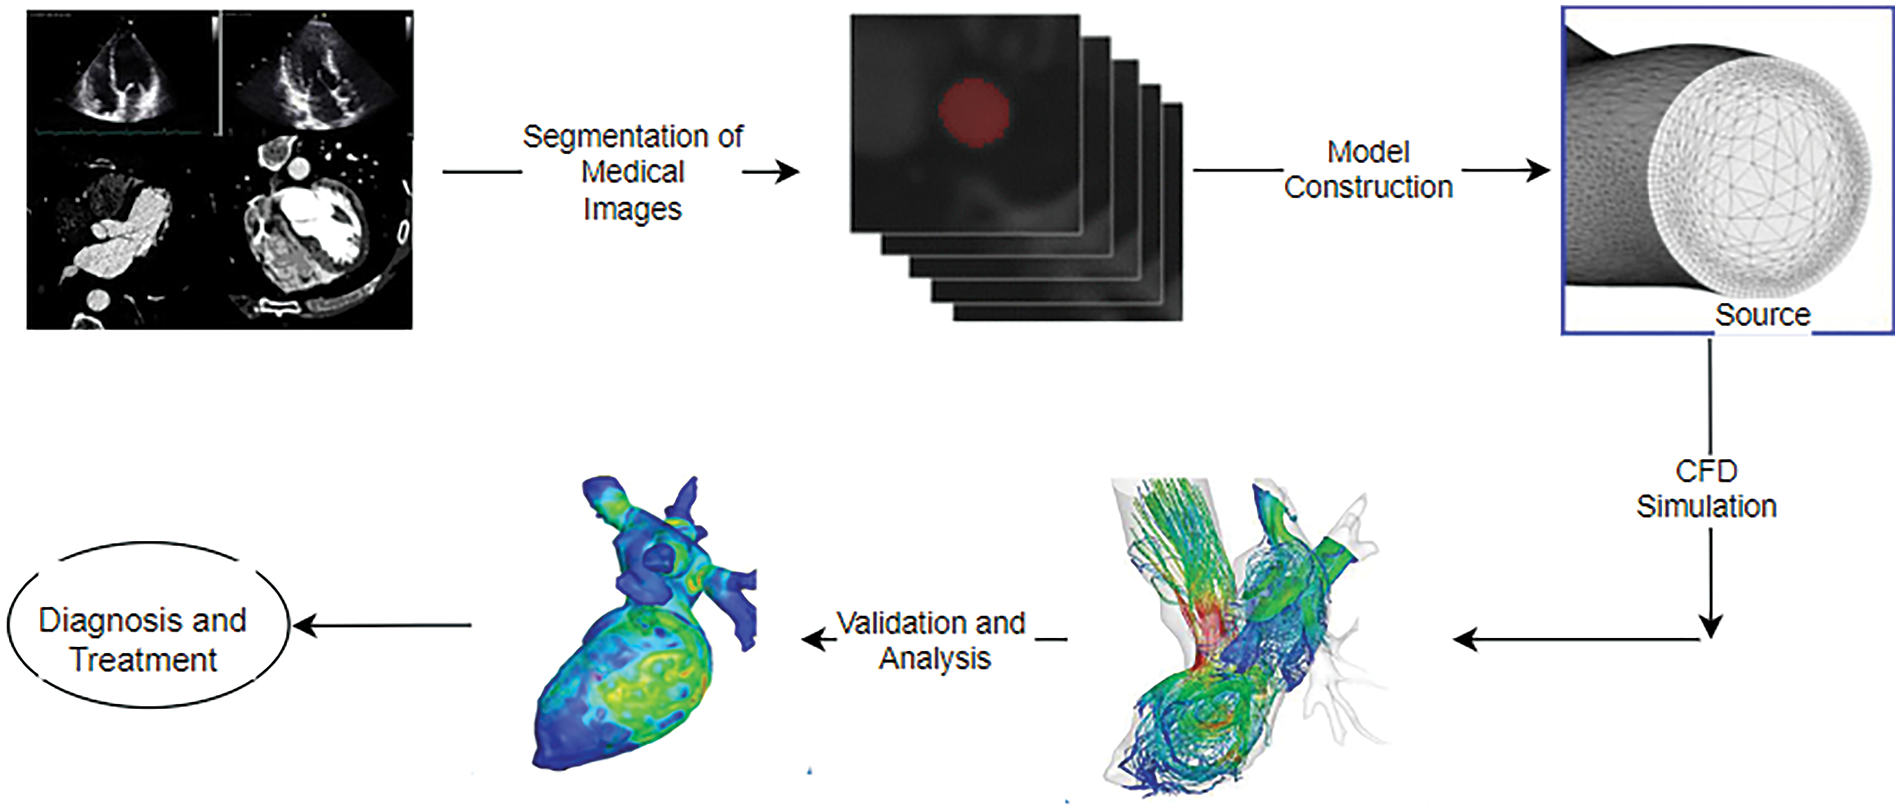
Figure 14: Steps for patient-specific simulation of blood in the heart
Hence, images covering a few cycles can be taken depending on the requirements and availability. CT images are stored in digital imaging and communication in medicine (DICOM) format. These can be segmented using various segmentation software such as “Mimics”, ITK-SNAP, Seg-3D, TurtleSeg (www.turtleseg.org) (accessed on 07 October 2024), 3D-Doctor, MITK, and GIMIAS. These methods involve generating 3-D models from images [81]. In segmentation, one needs to focus on a particular region of interest. However, one should be careful when matching the topology, connectivity, and mesh properties, which many software tools generally do not provide. From the medical images, effective segmentation is done by extracting the wall boundaries to reconstruct the geometry. After reconstruction of surfaces, these models are converted into solid models, which are stored in “STL (STereoLithography) format” [82]. STL format is a widespread file format that supports many modeling software. An efficient computational mesh is generated to fit into CFD solvers and software effectively. Hence, an effective segmentation capable of CFD simulation is quite cumbersome. Therefore, researchers have tried to find efficient image processing algorithms, such as anisotropic diffusion, active contour, and Neural convolutional network, for efficient segmentation and reconstruction [24]. Level set Methods also work efficiently in connecting and matching the mesh properties, discarding the complicated surface mesh generation [83].
Lattice Boltzmann Method (LBM) is another simple and efficient framework used in fluid dynamics and image processing where level set methods work well for segmentation [84]. Its inherent parallelism provides an efficient pathway for parallel programming in GPU and CUDA, among others [85–88]. The segmented results achieved can be used directly to give the much-needed boundary information required for hemodynamic simulation. Researchers have simulated the formation of a thrombus with an onion skin-like structure in the cavity of the cerebral aneurysm using LBM. It used the same lattice or network of image processing, which was then applied to the images in DICOM format for simulating the mechanics of thrombosis and then coupling it to hemodynamics [89].
A schematic diagram is shown in Fig. 15, clearly connecting how the LBM network can be utilized as a unified model to perform image processing operations, flow dynamics, and biological modeling. Table 6 summarizes various segmentation procedures that can be used for medical image segmentation. Mapping patient-specific hemodynamics models is the initial and crucial step toward CFD simulation. The surface of the images from any modalities can be mapped using many surface-matching algorithms.
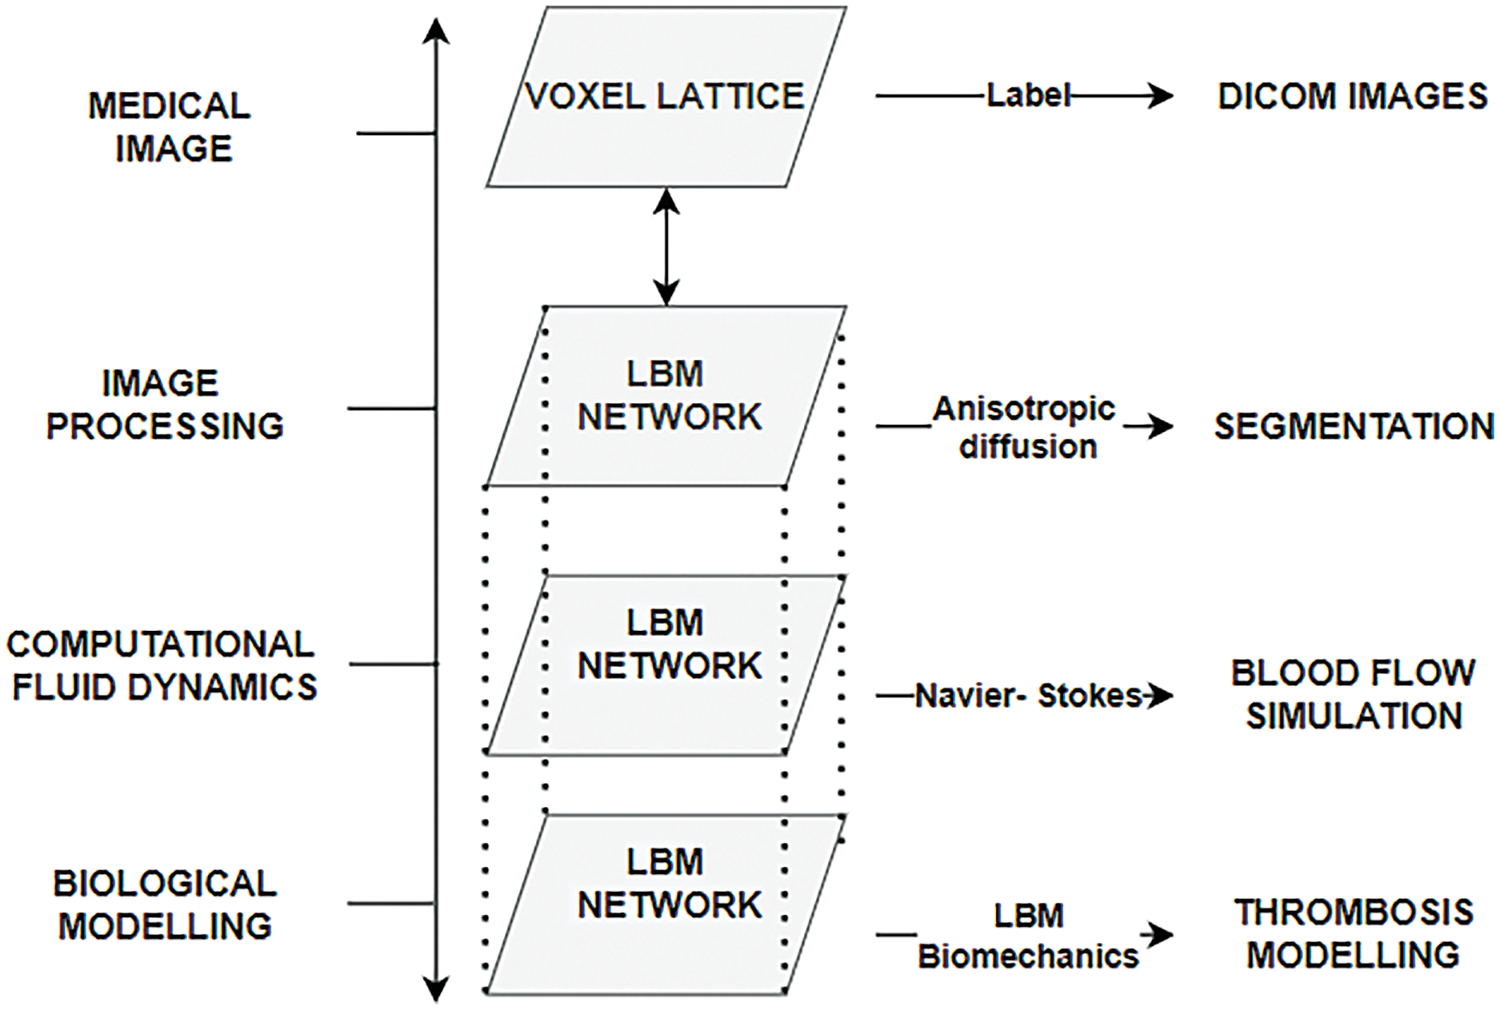
Figure 15: Schematic representation of different layers
Different algorithms suit different deformations. Algorithms such as Iterative Closest Point and Elastic Deformation can be used for smaller deformations. In contrast, for larger deformation, Large Deformation Diffeomorphic Metric Mapping (LDDMM) can be implemented [83,90,91].
Therefore, level-set methods can be instrumental in image segmentation, specifically when concentrating on a particular section of the heart, such as the arteries, where very complex geometries are not considered [97].
Being a boundary-tracking technique, it is quite beneficial in handling topological changes. The marching cube algorithm is another classical method that effectively generates the surface mesh and highlights the area of interest. A detailed segmentation procedure where the level set method is quite beneficial to map onto a CFD mesh for simulation of the pulsatile flow in arteries is shown in Fig. 16.
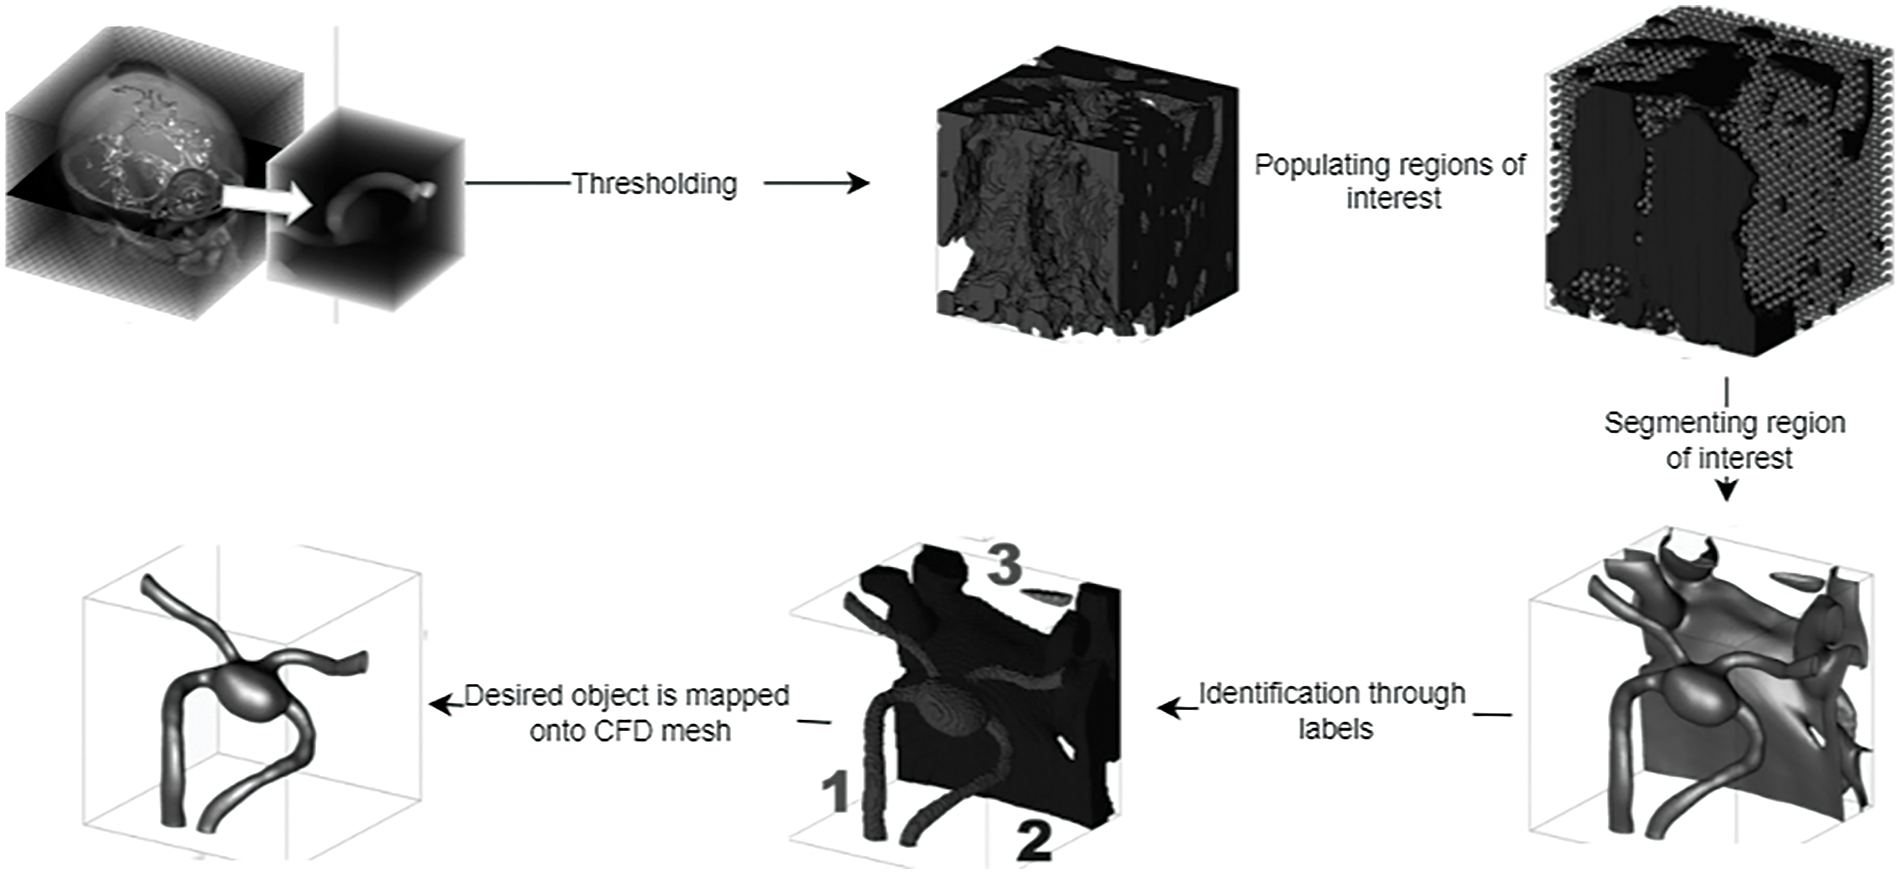
Figure 16: Segmentation procedure for CFD mapping [97]
4.4 CFD Simulation of the Pulsatile Flow in Arteries
After the segmentation and reconstruction of artery images, an efficient solution method should be incorporated to explore the pulsatile flow of the arteries. Navier-Stokes equation was utilized to describe the flow properties of incompressible flow. The artificial compressibility method (ACM) is another method for computing steady-state incompressible flows that give time-accurate computations. In ACM, the Navier-Stokes Equation is modified by adding a fictitious time derivative of pressure to the continuity equation. Once the steady state is reached, the original equations are recovered. Hence, the governing equations are solved at each time level. The dual time-stepping method is also implemented for better time accuracy [98]. Various finite-volume methods are utilized to discretize these equations [99]. Researchers have employed the HLLC-AC Riemann Solver to calculate convective fluxes at the cell interface [100]. The HLLC method is a highly accurate method widely used for compressible gas equations. This method can be utilized in incompressible flows using artificial compressibility. Thus, this technique can achieve better time-accurate solutions. Fig. 17 depicts various methods of solving incompressible flows in CFD.
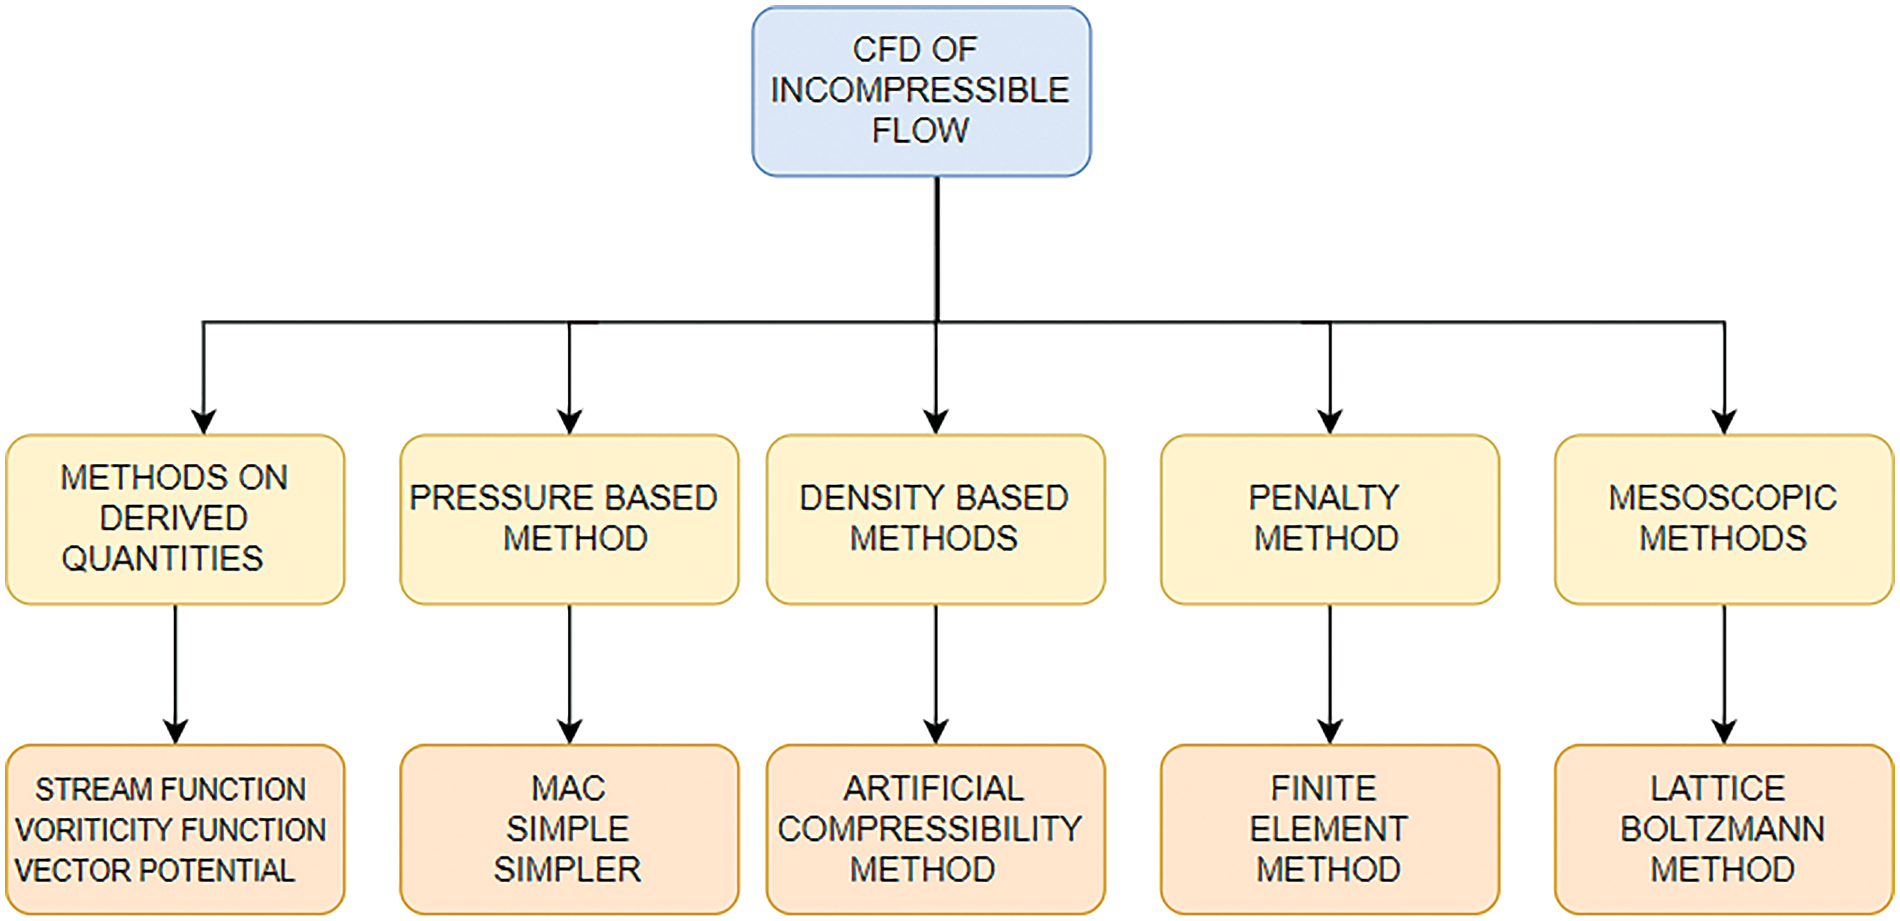
Figure 17: Various solution methods for incompressible flows
Arteries are complex structures that show elastic deformations. Hence, the constitutive relationship is essential to understanding the response of the walls to the mechanical forces. Various constitutive models are useful in studying the material properties of arterial walls. It explains how shear stresses and strain (wall deformation) are related. The material of the walls also changes with time and temperature. Hyper-elastic models such as the Ogden model study the tissues’ behavior by studying the stress-strain relationship under various flow conditions. As the walls are made of various fibers and collagens, the mechanical behavior along the arteries is also not uniform. Various non-linear orthotropic models help to study the wall’s behavior in different directions [101]. Similarly, time-dependent models such as the Standard Linear Solid Model beautifully explain how the walls of the arteries respond over the pulsating period. Coupled simulations are widely considered when exploring the walls’ hyperelastic properties and blood flow dynamics. Various methods cater to such moving boundaries and their coupled effect on the blood flow dynamics. The immersed boundary method (IBM) is a finite element method for determining the incompressible Navier-Stokes Equations for such realistic issues [102]. The boundary conditions are satisfied efficiently using pressure and velocity correction techniques and give accurate results for internal flows [103]. This method ensures the local refinement of the mesh so that the creation of new mesh at each step is avoided. This is an efficient method for handling moving boundaries [104]. Smoothed Particle Hydrodynamics (SPH) is another method to investigate surface deformations and fluid wall interactions. This method is simple as it does not require a grid and efficiently tracks larger deformation and fluid-structure interactions [105]. The fluid is regarded as discrete particles, and the greater the particles, the greater the efficiency. However, the greatest drawback of this method is that it requires high computational costs to achieve such an accuracy. Another method to handle fluid-structure interaction and moving boundaries is the arbitrary lagrangian-eulerian (ALE) formulation for simulating blood flow in vessels. The mesh will proceed with the deformation. It is based on both Lagrangian and Eulerian approaches [52]. As discussed earlier, the Lattice Boltzmann Method (LBM) is another explicit scheme that studies the fluid flow using a mesoscopic approach that uses a discrete collection of particles using a probability distribution function (PDF). Using a statistical method, this PDF dictates the particle’s behavior [106]. Table 7 briefly explains the basic CFD simulation and hemodynamics in arteries, considering various solution approaches and their outputs.
As discussed before, simulations of real-life CFD problems involve a lot of mathematical calculations and, hence, are often time-consuming. Therefore, high-performance computing helps to solve these numerical models faster [116]. Using GPUs helps speed up the calculations, increasing the performance. GPU can be used in image segmentation and CFD simulations [117].
GPU has massive processing cores that divide the computational work among the cores, efficiently solving high floating-point calculations in no time.
NVIDIA graphics processing units can be utilized to speed up the computation. However, one must be careful when implementing GPUs. Efficient simulation speed-up is possible only when the data is parallelizable. Hence, the code must be optimized so that it is not serial or interdependent. Discretizing the governing equations to a set of algebraic solutions and finding the solution is pretty time-consuming. Hence, special GPU-based solvers have been designed for this purpose. Parallel programs, such as Open MP and MPI (Message Passing Interface), are various programming interfaces that help faster computation. CUDA is a similar programming platform that supports GPU and supports the programming frameworks such as OpenMP. Lattice Boltzmann’s method is quite efficient for parallel programming as it can be coded for parallel machines directly [118–120]. Fig. 18 shows a simulation using the Lattice Boltzmann Method using CPU and GPU with different mesh elements. With smaller mesh elements (less than 30,000 mesh elements), GPU is not that efficient, but with substantial mesh sizes, GPU saves a considerable amount of time. As the mess size increases to 40 lakhs, CPU time increases to 250 s, whereas it takes hardly 15 s when implemented in GPU. The present work noted that GPU implementation was about 16 times faster than CPU implementation [121]. Table 8 lists the work where parallel programming is utilized to study complex flow simulations of the heart, either for flow simulation or patient-specific segmentation. Parallel programming in cardiac simulation helps acquire faster convergence, making it more realistic.
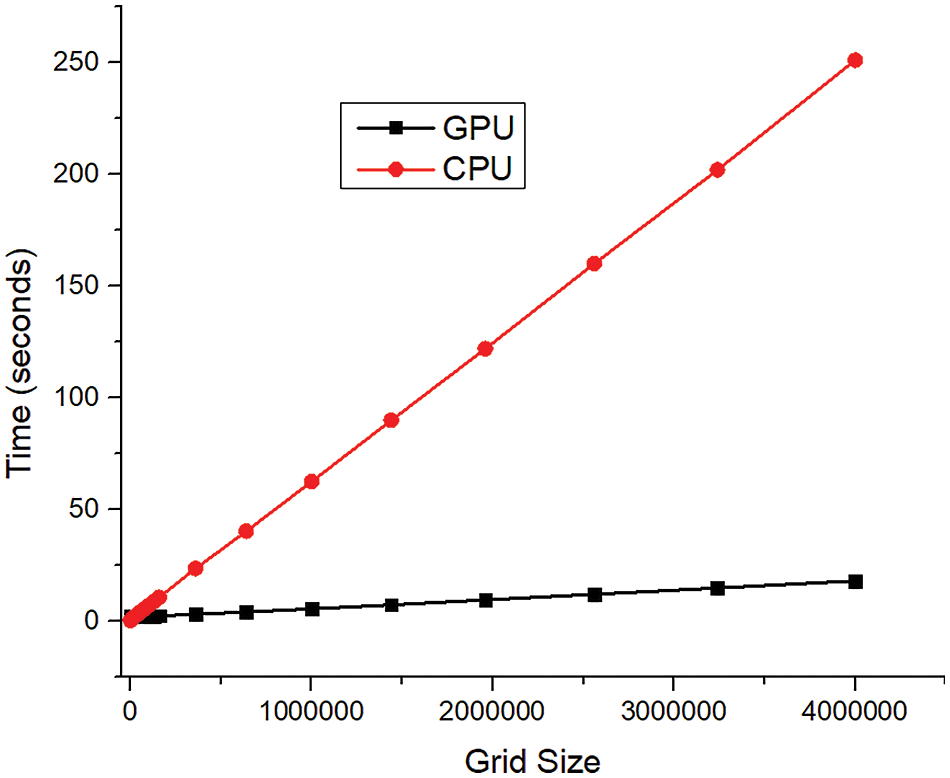
Figure 18: GPU and CPU comparison for computation time
This section deals with the various results of CFD simulations that help to understand the hemodynamic parameters. Whether experimental or numerical, the replication of blood flow in arteries considers input parameters such as pulsatile flow, non-Newtonian nature of blood, shape, and size of the stenosis, and others. The output results, such as pressure drop, wall shear stress, flow reversal, vortex formation, and others, play an essential role in detecting various diseases.
Excessive WSS is an indication of endothelial dysfunction. Vortex formation also leads to high shear stress, indicating plaque formation or aneurysms. Blood flow in arteries is laminar. Flow reversal would indicate that there is some abnormality in the arteries. This section thus highlights how abnormalities in the arteries can be detected through various output parameters. Fig. 19 depicts the general input parameters and the outputs considered for predicting cardiovascular diseases with the help of CFD. Cardiovascular hemodynamics is a vast field to investigate. It is challenging to analyze the blood flow of the whole heart. Hence, researchers have concentrated their research on vascular hemodynamics. The arteries’ blood flow can prove a determining factor for many cardiovascular diseases. Prominent researchers thus have considered parameters such as sinusoidal mass flow rate as an input to study pulsating laminar fully developed flows [126].
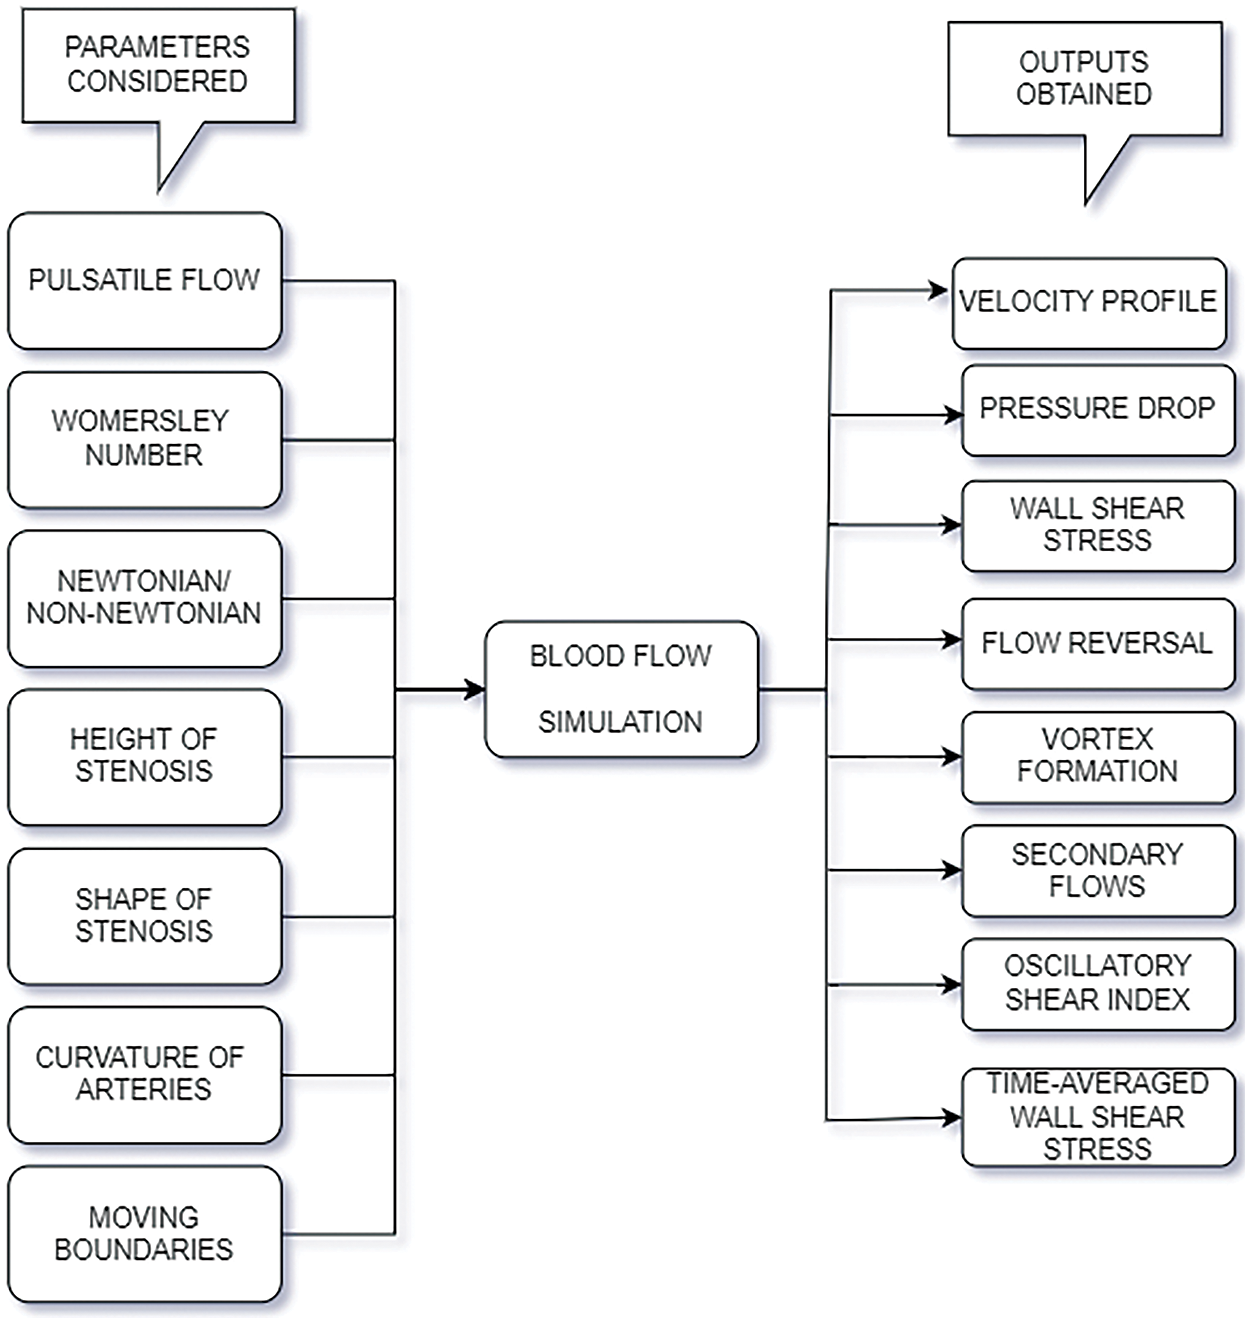
Figure 19: Commonly used input and outputs for flow simulation of blood in arteries
Analytical and experimental results were validated through these studies. Different normalized parameters for amplitude and frequency were taken for the analytical investigation to match the experimental results. These results provide an understanding of the flow patterns, flow reversals, and secondary flows, if any [127]. The axial velocity profiles change at different time steps in a cycle in a stenosed artery at different positions from the stenosis. A clear understanding of plaque formation and its effects on blood flow patterns can be analyzed from such numerical simulation. Initially, flow simulations were considered to be Newtonian. Later, various non-Newtonian models were proposed, as the non-Newtonian behavior of blood cannot be ignored in arteries of smaller dimensions. The Power Law, the Casson, the Carreau, and the Generalised Power Law model are a few utilized to study the non-Newtonian nature of blood [128]. These results were validated for different arterial diameters with the theories of pulsating flow proposed by Womersley [129]. Thus, analysis of the flow patterns in the blood vessels can help determine the cause of diseases.
Wall shear stress is an important indicator to be considered when studying the flow in arteries. It serves as an essential parameter for studying the start and growth of plaque. Wall Shear stress also depends on the diameter of the arteries. The fluid’s viscous force exerts tangential stress on the walls of the arteries. Three essential parameters, namely oscillatory shear index (OSI), time-averaged wall shear stress (TAWSS), and relative residence time (RRT), are highly beneficial in indicating common diseases such as Atherosclerosis. OSI changes the direction of wall shear stress in a cardiac cycle, TAWSS indicates the total shear stress exerted on the walls in a cardiac cycle, and RRT indicates disturbed flow regions. In order to find out the wall shear stress over the whole cycle, it is time-averaged and hence known as time-averaged wall shear stress (TAWSS). Wall shear stress is directly proportional to blood viscosity and velocity. Wall shear stress gradient (WSSG) determines the changes in the flow direction in space [130]. This is calculated as the rate of change of wall shear stress for space. It is measured in Pa/mm. The OSI is a non-dimensional parameter whose values range from 0 to 0.5. The value of 0 refers to a steady flow, whereas 0.5 specifies extreme oscillations. This dimensionless parameter is a measure to indicate tangential oscillation, which is high near the plaque region. RRT explains how blood flow gets distributed in the abnormality region (aneurysm). RRT incorporates both TAWSS and OSI [131]. Circulation of blood for a larger amount of time near the diseased areas of the artery can also cause rupture, leading to blockage. A value of less than 0.4 Pa of TAWSS can lead to plaque formation, whereas an unusual increase in the TAWSS can lead to a clot in the arteries. All these parameters also depend upon the arteries’ geometry and branching.
Research shows that lower values of TAWSS and higher values of OSI can lead to the thickening of the arteries. RRT values are also high in such regions. With the decrease of TAWSS, OSI also increases in such regions [132]. The relation between OSI and TAWSS thus portrays an inverse relationship. These parameters are beneficial in the pre-analysis of diseases. It can signal the beginning and development of plaque in specific regions of arteries. A new parameter that combines time-averaged shear stress and the oscillatory shear index named “HOLMES” was introduced, which combines the mean value of wall shear stress with the oscillatory characteristics. This low-magnitude shear stress indicator enhanced the predictions of diseases more accurately [133]. The following offers the calculation for the above-discussed indicators:
where T is the total period of the cardiac cycle, and τw is the shear stress at any instant. x, y, and z are the three spatial directions. Plaque formation is quite dominant in the regions with low TAWSS and high RRT. Hence, input parameters considerations to study the flow properties in diseased arteries include factors such as pulsating inlet, Womersley number, Newtonian or Non-Newtonian, the height of stenosis, the shape of stenosis, the curvature of stenosis, moving boundaries of the blood vessels, and others.
A few output parameters that decide the prediction of heart-related diseases are pressure drop, velocity profile, shear stress on the walls of the vessels, vortex formation, and others. Literature shows that wall shear stress increases with the height of stenosis, flow amplitude, and Womersley number. Stenosis morphology also affects the hemodynamic parameters. Various morphologies in stenosis, such as bell-shaped stenosis, trapezoidal stenosis, and others. Results have shown that the axial stretch of the stenosis also impacts the shear stress. It brings about turbulence and disturbed flows. In atherosclerosis, plaque changes its morphology; hence, this study is valuable in identifying the risk factors.
6 Challenges and Opportunities for the Study of Blood Flow in Arteries
After a thorough evaluation of the study of the pulsatile flow in arteries, a brief description of the few challenges encountered in the different stages of its research and its possible opportunities has been mentioned in this section. Table 9 lists the challenges and opportunities that come across during the study. From data acquisition to clinical decisions, various challenges were encountered. Cardiac MR was collected from different sources. These data can be fragmented or noisy. To process such data, data integration software such as Mimics, 3DSlicer, and ITKSnap can be utilized to preprocess the images compatible with CFD simulations.
Once the image is cleaned and segmented, mesh generation is the next crucial part of CFD simulation. Course mesh or inconsistent mesh can bring about inaccurate results. A refined mesh will bring accuracy but increase computational time. The use of parallel programming can be a solution to decrease the computational time. Adaptive mesh generation and meshless methods are some of the recent techniques that can help change mesh refinements wherever required. For example, COMSOL software has the provision for automatic mesh generation. CFD software studies the behavior of the fluids by setting the initial and boundary conditions. They have pre-built models that cater to a wide range of simulations, but solvers cannot provide accurate solutions for patient-specific simulations. Hence, CFD solvers can be used as they are quite flexible and can be designed to solve the problem individually. FSI models in CFD study the interaction of blood and artery walls, giving realistic results but are computationally expensive. Reduced order models and coupled momentum equations can simplify complex systems and enhance efficiency.
Technology has been the key to modernization. CFD has successfully studied cardiovascular flows efficiently using the latest technologies, such as image processing and parallel programming. Recently, CFD has incorporated AI into its world too.
7.1 Artificial Intelligence in CFD
Various predictive models of AI have been implemented in the study of cardiovascular diseases. AI-accelerated CFD simulations work more time effectively than the traditional workflow. Fig. 20 shows the difference in simulation procedure between the conventional CFD simulation and the AI-accelerated CFD solution. Various neural networks are trained on vast sets of CFD-simulated data. Thus, the trained neural networks can predict the outcomes for the new cases instead of running computationally expensive CFD simulations. It reduces the number of iterations and the simulation time from hours to minutes. A detailed flowchart in Fig. 21 shows how CFD data can give real-time results in minutes when fed into a machine learning algorithm. The neural networks are trained on the vast CFD simulations data where the inputs such as waveform, initial conditions, boundary conditions, and various geometries are mapped to the outputs such as WSS, pressure drop, velocity profiles, and others. The results from these AI models are validated with real-time results. These trained AI models can predict abnormalities whenever a new case comes without undergoing actual CFD simulations. Not only that, these neural networks can identify deviations from the normal results and suggest the areas that need special attention. Thus, training the AI models with the CFD simulated data helps to give faster results than the actual CFD simulations. For example, a neural network trained on blood flow in coronary arteries can predict flow patterns such as recirculations, vortex formation, and wall shear stress and suggest desired solutions.
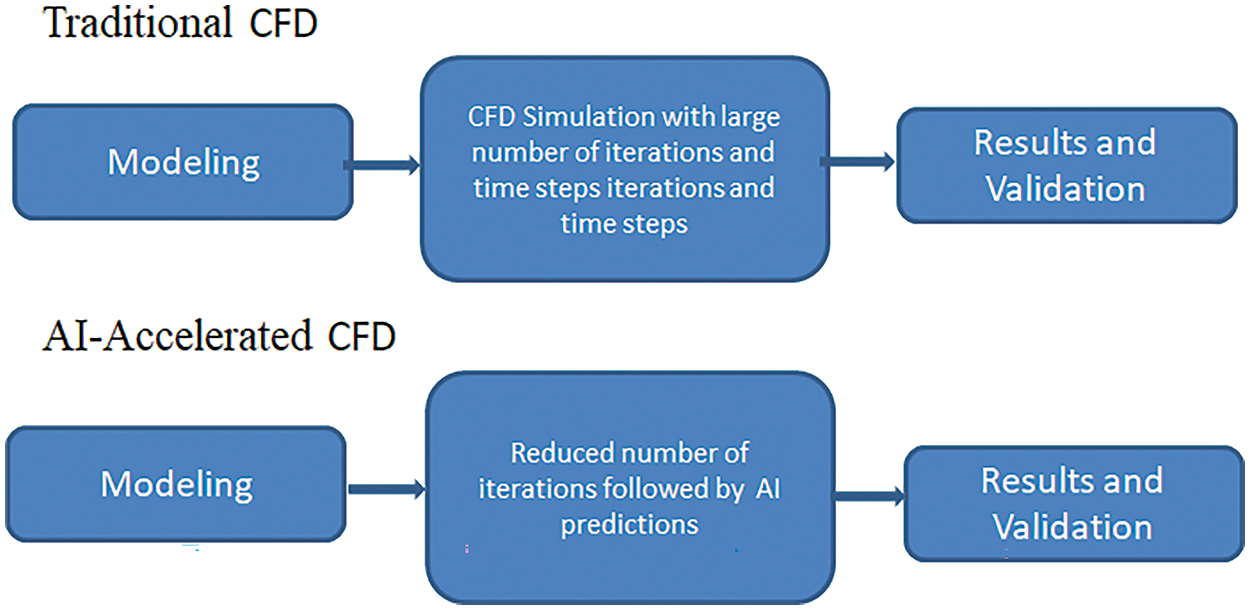
Figure 20: Difference in conventional CFD and AI-Accelerated CFD
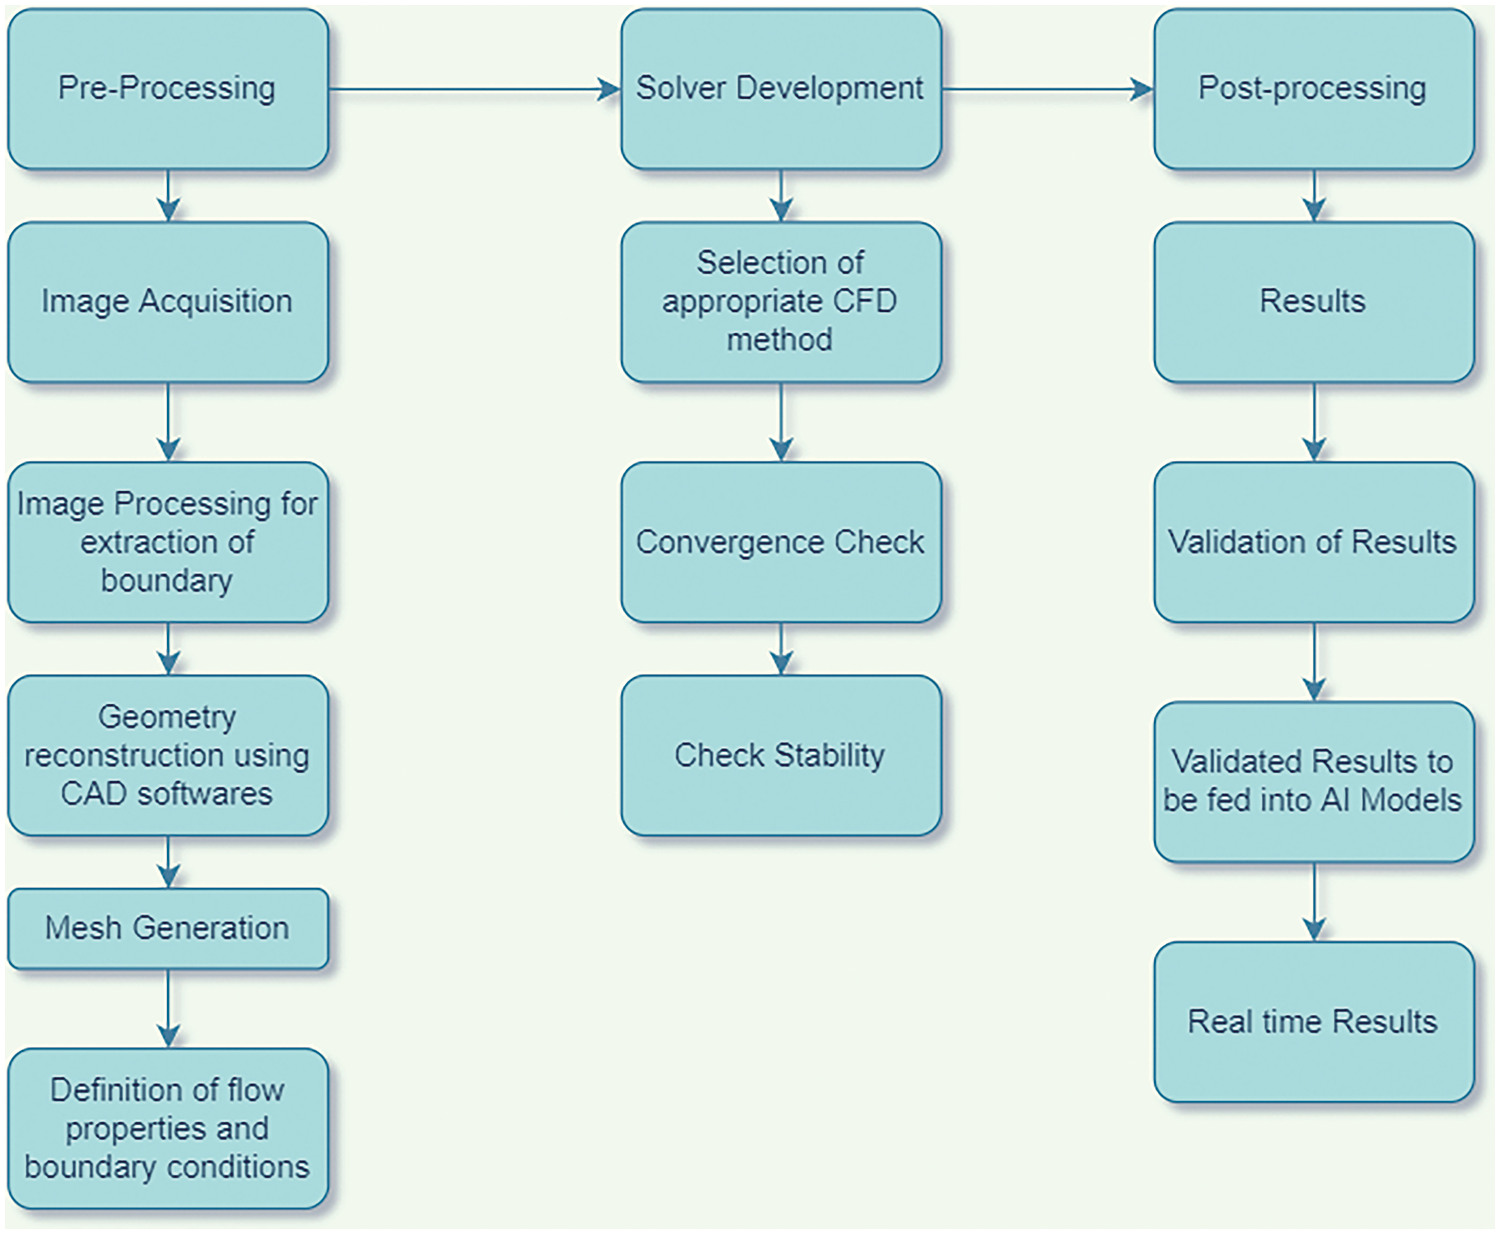
Figure 21: Steps to simulate patient-specific modeling with AI validation
CFD simulation starts by acquiring MRI images, calculating the flow properties, and predicting the outputs. For this purpose, hospitals provide scans of patients to researchers for such simulations. The images available from hospitals cannot always meet the requirements. Such noisy data must be interpreted correctly. Various neural network models, such as the “Physics-informed Neural Networks (PiNN)” model, can accurately denoise such medical images. Trained PiNN models also led to successful automatic segmentation of the arterial geometry [135].
In this method, parameters are introduced in the partial differential equations with the help of neural networks, which are trained to explore the system efficiently. Apart from PiNN models, Support Vector Machines (SVM) and Random Forests (RF) algorithms identify the noisy signals of medical images. SVM is also proficient in finding artifact data. Such algorithms benefit studies related to myocardial blood flow. Multi-GPUs have also been implemented to reduce training time.
These segmented images are then meshed into grids. This gridded geometry is ready for CFD simulation. The CFD solver solves the Navier-Stokes equation for thousands of time steps for all the grids. Therefore, solving such non-linear partial differential equations millions of times is time-consuming. Hence, deep learning algorithms such as FCN, CNN, and geometric deep learning help reduce computational time. These networks study the results from complete simulations using various activation functions of various pre-available CFD simulations of patients [136]. Activation functions introduce non-linearity and enable complex mapping between inputs and outputs. ReLU can be used for hidden layers, and functions such as sigmoid can be used for outer layers of neural networks to investigate the abnormal flow patterns of blood. Error statistics play a crucial role in validating the performance of such models and algorithms. Error statistics are chosen depending on the problem’s scenario and the analysis output. Absolute errors are useful for regression problems where error magnitude is crucial. Loss functions such as Mean Absolute Error (MAE) and Root Mean Square Error (RMSE) can be utilized to determine the accuracy and measure the difference between the predicted and actual values. For instance, RMSE can be studied to minimize the deviations between true and predicted flow patterns. These convolutional neural networks (CNN) were first utilized to study the flow around objects with simple geometry [137]. Li et al. [138] tried to compare the CFD simulations with Fluid-Structure Interactions (FSI) simulations to study the blood flow in a stenosed artery. The peak velocity and wall shear stress had similar results, but their computational costs and time were quite high. An artificial neural network (ANN) was designed to decrease the computational time. ANN helped predict faster prediction by learning through the results of CFD and FSI simulations. A ten-fold cross-validation method was employed to enhance its prediction and make the model robust. The data set is divided into ten subsets. Nine are used for training, and the tenth is employed for validation. The selection of such hyperparameters is based on practice and understanding. Hyperparameters such as determining the depth of the neural network and selecting the kernel are essential to increase the performance. Performance metrics are now required to check the model’s quality. Error statistics are one of the performance metrics utilized to check the authenticity of the model. The Mean Squared Error (MSE) was utilized to assess the effectiveness and variance of the model. The R2 value for peak WSS and velocity is around 0.9991, which shows that the ANN model successfully determines the blood flow in stenosed arteries and indicates probable diseases. The computation time for such algorithms is negligible. Hence, training of datasets derived from conventional CFD simulations can develop a time-saving model that can help physicians respond quickly by decreasing repeated calculations [139]. Deep learning techniques can also be employed to study the blood flow in arteries and the pressure and velocity distribution from the MRI images. Internal forces, material properties of the walls, and flexibility also affect the flow, pressure, and velocity variations. The use of autoencoders can be an important tool for investigating the variation in wall properties and warning of any abnormality. Cases such as plaque deposition or aneurysms can be diagnosed in an early stage by extracting features related to wall stiffness. Such deep-learning study solves the inverse problems in biomechanics and suggests personalized medicines or solutions for an individual [140]. The data augmentation technique is another time-efficient technique [141]. Multiple duplicate samples from the original CFD results are created in this paper. This increases the number of datasets, enhancing the learning process. Abucide-Armas et al. [142] made 549 duplicate samples from 61 original CFD simulations, which took 4 h instead of 183 h for generating 61 actual CFD samples [142]. Vigorous training of DeepCFD results with these augmented data minimizes errors. In this paper, real CFD simulations are fed to DeepCFD to produce more similar cases in much less time, lessening the real simulation time. Table 10 details the simulation features under different experimental conditions. This experiment indicates that despite a maximum number of epochs, the CNN algorithm does not provide accurate results, whereas as the number of samples increases, the results get accurate. A multiplying constant of 0.01 is provided to maximize the results for velocity, which shows a considerable reduction of error in the x component of velocity. This method is adopted to adjust the scale and improve the model’s performance. For further enhancement of the models, norms are used for error regularization. The selection of norms depends on the problem and the output required. L1-norm efficiently handles outliers and sparsity, whereas L2-norm focuses on smooth and larger deviation. Experimental results indicate better convergence when the L1-norm is introduced for pressure and the L2-norm for velocity. The error reduces as the number of samples increases. The use of a multiplier reduces error for x-velocity. The mean and variance error also significantly decreased after using the L1-norm.

Hence, AI-based CNN architecture can quickly train such time-consuming simulations. Table 10 shows the results for the simulation parameters and how data augmentation gives better results, reducing the mean and variance of error.
7.2 Role of Responsive AI in Cardiovascular Diseases
Apart from deep learning algorithms, various medical devices based on Deep Learning (DL) are implemented by various researchers. Such DL-based medical devices are much more prevalent in Japan’s clinical implementation [143]. For example, DEEPVESSEL-FFR is a platform that uses deep learning techniques to predict diseases in stenosed arteries using non-invasive methods. The report is generated in PDF format and sent to physicians for further analysis.
Thus, due to the advancement of technology, the diagnosis of diseases is not entirely physician-dependent. The use of various trained algorithms also helps in the prediction of diseases. However, these predictions are not sufficient from the patient’s perspective. AI algorithms are often called “black box” decisions, where they reach a final decision based on the available pre-data sets. It fails to explain why AI has reached a particular conclusion. The role of explainability in AI, also termed explainable AI (XAI), has become a significant requirement predominantly in healthcare. An explanation is inevitable when implementing the prediction in healthcare. For instance, “CART” is a predictive model where the algorithms are trained based on the training and testing datasets to conclude with an explanation. When given to a biomedical expert, such explainable reports can come up with the underlying cause and solution. This explanation also brings about trust and transparency in a patient’s decision in the report.
Interpretability is another vital aspect that should be considered in XAI. Information dispersion from input to output is another challenge. AI models must be interpretable by design and adhere to different types of inputs. For this purpose, transparent models such as post-hoc XAI take a trained model as input, study the model, and create a surrogate model [144]. This method takes a trained complex model, and the dataset is worked on, which requires an explanation. The surrogate model that was created uses simpler models such as linear regression, decision trees, and others. This model is now trained on the results of the complex models. Thus, the surrogate model explains the original model. The simplicity of the surrogate model makes it easy for us to interpret. The explainability can be value-based, visual explanation, explanation by example, and others. Examples of such popularly used XAI models are LIME and SHAP. SHAP has been observed to provide “human-interpretable” insights into fluid dynamics, such as the relaminarization of parallel shear flows [145]. In this paper, SHAP tries to discover the features that contribute to maximum relaminatization. They try to interpret and explain the results obtained from the machine learning models. Such XAI models can be extended to perceive biomedical flows as well. Fig. 22 shows an overview of an XAI model.
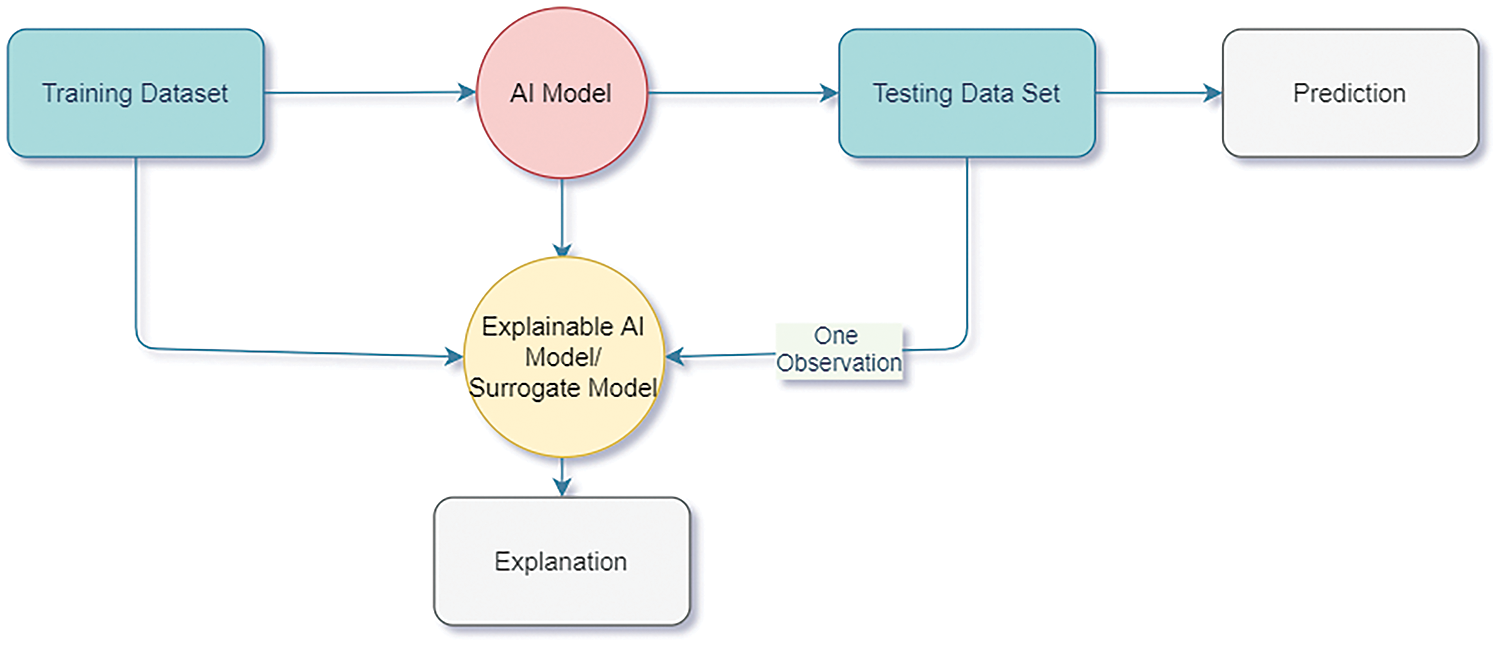
Figure 22: Explainable AI model overview
Domain knowledge is also vital for explainable AI to give reliable outcomes. Lack of domain knowledge is one of the greatest hindrances to explainable AI. For example, using CFD knowledge to understand the flow properties and biomedical knowledge for disease prediction is essential for a scientific outcome consistent with scientific principles. One example is “FLUIDDA,” a service-based company optimized for engineering and AI. This uses CT scans, CFD, and AI, making clinical trials cost-and time-effective [146]. The company has a multidisciplinary team working on the improvement of respiratory diseases. A domain expert thus brings about the crucial parts that help the AI system perform efficiently and accurately. The healthcare domain is crucial as it deals with the well-being of people. Preserving privacy in accessing medical data is quite challenging due to ethical constraints. Ethical practices also include data processing restrictions. Diverse data sets must be available to the researchers to avoid skewed results. Although medical data and its related metadata are plentiful, they are challenging to find available for research purposes. Hospitals cannot release patients’ health information due to ethical concerns.
These prevent such models from being included in clinical practice. Therefore, various privacy-preventing techniques have been introduced, such as “Homographic Encryption,” where the encrypted data is used as input. Puiu et al. [147] utilized Matrix Operation for Randomization or Encryption (MORE), an encryption scheme with a classical neural network applied to encrypted data. The training model works on the encrypted data with the help of floating-point computation. The outputs in this paper can be obtained by having a secret key and protecting privacy [147]. Hence, various privacy-preserving techniques help get massive datasets, making it feasible for clinical intervention.
Explainable AI in healthcare requires fair results. Machine Learning models should result in a fair and ethical analysis. Predictions should be free from sensitive features to include fairness. Artificial Intelligence is also known as a black box model because its decision can sometimes create unfair decisions based on factors such as age, race, gender, and others. Hence, algorithms should match the sensitive and non-sensitive variables to bring a bias-free conclusion. Various regulatory acts, such as the General Data Protection Regulation (GDPR), are designed for data protection and privacy. Explainable AI systems must adhere to and comply with such regulations.
Accordingly, a new word can be coined by overcoming the problems of explainability, interpretability, protecting privacy, and others, such as “Responsive AI” [148]. Considering the above factors, the AI model thus becomes ready for practical implementation [149]. Fig. 23 shows the transformation from explainable AI to Responsible AI. It will serve the organization with solutions that explain fairness. Responsible AI is, therefore, a practical implementation of explainable AI that considers fairness, privacy, security, and transparency with some measures of uncertainty to bring trust in the model in large-scale organizations. Responsible AI thus intends to develop AI models that would learn from the explainable models and adapt to the situation. It can build a business and positively influence society. XAI makes the system transparent by providing explanations that the ordinary person can understand, whereas responsive AI provides real-time responses in practical situations.
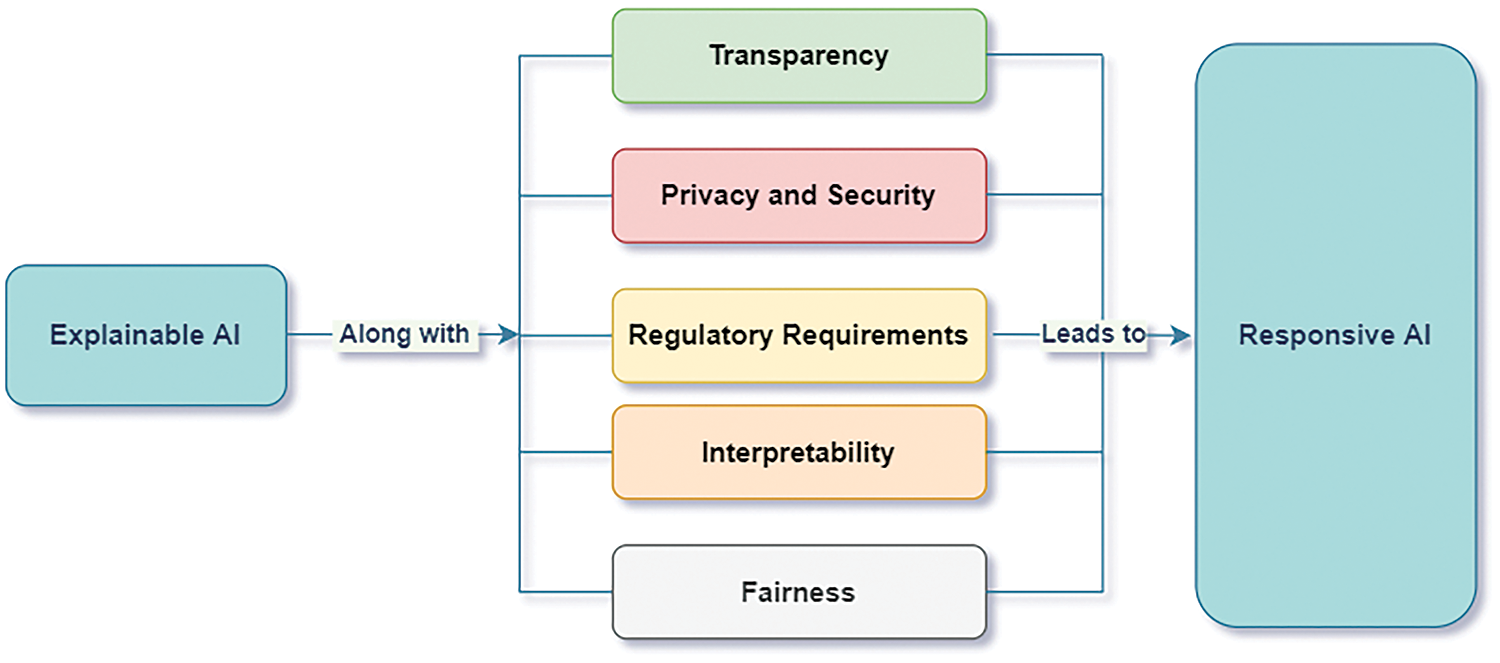
Figure 23: Factors considered for responsive AI
Accordingly, one can use responsive AI as a real-time monitoring system by using explainable AI. For example, hand bands can be worn on the wrists to track abnormalities and send alerts for medical intervention. Further, for chronic and old-aged patients, systems such as VitalConnect ensure that their health is monitored at home. Like other engineering research [150], responsive AI is a revolutionary step that caters to the cardiovascular healthcare system economically and conveniently.
This paper focuses on society’s most common health issue, which researchers have concentrated on for many decades. From simulating pulsating flow in pipes to studying the flow in patient-specific geometry, continuous changes are observed in the methodology. Hence, numerical simulation focuses more on the stenosis arteries where the flow patterns are investigated. From the detailed review, the following can be drawn:
• CFD simulations deal with recognizing complexities in the flow dynamics by providing information such as velocity profiles, pressure drop, wall shear stress, recirculation, and vorticity, which can predict the initiation of coronary artery diseases. It will help in taking necessary preventive action and timely treatment.
• Accuracy is improved with models using Fluid-Structure Interactions (FSI). FSI helps to capture moving boundaries quite efficiently.
• Parallel computing has also been introduced for faster simulations. Patient-specific geometries and their segmentation in the CFD domain seem challenging, but they provide a more realistic approach to the problem.
• Recent advances in AI and deep learning modules help predict diseases based on the various data sets available from the CFD simulations. The flow patterns occurring during stenosis, plaque, thrombosis, aneurysm, and others can be studied, and different AI apps can be developed to give detailed information and warn them about the start of diseases at the initial stage.
• Responsive AI helps develop AI models to build a business and positively influence society. For example, medical AI-based podcasts are excellent methods for learning about health issues and their preliminary care. Such podcasts are trained well by various simulation data of CFD. This will help the clinicians predict and diagnose stenosis and other related heart issues time-efficiently.
The study shows that Artificial Intelligence is one of the most emerging uses in healthcare. Responsive AI can be useful in cardiovascular disease detection by analyzing the CFD simulations under various conditions. Such integrated systems can give signals or suggest possible tests for various disease detections. However, specific challenges can come while inheriting both fields. AI models from such CFD simulations must be validated to ensure their reliability and accuracy. Clinical trials can help to validate such models. Clinicians can then give feedback as to how accurately the model predicts. It is advisable to have experts along with the model prediction at the initial stages to use it on a commercial scale. High computational requirements are needed for both CFD and AI. Hence, optimized and efficient models can be developed to overcome this challenge. AI models can also lead to erroneous results; hence, regular validation of such models with actual data is advisable to overcome such discrepancies. Scalability of this integration among various populations and finding a generalized solution is also difficult. These models should be trained on diverse patients of different ages, genders, comorbidities, and cardiac conditions. Integration of such domains also requires personal expertise in CFD, AI, and medicine. Such expertise is hard to find. Hence, multidisciplinary collaborations through research projects and partnerships can be beneficial. Thus, a robust platform can be built to help clinicians predict and prevent cardiovascular diseases by combining these domains of science. Various government bodies, such as the Food and Drug Administration (FDA), World Health Organization (WHO), and others, are trying to ensure that such diagnostic tools meet the required standards and positively help society. For example, Medtronic, a leader in medical technology, uses CFD simulations to detect diseases such as aneurysms at an early stage. Other upcoming companies, Seimens and Edwards Lifesciences, work on diagnosis and decision-making in the cardiovascular domain. These practical examples show how the symbiotic relationship between AI and CFD leads towards “Responsive AI” and how it can be an excellent boon to society and the commoner.
The main motive for integrating CFD with responsive AI is to bring out personalized solutions. Remote monitoring and wearable devices can be the most common utility of this integration that can be useful to society. It can act as a preventive measure, reducing the risks of cardiovascular deaths.
Acknowledgement: Not applicable.
Funding Statement: The authors received no specific funding for this study.
Author Contributions: Draft manuscript preparation: Priyambada Praharaj; study conception and design: Chandrakant R. Sonawane; data collection: Arunkumar Bongale; analysis and interpretation of results: Arunkumar Bongale. All authors reviewed the results and approved the final version of the manuscript.
Availability of Data and Materials: The data was available from the extensive literature survey using Scopus and Web of science. The datasets generated during this study are available from the corresponding author on reasonable request.
Ethics Approval: Not applicable.
Conflicts of Interest: The authors declare that they have no conflicts of interest to report regarding the present study.
References
1. Dake PG, Mukherjee J, Sahu KC, Pandit AB. Computational fluid dynamics in cardiovascular engineering: a comprehensive review. Trans Indian Natl Acad Eng. 2024;9(2):335–62. doi:10.1007/s41403-024-00478-3. [Google Scholar] [CrossRef]
2. Praharaj P, Sonawane C, Pandey A, Kumar V, Warke A, Panchal H, et al. Numerical analysis of hemodynamic parameters in stenosed arteries under pulsatile flow conditions. Med Nov Technol Dev. 2023;20(7):100265. doi:10.1016/j.medntd.2023.100265. [Google Scholar] [CrossRef]
3. Sadrehaghighi I. CFD in biomedical engineering. ResearchGate. 2021. doi:10.13140/RG.2.2.14237.03042/1. [Google Scholar] [CrossRef]
4. Hohri Y, Itatani K, Yamazaki S, Yaku H. Computerized virtual surgery based on computational fluid dynamics simulation for planning coronary revascularization with aortic root replacement in adult congenital heart disease: a case report. Gen Thorac Cardiovasc Surg. 2021;69(4):722–6. doi:10.1007/s11748-020-01517-w [Google Scholar] [PubMed] [CrossRef]
5. Peirlinck M, Costabal FS, Yao J, Guccione JM, Tripathy S, Wang Y, et al. Precision medicine in human heart modeling: perspectives, challenges, and opportunities. Biomech Model Mechanobiol. 2021;20(3):803–31. doi:10.1007/s10237-021-01421-z [Google Scholar] [PubMed] [CrossRef]
6. Xiong G, Figueroa CA, Xiao N, Taylor CA. Simulation of blood flow in deformable vessels using subject-specific geometry and spatially varying wall properties. Int J Numer Method Biomed Eng. 2011;27(7):1000–16. doi:10.1002/cnm.1404 [Google Scholar] [PubMed] [CrossRef]
7. Bosetti F, Galis ZS, Bynoe MS, Charette M, Cipolla MJ, Del Zoppo GJ, et al. “Small blood vessels: big health problems?”: scientific recommendations of the National Institutes of Health Workshop. J Am Heart Assoc. 2016;5(11):1–12. doi:10.1161/JAHA.116.004389 [Google Scholar] [PubMed] [CrossRef]
8. Corral-Acero J, Margara F, Marciniak M, Rodero C, Loncaric F, Feng Y, et al. The “Digital Twin” to enable the vision of precision cardiology. Eur Heart J. 2020;41(48):4556–64B. doi:10.1093/eurheartj/ehaa159 [Google Scholar] [PubMed] [CrossRef]
9. Alehegn M, Joshi RR, Mulay P. Diabetes analysis and prediction using random forest, KNN, Naïve Bayes, and J48: an ensemble approach. Int J Sci Technol Res. 2019;8:1346–54. [Google Scholar]
10. Verdonck P. The role of computational fluid dynamics for artificial organ design. Artif Organs. 2002;26(7):569–70. doi:10.1046/j.1525-1594.2002.00920.x [Google Scholar] [PubMed] [CrossRef]
11. Shukla PK, Mishra R, Tewari RP. Analysis of rotary ventricular assist devices using CFD technique—a review. Proc Inst Mech Eng Part E: J Process Mech Eng. 2022;237(3):1036–63. doi:10.1177/09544089221128366. [Google Scholar] [CrossRef]
12. Kitajima H, Oshima M, Iwai T, Ohhara Y, Yajima Y, Mitsudo K, et al. Computational fluid dynamics study of intra-arterial chemotherapy for oral cancer. BioMed Eng OnLine. 2017;16(1):4. doi:10.1186/s12938-017-0348-5 [Google Scholar] [PubMed] [CrossRef]
13. Eshtehardi P, McDaniel MC, Suo J, Dhawan SS, Timmins LH, Binongo JNG, et al. Association of coronary wall shear stress with atherosclerotic plaque burden, composition, and distribution in patients with coronary artery disease. J Am Heart Assoc. 2012;1(4):9. doi:10.1161/JAHA.112.002543 [Google Scholar] [PubMed] [CrossRef]
14. Malek AM, Alper SL. Hemodynamic shear stress and its role in atherosclerosis. Stress Int J Biol Stress. 1999;282:2035–42. [Google Scholar]
15. Morbiducci U, Ponzini R, Grigioni M, Redaelli A. Helical flow as fluid dynamic signature for atherogenesis risk in aortocoronary bypass. A numeric study. J Biomech. 2007;40(3):519–34. doi:10.1016/j.jbiomech.2006.02.017 [Google Scholar] [PubMed] [CrossRef]
16. Candreva A, De Nisco G, Rizzini ML, D’Ascenzo F, De Ferrari GM, Gallo D, et al. Current and future applications of computational fluid dynamics in coronary artery disease. Rev Cardiovasc Med. 2022;23(11):377. doi:10.31083/j.rcm2311377 [Google Scholar] [PubMed] [CrossRef]
17. Kumar N, Ganesha A, Girish H, Kumar S, Shenoy BG. Advances in the application of computational fluid dynamics in cardiovascular flow. Cogent Eng. 2023;10(1):1–12. doi:10.1080/23311916.2023.2178367. [Google Scholar] [CrossRef]
18. Kamada H, Nakamura M, Ota H, Higuchi S, Takase K. Blood flow analysis with computational fluid dynamics and 4D-flow MRI for vascular diseases. J Cardiol. 2022;80(5):386–96. doi:10.1016/j.jjcc.2022.05.007 [Google Scholar] [PubMed] [CrossRef]
19. An S, Yu H, Wang Z, Kapadia B, Yao J. Unified mesoscopic modeling and GPU-accelerated computational method for image-based pore-scale porous media flows. Int J Heat Mass Transf. 2017;115(1):1192–202. doi:10.1016/j.ijheatmasstransfer.2017.08.099. [Google Scholar] [CrossRef]
20. Balakrishnan B, Tzafriri AR, Seifert P, Groothuis A, Rogers C, Edelman BR. Strut position, blood flow, and drug deposition: implications for single and overlapping drug-eluting stents. Circulation. 2005;111(22):2958–65. doi:10.1161/CIRCULATIONAHA.104.512475 [Google Scholar] [PubMed] [CrossRef]
21. Zhong L, Zhang JM, Su B, Tan RS, Allen JC, Kassab GS. Application of patient-specific computational fluid dynamics in coronary and intra-cardiac flow simulations: challenges and opportunities. Front Physiol. 2018;9:385. doi:10.3389/fphys.2018.00742 [Google Scholar] [PubMed] [CrossRef]
22. Yuyun MF, Sliwa K, Kengne AP, Mocumbi AO, Bukhman G. Cardiovascular diseases in sub-Saharan Africa compared to high-income countries: an epidemiological perspective. Glob Heart. 2020;15(1):15. doi:10.5334/GH.403 [Google Scholar] [PubMed] [CrossRef]
23. Fezzi S, Lunardi M, Sharif F. Implantable sensors for hemodynamic monitoring. Card Interv Today. 2022;16:58–63. [Google Scholar]
24. Kissas G, Yang Y, Hwuang E, Witschey WR, Detre JA, Perdikaris P. Machine learning in cardiovascular flows modeling: predicting arterial blood pressure from non-invasive 4D flow MRI data using physics-informed neural networks. Comput Methods Appl Mech Eng. 2020;358(1):112623. doi:10.1016/j.cma.2019.112623. [Google Scholar] [CrossRef]
25. Markl M, Frydrychowicz A, Kozerke S, Hope M, Wieben O. 4D flow MRI. J Magn Reson Imaging. 2012;36(5):1015–36. doi:10.1002/jmri.23632 [Google Scholar] [PubMed] [CrossRef]
26. Samady H, Eshtehardi P, McDaniel MC, Suo J, Dhawan SS, Maynard C, et al. Coronary artery wall shear stress is associated with progression and transformation of atherosclerotic plaque and arterial remodeling in patients with coronary artery disease. Circulation. 2011;124(7):779–88. doi:10.1161/CIRCULATIONAHA.111.021824 [Google Scholar] [PubMed] [CrossRef]
27. Meng H, Wang Z, Hoi Y, Gao L, Metaxa E, Swartz DD, et al. Complex hemodynamics at the apex of an arterial bifurcation induces vascular remodeling resembling cerebral aneurysm initiation. Stroke. 2007;38(6):1924–31. doi:10.1161/STROKEAHA.106.481234 [Google Scholar] [PubMed] [CrossRef]
28. Lee SW, Antiga L, Spence JD, Steinman DA. Geometry of the carotid bifurcation predicts its exposure to disturbed flow. Stroke. 2008;39(8):2341–7. doi:10.1161/STROKEAHA.107.510644 [Google Scholar] [PubMed] [CrossRef]
29. Humphrey JD, Taylor CA. Intracranial and abdominal aortic aneurysms: similarities, differences, and need for a new class of computational models. Annu Rev Biomed Eng. 2008;10:221–46. doi:10.1146/annurev.bioeng.10.061807.160439 [Google Scholar] [PubMed] [CrossRef]
30. Hoi Y, Meng H, Woodward SH, Bendok BR, Hanel RA, Guterman LR, et al. Effects of arterial geometry on aneurysm growth: three-dimensional computational fluid dynamics study. J Neurosurg. 2004;101(4):676–81. doi:10.3171/jns.2004.101.4.0676 [Google Scholar] [PubMed] [CrossRef]
31. De Leval MR, Dubini G, Migliavacca F, Jalali H, Camporini G, Redington A, et al. Use of computational fluid dynamics in the design of surgical procedures: application to the study of competitive flows in cavopulmonary connections. J Thorac Cardiovasc Surg. 1996;111(3):502–13. doi:10.1016/S0022-5223(96)70302-1 [Google Scholar] [PubMed] [CrossRef]
32. Perktold K, Hofer M, Rappitsch G, Loew M, Kuban BD, Friedman MH. Validated computation of physiologic flow in a realistic coronary artery branch. J Biomech. 1997;31(3):217–28. doi:10.1016/S0021-9290(97)00118-8 [Google Scholar] [PubMed] [CrossRef]
33. Updegrove A, Wilson NM, Merkow J, Lan H, Marsden AL, Shadden SC. SimVascular: an open source pipeline for cardiovascular simulation. Ann Biomed Eng. 2017;45(3):525–41. doi:10.1007/s10439-016-1762-8 [Google Scholar] [PubMed] [CrossRef]
34. Coenen A, Kim YH, Kruk M, Tesche C, De Geer J, Kurata A, et al. Diagnostic accuracy of a machine-learning approach to coronary computed tomographic angiography-Based fractional flow reserve result from the MACHINE consortium. Circ Cardiovasc Imag. 2018;11(6):500. doi:10.1161/CIRCIMAGING.117.007217 [Google Scholar] [PubMed] [CrossRef]
35. Himburg HA, Grzybowski DM, Hazel AL, LaMack JA, Li XM, Friedman MH. Spatial comparison between wall shear stress measures and porcine arterial endothelial permeability. Am J Physiol—Hear Circ Physiol. 2004;286(5):1916–22. doi:10.1152/ajpheart.00897.2003 [Google Scholar] [PubMed] [CrossRef]
36. Sforza DM, Putman CM, Cebral JR. Hemodynamics of cerebral aneurysms. Annu Rev Fluid Mech. 2009;41(1):91–107. doi:10.1146/annurev.fluid.40.111406.102126 [Google Scholar] [PubMed] [CrossRef]
37. Marsden AL, Bernstein AJ, Reddy VM, Shadden SC, Spilker RL, Chan FP, et al. Evaluation of a novel Y-shaped extracardiac Fontan baffle using computational fluid dynamics. J Thorac Cardiovasc Surg. 2009;137(2):394–403.e2. doi:10.1016/j.jtcvs.2008.06.043 [Google Scholar] [PubMed] [CrossRef]
38. LaDisa JF, Olson LE, Molthen RC, Hettrick DA, Pratt PF, Hardel MD, et al. Alterations in wall shear stress predict sites of neointimal hyperplasia after stent implantation in rabbit iliac arteries. Am J Physiol—Hear Circ Physiol. 2005;288(5). doi:10.1152/ajpheart.01107.2004 [Google Scholar] [PubMed] [CrossRef]
39. Whitehead KK, Pekkan K, Kitajima HD, Paridon SM, Yoganathan AP, Fogel MA. Nonlinear power loss during exercise in single-ventricle patients after the Fontan: insights from computational fluid dynamics. Circulation. 2007;116(11_supplement). doi:10.1161/CIRCULATIONAHA.106.680827 [Google Scholar] [PubMed] [CrossRef]
40. LaDisa JF, Guler I, Olson LE, Hettrick DA, Kersten JR, Warltier DC, et al. Three-dimensional computational fluid dynamics modeling of alterations in coronary wall shear stress produced by stent implantation. Ann Biomed Eng. 2003;31(8):972–80. doi:10.1114/1.1588654 [Google Scholar] [PubMed] [CrossRef]
41. Younis HF, Kaazempur-Mofrad MR, Chan RC, Isasi AG, Hinton DP, Chau AH, et al. Hemodynamics and wall mechanics in human carotid bifurcation and its consequences for atherogenesis: investigation of inter-individual variation. Biomech Model Mechanobiol. 2004;3(1):17–32. doi:10.1007/s10237-004-0046-7 [Google Scholar] [PubMed] [CrossRef]
42. Shahzad MH, Awan AU. Non-Newtonian characteristics of blood flow in a multi-stenosed elliptical artery: a case of sensitivity analysis. Int J Mod Phys B. 2022;37(19):2350182. doi:10.1142/S0217979223501825. [Google Scholar] [CrossRef]
43. Shahzad MH, Nadeem S, Awan AU, Allahyani SA, Ameer Ahammad N, Eldin SM. On the steady flow of non-newtonian fluid through multi-stenosed elliptical artery: a theoretical model. Ain Shams Eng J. 2024;15(1):102262. doi:10.1016/j.asej.2023.102262. [Google Scholar] [CrossRef]
44. Sonmez F, Yildirim O, Karagoz S, Gundogdu F. Experimental investigation of the effects of arterial geometries in different severities of symmetrical stenosis on pressure drop and pump power. Research Square. 2021;1–14. doi:10.21203/rs.3.rs-753411/v1. [Google Scholar] [CrossRef]
45. Siouffi M, Pelissier R, Farahifar D, Rieu R. The effect of unsteadiness on the flow through stenoses and bifurcations. J Biomech. 1984;17(5):299–315. doi:10.1016/0021-9290(84)90025-3 [Google Scholar] [PubMed] [CrossRef]
46. Fan C, Chao BT. Unsteady, laminar, incompressible flow through rectangular ducts. Zeitschrift Für Angew Math Und Phys ZAMP. 1965;16(3):351–60. doi:10.1007/BF01591915. [Google Scholar] [CrossRef]
47. Ojha M, Cobbold RSC, Johnston KW, Hummel RL. Pulsatile flow through constricted tubes: an experimental investigation using photochromic tracer methods. J Fluid Mech. 1989;203:173–97. doi:10.1017/S0022112089001424. [Google Scholar] [CrossRef]
48. Hamakiotes CC, Berger SA. Fully developed pulsatile flow in a curved pipe. J Fluid Mech. 1988;195:23–55. doi:10.1017/S0022112088002319. [Google Scholar] [CrossRef]
49. Shemer L, Wygnanski I, Kit E. Pulsating flow in a pipe. J Fluid Mech. 1985;153:313–37. doi:10.1017/S0022112085001276. [Google Scholar] [CrossRef]
50. Bharadvaj BK, Mabon RF, Giddens DP. Steady flow in a model of the human carotid bifurcation. Part I-Flow visualization. J Biomech. 1982;15(5):349–62. doi:10.1016/0021-9290(82)90057-4 [Google Scholar] [PubMed] [CrossRef]
51. Bara B, Masliyah JH. An experimental and numerical study of the Dean problem: flow development towards two-dimensional multiple solutions. J Fluid Mech. 1992;244:339–76. doi:10.1017/S0022112092003100. [Google Scholar] [CrossRef]
52. Qi XG, Scott DM, Wilson DI. Modelling laminar pulsed flow in rectangular microchannels. Chem Eng Sci. 2008;63(10):2682–9. doi:10.1016/j.ces.2008.01.040. [Google Scholar] [CrossRef]
53. Siouffi M, Deplano V, Pélissier R. Experimental analysis of unsteady flows through a stenosis. J Biomech. 1997;31(1):11–9. doi:10.1016/S0021-9290(97)00104-8 [Google Scholar] [PubMed] [CrossRef]
54. Womersley JR. Method for the calculation of velocity, rate of flow and viscous drag in arteries when the pressure gradient is known. J Physiol. 1955;127(3):553–63. doi:10.1113/jphysiol.1955.sp005276 [Google Scholar] [PubMed] [CrossRef]
55. Yakhot A, Arad M. Numerical investigation of a laminar. Int J Numer Methods Fluids. 1999;950:935–50. [Google Scholar]
56. Lee KW, Xu XY. Modelling of flow and wall behaviour in a mildly stenosed tube. Med Eng Phys. 2002;24(9):575–86. doi:10.1016/S1350-4533(02)00048-6 [Google Scholar] [PubMed] [CrossRef]
57. Tiari S, Ahmadpour-B M, Tafazzoli-Shadpour M, Sadeghi MR. An experimental study of blood flow in a model of coronary artery with single and double stenoses. In: 2011 18th Iranian Conference of Biomedical Engineering (ICBME2011; Tehran, Iran; vol. 2011, p. 33–6. doi:10.1109/ICBME.2011.6168580. [Google Scholar] [CrossRef]
58. Chandran KB, Yearwood TL, Wieting DW. An experimental study of pulsatile flow in a curved tube. J Biomech. 1979;12(10):793–805. doi:10.1016/0021-9290(79)90165-9 [Google Scholar] [PubMed] [CrossRef]
59. Benard N, Coisne D, Donal E, Perrault R. Experimental study of laminar blood flow through an artery treated by a stent implantation: characterisation of intra-stent wall shear stress. J Biomech. 2003;36(7):991–8. doi:10.1016/S0021-9290(03)00068-X [Google Scholar] [PubMed] [CrossRef]
60. Sirsikar PV, Sonawane CR, Tanna A, Yadav M. Thermal design and numerical analysis of transportable bitumen storage tank for improved liquefied bitumen supply. In: Advances in fluid and thermal engineering. Springer: Singapore; 2019. p. 499–509. [Google Scholar]
61. Sonawane CR, Dhanorkar M, Mishra I, Kirdat A, Bhatwadekar S, Sawant R, et al. Numerical simulation of hydro-cyclone separator used for separation of highly dense suspended particulate matter. Mater Today: Proc. 2022;59(1):85–92. doi:10.1016/j.matpr.2021.10.208. [Google Scholar] [CrossRef]
62. Timité B, Castelain C, Peerhossaini H. Pulsatile viscous flow in a curved pipe: effects of pulsation on the development of secondary flow. Int J Heat Fluid Flow. 2010;31(5):879–96. doi:10.1016/j.ijheatfluidflow.2010.04.004. [Google Scholar] [CrossRef]
63. Chandrakant S, Panchal H, Sadasivuni KK. Numerical simulation of flow-through heat exchanger having helical flow passage using high order accurate solution dependent weighted least square based gradient calculations. Energy Sources, Part A Recover Util Environ Eff. 2021;1–26. doi:10.1080/15567036.2021.1900457. [Google Scholar] [CrossRef]
64. Mandal JC, Sonawane CR. Simulation of moderator flow and temperature inside calandria of CANDU reactor using artificial compressibility method. Heat Transf Eng. 2014;35:1254–66. doi:10.1080/01457632.2013.876802. [Google Scholar] [CrossRef]
65. Mandal JC, Sonawane CR, Iyer AS, GosaviInamdar SJ. Incompressible flow computations over moving boundary using a novel upwind method. Comput Fluids. 2011;46(1):348–52. doi:10.1016/j.compfluid.2010.08.011. [Google Scholar] [CrossRef]
66. Sonawane CR, More YB, Pandey A. Numerical simulation of unsteady channel flow with a moving indentation. E3S Web Conf. 2019;128(3):3–5. doi:10.1051/e3sconf/201912810010. [Google Scholar] [CrossRef]
67. Sonawane CR, More YB, Pandey AK. Numerical simulation of unsteady channel flow with a moving indentation using solution dependent weighted least squares based gradients calculations over unstructured mesh. Heat Transf Eng. 2021;1–16. doi:10.1080/01457632.2021.1874661. [Google Scholar] [CrossRef]
68. Mandal JC, Sonawane CR. Simulation of flow inside differentially heated rotating cavity. Int J Numer Methods Heat Fluid Flow. 2013;23(1):23–54. doi:10.1108/09615531311289097. [Google Scholar] [CrossRef]
69. Sousa L, Castro C, António C, Chaves R. Computational techniques and validation of blood flow simulation. WSEAS Trans Biol Biomed. 2011;8:145–55. [Google Scholar]
70. Milner JS, Moore JA, Rutt BK, Steinman DA. Hemodynamics of human carotid artery bifurcations: computational studies with models reconstructed from magnetic resonance imaging of normal subjects. J Vasc Surg. 1998;28(1):143–56. doi:10.1016/S0741-5214(98)70210-1 [Google Scholar] [PubMed] [CrossRef]
71. Eklund A, Dufort P, Forsberg D, LaConte SM. Medical image processing on the GPU—past, present and future. Med Image Anal. 2013;17(8):1073–94. doi:10.1016/j.media.2013.05.008 [Google Scholar] [PubMed] [CrossRef]
72. Baghapour B, McCall A, Roy CJ. Multilevel parallelism for CFD codes on heterogeneous platforms. In: 46th AIAA Fluid Dynamics Conference, 2016; Reston, VA: American Institute of Aeronautics and Astronautics Inc. doi:10.2514/6.2016-3329. [Google Scholar] [CrossRef]
73. Pickering BP, Jackson CW, Scogland TRW, Feng W-C, Roy CJ. Directive-based GPU programming for computational fluid dynamics. Comput Fluids. 2015;114(1):242–53. doi:10.1016/j.compfluid.2015.03.008. [Google Scholar] [CrossRef]
74. Van Zyl JM, Joubert EC, Harms TM. Application of nvidia cuda technology to computational fluid dynamics in South African research. In: 9th South African Conference on Computational and Applied Mechanics (SACAM 2014), 2014; Somerset West, South Africa; p. 157–164. [Google Scholar]
75. Okuyan E, Güdükbay U. Direct volume rendering of unstructured tetrahedral meshes using CUDA and OpenMP. J Supercomput. 2014;67(2):324–44. doi:10.1007/s11227-013-1004-x. [Google Scholar] [CrossRef]
76. Chen H, Ye Y, Lin R. Parallelization of the local mesh refinement on multi-core CPU. In: Parallel computational fluid dynamics. Springer, Berlin, Heidelberg; 2014. vol. 405, p. 514–21. doi:10.1007/978-3-642-53962-6_46. [Google Scholar] [CrossRef]
77. Cheng C, Zheng W, Deepak M, Nick V, Timothy W, Vivek S, et al. Optimization of lattice boltzmann simulation with graphics-processing-unit parallel computing and the application in reservoir characterization. SPE J. 2016;21:1425–35. doi:10.2118/179733-pa. [Google Scholar] [CrossRef]
78. Knoop H, Gronemeier T, Sühring M, Steinbach P, Noack M, Wende F, et al. Porting the MPI-parallelised les model PALM to multi-GPU systems and many integrated core processors-an experience report. Int J Comput Sci Eng. 2018;17(3):297–309. doi:10.1504/IJCSE.2018.095850. [Google Scholar] [CrossRef]
79. Chandrasekaran S, Xu R, Chapman B. Using OpenACC for stencil and Feldkamp algorithms. Elsevier Inc.; 2017. doi:10.1016/B978-0-12-410397-9.00008-1. [Google Scholar] [CrossRef]
80. Mittal R, Seo JH, Vedula V, Choi YJ, Liu H, Huang HH, et al. Computational modeling of cardiac hemodynamics: current status and future outlook. J Comput Phys. 2016;305(4):1065–82. doi:10.1016/j.jcp.2015.11.022. [Google Scholar] [CrossRef]
81. Galassi F, Alkhalil M, Lee R, Martindale P, Kharbanda RK, Channon KM, et al. 3D reconstruction of coronary arteries from 2D angiographic projections using nonuniform rational basis splines (NURBS) for accurate modelling of coronary stenoses. PLoS One. 2018;13(1):1–23. doi:10.1371/journal.pone.0190650 [Google Scholar] [PubMed] [CrossRef]
82. Algabri YA, Altwijri O, Chatpun S. Visualization of blood flow in AAA patient-specific geometry: 3-D reconstruction and simulation procedures. Bionanoscience. 2019;9(4):966–76. doi:10.1007/s12668-019-00662-8. [Google Scholar] [CrossRef]
83. Lim CW, Su Y, Yeo SY, Ng GM, Nguyen VT, Zhong L, et al. Automatic 4D reconstruction of patient-specific cardiac mesh with 1-to-1 vertex correspondence from segmented contours lines. PLoS One. 2014;9(4):e93747. doi:10.1371/journal.pone.0093747 [Google Scholar] [PubMed] [CrossRef]
84. Praharaj P, Sonawane C, Ingalhalikar M. Bibliometric survey on image processing techniques using lattice boltzmann method for CFD simulations. Libr Philos Pract. 2021;2021:1–22. [Google Scholar]
85. Chen Y, Lu D, Courbebaisse G. A parallel image registration algorithm based on a lattice boltzmann model. Information. 2020;11(1):1. doi:10.3390/info11010001. [Google Scholar] [CrossRef]
86. Feiger B, Vardhan M, Gounley J, Mortensen M, Nair P, Chaudhury R, et al. Suitability of lattice Boltzmann inlet and outlet boundary conditions for simulating flow in image-derived vasculature. Int J Numer Method Biomed Eng. 2019;35(6):145. doi:10.1002/cnm.3198 [Google Scholar] [PubMed] [CrossRef]
87. Souleymane BA, Wang B, Gao X. Level set region based image segmentation using Lattice Boltzmann Method. In: 2011 Seventh International Conference on Computational Intelligence and Security, 2011; Sanya, China; p. 1159–63. doi:10.1109/CIS.2011.257. [Google Scholar] [CrossRef]
88. Yu N-N. Image denoising based on modified discrete lattice Boltzmann method. Chin J Liq Cryst Dis.. 2017;32(4):294–301 (In Chinese). doi:10.3788/YJYXS20173204.0294. [Google Scholar] [CrossRef]
89. Noël R, Ge F, Zhang Y, Navarro L, Courbebaisse G. Lattice Boltzmann method for modelling of biological phenomena. In: 25th European Signal Processing Conference EUSIPCO, 2017; Greece, Institute of Electrical and Electronics Engineers Inc.; p. 2654–8. doi:10.23919/EUSIPCO.2017.8081692. [Google Scholar] [CrossRef]
90. Besl PJ, McKay ND. A method for registration of 3-D shapes. IEEE Trans Pattern Anal Mach Intell. 1992;14(2):239–56. doi:10.1109/34.121791. [Google Scholar] [CrossRef]
91. Bajcsy R, Kovačič S. Multiresolution elastic matching. Comput Vision, Graph Image Process. 1989;46(1):1–21. doi:10.1016/S0734-189X(89)80014-3. [Google Scholar] [CrossRef]
92. Köhler B, Born S, van Pelt RFP, Hennemuth A, Preim U, Preim B. A survey of cardiac 4D PC-MRI data processing. Comput Graph Forum. 2017;36(6):5–35. doi:10.1111/cgf.12803. [Google Scholar] [CrossRef]
93. Jia D, Jeon B, Park H-B, Chang H-J, Zhang LT. Image-based flow simulations of pre-and post-left atrial appendage closure in the left atrium. Cardiovasc Eng Technol. 2019;10(2):225–41. doi:10.1007/s13239-019-00412-7 [Google Scholar] [PubMed] [CrossRef]
94. Varshney SS, Rajpal N, Purwar R. Comparative study of image segmentation techniques and object matching using segmentation. In: Proceedings of International Conference on Methods and Models in Computer Science (ICM2CS), 2009; Delhi. doi:10.1109/icm2cs.2009.5397985. [Google Scholar] [CrossRef]
95. Balla-Arabé S, Gao X, Wang B. A fast and robust level set method for image segmentation using fuzzy clustering and lattice boltzmann method. IEEE Trans Cybern. 2013;43(3):910–20. doi:10.1109/TSMCB.2012.2218233 [Google Scholar] [PubMed] [CrossRef]
96. Jiang X, Zhang R, Nie S. Image segmentation based on level set method. Phys Procedia. 2012;33(1):840–5. doi:10.1016/j.phpro.2012.05.143. [Google Scholar] [CrossRef]
97. Dillard SI, Mousel JA, Shrestha L, Raghavan ML, Vigmostad SC. From medical images to flow computations without user-generated meshes. Int J Numer Method Biomed Eng. 2014;30(10):1057–83. doi:10.1002/cnm.2644 [Google Scholar] [PubMed] [CrossRef]
98. Sonawane C, Praharaj P, Pandey A, Kulkarni A. High order accurate numerical simulation of vortex-induced vibrations of a cooled circular cylinder case using solution dependent weighted least square gradient calculations. E3S Web Conf. 2021;321(698):04005. doi:10.1051/e3sconf/202132104005. [Google Scholar] [CrossRef]
99. Sonawane CR. High order accurate numerical simulation of flow past an oscillating circular cylinder. Fluid Mech Res Int J. 2018;2(5):230–2. doi:10.15406/fmrij.2018.02.00042. [Google Scholar] [CrossRef]
100. Sonawane CR, Mandal JC, Rao S. High resolution incompressible flow computations over unstructured mesh using SDWLS gradients. J Inst Eng Ser C. 2019;100(1):83–96. doi:10.1007/s40032-017-0390-x. [Google Scholar] [CrossRef]
101. Myneni M, Rajagopal KR. Constitutive modeling of the mechanical response of arterial tissues. Appl Eng Sci. 2022;11(3–4):100111. doi:10.1016/j.apples.2022.100111. [Google Scholar] [CrossRef]
102. Bourantas GC, Lampropoulos DS, Zwick BF, Loukopoulos VC, Wittek A, Miller K. Immersed boundary finite element method for blood flow simulation. Comput Fluids. 2021;230(2):105162. doi:10.1016/j.compfluid.2021.105162. [Google Scholar] [CrossRef]
103. Liu WK, Liu Y, Farrell D, Zhang L, Wang XS, Fukui Y, et al. Immersed finite element method and its applications to biological systems. Comput Methods Appl Mech Eng. 2006;195:1722–49. doi:10.1016/j.cma.2005.05.049 [Google Scholar] [PubMed] [CrossRef]
104. Zhang L, Gerstenberger A, Wang X, Liu WK. Immersed finite element method. Comput Methods Appl Mech Eng. 2004;193(21–22):2051–67. doi:10.1016/j.cma.2003.12.044. [Google Scholar] [CrossRef]
105. Biffi B, Gritti M, Grasso A, Milano EG, Fontana M, Alkareef H, et al. A workflow for patient-specific fluid-structure interaction analysis of the mitral valve: a proof of concept on a mitral regurgitation case. Med Eng Phys. 2019;74(10):153–61. doi:10.1016/j.medengphy.2019.09.020 [Google Scholar] [PubMed] [CrossRef]
106. Niţǎ C, Itu LM, Suciu C. GPU accelerated blood flow computation using the Lattice Boltzmann Method. In: 2013 IEEE High Performance Extreme Computing Conference (HPEC), 2013; Massachusetts, MA, USA. doi:10.1109/HPEC.2013.6670324. [Google Scholar] [CrossRef]
107. Deplano V, Siouffi M. Experimental and numerical study of pulsatile flows through stenosis: wall shear stress analysis. J Biomech. 1999;32(10):1081–90. doi:10.1016/S0021-9290(99)00098-6 [Google Scholar] [PubMed] [CrossRef]
108. Roy M, Sikarwar BS, Bhandwal M, Ranjan P. Modelling of blood flow in stenosed arteries. Procedia Comput Sci. 2017;115(16):821–30. doi:10.1016/j.procs.2017.09.164. [Google Scholar] [CrossRef]
109. Madhavan S, Kemmerling EMC. The effect of inlet and outlet boundary conditions in image-based CFD modeling of aortic flow. BioMed Eng OnLine. 2018;17(1):1–20. doi:10.1186/s12938-018-0497-1 [Google Scholar] [PubMed] [CrossRef]
110. Kelidis P, Konstantinidis E. Pulsatile flow through a constricted tube: effect of stenosis morphology on hemodynamic parameters. Comput Methods Biomech Biomed Engin. 2018;21(7):479–87. doi:10.1080/10255842.2018.1481505 [Google Scholar] [PubMed] [CrossRef]
111. Kenjereš S, van der Krieke JP, Li C. Endothelium resolving simulations of wall shear-stress dependent mass transfer of LDL in diseased coronary arteries. Comput Biol Med. 2019;114(4):103453. doi:10.1016/j.compbiomed.2019.103453 [Google Scholar] [PubMed] [CrossRef]
112. Biglarian M, Larimi MM, Afrouzi HH, Moshfegh A, Toghraie D, Javadzadegan A, et al. Computational investigation of stenosis in curvature of coronary artery within both dynamic and static models. Comput Methods Programs Biomed. 2020;185(2):105170. doi:10.1016/j.cmpb.2019.105170 [Google Scholar] [PubMed] [CrossRef]
113. Wang Z, Zhao Y, Sawchuck AP, Dalsing MC, Yu H. GPU acceleration of Volumetric Lattice Boltzmann Method for patient-specific computational hemodynamics. Comput Fluids. 2015;115(2):192–200. doi:10.1016/j.compfluid.2015.04.004. [Google Scholar] [CrossRef]
114. Impiombato AN, La Civita G, Orlandi F, Franceschini Zinani FS, Oliveira Rocha LA, Biserni C. A simple transient poiseuille-based approach to mimic the womersley function and to model pulsatile blood flow. Dynamics. 2021;1(1):9–17. doi:10.3390/dynamics1010002. [Google Scholar] [CrossRef]
115. Sandeep S, Shine SR. Effect of stenosis and dilatation on the hemodynamic parameters associated with left coronary artery. Comput Methods Programs Biomed. 2021;204(4):106052. doi:10.1016/j.cmpb.2021.106052 [Google Scholar] [PubMed] [CrossRef]
116. Elmisaoui S, Kissami I, Ghidaglia J-M. High-performance computing to accelerate large-scale computational fluid dynamics simulations: a comprehensive study. In: International Conference on Advanced Intelligent Systems for Sustainable Development (AI2SD’2023), 2024; vol. 930, p. 352–60. doi:10.1007/978-3-031-54318-0_31. [Google Scholar] [CrossRef]
117. Zettinig O, Mansi T, Georgescu B, Rapaka S, Kamen A, Haas J, et al. From medical images to fast computational models of heart electromechanics: An integrated framework towards clinical use. In: Functional Imaging and Modeling of the Heart: 7th International Conference, 2013; London, UK; vol. 7945, p. 249–58. doi:10.1007/978-3-642-38899-6_30. [Google Scholar] [CrossRef]
118. Hagan A, Zhao Y. Parallel 3D image segmentation of large data sets on a GPU cluster. Advances in visual computing. Springer, Berlin, Heidelberg; 2009. vol. 5876. doi:10.1007/978-3-642-10520-3_92. [Google Scholar] [CrossRef]
119. Wang Z, Zhao Y, Yu H, Lin C, Sawchuck AP. Fully parallelized Lattice Boltzmann scheme for fast extraction of biomedical geometry. J Parallel Distrib Comput. 2019;128(10):126–36. doi:10.1016/J.JPDC.2019.02.004. [Google Scholar] [CrossRef]
120. Balla-Arabé S, Gao X. Geometric active curve for selective entropy optimization. Neurocomputing. 2014;139(1):65–76. doi:10.1016/j.neucom.2013.09.058. [Google Scholar] [CrossRef]
121. Berat SC. Simulation of channel flow by parallel implementation of thermal lattice. In: Boltzmann Method on Gpu 2011. 7th International Conference on Computational Heat and Mass Transfer, 2011; Istanbul, Turkey. doi:10.13140/2.1.2100.5441. [Google Scholar] [CrossRef]
122. Zolfaghari H, Andiapen M, Baumbach A, Mathur A, Kerswell R. GPU-based scale-resolving simulations of the chaotic cardiovascular flows. In: 74th Annual Meeting of the APS Division of Fluid Dynamics, 2021; Pheonix, Arizona. [Google Scholar]
123. Viola F, Spandan V, Meschini V, Romero J, Fatica M, de Tullio MD, et al. FSEI-GPU: GPU accelerated simulations of the fluid-structure–electrophysiology interaction in the left heart. Comput Phys Commun. 2022;273:108248. doi:10.1016/j.cpc.2021.108248. [Google Scholar] [CrossRef]
124. Kantasis G, Xanthis CG, Haris K, Al AH. Massively parallel CUDA simulations of cardiac and embryonic MRI on a cloud-based cluster. In: 2015 Computing in Cardiology Conference (CinC), 2015; Nice, France; p. 469–72. doi:10.1109/CIC.2015.7408688. [Google Scholar] [CrossRef]
125. Malecha Z, Mirosław, Tomczak T, Koza Z, Matyka M, Tarnawski W, et al. GPU-based simulation of 3D blood flow in abdominal aorta using OpenFOAM. Arch Mech. 2011;63:137–61. [Google Scholar]
126. Pontrelli G. Pulsatile blood flow in a pipe. Comput Fluids. 1998;27(3):367–80. doi:10.1016/S0045-7930(97)00041-8. [Google Scholar] [CrossRef]
127. Ünsal B, Ray S, Durst F, Ertunç Ö. Pulsating laminar pipe flows with sinusoidal mass flux variations. Fluid Dyn Res. 2005;37(5):317–33. doi:10.1016/j.fluiddyn.2005.06.002. [Google Scholar] [CrossRef]
128. Husain I, Labropulu F, Langdon C, Schwark J. A comparison of Newtonian and non-Newtonian models for pulsatile blood flow simulations. J Mech Behav Mater. 2020;21:147–53. doi:10.1515/jmbm-2013-0001. [Google Scholar] [CrossRef]
129. Ponalagusamy R, Tamil Selvi R, Banerjee AK. Mathematical model of pulsatile flow of non-Newtonian fluid in tubes of varying cross-sections and its implications to blood flow. J Franklin Inst. 2012;349(5):1681–98. doi:10.1016/j.jfranklin.2012.02.001. [Google Scholar] [CrossRef]
130. Beier S, Ormiston J, Webster M, Cater J, Norris S, Medrano-Gracia P, et al. Hemodynamics in idealized stented coronary arteries: important stent design considerations. Ann Biomed Eng. 2016;44(2):315–29. doi:10.1007/s10439-015-1387-3 [Google Scholar] [PubMed] [CrossRef]
131. Fan Z, Liu X, Zhang Y, Zhang N, Ye X, Deng X. Hemodynamic impact of stenting on carotid bifurcation: a potential role of the stented segment and external carotid artery. Comput Math Methods Med. 2021;2021(9719):4–6. doi:10.1155/2021/7604532 [Google Scholar] [PubMed] [CrossRef]
132. Fytanidis DK, Soulis JV, Giannoglou GD. Patient-specific arterial system flow oscillation. Hippokratia. 2014;18:162–5 [Google Scholar] [PubMed]
133. Alimohammadi M, Pichardo-Almarza C, Agu O, Díaz-Zuccarini V. Development of a patient-specific multi-scale model to understand atherosclerosis and calcification locations: comparison with in vivo data in an aortic dissection. Front Physiol. 2016;7:275. doi:10.3389/fphys.2016.00238 [Google Scholar] [PubMed] [CrossRef]
134. Zhang H, Gao Z, Xu L, Yu X, Wong KCL, Liu H, et al. A meshfree representation for cardiac medical image computing. IEEE J Transl Eng Heal Med. 2018;6:1–12. doi:10.1109/JTEHM.2018.2795022 [Google Scholar] [PubMed] [CrossRef]
135. Sadrehaghighi I. Artificial Intelligence (AI) and deep learning for CFD 2021. In: CFD open series: Technical report; 2022. doi:10.13140/RG.2.2.22298.59847/7. [Google Scholar] [CrossRef]
136. Morales Ferez X, Mill J, Juhl KA, Acebes C, Iriart X, Legghe B, et al. Deep learning framework for real-time estimation of in-silico thrombotic risk indices in the left atrial appendage. Front Physiol. 2021;12:1–14. doi:10.3389/fphys.2021.694945 [Google Scholar] [PubMed] [CrossRef]
137. Li G, Wang H, Zhang M, Tupin S, Qiao A, Liu Y, et al. Prediction of 3D Cardiovascular hemodynamics before and after coronary artery bypass surgery via deep learning. Commun Biol. 2021;4(1):1754. doi:10.1038/s42003-020-01638-1 [Google Scholar] [PubMed] [CrossRef]
138. Li Y, Wan D, Hu D, Li C. A novel approach for estimating blood flow dynamics factors of eccentric stenotic arteries based on ML. Eng Anal Bound Elem. 2024;163(9):175–85. doi:10.1016/j.enganabound.2024.03.003. [Google Scholar] [CrossRef]
139. Jamil IR, Humaira M. Modeling and predicting blood flow characteristics through double stenosed artery from computational fluid dynamics simulations using deep learning models. Int J Adv Comput Sci Appl. 2022;13:832–41. doi:10.14569/issn.2156-5570. [Google Scholar] [CrossRef]
140. Ghebrehiwet I, Zaki N, Damseh R, Mohamad MS. Revolutionizing personalized medicine with generative AI: a systematic review. Artif Intell Rev. 2024;57:128. doi:10.1007/s10462-024-10768-5. [Google Scholar] [CrossRef]
141. Taylor L, Nitschke G. Improving deep learning using generic data augmentation 2017. doi:10.48550/arXiv.1708.06020. [Google Scholar] [CrossRef]
142. Abucide-Armas A, Portal-Porras K, Fernandez-Gamiz U, Zulueta E, Teso-Fz-betoño A. A data augmentation-based technique for deep learning applied to CFD simulations. Mathematics. 2021;9(16):1843. doi:10.3390/math9161843. [Google Scholar] [CrossRef]
143. Aisu N, Miyake M, Takeshita K, Akiyama M, Kawasaki R, Kashiwagi K, et al. Regulatory-approved deep learning/machine learning-based medical devices in Japan as of 2020: a systematic review. PLoS Digit Heal. 2022;1(1):e0000001. doi:10.1371/journal.pdig.0000001 [Google Scholar] [PubMed] [CrossRef]
144. Joshi G, Walambe R, Kotecha K. A review on explainability in multimodal deep neural nets. IEEE Access. 2021;9:59800–21. doi:10.1109/ACCESS.2021.3070212. [Google Scholar] [CrossRef]
145. Lellep M, Prexl J, Eckhardt B, Linkmann M. Interpreted machine learning in fluid dynamics: explaining relaminarisation events in wall-bounded shear flows. J Fluid Mech. 2022;942:1–29. doi:10.1017/jfm.2022.307. [Google Scholar] [CrossRef]
146. Fluidda. Functional respiratory imaging (FRI) technology; 2019. Available from: https://www.fluidda.com/. [Accessed 2024]. [Google Scholar]
147. Puiu A, Vizitiu A, Nita C, Itu L, Sharma P, Comaniciu D. Privacy-preserving and explainable AI for cardiovascular imaging. Stud Informatics Control. 2021;30(2):21–32. doi:10.24846/v30i2y202102. [Google Scholar] [CrossRef]
148. Barredo Arrieta A, Díaz-Rodríguez N, Del Ser J, Bennetot A, Tabik S, Barbado A, et al. Explainable Artificial Intelligence (XAIconcepts, taxonomies, opportunities and challenges toward responsible AI. Inf Fusion. 2020;58(3):82–115. doi:10.1016/j.inffus.2019.12.012. [Google Scholar] [CrossRef]
149. Sofos F, Stavrogiannis C, Exarchou-kouveli KK, Akabua D, Charilas G, Karakasidis TE. Current trends in fluid research in the era of Artificial Intelligence: a review. Fluids. 2022;7(3):1–25. doi:10.3390/fluids7030116. [Google Scholar] [CrossRef]
150. Yenare R, Sonawane C, Sur A, Singh B, Panchal H, Kumar A, et al. A comprehensive review of portable cold storage: technologies, applications, and future trends. Alexandria Eng J. 2024;94(14–15):23–33. doi:10.1016/j.aej.2024.03.014. [Google Scholar] [CrossRef]
Cite This Article
 Copyright © 2024 The Author(s). Published by Tech Science Press.
This work is licensed under a Creative Commons Attribution 4.0 International License , which permits unrestricted use, distribution, and reproduction in any medium, provided the original work is properly cited.


 Submit a Paper
 Propose a Special lssue
 View Full Text
 Download PDF


 Downloads
 Citation Tools