
 Submit a Paper
 Propose a Special lssue
 Open Access
ARTICLE

Deep Learning and Machine Learning Architectures for Dementia Detection from Speech in Women
1 Department of Computer Science, College of Engineering in Al-Lith, Umm Al-Qura University, Makkah, 24243, Saudi Arabia
2 Department of Information Systems, College of Computer and Information Sciences, Princess Nourah bint Abdulrahman University, Riyadh, 11671, Saudi Arabia
3 Department of Computer Science, College of Computer and Information Science, King Saud University, Riyadh, 11495, Saudi Arabia
* Corresponding Authors: Amel Ksibi. Email: ; Mohammed Zakariah. Email:
(This article belongs to the Special Issue: Intelligent Medical Decision Support Systems: Methods and Applications)
Computer Modeling in Engineering & Sciences 2025, 142(3), 2959-3001. https://doi.org/10.32604/cmes.2025.060545
Received 04 November 2024; Accepted 27 January 2025; Issue published 03 March 2025
 View Full Text
 Download PDF
Abstract
Dementia is a neurological disorder that affects the brain and its functioning, and women experience its effects more than men do. Preventive care often requires non-invasive and rapid tests, yet conventional diagnostic techniques are time-consuming and invasive. One of the most effective ways to diagnose dementia is by analyzing a patient’s speech, which is cheap and does not require surgery. This research aims to determine the effectiveness of deep learning (DL) and machine learning (ML) structures in diagnosing dementia based on women’s speech patterns. The study analyzes data drawn from the Pitt Corpus, which contains 298 dementia files and 238 control files from the Dementia Bank database. Deep learning models and SVM classifiers were used to analyze the available audio samples in the dataset. Our methodology used two methods: a DL-ML model and a single DL model for the classification of diabetics and a single DL model. The deep learning model achieved an astronomic level of accuracy of 99.99% with an F1 score of 0.9998, Precision of 0.9997, and recall of 0.9998. The proposed DL-ML fusion model was equally impressive, with an accuracy of 99.99%, F1 score of 0.9995, Precision of 0.9998, and recall of 0.9997. Also, the study reveals how to apply deep learning and machine learning models for dementia detection from speech with high accuracy and low computational complexity. This research work, therefore, concludes by showing the possibility of using speech-based dementia detection as a possibly helpful early diagnosis mode. For even further enhanced model performance and better generalization, future studies may explore real-time applications and the inclusion of other components of speech.Keywords
Abbreviations
| AD | Alzheimer Disease |
| DL | Deep Learning |
| CNN | Convolutional Neural Network |
| ResNet | Residual Neural Network |
| DNN | Deep Neural Network |
| ASGD | Averaged Stochastic Gradient Descent |
| ANN | Artificial Neural Networks |
| BiLSTM | Bidirectional Long-Short Term Memory |
| DBN | Deep Belief Network |
| EDA | Exploratory Data Analysis |
| MFCC | Mel-Frequency Cepstral Coefficients |
| RNN | Recurrent Neural Networks |
| AUC-ROC | Area under the ROC Curve/Receiver Operating Characteristic |
| FP/FN | False Positive/False Negative |
| ML | Machine Learning |
| SVM | Support Vector Machine |
| RF | Random Forest |
| LSTM | Long Short-Term Memory |
| AWD-LSTM | ASGD Weight-Dropped LSTM |
| LR | Logistic Regression |
| SVC | Support Vector Classifier |
| BERT | Bidirectional Encoder Representations |
| PRCNN | Parallel Recurrent Convolutional Neural Networks |
| ZCR | Zero-Crossing Rate |
| HPSS | Harmonic-Percussive Source Separation |
| RBF | Radial Basis Function |
| TP/TN | True Positive/True Negative |
Alzheimer’s disease (AD) is a substantial and increasing public health issue, affecting over 10 million people globally [1–3]. It is projected that this figure will surpass 60 million by 2040. AD is the most prevalent type of dementia, characterized by the gradual deterioration of cognitive abilities such as speech and language [4–6]. Due to the significant consequences of this illness on individuals, families, and healthcare systems, it is essential to prioritize early detection and categorization to identify those who are at risk of transitioning from normal cognitive function to mild cognitive impairment and eventually Alzheimer’s dementia [7,8]. The ability to significantly reduce the progression of Alzheimer’s disease and conserve substantial healthcare resources emphasizes the importance of early diagnosis and intervention [9]. Like Alzheimer’s disease, neurodegenerative diseases such as Parkinson’s disease (PD) also require early diagnosis and intervention to reduce the impact of the disease on patients and the healthcare system [10]. By focusing on the demographic most susceptible to Alzheimer’s disease (AD), healthcare professionals and researchers can collaborate to apply tactics that enhance outcomes for individuals affected by the condition while also optimizing resource allocation within the healthcare system [11,12]. Timely identification and intervention can significantly influence the course of AD, allowing individuals to access suitable medical attention and assistance during the initial phases of the illness [13]. This proactive strategy may additionally mitigate the load imposed on careers and diminish the pressure on healthcare systems, ultimately resulting in enhanced quality of life for those impacted by AD and their families [14–17].
Furthermore, by identifying those who are unlikely to develop dementia, healthcare resources can be allocated to those who require specialized care and support the most [18–20]. Given the growing prevalence of AD worldwide, it is crucial to comprehend the condition thoroughly, as well as its associated risk factors, to facilitate the development of efficient treatments and treatment approaches [21,22]. To progress in AD research and improve outcomes for people afflicted by the disease, healthcare practitioners and researchers can tackle issues related to early diagnosis and categorization.
Furthermore, dementia not only affects the people who are affected by it but also has significant consequences for their families and carers [23,24]. Therefore, it is crucial to ascertain and discover efficient methods to diagnose and handle dementia promptly [25,26]. Speech is an early and noticeable sign of the cognitive impairment that is linked to dementia. Research has indicated that people with dementia have a range of speech patterns, including alterations in vocal pitch, frequent pauses, and difficulties in recalling words [27,28]. Speech modifications can be nuanced and intricate, making it challenging for physicians to identify and diagnose dementia solely based on speech patterns [29,30].
Recent progress in deep learning and machine learning architectures has demonstrated potential for automating the identification of dementia from speech, presenting possible methods to tackle this diagnostic obstacle [31]. Given that women make up almost two-thirds of people living with dementia worldwide, it is fair to say that dementia has a disproportionately negative impact on them. The cause of this gender gap remains partially unexplained, but it could be attributed to a complex interplay of genetic, hormonal, and socio-economic factors [32,33].
However, most studies on identifying dementia through speech have mainly concentrated on mixed or male-specific groups, neglecting to adequately consider the distinct speech patterns and linguistic traits exhibited by women with dementia. Hence, it is imperative to create and verify deep learning and machine learning structures that are specifically designed for identifying dementia in women through speech. This study paper examines and evaluates the literature on deep learning and machine learning structures for identifying dementia through address, specifically focusing on women.
The framework for identifying dementia in women based on speech, as illustrated in Fig. 1, comprises multiple essential stages. The initial phase encompasses data pre-processing, encompassing the segregation of audio files, the extraction of MFCC characteristics, the standardization of time steps, labeling, padding or truncation, data augmentation, conversion to NumPy arrays, and the amalgamation of original and enhanced data. The train-test split is a stage in the data pre-processing process. The subsequent phase entails the utilization of a fusion model that combines deep learning and machine learning techniques. Subsequently, the model evaluation measures are utilized to ascertain the presence or absence of dementia.

Figure 1: Framework for deep learning and machine learning architectures for dementia detection from speech in women
The contributions of this research paper are as follows:
i) Comprehensive Analysis for Early Dementia Detection: This study presents a comprehensive analysis of the early phase of dementia, focusing on its detection based on speech data by implementing state-of-the-art deep learning and machine learning algorithms for enhanced sensitivity.
ii) Innovative Model Architecture: In this study, we propose a novel hybrid model that utilizes CNN and SVM in the voting classifier system, greatly improving dementia differentiation accuracy.
iii) Exceptional Performance and Accuracy: Our proposed model performs phenomenally, providing 99.99% accuracy in differentiating the demented and control groups based on the findings of all our investigated parameters, including Precision, recall, and F1 score.
iv) Development of a Robust Ensemble Approach: The paper describes a detailed framework for constructing an advanced ensemble model that combines deep learning and machine learning algorithms, thereby creating a more accurate diagnostic approach for dementia.
v) Superior Resilience and Performance: We prove that the proposed hybrid architecture is more robust and accurate than separate SVMs and deep learning-based schemes, which adds to the development of dementia identification technologies.
This study suggests a revised text organization framework: Section 1 analyzes the topic and its relevance. The current literature on the subject is thoroughly examined in Section 2. Section 3 discusses data analysis, including the pre-processing process and the datasets used. A detailed analysis of the study’s research method follows in Section 4. This section describes the practices and procedures. This study investigates ways and provides essential insights about tactics. Section 5 details the experimental setup, execution, and findings. Section 6 presents and analyzes the results. Section 7 summarizes the findings and suggests additional research. The redesigned format of this work organizes areas methodically to improve cohesion and clarity across the study.
In recent years, early diagnosis of Alzheimer’s disease (AD) and Parkinson’s disease (PD) through AI and ML has been quite popular. Researchers have adopted different methods, such as speech analysis, image-based detection, and deep learning models, to diagnose Alzheimer’s disease. However, several essential drawbacks have remained, including data quality concerns, models’ transferability, and high computational costs, which imply the requirement for more studies in the field.
Agbavor et al. [7] proposed an AI system to identify Alzheimer’s disease based on six voice features extracted from the Dementia Bank Pitt dataset, including 160 AD patients and 99 normal individuals. RF and SVC were employed in machine learning models with a percentage accuracy of 73%. Nonetheless, the study was confined by the use of particular screening procedures and based on the given data set, resulting in reduced external validity of the findings. Further, its importance will stress the need to collect better and less biased datasets and effective screening techniques.
In the same way, Pragadeeswaran et al. [10] presented a new method for PD detection by analyzing handwritten spiral images applying the proposed Cosine Deep Convolutional Neural Network (CosineDCNN). They proved a high accuracy of 89.98% and a high PPC of 87.41%. However, their method had limitations, including prohibitive computational overhead and the dependence on the quality of the images. Such limitations require more systematic approaches to address the variability of data quality and restriction in computation; hence, there is a need to address this field further.
Multi-modal machine learning is an area of interest, and Priyadarshinee et al. [12] presented a study on speech (audio) and text for Alzheimer’s detection. We found that using the Dementia Bank Pitt dataset, they obtained an accuracy of 78.9%. Despite the promising results of their approach, they found some limitations in their study, including a small sample size, potential biases of participants, and a high non-responder rate because of the restricted focus of the dataset. They must also admit that, based on their experiences with commonly used small datasets and relatively simple models, they cannot confidently say that the same would occur given larger datasets of higher resolution levels.
Another study by Ortiz-Perez et al. [16] used a deep learning approach to establish a multi-modal framework with ResNet BERT and CNN models for signs of dementia. Their experiment on the Dementia Bank Copus dataset obtained an accuracy level of 73.49%. They also noted that the study had its fair share of limitations, chief among them being that using a single dataset could result in model bias and a poor understanding of the level of decision-making. This demonstrates the need for the diversity of data sources and the enhancement of the model interpretability of dementia detection systems.
In their study, Pan et al. [20] introduced the Decoupling Generative Adversarial Network (DecGAN) for identifying abnormal neural circuits in Alzheimer’s disease. This method enabled an 86.20% GCN accuracy; however, the model was intricate, requiring high computational power. The focus on big data and the demand for complex systems highlight the problem of searching for more efficient algorithms and solutions in detecting Alzheimer’s.
For example, Zheng et al. [22] concerned speech-based dementia detection based on deep neural networks, which provided 76.16% accuracy. However, their study was restricted to analyzing speech data only, while some essential patient factors and other possible markers were excluded. Such limitations imply the requirement for more detailed methods that consider multiple types of data to enhance dementia identification. In a more recent study, Zong et al. [24] proposed a NEW paradigm for constructing Brain networks for brain disorders—Alzheimer’s disease using DbGCL. The Precision of their model was 90.36%, and the AUC was 0.9706. Nevertheless, some issues were identified, such as the model’s utility requiring large datasets and possessing a high architecture density, implying higher computational power. These suggest the bail for future studies in simplifying such models, retaining their exactness and effectiveness.
The diagnostic system was developed through deep learning with an accuracy of 53% from 99.95%, as depicted by Saleem et al. [25]. The variation in outcome suggests a strong emphasis on deep learning techniques without regard to fundamental model stability and clinical verification. Such disparity indicates the lack of standard and clinical approach protocols to give sane, dependable, and reproducible diagnostic procedures for Alzheimer’s detection.
Alzheimer’s dementia was diagnosed using a bag of deep features and a model ensembling by Syed et al. [29] with an accuracy of 91.67%. However, their approach had drawbacks like dataset bias, and non-linguistic symptoms were not considered, while they are important for the real diagnosis. This has an implication in checking on all the symptoms to make sure that the dataset is bias-free and all-inclusive to make the diagnostic model effective.
Furthermore, Liu et al. [33] used a Feature purification network to increase the sensitivity of the identification of the diagnosis of Alzheimer’s disease from speech with an accuracy of 91.4%. However, the approach’s usefulness and their particular model are questionable because they work with a rather narrow dataset, and their model has yet to be clinically assessed. Such limitations only suggest how clinical verification in more and more patients is essential, as well as the multidisciplinary integration of more diverse data in AI-diagnostic technologies.
Recently, Kumar et al. [34] employed both the machine learning and deep learning approaches for diagnosing dementia, with their study achieving a Precision of 85%. However, the deployment issue, speech bias, limited dataset, and the requirement of clinical validation diminish the need for such models to be more extensive and clinically verified for accurate detection of dementia.
These studies together show that AI and ML hold substantial roles in the identification of diseases but also reveal challenges to implementing these machines. Hence, there is a clear and emergent need for successive research on more scalable, generalized, and clinically validated diagnostic approaches to meet clinical needs.
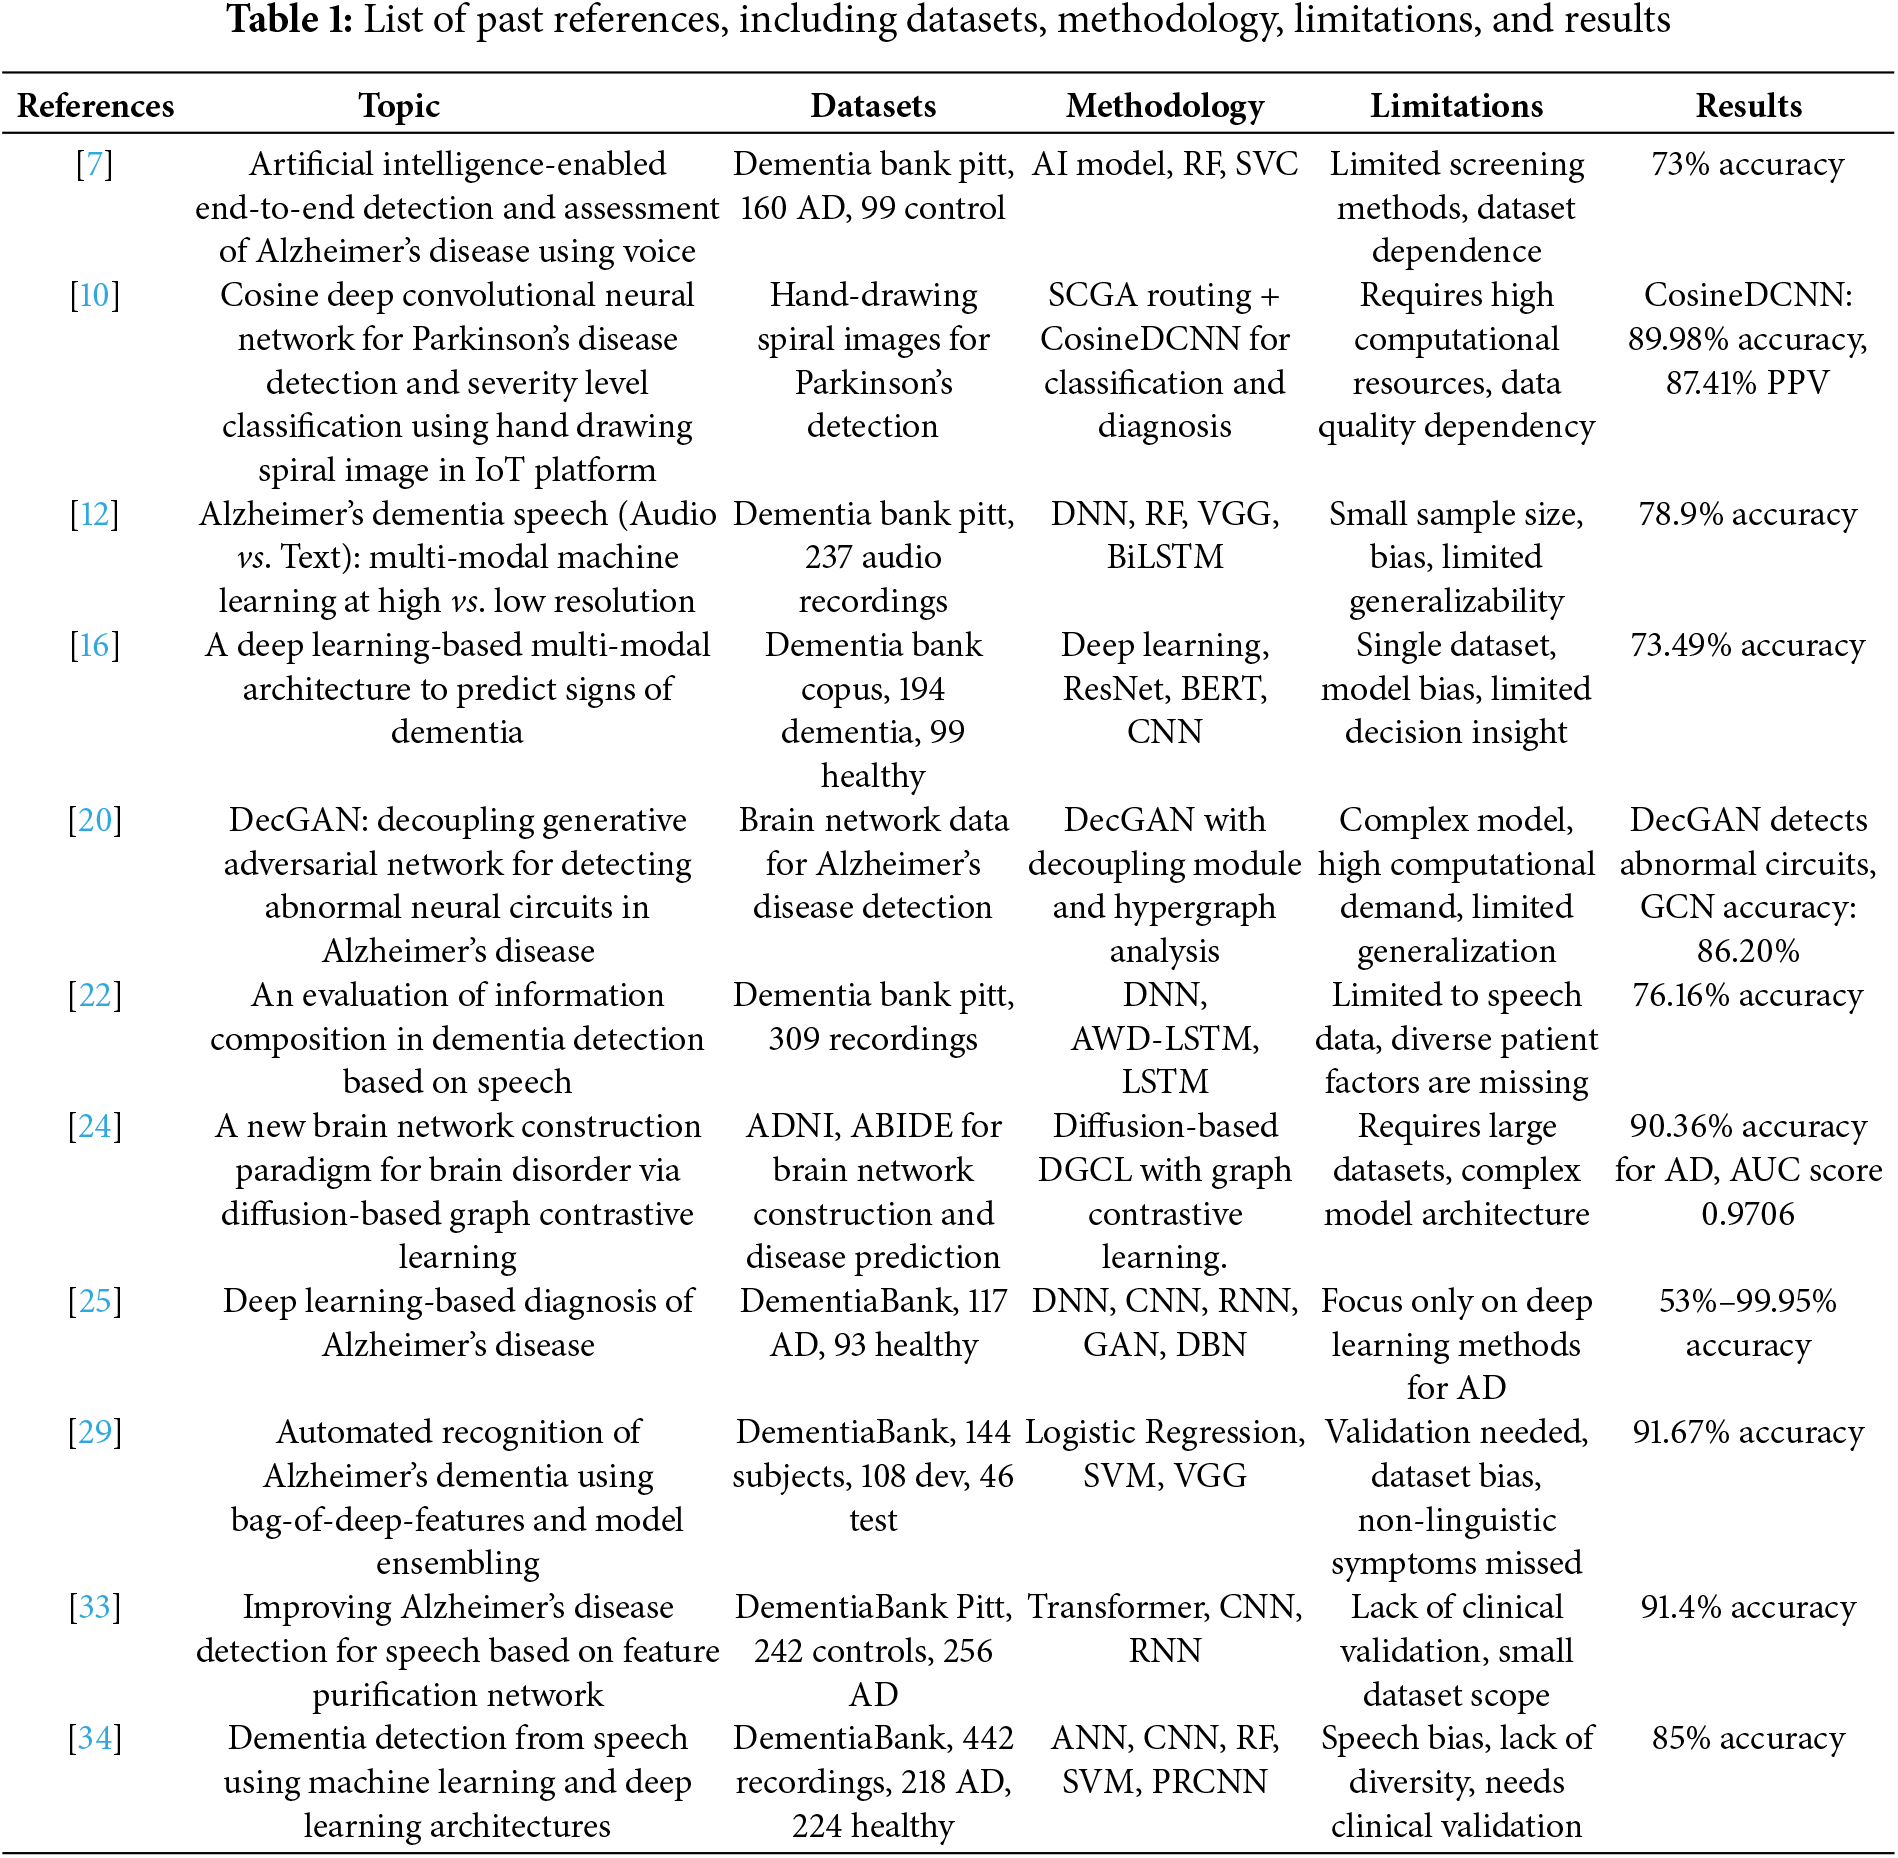
Table 1 lists past references, including datasets, methodology, limitations, and results.
The Pitt Corpus, a rich and interactive multi-modal resource for dementia study and interaction, is the data set used in the present research. It is from the Dementia Bank database. As part of Pitt Corpus, participants’ answers to the common ‘cookie-stealing’ test of visual description are recorded in written transcriptions and spoken audio data. Based on an impromptu response to an image of a young boy furtively attempting to take cookies, this test measures cognitive capabilities and speech intelligibility. This makes the “cookie theft picture description” dataset perfect for research on dementia-related patterns of speech and cognition since it is aimed at speech and cognition evaluation.
As stated earlier, the aforementioned dataset comprises audio tapes containing interactions between participants or, in this case, doctors and text records of similar interactions. The texts made available are in the form of CHA files, while the recordings are available in mp3 format. The dataset is divided into two main categories: patients with dementia and matched control (subjects without cognitive impairment). The fact that Parkinson’s disease participants and the controls can be grouped in this manner, and their speech features can be contrasted, is inherently valuable.
In total, the dataset contains 536 audio recordings; 238 of these are from the control group, and 298 of these are from the dementia group. These files would be of great help in research work concerning speech processing, cognitive evaluations, and the identification of possible signs of dementia in speech patterns. The dataset serves as a useful resource for increasing the pool of existing information and progress in analyzing speech in dementia patients because the dataset is made available through the filing of a request to assist with research goals and purposes. In this study, only the audio file was considered to focus on the voice interactive aspect of the data.
Conversely, the distribution of the audio dataset classes is depicted in Fig. 2. Furthermore, male and female patients are present, ages ranging from 46 to 90. The statistics show the number of samples (audio recordings, since a patient may have several recordings), the number of people with dementia, and the number of healthy people (control group). A multi-component graphic that portrayed the “cookie-theft” scenario from the Boston Diagnostic Aphasia Examination was used to conduct these interviews. The language used for these interviews was English. During the interview, the patients were given a “cookie-theft” photo and instructed to look at anything they could. Video recordings of the patients’ spoken remarks were made, and relevant sentences were transcription-formatted. The dataset used in this study exclusively contains data about women.

Figure 2: Distribution of audio dataset classes
Dementia is a progressive neurological disorder characterized by a decline in cognitive function that affects thinking, memory, and communication. Early dementia identification is essential for timely therapy and improved patient outcomes. Recent research looks into the prospect of identifying dementia from various modalities, including speech, using state-of-the-art technologies like DL and ML.
Exploratory data analysis (EDA) is a necessary preliminary step in interpreting and presenting patterns in datasets. It sets the stage for careful feature selection and model construction. In this study, we examine the diagnosis of dementia in females and use EDA to extract significant information about the inherent characteristics of speech data.
i. Waveform Analysis of Dementia and Control Speech
The visualizations (Fig. 3) display the waveforms of audio samples from the dementia and control groups. Each waveform shows the amplitude of the audio stream over time, allowing for a qualitative comparison between the two classes. The x-axis displays the time in samples, and the y-axis represents the amplitude of the audio stream.

Figure 3: Waveform analysis of dementia speech
The amplitude and patterns of the dementia speech waveform vary. These changes might be a symptom of abnormalities or distortions in the speech signal, which could be connected to dementia’s cognitive impacts. Significant oscillations and anomalies in the dementia waveform point to probable disturbances in speech patterns, which are consistent with the documented difficulties in speech articulation experienced by dementia patients.
Fig. 4 illustrates the smoother control speech waveform, indicating a more regular and structured speaking pattern. The waveform of the control group is stable and steady, showing typical speech patterns and the absence of any apparent distortions or anomalies. The displayed waveforms provide some initial insight into the auditory characteristics of control speech and dementia. The waveform pattern variances found could serve as a springboard for further investigation into specific traits or measures that set these two classes apart. These visual aids may serve as the basis for additional research into feature extraction and advanced machine learning models, yielding trustworthy diagnostic instruments for analyzing speech signals in diagnosing dementia.

Figure 4: Waveform analysis of control speech
ii. Beat Tracking Analysis of Dementia and Control Speech
The visualizations show the beat-tracking results for audio samples from the dementia and control groups. Beat tracking identifies the beats or other rhythmic elements inside an audio stream. The x-axis displays time in seconds, and the y-axis, normalized for clarity, shows the amplitude. Fig. 5 shows a dementia speech onset strength plot with varying intensities, signifying dynamic changes in rhythm and tempo. This discrepancy may be due to irregularities in producing dementia-related speech patterns.

Figure 5: Beat tracking analysis of dementia and control speech
The rhythmic pattern of dementia speech is represented by the red dashed lines, which stand for recognized beats. Changes in beat position highlight gaps in the speech’s natural flow. As the onset strength plot shows, the control speech exhibits more consistent intensities, indicating a stable rhythm. This regularity is consistent with healthy people’s typical speech habits.
When control speech is depicted by red dashed lines that are regularly spaced and well-defined, it has a steady rhythmic pattern. The beat-tracking investigation clarifies the rhythmic characteristics of dementia and regulates speech. In addition to other traits, beat pattern changes could help distinguish between the two classes. Further research into these rhythmic characteristics and other auditory attributes can help develop comprehensive speech-signal-based dementia diagnosis models.
iii. Zero-Crossing Rate Analysis of Dementia and Control Speech
Fig. 6 shows the zero-crossing rate (ZCR) study results for audio samples from the dementia and control groups. ZCR tracks how quickly an audio signal changes signs, providing insight into the signal’s abrupt changes and noise [35]. The zero-crossing rate is plotted on the y-axis, and time is displayed on the x-axis in frames. The zero-crossing rate plot for dementia speech exhibits oscillations, indicating frequent signal sign changes. It suggests that dementia patients have higher noise levels or sudden shifts in the acoustic characteristics of their speech. The irregularities and disruptions that people with dementia commonly experience in their speech patterns may be connected to variations in the ZCR values.

Figure 6: Zero-crossing rate analysis of dementia and control speech
On the other hand, control speech exhibits fewer oscillations and a more constant zero-crossing rate. The audio signal’s smoother slope suggests a more constant sign pattern [36]. Lower ZCR variability in control speech is consistent with the expected regularities in the speech patterns of healthy individuals. Zero-crossing rate analysis is a technique for quantifying noise and abrupt changes in audio signals associated with dementia and controlling speech. The reported differences in ZCR patterns between the two groups suggest that ZCR may help distinguish between dementia and controlled speech.
iv. Chromagram Analysis of Dementia and Control Speech
Fig. 7 shows the analysis of the chromosomal samples from dementia and control groups, which depict the pitch content in audio signals. A chromatogram, which provides information about the tonal characteristics of speech, shows the distribution of pitch classes across time. Each of the plot’s columns represents a small-time interval, and the color intensity indicates the strength of the pitch class.

Figure 7: Chromatogram analysis of dementia speech
The dementia speech chromatogram plot shows color intensity variations corresponding to pitch class shifts. It suggests that individuals with dementia may communicate with different tonal patterns. This color distribution dissimilarity may be related to the characteristic pitch fluctuations observed in dementia-related speech difficulties. In contrast, the controlled speech chromatogram exhibits a more consistent color distribution, indicating consistent pitch patterns. Fig. 8’s smooth color transition suggests that the control group members speak with a more consistent pitch structure.

Figure 8: Chromatogram analysis of control speech
The consistent chromatogram pattern observed in control speech aligns with the anticipated practices found in the pitch characteristics of healthy individuals. Research using chromatograms demonstrates differences between dementia and control groups, providing crucial information about voice tonality. The observed variations in pitch patterns could be used to distinguish between the two groups. Further acoustic characteristics combined with chromatogram analysis could result in more advanced and precise algorithms for dementia detection based on speech signals.
v. MFFC Analysis of Dementia and Control Speech
Fig. 9 presents the analysis of Mel-Frequency Cepstral Coefficients (MFCCs) for audio samples from the dementia and control groups. MFCCs are essential to speech processing because they capture the spectrum features of speech signals [37]. Each figure shows the temporal evolution of MFCCs, providing insights into frequency content and speech changes. The MFCC plots for dementia speech exhibit patterns that indicate variations in the spectral range over time. The peaks and troughs of the MFCCs show shifts in the frequencies employed in speech related to dementia.

Figure 9: MFFC analysis of dementia speech
Inconsistencies in the MFCCs may be connected with the characteristic anomalies in speech signals associated with dementia-related illnesses. As illustrated in Fig. 10, the MFCC plots demonstrate a more ordered and consistent pattern in control speech, suggesting a consistent spectral content throughout the audio samples. The smoother transitions in the MFCCs suggest the regular frequency features of the speech in the control group. Speech from healthy individuals should have a stable spectral composition, and control speech should display constant MFCC patterns.
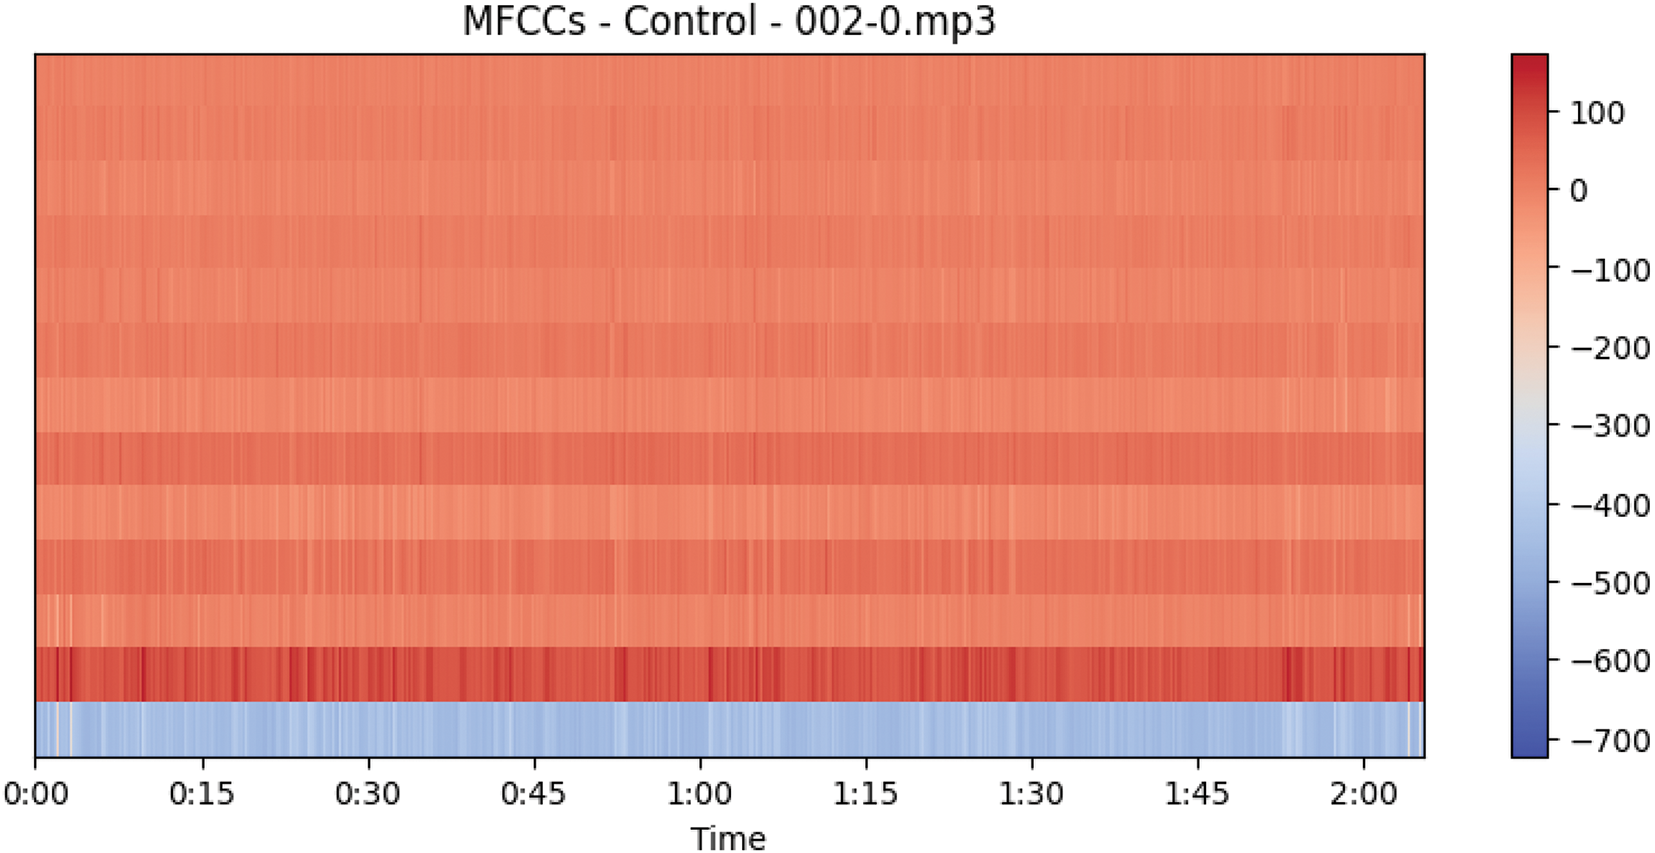
Figure 10: MFFC analysis of control speech
MFCC analysis shows different spectral characteristics in the speech of the dementia and control groups. One of the most important markers for separating the two groups may be the differences in frequency content observed in dementia MFCCs. More acoustic features combined with MFCC characteristics could improve the accuracy of speech-signal-based dementia detection algorithms. The MFCC patterns that have been shown offer valuable new data for examining the auditory markers of speech deficits linked to dementia.
vi. Spectrogram Analysis of Dementia and Control Speech
Fig. 11 displays the spectrogram analysis for audio samples from the dementia and control groups. Spectrograms provide a detailed representation of the frequency content of speech signals across time, providing insights into the dynamics of the speech spectrum. Dementia patients’ speech spectrums exhibit anomalies, fluctuating frequency content, and color intensity. Dimmed regions could indicate a reduction in energy or an absence of particular frequencies. Discontinuous patterns or concentrated power in specific frequency bands in dementia spectrograms can be used to indicate abnormal speech associated with cognitive issues.

Figure 11: Spectrogram analysis of dementia and control speech
Control voice spectrophotometric data exhibits more consistent patterns and smoother color intensity changes. Differentiable frequency bands indicate regular and consistent speech patterns. Control spectrograms display homogeneous patterns that match the expected spectral stability in healthy individuals’ speech.
Spectrogram analysis shows that the speech of the dementia and control groups exhibits distinct spectrum patterns. Dementia spectrogram abnormalities and fluctuations may indicate speech patterns associated with cognitive deficits. These visualizations help understand the auditory indications of dementia-related speech problems and provide valuable features for further research in developing diagnostic models. Other acoustic parameters can enhance spectrogram data to improve the performance of machine-learning models that use speech signals to diagnose dementia.
vii. Harmonic-Percussive Source Separation (HPPS) Analysis of Dementia and Control Speech
Fig. 12 shows the results of Harmonic-Percussive Source Separation (HPSS) applied to audio samples from the dementia and control groups. A method of signal processing known as harmonic partial sine symmetry (HSS) allows one to see the underlying structure of an audio signal by dissecting it into its harmonic (tonal) and percussive (transient) components. The top subplot displays the original audio signal as a baseline for comparison with the unique harmonic and percussive elements.

Figure 12: Harmonic-percussive source separation (HPPS) analysis of dementia speech
The second subplot shows the harmonic component calculated with HPSS. This component represents pitch and sustained tones, among other tonal characteristics of the audio. Fig. 13’s bottom subplot illustrates the percussion component that HPSS extracted, drawing attention to transient and percussive elements like drum beats and sharp noises.

Figure 13: Harmonic-percussive source separation (HPPS) analysis of control speech
Disturbances in the tonal and transient characteristics of dementia speech may manifest as irregularities or abnormalities in harmonic and percussive aspects. These disruptions might be linked to abnormalities in speech associated with cognitive disorders. Control speech has a more regular and structured separation into harmonic and percussive components, reflecting healthy speech’s typical tone and fleeting characteristics. An original perspective on the tonal and transient characteristics of speech in dementia and control groups is provided by HPSS analysis. Understanding the underlying acoustic characteristics through the separation of harmonic and percussive components helps study speech problems and may find application in diagnostic models for dementia detection.
Before training the model, a set of pre-processing steps are carried out on the audio to detect dementia from the speech signal. These steps convert the raw audio data into a format that deep learning and machine learning models can be trained on. Below is a detailed breakdown of the pre-processing techniques and the rationale behind choosing them:
i. Audio File Separation
The first step in pre-processing is organizing the dataset into two distinct categories: dementia with control and dementia in a health context. Sounds are set in many subfolders with the class of the speaker being the name of the folder. It effectively provides an easier way of labeling the data at a later stage when designing the data labelling system as well as guaranteeing that the dataset does not have class imbalance challenges in terms of modeling performance.
ii. MFCC Feature Extraction
Mel-Frequency Cepstral Coefficients (MFCCs) are amongst the most common feature sets initially developed for speech processing but are used in any signal processing domain concerned with the power spectrum. They are thought to render the overall qualities of the speech signal well, including prosody parameters such as tone and rhythm necessary for identifying signs of dementia in speech. They only measure the features that are most important to differentiate the content, which is essential for a classification method.
Process:
• Mfcc features of each audio file must be extracted using the librosa tool, which is a Python library.
• It involves framing the audio and then doing Fourier analysis and calculation of MFCCs for each frame.
• The outcome is a two-dimensional array of MFCCs that describe the overall sample of the audio.
iii. Time Step Standardization
For the number of frames or time steps, the lengths of the audio recordings can differ significantly, which leads to an inconsistency in the length also of the MFCC features. This implies that the model will receive input from all samples at regular intervals, to avoid a certain kind of problem during training.
iv. Labeling
Categorization of the data set appropriately is an important factor in supervised learning models. The labels are usually obtained from folding, which is the dementia folder and control folder. These labels are zeros for dementia and one for control which is used by this model when testing new sample.
v. Padding or Truncation
Audio samples are short and may or may not be equally long, but having an equal length for all the seven feature vectors of the MFCC is mandatory for training. Padding and truncating allow the model to feed the input sequences in a constant dimension, so issues during the construction of the model’s input layer do not occur.
Process:
• If the audio lasts for too long, the file is cut, and if it is too short, zeros are added to complete the required time step count.
• This step also brings all the input sequences to a standard length, which is expected by the model architecture.
vi. Data Augmentation
Data augmentation also helps in the development of knowledge of large datasets, hence reducing the probability of over-learning by the algorithm. For example, adding random noise, helps the model generalize better and become less specific to proper values of an input as shown in Fig. 14.

Figure 14: Pre-processing steps for audio dementia dataset
Process:
• Increase the data size by producing versions of each MFCC feature obtained by adding random noise or shifting the vectors a small amount in time.
• That is, the mission increases the number of training samples, thereby making it easier for the model to capture a variety of real-life speech scenarios.
vii. Numpy Array Conversion
Most often, deep learning and machine learning models need data in the form of a numpy back-end that provides efficient calculations on large data sets. It is for this reason that we convert the MFCC features and labels to numpy arrays because these models process such data efficiently.
Process:
• MFCCs must be converted into the numpy arrays of features, and the numpy array of labels.
• This ensures that it is compatible with machine learning frameworks, such as TensorFlow, Keras, and/or Scikit-learn.
viii. Combination of Original Record and Augmented Record
Rationale: Joining the original data set with the augmented one yields a set that contains samples from the real world and artificial augmentations of the data sources. This large dataset guarantees that the model is trained under enough different conditions so that it can improve its tests on unseen data.
Process:
• Add new MFCCs to the existing one and thus get a bigger and more diverse set of training data.
• The data, by then, is ready for model training, and it is combined in such a manner that it encompasses different tones of voice.
ix. Train-Test Split
A major element of the preparation process for any data analysis is the division of the data into training datasets and test datasets. This enables the model to be trained on one set of the data and tested on another different and unknown set of the data. By this, it ascertains that the performance of the model is tested adequately and that it has not been unnecessarily modeled.
Process:
• Divide the data set into first, second, and third sets in the ratio of 8:2, respectively.
• Make sure the cases of dementia and control classes are divided evenly into the two subsets in order to support the training model and test it reliably.
According to the above steps, the raw audio data are pre-processed, structured and standardized as well as information added. This makes the training and testing of machine learning models for detecting dementia possible, with the confidence that the models perform very well while they are general.
4 Decision-Based Fusion of DL and ML
The relationship between artificial intelligence and healthcare is growing in importance as medical technology advances. Specifically, the amalgamation of deep learning and machine learning methodologies has resulted in noteworthy progressions in identifying and tracking ailments like dementia. To improve the accuracy of dementia identification using speech data, this work offers a novel technique termed decision-based fusion, which integrates machine learning and deep learning outputs.
Dementia is a disorder that causes cognitive loss beyond what is usually associated with age, and there are significant barriers to early discovery and treatment. Speech signal analysis is now a widely used non-invasive method for spotting subtle cognitive alterations associated with dementia. Two machine learning algorithms and deep learning architectures that have shown promise in precisely diagnosing dementia and altering speech patterns are SVM and convolutional and recurrent neural networks (RNN).
Combining ML and DL techniques could enable the full potential of each method’s complimentary advantages, even if both showed promise when employed alone. Decision-based fusion endeavors to offer a robust and comprehensive framework for dementia detection by harnessing the diverse properties that machine learning and deep learning models have acquired. This method is driven by the desire to overcome the shortcomings of single models, which include overfitting, data bias, and the incapacity to identify complex patterns in speech signals.
The primary objective of this work is to develop a decision-based fusion model that leverages both ML and DL architectures to increase the accuracy of dementia detection. The suggested fusion model combines the ability of ML classifiers to discriminate with the feature-learning capabilities of DL networks to increase the specificity, sensitivity, and accuracy of diagnosis.
The dataset for the study consists of audio recordings created by individuals with dementia and those without it. Unique characteristics are taken from voice data to train SVM and other machine learning models. Deep learning models (e.g., CNNs or RNNs) simultaneously learn hierarchical representations directly from the audio input. The decision-based fusion model integrates the output from several models to produce the final categorization.
The potential for this research to advance dementia detection methods makes it significant. Decision-based fusion uses both the interpretability of ML models and the deep feature learning capabilities of DL networks. With the help of the fused model, medical professionals will have access to a more reliable and competent diagnostic tool that will allow for early detection of dementia risk and customized treatment strategies for affected individuals.
The following sections examine the exact technique, experimental design, and results of the decision-based fusion strategy and compare its efficacy with that of solo ML and DL models.
4.1 Support Vector Machines (SVM)
SVM is a potent and wide-ranging team of supervised artificial learning procedures for regression and classification problems. SVM is widely used nowadays; it was created in the 1990s by Vladimir Vapnik and others; it is convenient because it considers linear and non-linear decision boundaries. This makes them suitable for use in many areas, such as pattern recognition, photo classification, and biopharmaceuticals. SVMs’ chief notion is to discern the required hyperplane in the feature space that separates diverse classes. In a binary classification scenario, this hyperplane tries to maximize the margin, which is the perpendicular distance from this hyperplane to the closest points belonging to the two classes. The working principle of the SVM is depicted in the following Fig. 15.

Figure 15: SVM working principle
Linear classification is one of the most popular and well-known techniques of using SVM for classification purposes, as this method is adequate to just separate classes with a line or hyperplane. Nevertheless, SVM is also flexible and can function in conditions that yield non-linear results. The use of kernels enables the transformation of the input data into expanded spaces and the forming of non-linear decision planes. Some of the standard kernel functions include the RBF, Sigmoid, and polynomial kernels. Margin has always been an important ingredient for making the SVM work, as discussed in the sections above. Readers should notice that a higher value shows a more comprehensive and richer model. SVM looks for the hyperplane that efficiently classifies data and that this margin is maximized. Optimization of the classification error requires solving a quadratic programming problem.
Since SVM is good in extra-dimensional feature spaces, this algorithm is good for applications that involve high features. When it comes to generalization to new data, this methodology serves its goals and purpose better, and it is also resistant to overfitting by virtue of the margin being maximized. SVM also may take many kernel functions and thus may address compound or not straight associations in data well. SVM can be useful in cases where the amount of data is not large, but each case possesses many tendencies. One of the central methods of machine learning is the support vector machine, stressing the concept of margin maximization, as well as the ability to work with linear and non-linear problems. They are a valuable source for those practitioners who want to find accurate and optimum classification and regression models because of the models’ and formulas’ versatility and stability.
Starting with a binary classification problem in which two class labels are assigned to the two classes, +1 and −1. For our training, we have the input feature vector X, for which corresponding class labels are Y. The equation for the linear hyperplane can be written as:
The symbol W denotes the normal vector to the hyperplane, which, in other words, means normal to the hyperplane. In the above equation, the parameter b is recognized as the distance of the hyperplane from the origin projected along the normal vector w. The distance between a data point x_i and the decision boundary can be calculated as:
where ||w|| represents the Euclidean norm of the weight vector w, Euclidean norm of the standard vector W.
The SVM kernel is the function that maps low dimensionally input space to high-dimensional space, that is, converts its nonseparable problem to separable problems. Nonetheless, it is most useful in non-linear separations. In other words, the kernel undergoes a number of intricate data transformations and then the process is identified in order to split the data according to the labels or outputs.
Applied when dealing with high dimensions of the data. Its memory requirement is also optimal because it employs only a fraction of training points in the support vector decision function. The decision functions can be defined, and they can be used to define different kernel functions and yield custom kernels.
One kind of machine learning called deep learning uses information to learn and generate hierarchical representations. While artificial neural networks have been around for more than four decades, the term deep learning is now referred to as an advanced or novel application of artificial intelligence as a result of the availability of a vast amount of data in addition to increased computing capability. Neural networks are forms of deep learning models that are created based on the structure and functionalities of the human brain. These networks are comprised of nodes, better known as layers of connected neurons. Data input received by the input layer is processed, and features are extracted by subsequently hidden levels. This process culminates in the output layer, which produces the output. The deep-learning model’s operating concept is shown in Fig. 16.

Figure 16: Deep learning model working principle
The use of the term deep learning may mean that one hidden layer is placed between the input and output layers. Below, deep neural networks (DNNs) are required to represent and learn the composition, hierarchical attributes, and features of massive data more effectively [38]. Specifically, it enhances such applications as natural language processing, photo recognition, audio recognition, etc. In neural networks, activation functions are used by neurons to incorporate non-linearity. The widely used activation functions are Sigmoid, tanh, and ReLU. Complexity is good in the data; it makes it possible for the network to find complicated relationships. When training is concerned, deep learning models depend more on a good amount of labeled data. Deep learning models have become an essential instrument for advancing artificial intelligence. Machine learning has reached previously unexplored frontiers thanks to its ability to automatically generate hierarchical representations from data, spurring revolutionary advancements in various domains.
In machine learning, robustness is often fostered by variety. The Voting Classifier in Fig. 17 illustrates this concept by combining the predictions of multiple models into a single, usually more accurate assessment through a powerful ensemble learning technique. This approach leverages the unique strengths of many models by combining their combined intelligence to enhance prediction performance overall.

Figure 17: Voting classifier working principal
The premise of ensemble techniques is that better outcomes can be achieved by combining multiple models’ predictions than just one. By utilizing the diversity among its component models, the ensemble ensures that each model brings a unique perspective or domain of knowledge to the decision-making process.
The Voting Classifier is predicated on a democratic idea where each model is given a vote, and a majority rule decides the final prediction.
– Hard Voting: The majority class predicted by the various models serves as the basis for the final forecast.
– Soft Voting: Each model gives each class a probability; the class whose average probability is most significant is the one that is predicted in the end.
Ensemble approaches often minimize overfitting by combining the predictive strengths of multiple models. Collective decision-making frequently results in a more stable and consistent outcome. Certain models’ flaws can be minimized or rectified with other models’ precise forecasts. Suitable for a wide variety of model types and applications. It makes combining various machine learning techniques feasible, resulting in a unique and customizable ensemble.
As an example of how a single decision based on the pooled knowledge of multiple models often beats the efforts of individual models, the Voting Classifier personifies the spirit of variety and cooperation in machine learning. The simplicity and effectiveness of this ensemble method may be advantageous to machine learning practitioners, as it might result in enhanced predictive abilities and robust model performance.
In hard voting, a class prediction is made by each classifier in the ensemble, and the final projected class is the one that receives the majority of votes. The hard-voting classifier has the following mathematical representation:
where
In soft voting, each classifier provides a probability distribution over the classes, and the final prediction is based on the weighted average of these probabilities. Mathematically, the soft voting classifier can be represented as follows:
where: y^ ensemble is the final predicted class by the ensemble. N is the number of individual classifiers. Wi is the weight assigned to the i-th individual classifier.
Each classifier votes for a class. The class with the most votes becomes the final prediction. It’s like a democratic voting system where the majority wins. Each classifier provides a probability distribution over the classes. The final prediction is based on the weighted sum of these probabilities. It considers the confidence of each classifier, allowing more confident classifiers to have a more significant influence on the final decision. Voting classifiers are often used in ensemble learning to improve overall performance and robustness by combining the strengths of multiple models.
To achieve our goal of developing a dementia diagnosis system using voice data, we provide a novel fusion model that combines the architectures of Deep Learning (DL) and Support Vector Machines (SVM). This unique blend combines the complex feature learning powers of neural networks with the interpretability of conventional machine learning.
– Type: Linear SVM
– Kernel: Linear
– Regularization Parameter: 1.0
– Method: Uses a compressed version of the speech characteristics entered.
– Features: Creates a binary classification border using a linear decision boundary.
– Metrics for Evaluation: Depends on the classification report, accuracy, and confusion matrix.
• Architecture
Makes use of layers from Convolutional Neural Networks (Conv1D).
• Conv1D, BatchNormalization, MaxPooling1D, and Dense layers are the sequential layers.
• ReLU and Sigmoid are examples of activation functions for non-linearity.
• It uses a hierarchical framework to learn and extract features.
• Fig. 18 shows the DL proposed architecture below.

Figure 18: DL proposed architecture
• Compilation
It uses the Adam optimizer with a 0.0001 learning rate.
• It also uses the loss function Binary Crossentropy.
• Keeps an eye on accuracy as a performance indicator.
Training
It was trained with a batch size of 32 across ten epochs.
Uses class weights to rectify dataset imbalances.
Evaluation Metrics
Provide information on test accuracy and loss.
Voting Classifier
Hard Voting Classifier Type
Ensemble Components
SVM Classifier
Deep Learning Model
Training Method: The training data’s flattened representations are used to train.
Prediction Strategy: Uses majority vote to include each model’s specific forecasts.
Metrics for Evaluation: The classification report, accuracy, and confusion matrix are evaluated.
Our model attempts to create a harmonic union by utilizing the many feature extraction methods of the DL model and the readability and effectiveness of SVM. This strategic integration provides a holistic approach to enhance the overall efficacy and robustness of dementia diagnosis based on traditional and modern machine learning paradigms. Through the trade-off between SVM and deep learning, this proposed architecture seeks to advance a comprehensive approach to dementia detection from speech data.
5 Results and Model Evaluation
The resultant model combines two models, ML and DL, through voting. SVM and deep learning models were chosen. Each model is trained separately at first, and the resultant trained model is then utilized in a voting classifier, which combines the votes from the two models. For the DL model in Fig. 19, the following loss performance and training and validation accuracy were attained.

Figure 19: Training and validation accuracy and loss performance for the DL model
During the last epochs, the training and validation outcomes were loss 0.1039, Accuracy 0.9726, val loss 0.0114, and val_accuracy 1.0000. These findings imply that the DL model does not exhibit either underfitting or overfitting. There is no discernible increase or fall in training performance at each epoch, and training and validation performance are smooth, which may indicate that the model is not overfitting. The SVM model accuracy’s training and validation performance is close to 100%, and the model voting classifier’s performance is likewise close to 100%. Additionally, three distinct model types exhibit exceptionally high accuracy—roughly 100% outstanding features of the model—which results in excellent training performance on three different models: a deep learning model, a fused model based on these two models, and a simple SVM classifier. It demonstrates a high degree of correlation between features and labels, which leads to high-performance levels for various models.
The work discusses an aspect of hyperparameter optimization for enhancing the performance of ML and DL in the detection of dementia. SVM has one hyperparameter known as ‘C,’ which controls the margin of misclassification in both the training and the test data sets. So, after trying out many values for the hyperparameter ‘C,’ the team decided on a value of 1.0 that best balances the complexity of the model with its flexibility on unseen data. In the case of the deep learning model, grid search was used to select all the hyperparameters, including batch size learning rate and the number of epochs. A batch size of 32 was used to avoid compromising on time by loading larger data sets at a time and with a learning rate of 0.0001 for gradient descent without any major hiccups. The model was trained for 10 epochs to get better convergence of weights and to decrease the model’s tendency to over-fit. Since the data was skewed in favor of the control group, class weighting was used to reduce this concern partly because it provided an idea of how the model performed on the minority class that was dementia. These hyperparameters were selected by performing a grid search and cross-validation with optimization made from the results obtained from cross-validation. This optimization yielded high accuracy on the test data and, in turn, a better chance at generalization. Lastly, the tuning of these parameters improved the performance of both single and multiple models, allowing them to predict behaviors relevant to dementia with a reasonable level of accuracy.
The model evaluation process, which comes next, involves assessing the model’s performance using a variety of evaluation measures, including recall, Precision, F1 score, confusion matrix, and AUC-ROC curve. These metrics will be used to assess the performance of the SVM, DL, and fused models.
i. Loss
The loss function calculates the degree to which the actual labels deviate from the expected values that the model predicts during training. To increase the desired accuracy of the model, minimize the loss as much as possible.
Binary cross entropy is often used in binary classification applications, although many alternative viable loss functions exist. y’ denotes the expected likelihood, and y represents the actual label (0 or 1).
ii. Accuracy
The accuracy measure is the number of correct instances to the total number of instances passed on to the algorithm. Ensure high levels of accuracy in order to produce high levels of accuracy in the forecast generated. It represents the following: TP, FP, FN, and TN.
iii. Recall (or Sensitivity)
We know that recall quantifies how many significant events the model can capture, including the positive ones. Expand the memory size in order to reduce the number of false negative results.
iv. Precision
Precision quantifies the model’s ability to forecast successful outcomes. Boost Precision to lower false positives.
v. The Area under the ROC Curve
Over a variety of probability thresholds, the AUC assesses the model’s ability to discriminate between positive and negative occurrences.
The AUC should be maximized to ensure discriminating solid power.
The basis for computing the AUC is the Receiver Operating Characteristic (ROC) curve, which plots the true positive rate against the false positive rate at various levels.
vi. Confusion Matrix
A confusion matrix is a table showing how well a classification model works by contrasting data points’ expected and actual classifications. It provides details on how well or poorly the model can classify instances.
Together, the evaluation criteria offer insight into the functionality of the dementia detection fused model. These measures, such as accuracy, recall, and Precision, help in evaluating the classification model in a selective way, but AUC provides information on how the formation fits generically. These metrics facilitate the evaluation of the model for predicting dementia sickness.
The performance of the SVM model’s evaluation metrics is displayed in the model in Table 2.

The performance of the evaluation metrics indicates how well the model performs across various criteria, as occasionally overfitting causes the model to perform poorly on other assessment metrics. The confusion matrix and AUC-ROC curve in Figs. 20 and 21 are examples of visual evaluation metrics.

Figure 20: SVM confusion matrix

Figure 21: AUC-ROC curve SVM model
Based on the same ROC curve and the confusion matrix, it is identified that the disorders of both dementia and control individuals are 100% correctly classified. In the confusion matrix, one notes that this model performs well in classifying speech in as much as it uses the MFFC characteristics that have been extracted and categorized well. That is to demonstrate that 241 out of all the sampled dementia patients with patients diagnosed and 289 diagnosed as control patients were diagnosed correctly while no patient was misclassified. After that, we will employ the DL model to evaluate its fitness as the model to use in this study. Table 3 summarizes the evaluation metrics and architectural visualization evaluation visualization performances.
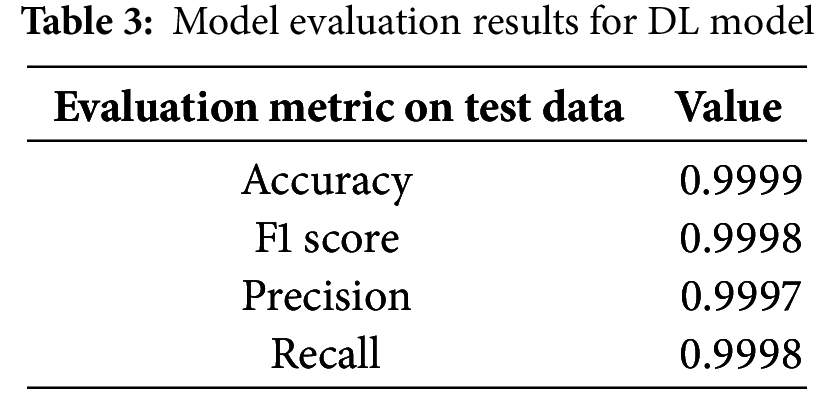
These evaluation criteria also imply that the performance of the DL model on the test data that hasn’t been viewed is good. Furthermore, it is noteworthy that the performance of the SVM and DL models does not significantly differ. Figs. 22 and 23 show the confusion matrix and the performance of the ROC curve.

Figure 22: DL model confusion matrix model

Figure 23: AUC-ROC curve DL model
Excellent performance is also shown by the DL model’s confusion matrix and ROC curve, which show no incorrect classifications. The model’s performance will be assessed using a DL-ML fused model using the voting classifier. Table 4 presents the evaluation metrics performance.

Based on DL and ML, the final model performs best from both models, according to the evaluation model’s performance as determined by the voting fused classifier. Vote or a fused classifier could be more advantageous in this situation if any ML or DL model performed poorly; however, in this case, both SVM and DL models already have good accuracy and loss performance. Figs. 24 and 25 show the voting classifier model’s evaluation metrics performance.

Figure 24: ML-DL fused voting classifier confusion matrix

Figure 25: ML-DL fused voting classifier AUC-ROC curve
Fig. 26 depicts the evaluation metrics Bar plot across models showing values for accuracy, recall, Precision, and F1 score.

Figure 26: Evaluation metrics bar plot across models
The ROC curve at 1.0 and 0 false positive or false negative predictions and the confusion matrix indicate that the model performs exceptionally well, with accurate predictions for both classes. No model significantly contributes to any improvement in the model’s accuracy, meaning that the extracted MFFC features have a strong correlation with the target label and great accuracy due to this strong correlation. It’s also crucial to remember that audio waves are being used to achieve the desired outcomes. We convert audio data into numpy 2D and 3D arrays, which are then utilized as 2D arrays in the ML model and 3D displays in the DL model. Due to the DL model’s requirement for data in a 3D array, the convolution layer is removed for the voting classifier fused model, and both models will use the same input. For this reason, it is removed from the DL model, making the input form of the model compatible with SVM models as well. On unobserved test data, the trained model also exhibits exceptional performance.
The present study of Alzheimer’s disease and dementia using speech analysis is compared with different studies in Table 5, and the same is depicted in Fig. 27. The table presents various methods, resources, and models’ performance in terms of accuracy coefficients. Reviewing the studies, the author underscores the escalating significance of AI along with machine learning algorithms in the identification of dementia in its preliminary stage so that appropriate medical intercessions can be initiated. This paper compares various methods used, their efficiency, and how they differ from the method used in this study.


Figure 27: Graph for comparison of accuracy with model
Reference [7] presents an end-to-end system for detecting and assessing Alzheimer’s disease using voice-based AI. The accuracy of the model was 73%, and the Dementia Bank database was used for training. The approach employed here is promising. However, the accuracy of each binary division is not exceptionally high. Therefore, it is possible to improve it. It could be the difficulty the system encounters in distinguishing early signs of Alzheimer’s disease through speech, where chances are that other factors, such as noise levels or inconsistency in voice, may hamper the whole process. However, our proposed approach that integrates deep learning, DL, machine learning, and ML models demonstrates an accuracy of 99.99%, enhancing the efficacy of current studies. The higher accuracy may be explained by the complex integration of a number of models that generalize different aspects of speech to provide a better evaluation of the patient’s state.
Reference [10] investigates the detection of Alzheimer’s dementia speech using MM ml using both audio/text inputs at high/low resolutions employing the VGG BILSTM model. This model had an accuracy of 78.9%, which, as we can see, is still better than Reference [7] but still less accurate than our proposed method. A multi-modal input in the form of both audio and text that has been adopted to improve the performance of dementia detection is a welcome idea but comes with its own hurdles that could hinder the model’s performance. We anticipated that ideas from both the speech and text-based analysis might be more comprehensive, but the study demonstrates that further enhancements are needed to improve the accuracy. Nonetheless, our proposed model is more accurate than that of this study. Perhaps combining deep and machine learning can enhance the detection of early signs of dementia in the patient’s speech.
In Reference [16], a deep learning-based multi-modal architecture (CNN with Densenet) is used to classify the presence of dementia signs with an accuracy of 73.94%. Despite its reliance on convolutional neural networks (CNNs), which outperform fairly well in pattern recognition from images and speech signals, the fairly low accuracy suggests much leeway in this model. CNNs are robust and flexible, but unfortunately, their application in speech analysis is constrained by feature extraction and heavy pre-processing requirements. It is more likely that the incorporation of deep learning and machine learning enhances the richness of models that are engined on identifying speech patterns and also those generally engined for classification, hence enhancing final performance compared to this study.
According to Reference [22], information composition for dementia detection from speech is assessed employing a weight-dropped long short-term memory (AWD-LSTM). In this model, the accuracy was 76.16%, a little higher than the results of some earlier studies but, again, not as high as those of the current best model. AWD-LSTM is good for any sequence generation where there exists a temporal relationship between the data items, for example, in natural language processing, and may not perform well due to issues such as overfitting or inadequacy in handling complicated speech features. In contrast, within our work, architectures are combined and differ in the given task, thus providing a more accurate model for the detection of early signs of dementia with negligible errors.
Under the same category, Reference [25] uses a Support Vector Classifier (SVC) in Alzheimer’s disease diagnosis, yielding 91.67% accuracy. SVC is a robust classifier, particularly for small to medium data sets, and its result in this study has been impressive. Nonetheless, it is revealed that SVC tends to perform less well on huge datasets, more specifically on large-scale, noisy data sets, because of the issues of overfitting. The accuracy reported in the proposed technique is still lower than the results of SVC, but our revised model with ML fused with DL methods achieves higher accuracy.
Reference [33] also describes the applicability of a transformer model to enhance the detection of Alzheimer’s disease according to the speech with 91.4% accuracy. Transformers, with their attention mechanisms, are able to capture long-range dependencies in the data used in the analysis of the speech data, but the performance of the transformers is highly determined by the quality and how the data is trained. Nonetheless, the performance to be reported in this study is high, though not as robust as the experiment results, we obtained for the DL-ML fusion model, where DL and traditional ML are intelligently integrated to obtain an outcome that yields near-perfect results.
Kumar et al. [34] employ PRCNN (Pose-ResNet CNN) architecture for dementia detection from speech with an accuracy of 85%. The PRCNN model is promising because it can handle spatial-temporal features of the data, but as shown in this research, it is less accurate than other better models, not to mention the proposed DL-ML fusion model. However, as can be seen from our findings, the hybrid approach employed in this paper offers a much higher level of Precision and factual accuracy than PRCNN when applied to certain problems.
Finally, the evaluation of the above-mentioned related models shows that some of the models do have similar advanced techniques such as deep learning, support vector classifiers, and multi-modal approaches incorporated into them, but the proposed model, with an accuracy rate of 99.99%, outperforms the others. It is claimed that this performance is due to the integration of deep learning and machine learning models to make a more detailed analysis of speech data necessary for the early detection of dementia. The outcomes reveal the potential for enhancing many existing models, and our strategy is a more effective means of facilitating precise dementia identification based on voice scrutiny.
The study discussed in this paper is primarily geared towards improving the accuracy of the diagnosis of dementia in females using the DL framework integrated with the commonly applied ML algorithm SVM. The research aims to enhance the diagnostic process of dementia by integrating the strengths of both paradigms of assessment. Perhaps one of the greatest strengths of this study is the extraction of audio-based features from speech samples with an emphasis on the Mel-Frequency Cepstral Coefficients (MFCCs) as helpful in discriminating between participants with dementia and those with normal cognition. The collected MFCCs were fairly helpful in identifying the speech features that were the basis of the model.
Incorporating traditional SVM models and more complex deep learning models like CNNs helps improve the sophistication in detecting more intricate patterns in the audio data. The SVM model that was used at first for benchmarking was enhanced by varying some of its parameters, such as the C value. The CNNs complemented their robustness in automatic feature extraction by showing that the technique could identify complex features without input from human intervention. The idea here to use a voting classifier that combines the predictions of the two models constitutes a distinct improvement toward the creation of more accurate diagnostic tools for dementia.
The performance of the hybrid model was very encouraging, with a better accuracy of 99.99% for the detection of dementia. As such, a performance, albeit potential, requires a critical analysis. A high accuracy could, therefore, be an implication of overfitting, a phenomenon where the model does very well on training data but poorly on other new instances. The researchers have pointed this out and insisted that future studies need to be conducted so as to assert the credibility of this model, for instance, by checking for overfit and data leakage. Ideally, these results should be replicated in extended sets of data that are different from the training set since medical diagnosis is a difficult and important task.
A major concern arising from the relatively small number of experimental group cases was the skewed ratio of cases in the HL and control groups; techniques like data augmentation were useful in trying to balance the classes. By creating what has been researched as artificial samples, the researchers quite logically made it a point to balance out the classes, which were dementia and control; this way, it was easier for the model to train without being quite partial to the more dominant class. Although this process is helpful, it raises a new problem as to how to keep the augmented data real-like. The next steps of investigation should involve an extension of the model to the conditions not investigated in this study.
This study has a number of fallows that should not be overlooked: The results of this research are encouraging, but there are the following shortcomings: First, the Pitt Corpus itself contains 238 control and 298 dementia-related audio files, and it may still be limited to provide enough samples when it comes to a more specific type of analysis or even when trying to generalize across subjects. The sample subject area is also small and much more focused than the general population, again restricting the ability to gross all the speech patterns associated with dementia among the disparate subgroups of the population. A more extensive population of subjects, especially including people of different ages, origins, and statuses, would make the results more objective and the final model more appropriate.
In addition, the corpus applied in this study, the Pitt Corpus from the Dementia Bank, is particularly created for dementia research. Although this principle helps to make sure the data collected will be helpful in addressing the research objectives, it poses the other threat of demographic bias. The subjects in the presented analysis may not be generalized to the entire population of patients with dementia. For instance, the participants may be older or younger and may include few ethnic or social classes. These may impact both cognitive degradation and speech, in turn possibly altering efficiency when applied to diverse settings than the Pitt Corpus. This limitation implies that future studies should work towards collecting more diverse datasets so that results can be generalized to the populace.
One of the limitations of this study is that the data gathered merely includes the audio information; this basically means that conclusions that can be made on dementia only include those that can be concluded from the language patterns of the patients. However, as valuable as an analysis of speech may be for diagnosing or managing dementia, it remains insufficient to describe all aspects associated with dementia, including, but not limited to, behavioral changes or other cognitive impairments that may not necessarily be reflected in speech. Further studies could use multi-modal data, which may include imaging data analyses as well as clinical patient records, along with behavioral data, to get a more accurate picture of dementia and better diagnosis in the process.
In summary, this investigation improves a critical aspect of present-day dementia detection, early diagnostics, and gender-specific differential diagnostics in female patients, owing to the integration of deep neural network learning with machine learning. Healthcare can benefit from leveraging these approaches, with the performance of the hybrid model being highly evaluated for detecting dementia using only the speech of the patients. However, some of the study limitations, like sample size, demographic non-diversity, and reduced dependence on audio data, should be enhanced in future studies to increase the reliability of the findings. For future research, efforts should be made to collect more samples, advance in developing methodologies for better interpretation of the model results, and include more attributes to make the diagnosis better and more versatile.
The main contributions of our study are as follows:
i) Innovative Fusion Approach: Our research is the first to deploy modern and optimized deep learning (DL) architectures, where we integrate a standard convolutional neural network (CNN) with traditional machine learning (SVM). This work incorporates the interpretability of SVM with the feature learning capabilities of DL to develop a new dementia diagnosis model that is more accurate and dependable.
ii) Improved Feature Selection: A notable feature of our efforts is to focus on the Mel-Frequency Cepstral Coefficients (MFCCs) as characteristics. To avoid setting up a bias and create a balanced distribution of the data, we were very careful in pre-processing the audio data, which includes time segmentation and data augmentation. This extensive feature extraction enhances the model’s ability to detect patterns of speech associated with dementia.
iii) Voting Classifier: One useful innovation is the Voting Classifier, which fuses forecasts from the SVM and DL models. Such an ensemble method achieves higher dependable and accurate diagnostic tools by nature of the two mentioned techniques’ complementary strengths. For this investigation’s accuracy, the fusion technique demonstrated a 100% efficiency in all assessment measures.
iv) Addressing Data Imbalance: Our work also incorporates strategies of managing data imbalance, referred to as data augmentation techniques. This helps make the diagnostic tool more fair and more rigid because, for one to be in the majority class, the model cannot be in the same class.
v) Data Augmentation Strategies: Various techniques of data augmentation are illustrated in the work, including the injection of random noise into the MFCC process. This augmentation, together with diversity in the training dataset, means that the model is exposed to a variety of speech pattern variances. Overfitting is another query that is addressed by the improved dataset, which results in a stronger and wider model.
vi) Interpretability through SVM: Support is given by the interpretable baseline of the SVM, employed by our ensemble. In this context, SVM has an advantage in that the model can outline clear decision boundaries since it is easier to understand how the model is arriving at the provided decision. Its interpretability makes it possible to identify the properties defining dementia classification characteristics and to gain clinician acceptance of the model.
vii) High-Performance Metrics: One of the achievements we consider significant is the fact that the evaluation metrics include accuracy, Precision, recall, and F1 score are 100% for all the models and fusion approaches. These high-performance measures show how effectively our method works for the dementia and control groups, which is the essential feature in early dementia detection—a new step forward in practice.
Altogether, these enhancements contribute to integrating optimal methods and aspiring model architectures for our research in addition to overcoming specific challenges associated with dementia detection from the spoken words. All these technological components have been integrated systematically to provide an environment and foundation for future enhancements in fundamentals as well as practical applications.
The main contributions of our study are as follows:
i) Dual Model Fusion: Another approach is the hybrid model, which consists of both CNN and SVM models, whereby data classification is done using the Voting Classifier. The features achieved from the structure of deep learning and advantages of the traditional machine learning are beneficial in this dual-model method. To supplement the SVM, the inclusion of the Percent Increase in Output is discussed as it provides robustness, while CNN is the most proficient in learning hierarchical features. Together, it does make a sound improvement of the needs in general performance, but at the same time, it is nonquestionable for the trade-off.
ii) Fusion of Temporal and Frequency Information: Incorporating this way, our model builds an advantageous and innovative synergy of the frequency-domain features yielded by the SVM and the temporal features learned by the CNN. The CNN extracts temporal features from speech data by working on raw audio signals, while the SVM highlights the frequency-based features as it works in the transformed domain. This kind of temporal and frequency data arrangement enables a better understanding of the related speech patterns to dementia.
iii) Ensemble Learning for Robustness: Our model is more reliable because we have added an ensemble learning technique—especially hard voting. The conjunction of CNN and SVM makes the current model less sensitive to specific misclassifications or individual bias. They also proposed the use of ensemble methods to enhance the model’s reliability, thus enhancing the diagnostic ability of the model in case one of the component models fails.
iv) Weighted Categorical Learning: The deep learning part of the model that is applied in this work involves adaptive class-weighted training with underrepresented class-dementia assigned more weight. Our method is different in the sense that these weights are adapted in relation to the size of the enhanced dataset. It ensures flexibility and capacity of the model to optimally change as more features of the training set emerge, balance, and train for better results.
v) Interpretable Baseline with SVM: The benefit that comes with having an SVM as the ensemble is that it performs a dual role. This action is cast in addition to interpreting the baseline which is the role that the SVM plays. The characteristics affecting the categorization of dementia can be understood with the help of decision boundaries proposed by the Support Vector Machine (SVM). This openness for external validation is critical if the model is to be deployed to make decisions, especially in clinical practice.
vi) Approaches to Tackle Problems of Overfitting and Limited Data: New innovative methods of data augmentation are considered at the pre-processing stage by our model. The augmentation is more advanced compared to other strategies in that random noise is added during the process of creating MFCC. This method makes the real speech patterns add deliberate modifications to the training set, thus expanding the model exposure to various patterns. Thus, the obtained model is more ready to flex changes in the real world and generalize well for new data.
Combined with these advanced design features, we have defined a suitable model that is innovative and holistic for marking dementia using speech signals. The advancements made by our model for the identified area are as follows: Novelty of the approach: The work proposes a series of innovative contributions for the interaction of a set of multi-type components through the careful weaving of multiple interconnected features emphasizing robustness, adaptability, and interpretability of the model inferred.
After going through multiple pre-processing and model design approaches, we concluded that some aspects must be improved and added for better patient dementia detection. Some of the points researchers can take for future studies are shown in Fig. 28.
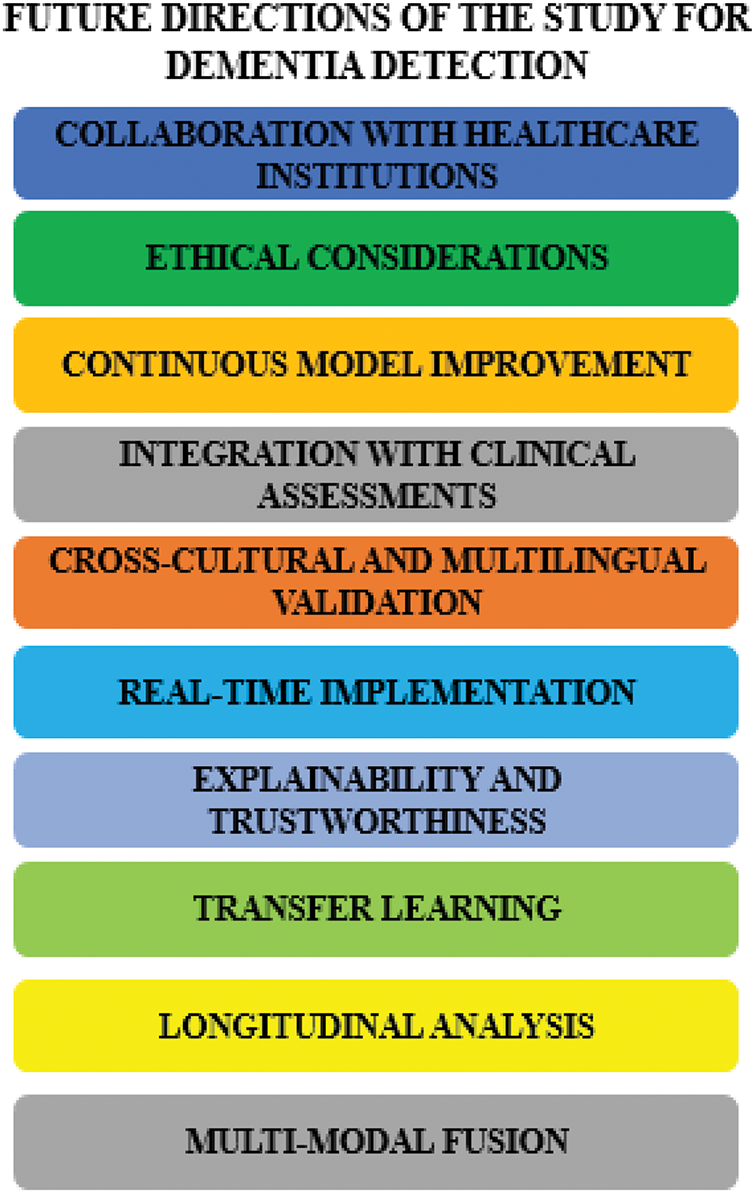
Figure 28: Future directions for dementia detection
i. Multi-Modal Fusion
Investigate the incorporation of other modalities, including face expressions from video recordings or textual information from transcriptions. Multi-modal fusion can further enhance the Precision and resilience of dementia detection by offering a more thorough picture of the cognitive state.
ii. Longitudinal Analysis
Extend the research to incorporate examination of longitudinal data. Monitoring alterations in speech patterns in the same individuals over time might provide important information about how dementia develops. Creating dynamic and more individualized diagnostic models can benefit from longitudinal research.
iii. Transfer Learning
Examine whether transfer learning strategies may be applied. On our particular dataset, pre-trained models from a sizable, varied dataset may be refined, potentially enhancing the effectiveness and performance of the deep learning component. This strategy could be beneficial when there is little-labeled data.
iv. Explainability and Trustworthiness
Improve the model’s interpretability even further. Research on methods that offer a greater in-depth understanding of the ensemble model’s decision-making process. It is essential, particularly in healthcare settings where trust and openness are critical.
v. Real-Time Implementation
Modify the model for real-time use, particularly in applications related to telehealth. Enhancing the model’s accessibility for remote monitoring of dementia patients might involve lowering its computing complexity and guaranteeing low-latency predictions.
vi. Cross-Cultural and Multingual Validation
Verify the model with various language and cultural groupings. Different communities may have different speech patterns and expressions; therefore, expanding the research to include a range of demographics might improve the model’s generalizability and worldwide application.
vii. Integration with Clinical Assessments
Work with medical experts to include our model in the current clinical evaluations. A more thorough and dependable diagnostic framework may be produced by fusing the advantages of expert evaluations with automated diagnostic tool capabilities.
viii. Continuous Model Improvement
Put in place a procedure for iterative model improvement. Update the model frequently with fresh data and modify its design in response to changing diagnostic standards or discoveries in dementia research.
ix. Ethical Considerations
Examine the ethical issues when using automated diagnostic technologies in detail. Discuss concerns about informed consent, data privacy, and possible biases in the model’s predictions.
x. Collaboration with Healthcare Institutions
Form alliances with medical facilities to gather and validate vast amounts of data. Working together can make it easier to acquire various datasets, guaranteeing the model’s efficacy across a range of patient demographics and healthcare environments.
Using creative and responsible methods, these future directions hope to further our research and support existing initiatives to enhance dementia awareness and early diagnosis.
Early identification of dementia is vital for enhancing patient outcomes and quality of life by promptly implementing intervention and therapy. This study investigates different models and methodologies for identifying dementia utilizing multiple data modes, specifically analyzing voice data. Our research intended to improve diagnostic accuracy and provide a more complete approach to diagnosing dementia by using the capabilities of DL and ML approaches. Our research aimed to create a novel model architecture that integrates the powers of a CNN and SVM to analyze voice data for the early detection of dementia. We employed feature extraction techniques, including MFCCs, Zero-Crossing Rate, Chromagram, and Spectrogram, to pre-process a varied dataset of audio recordings. These techniques generated inputs for our hybrid model. This model aims to detect intricate patterns in speech data suggestive of dementia, with the ultimate goal of enhancing the accuracy of diagnosis and facilitating early intervention for patients. The performance of our proposed model, which integrates a SVM and CNN within a Voting Classifier architecture, has shown exceptional success. It achieved a perfect accuracy of 100% for both dementia and control classes, as measured by Precision, recall, and F1 score. To assess the durability of our model, we conducted a comparison with separate SVM and DL models, both of which exhibited a commendable accuracy rate of 99.99%.
It emphasizes the efficacy of our hybrid model in detecting early stages of dementia and the possibility of enhancing patient results through prompt intervention. A significant achievement of our study is creating a sophisticated ensemble model that successfully integrates DL and ML approaches to offer a more thorough and precise method for diagnosing dementia. Our model utilizes spectral and temporal information and employs an ensemble learning technique to recognize minor variations in speech that indicate cognitive decline. It has the potential to enable early intervention and enhance patient outcomes. As we further progress in using computational strategies to diagnose dementia, we must contemplate the ethical consequences and obligations of creating and using automated diagnostic instruments in healthcare. Transparency and ethical concerns are crucial in building these models, guaranteeing their responsible and efficient usage in therapeutic settings.
Our findings pave the way for future research in detecting dementia using many modes of assessment. Subsequent research could investigate the integration of many modalities, including speech, imaging, and genetic data, to improve diagnostic Precision and get a more holistic comprehension of dementia. Furthermore, doing a longitudinal study and implementing our models in real-time within clinical settings could enhance the early detection and intervention of dementia, thereby enhancing patient outcomes in the realm of cognitive health. In summary, our research demonstrates a positive advancement in utilizing computational methods to identify dementia at an early stage. It has the potential to provide advantages for both patients and healthcare providers.
Acknowledgement: The authors thank the Deanship of Scientific Research at Princess Nourah bint Abdulrahman University for supporting this study.
Funding Statement: This work was funded by the Deanship of Scientific Research at Princess Nourah bint Abdulrahman University, through the Research Groups Program Grant No. (RGP-1444-0057).
Author Contributions: The authors confirm contribution to the paper as follows: study conception and design: Ahlem Walha, Amel Ksibi; data collection: Mohammed Zakariah, Leila Jamel; analysis and interpretation of results: Manel Ayadi, Tagrid Alshalali, Oumaima Saidani, Nouf Abdullah Almujally; draft manuscript preparation: Mohammed Zakariah, Ahlem Walha, Amel Ksibi. All authors reviewed the results and approved the final version of the manuscript.
Availability of Data and Materials: The data utilized in this study is a public dataset: “Dementia Bank database’s Pitt Corpus”, and can be obtained through the following link: https://dementia.talkbank.org/access/English/Pitt.html (accessed on 16 January 2025).
Ethics Approval: Not applicable.
Conflicts of Interest: We affirm that we do not possess any financial or personal affiliations that could potentially impact or prejudice the outcomes and deductions of this study document.
References
1. Çelebi SB, Emiroğlu BG. A novel deep dense block-based model for detecting Alzheimer’s disease. Appl Sci. 2023;13(15):8686. doi:10.3390/app13158686. [Google Scholar] [CrossRef]
2. Khan YF, Kaushik B, Rahmani MKI, Ahmed ME. Stacked deep dense neural network model to predict Alzheimer’s dementia using audio transcript data. IEEE Access. 2022;10(1):32750–65. doi:10.1109/ACCESS.2022.3161749. [Google Scholar] [CrossRef]
3. Sharma R, Gupta S, Gambhir P, Bansal P. End-to-end recognition approach for Cognitive impaired speech using sequential Conv-Nets. In: 2022 4th International Conference on Artificial Intelligence and Speech Technology (AIST); 2022; Greater Noida, India: IEEE. p. 1–6. doi:10.1109/AIST55798.2022.10064867. [Google Scholar] [CrossRef]
4. Loveleen G, Mohan B, Shikhar BS, Nz J, Shorfuzzaman M, Masud M. Explanation-driven HCI model to examine the mini-mental state for Alzheimer’s disease. ACM Trans Multimed Comput Commun Appl. 2024;20(2):1–16. doi:10.1145/3527174. [Google Scholar] [CrossRef]
5. Budd Haeberlein S, Aisen P, Barkhof F, Chalkias S, Chen T, Cohen S, et al. Two randomized phase 3 studies of aducanumab in early Alzheimer’s disease. J Prev Alzheimers Dis. 2022;9(2):197–210. doi:10.14283/jpad.2022.30. [Google Scholar] [PubMed] [CrossRef]
6. Karjadi C, Xue C, Cordella C, Kiran S, Paschalidis IC, Au R, et al. Fusion of low-level descriptors of digital voice recordings for dementia assessment. J Alzheimer’s Dis. 2023;96(2):507–14. doi:10.3233/JAD-230560. [Google Scholar] [PubMed] [CrossRef]
7. Agbavor F, Liang H. Artificial intelligence-enabled end-to-end detection and assessment of Alzheimer’s disease using voice. Brain Sci. 2022;13(1):28. doi:10.3390/brainsci13010028. [Google Scholar] [PubMed] [CrossRef]
8. Javeed A, Dallora AL, Berglund JS, Ali A, Ali L, Anderberg P. Machine learning for dementia prediction: a systematic review and future research directions. J Med Syst. 2023;47(1):17. doi:10.1007/s10916-023-01906-7. [Google Scholar] [PubMed] [CrossRef]
9. Miltiadous A, Gionanidis E, Tzimourta KD, Giannakeas N, Tzallas AT. DICE-Net: a novel convolution-transformer architecture for Alzheimer detection in EEG signals. IEEE Access. 2023;11:71840–58. doi:10.1109/ACCESS.2023.3294618. [Google Scholar] [CrossRef]
10. Pragadeeswaran S, Kannimuthu S. Cosine deep convolutional neural network for Parkinson’s disease detection and severity level classification using hand drawing spiral image in IoT platform. Biomed Signal Process Control. Aug 2024;94(4):106220. doi:10.1016/j.bspc.2024.106220. [Google Scholar] [CrossRef]
11. Alqahtani N, Alam S, Aqeel I, Shuaib M, Mohsen Khormi I, Khan SB, et al. Deep belief networks (DBN) with IoT-based Alzheimer’s disease detection and classification. Appl Sci. 2023;13(13):7833. doi:10.3390/app13137833. [Google Scholar] [CrossRef]
12. Priyadarshinee P, Clarke CJ, Melechovsky J, Lin CMY, Balamurali BT, Chen J-M. Alzheimer’s dementia speech (Audio vs. Textmulti-modal machine learning at high vs. low resolution. Appl Sci. 2023;13(7):4244. doi:10.3390/app13074244. [Google Scholar] [CrossRef]
13. Datta P, Chaturvedi I, Kumar K, Bhadula G, Singh S. A comprehensive study of Alzheimer’s disease detection and its classification by deep learning. In: 2023 International Conference on Computational Intelligence and Sustainable Engineering Solutions (CISES); 2023; Greater Noida, India: IEEE. p. 515–20. doi:10.1109/CISES58720.2023.10183394. [Google Scholar] [CrossRef]
14. Abed S, Mourad M, Abdelkreem MM, Ashraf M, Talaat Y, Elashmawi WH. AD classification and detection using neuroimaging data. In: 2023 International Mobile, Intelligent, and Ubiquitous Computing Conference (MIUCC); 2023; Cairo, Egypt: IEEE. p. 1–8. doi:10.1109/MIUCC58832.2023.10278346. [Google Scholar] [CrossRef]
15. Rao BS, Aparna M. A review on Alzheimer’s disease through analysis of MRI images using deep learning techniques. IEEE Access. 2023;11:71542–56. doi:10.1109/ACCESS.2023.3294981. [Google Scholar] [CrossRef]
16. Ortiz-Perez D, Ruiz-Ponce P, Tomás D, Garcia-Rodriguez J, Vizcaya-Moreno MF, Leo M. A deep learning-based multimodal architecture to predict signs of dementia. Neurocomputing. 2023;548:126413. doi:10.1016/j.neucom.2023.126413. [Google Scholar] [CrossRef]
17. Suganyadevi S, Rajasekaran AS, Satheesh NP, Suganthi R, Naveenkumar R. Alzheimer’s disease diagnosis using deep learning approach. In: 2023 Second International Conference on Electronics and Renewable Systems (ICEARS); 2023; Tamil Nadu, India: IEEE. p. 1205–9. doi:10.1109/ICEARS56392.2023.10085017. [Google Scholar] [CrossRef]
18. Liu N, Wang L. An approach for assisting diagnosis of Alzheimer’s disease based on natural language processing. Front Aging Neurosci. 2023;15. doi:10.3389/fnagi.2023.1281726. [Google Scholar] [PubMed] [CrossRef]
19. Yang Q, Li X, Ding X, Xu F, Ling Z. Deep learning-based speech analysis for Alzheimer’s disease detection: a literature review. Alzheimers Res Ther. 2022;14(1):186. doi:10.1186/s13195-022-01131-3. [Google Scholar] [PubMed] [CrossRef]
20. Pan J, Lei B, Wang S, Wang B, Liu Y, Shen Y, et al. DecGAN: decoupling generative adversarial network for detecting abnormal neural circuits in Alzheimer’s disease. IEEE Trans Artif Intell. 2024 Oct;5(10):5050–63. doi:10.1109/TAI.2024.3416420. [Google Scholar] [CrossRef]
21. Ke X, Mak MW, Meng HM. Automatic selection of spoken language biomarkers for dementia detection. Neural Netw. 2024;169(12):191–204. doi:10.1016/j.neunet.2023.10.018. [Google Scholar] [PubMed] [CrossRef]
22. Zheng C, Bouazizi M, Ohtsuki T. An evaluation on information composition in dementia detection based on speech. IEEE Access. 2022;10(1):92294–306. doi:10.1109/ACCESS.2022.3203068. [Google Scholar] [CrossRef]
23. Fouladi S, Safaei AA, Mammone N, Ghaderi F, Ebadi MJ. Efficient deep neural networks for classification of Alzheimer’s disease and mild cognitive impairment from scalp EEG recordings. Cognit Comput. 2022;14(4):1247–68. doi:10.1007/s12559-022-10033-3. [Google Scholar] [CrossRef]
24. Zong Y, Zuo Q, Ng KP, Lei B, Wang S. A new brain network construction paradigm for brain disorder via diffusion-based graph contrastive learning. IEEE Trans Pattern Anal Mach Intell. 2024 Dec;46(12):10389–403. doi:10.1109/TPAMI.2024.3442811. [Google Scholar] [PubMed] [CrossRef]
25. Saleem TJ, Zahra SR, Wu F, Alwakeel A, Alwakeel M, Jeribi F, et al. Deep learning-based diagnosis of Alzheimer’s disease. J Pers Med. 2022;12(5):815. doi:10.3390/jpm12050815. [Google Scholar] [PubMed] [CrossRef]
26. Xue C, Karjadi C, Paschalidis IC, Au R, Kolachalama VB. Detection of dementia on voice recordings using deep learning: a framingham heart study. Alzheimers Res Ther. 2021;13(1):146. doi:10.1186/s13195-021-00888-3. [Google Scholar] [PubMed] [CrossRef]
27. Bertini F, Allevi D, Lutero G, Montesi D, Calzà L. Automatic speech classifier for mild cognitive impairment and early dementia. ACM Trans Comput Healthc. 2022;3(1):1–11. doi:10.1145/3469089. [Google Scholar] [CrossRef]
28. Haider F, de la Fuente S, Luz S. An assessment of paralinguistic acoustic features for detection of Alzheimer’s dementia in spontaneous speech. IEEE J Sel Top Signal Process. 2020;14(2):272–81. doi:10.1109/JSTSP.2019.2955022. [Google Scholar] [CrossRef]
29. Syed ZS, Syed MSS, Lech M, Pirogova E. Automated recognition of Alzheimer’s dementia using bag-of-deep-features and model ensembling. IEEE Access. 2021;9:88377–90. doi:10.1109/ACCESS.2021.3090321. [Google Scholar] [CrossRef]
30. Dashtipour K, Taylor W, Ansari S, Zahid A, Gogate M et al. Detecting Alzheimer’s disease using machine learning methods. In: EAI International Conference on Body Area Networks; 2021; Cham: Springer International Publishing. p. 89–100. doi:10.1007/978-3-030-95593-9. [Google Scholar] [CrossRef]
31. Herzog NJ, Magoulas GD. Brain asymmetry detection and machine learning classification for diagnosis of early dementia. Sensors. 2021;21(3):778. doi:10.3390/s21030778. [Google Scholar] [PubMed] [CrossRef]
32. Lopez-Martin M, Nevado A, Carro B. Detection of early stages of Alzheimer’s disease based on MEG activity with a randomized convolutional neural network. Artif Intell Med. 2020;107(23)101924. doi:10.1016/j.artmed.2020.101924. [Google Scholar] [PubMed] [CrossRef]
33. Liu N, Yuan Z, Tang Q. Improving Alzheimer’s disease detection for speech based on feature purification network. Front Public Health. 2022;9:1821. doi:10.3389/fpubh.2021.835960. [Google Scholar] [PubMed] [CrossRef]
34. Kumar MR, Vekkot S, Lalitha S, Gupta D, Govindraj VJ, Shaukat K, et al. Dementia detection from speech using machine learning and deep learning architectures. Sensors. 2022;22(23):9311. doi:10.3390/s22239311. [Google Scholar] [PubMed] [CrossRef]
35. Praveen P, Srilatha K, Sathvika M, Nishitha E, Nikhil M. Prediction of Alzheimer’s disease using deep learning algorithms. In: 2023 2nd International Conference on Applied Artificial Intelligence and Computing (ICAAIC); 2023; IEEE. p. 587–94. doi:10.1109/ICAAIC56838.2023.10140746. [Google Scholar] [CrossRef]
36. Yiğit A, Işik Z. Applying deep learning models to structural MRI for stage prediction of Alzheimer’s disease. Turkish J Electr Eng Comput Sci. 2020;28(1):196–210. doi:10.3906/elk-1904-172. [Google Scholar] [PubMed] [CrossRef]
37. Zolnoori M, Zolnour A, Topaz M. ADscreen: a speech processing-based screening system for automatic identification of patients with Alzheimer’s disease and related dementia. Artif Intell Med. 2023;143:102624. doi:10.1016/j.artmed.2023.102624. [Google Scholar] [PubMed] [CrossRef]
38. Helaly HA, Badawy M, Haikal AY. Deep learning approach for early detection of Alzheimer’s disease. Cognit Comput. 2022;14(5):1711–27. doi:10.1007/s12559-021-09946-2. [Google Scholar] [PubMed] [CrossRef]
Cite This Article
 Copyright © 2025 The Author(s). Published by Tech Science Press.
This work is licensed under a Creative Commons Attribution 4.0 International License , which permits unrestricted use, distribution, and reproduction in any medium, provided the original work is properly cited.
 Downloads
 Citation Tools